ANNUAL 2016 REPORT - Grieg Group Maturitas is the parent company of the Grieg Group and is owned by...
36
2016 REPORT ANNUAL
Transcript of ANNUAL 2016 REPORT - Grieg Group Maturitas is the parent company of the Grieg Group and is owned by...
2016
REPORTANNUAL
CONTENTS
Directors report
Profit and loss statement
Balance sheet
Cashflow statement
Notes
Auditors report
3
9
10
12
13
32

3 ANNUAL REPORT2016
DIRECTORS’ REPORT 2016 - GRIEG MATURITAS
2016 was a good year for the Grieg Group overall, mainly due to a strong market in the salmon industry and the positive results from Grieg Seafood. Grieg Star is still facing tough markets, while several of the other compa-nies within the Grieg Group delivered good results. Group turnover was NOK 11 bill. and the operating profit NOK 1,3 bill. After write-downs on in-vestments and financials, profit before tax was NOK 870 mill. The Group is well positioned for the future.
Salmon prices were at an all time high in 2016, and the biological situation was much better than for years. Salmon consumption and demand are in-creasing all over the world, and the Grieg Group believes in further growth. Grieg Maturitas owns 50,2% of Grieg Seafood.
In 2016 Grieg Star Group signed a Memorandum of understanding with Gearbulk, to establish a new joint venture, G2 Ocean. This company will operate the combined fleet of the two companies. A larger company will offer a more flexible fleet and improved products to our existing and new customers.
Grieg GroupThe Grieg Group is an international group of companies. Through our flexibility and international culture we gather experience and knowhow globally, which we share within the different companies of the Group, and in the societies in which we operate. The business is based on long-term partnerships, creating value in our various ac-tivities– shipping, shipbroking, maritime services & port operations, seafood, invest-ments and financial advisory services. The head office is located at Grieg-Gaarden, Bergen, Norway, and have offices in 15 countries. Grieg Maturitas AS owns 75% of the shares and the Grieg Foundation the remaining 25%.
The Group parent company - Grieg MaturitasGrieg Maturitas is the parent company of the Grieg Group and is owned by the Grieg family. The company is responsible for organizing and facilitating a good corporate structure and branding, as well as challenging the companies within the Group to develop strategically and profitably in a sustainable manner, and in accordance with Group principles.
Main operating companies
Grieg SeafoodGrieg Seafood Group delivered a historical good pre-tax profit of NOK 1 038 mill. (NGAAP) in 2016, up from a pre-tax loss NOK 38 mill. (NGAAP) in 2015. 2016 turned out to be the best year so far in Grieg Seafood’s history, mainly due to a strong market with high salmon prices. Strong salmon prices are a result of slow growth in the supply of salmon, which in turn is a result of the biological challenges within the industry over the last few years. In 2016, 64 726 tons of Atlantic salmon were harvested, reflecting a minor decrease of 1% compared to 2015. The focus on Atlantic salmon has been a conscious strategy for Grieg Seafood.
Production was at a good level in Norway throughout 2016, but identification of infec-tious salmon anaemia (ISA) in Finnmark in December, caused a loss. In 2016, Shetland
Grieg Group
KEY FIGURES (NOK mill.) 2016 2015
Turnover 10 985 9 520
EBIT 1280 -150
Profit before tax 870 -456
Profit after tax 654 -463
Total assets 16 926 17 213
Equity ratio 45% 42%
Grieg Maturitas
KEY FIGURES (NOK mill.) 2016 2015
Turnover 3 3
EBIT -1 -1
Profit before tax 76 68
Total assets 4 241 4 234
Equity ratio 98% 98%
Grieg Seafood (NGAAP)
KEY FIGURES (NOK mill.) 2016 2015
Turnover 6 598 4 644
EBIT 1160 45
Profit before tax 1038 -38
Total assets 5 788 5 504
Equity ratio 45% 37%
4 ANNUAL REPORT2016
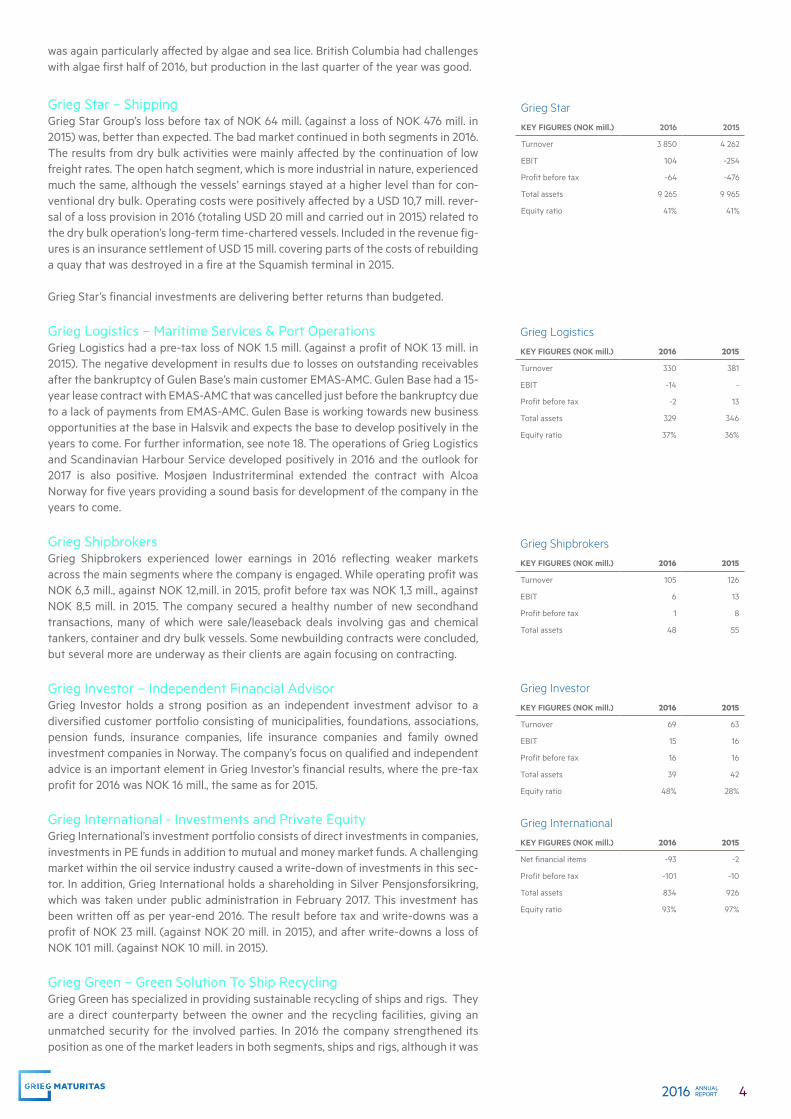
was again particularly affected by algae and sea lice. British Columbia had challenges with algae first half of 2016, but production in the last quarter of the year was good.
Grieg Star – ShippingGrieg Star Group’s loss before tax of NOK 64 mill. (against a loss of NOK 476 mill. in 2015) was, better than expected. The bad market continued in both segments in 2016. The results from dry bulk activities were mainly affected by the continuation of low freight rates. The open hatch segment, which is more industrial in nature, experienced much the same, although the vessels’ earnings stayed at a higher level than for con-ventional dry bulk. Operating costs were positively affected by a USD 10,7 mill. rever-sal of a loss provision in 2016 (totaling USD 20 mill and carried out in 2015) related to the dry bulk operation’s long-term time-chartered vessels. Included in the revenue fig-ures is an insurance settlement of USD 15 mill. covering parts of the costs of rebuilding a quay that was destroyed in a fire at the Squamish terminal in 2015.
Grieg Star’s financial investments are delivering better returns than budgeted.
Grieg Logistics – Maritime Services & Port OperationsGrieg Logistics had a pre-tax loss of NOK 1.5 mill. (against a profit of NOK 13 mill. in 2015). The negative development in results due to losses on outstanding receivables after the bankruptcy of Gulen Base’s main customer EMAS-AMC. Gulen Base had a 15-year lease contract with EMAS-AMC that was cancelled just before the bankruptcy due to a lack of payments from EMAS-AMC. Gulen Base is working towards new business opportunities at the base in Halsvik and expects the base to develop positively in the years to come. For further information, see note 18. The operations of Grieg Logistics and Scandinavian Harbour Service developed positively in 2016 and the outlook for 2017 is also positive. Mosjøen Industriterminal extended the contract with Alcoa Norway for five years providing a sound basis for development of the company in the years to come.
Grieg Shipbrokers Grieg Shipbrokers experienced lower earnings in 2016 reflecting weaker markets across the main segments where the company is engaged. While operating profit was NOK 6,3 mill., against NOK 12,mill. in 2015, profit before tax was NOK 1,3 mill., against NOK 8,5 mill. in 2015. The company secured a healthy number of new secondhand transactions, many of which were sale/leaseback deals involving gas and chemical tankers, container and dry bulk vessels. Some newbuilding contracts were concluded, but several more are underway as their clients are again focusing on contracting.
Grieg Investor – Independent Financial AdvisorGrieg Investor holds a strong position as an independent investment advisor to a diversified customer portfolio consisting of municipalities, foundations, associations, pension funds, insurance companies, life insurance companies and family owned investment companies in Norway. The company’s focus on qualified and independent advice is an important element in Grieg Investor’s financial results, where the pre-tax profit for 2016 was NOK 16 mill., the same as for 2015.
Grieg International - Investments and Private Equity Grieg International’s investment portfolio consists of direct investments in companies, investments in PE funds in addition to mutual and money market funds. A challenging market within the oil service industry caused a write-down of investments in this sec-tor. In addition, Grieg International holds a shareholding in Silver Pensjonsforsikring, which was taken under public administration in February 2017. This investment has been written off as per year-end 2016. The result before tax and write-downs was a profit of NOK 23 mill. (against NOK 20 mill. in 2015), and after write-downs a loss of NOK 101 mill. (against NOK 10 mill. in 2015).
Grieg Green – Green Solution To Ship RecyclingGrieg Green has specialized in providing sustainable recycling of ships and rigs. They are a direct counterparty between the owner and the recycling facilities, giving an unmatched security for the involved parties. In 2016 the company strengthened its position as one of the market leaders in both segments, ships and rigs, although it was
Grieg Investor
KEY FIGURES (NOK mill.) 2016 2015
Turnover 69 63
EBIT 15 16
Profit before tax 16 16
Total assets 39 42
Equity ratio 48% 28%
Grieg International
KEY FIGURES (NOK mill.) 2016 2015
Net financial items -93 -2
Profit before tax -101 -10
Total assets 834 926
Equity ratio 93% 97%
Grieg Logistics
KEY FIGURES (NOK mill.) 2016 2015
Turnover 330 381
EBIT -14 -
Profit before tax -2 13
Total assets 329 346
Equity ratio 37% 36%
Grieg Shipbrokers
KEY FIGURES (NOK mill.) 2016 2015
Turnover 105 126
EBIT 6 13
Profit before tax 1 8
Total assets 48 55
Grieg Star
KEY FIGURES (NOK mill.) 2016 2015
Turnover 3 850 4 262
EBIT 104 -254
Profit before tax -64 -476
Total assets 9 265 9 965
Equity ratio 41% 41%

5 ANNUAL REPORT2016
a weak market. In addition, Grieg Green have had significant growth in supplying an Inventory of Hazardous Materials (IHM) to ship and rig owners. Grieg Green showed a pre-tax profit of NOK 1,1 mill. in 2016, against NOK 5,5 mill. in 2015.
Ryfylke Rensefisk – Green Solution To Sea LiceRyfylke Rensefisk experienced strong growth in 2015 and followed up its production in 2016 with a turnover of NOK 54 mill. (NOK 5 mill. down from 2015). The profit before tax for 2016 was NOK 7 mill. in 2016, down from NOK 23 mill. in 2015. A challenging biological situation at the start of the year, together with a strong focus on devel-opment projects and building up a solid operational organization, increased costs in 2016. However, the company is well positioned for the future and expects a high level of activity and profits in the coming years. Grieg Group owns 60% of the shares in Ryfylke Rensefisk.
Grieg FoundationThe Grieg Group emphasizes social responsibility and contributes actively through Grieg Foundation’s 25% ownership in the Group. Grieg Foundation supports global projects for education of children and youth, medical research and environmental projects, as well as arts and cultural projects. In 2016 Grieg Foundation’s contribution amounts to NOK 30 mill.
Balance sheet, financial situation and cashflow The Grieg Group has a strong financial position. Total current assets amount to NOK 5 995 mill., of which NOK 2 618 mill. is bank deposits, market based financial investments and other current shareholdings. Current liabilities total NOK 2 212 mill., which gives positive working capital of NOK 3 783 mill. Total fixed assets NOK 10 931 mill., of which NOK 6 627 mill. has been financed through loans in financial institutions. Total long-term interest bearing debt is NOK 781 mill. down from 2015. The majority of Grieg Star Group’s loans were refinanced in 2016 in order to safeguard long-term financing and increased liquidity in the Group. As part of this, one open hatch ves-sel was refinanced with a lease arrangement. Grieg Seafood also reduced its interest bearing debt during 2016.
In total, the Group had a positive cash flow of NOK 1 068 mill. from operations. Due to net investments in fixed assets and shares and securities, the net cash flow from investing activities is negative. In addition, the Group had unutilized borrowing facil-ities of NOK 826 mill.
Group book equity stood at NOK 7 640 mill. at year-end, giving an equity ratio of 45%.
Financial risk and risk managementManaging risk is important for value creation and is an integrated part of the Group’s governing model. Given the global activities and different business areas, the companies within the Grieg Group are exposed to different types and degrees of risks ranging from market operations and finance risk to compliance and regulatory frame-work. Thus, we are constantly focusing on how to identify and monitor the risk areas in the Group companies as well as developing strategies to mitigate such risks.
Market riskA large proportion of the Group’s revenues, assets and liabilities are in foreign cur-rencies, mainly USD and EUR. Changes in foreign exchange rates therefore affect the accounts, which are prepared in NOK. The Group companies have strategies and pro-cedures to reduce both the exchange rate and interest rate risks.
Several of the Group’s companies have considerable financial investment portfolios, and changes in the value of international securities and interest rates directly affect their results. The portfolios are managed in accordance with long-term strategies and within defined mandates, also reflecting the Group’s business principles.
Grieg Foundation - distributions
KEY FIGURES (NOK mill.) 2016 2015
Education of children & youth 12 16
Musical art 7 5
Cultural projects 2 1
Medical research and projects 4 4
Other projects 6 6
Total 30 32
Ryfylke Rensefisk
KEY FIGURES (NOK mill.) 2016 2015
Turnover 54 59
EBIT 9 23
Profit before tax 7 23
Total assets 100 60
Equity ratio 32% 43%
Grieg Green
KEY FIGURES (NOK mill.) 2016 2015
Turnover 93 268
EBIT 1 6
Profit before tax 1 6
Total assets 16 13
Equity ratio 49% 52%
6 ANNUAL REPORT2016
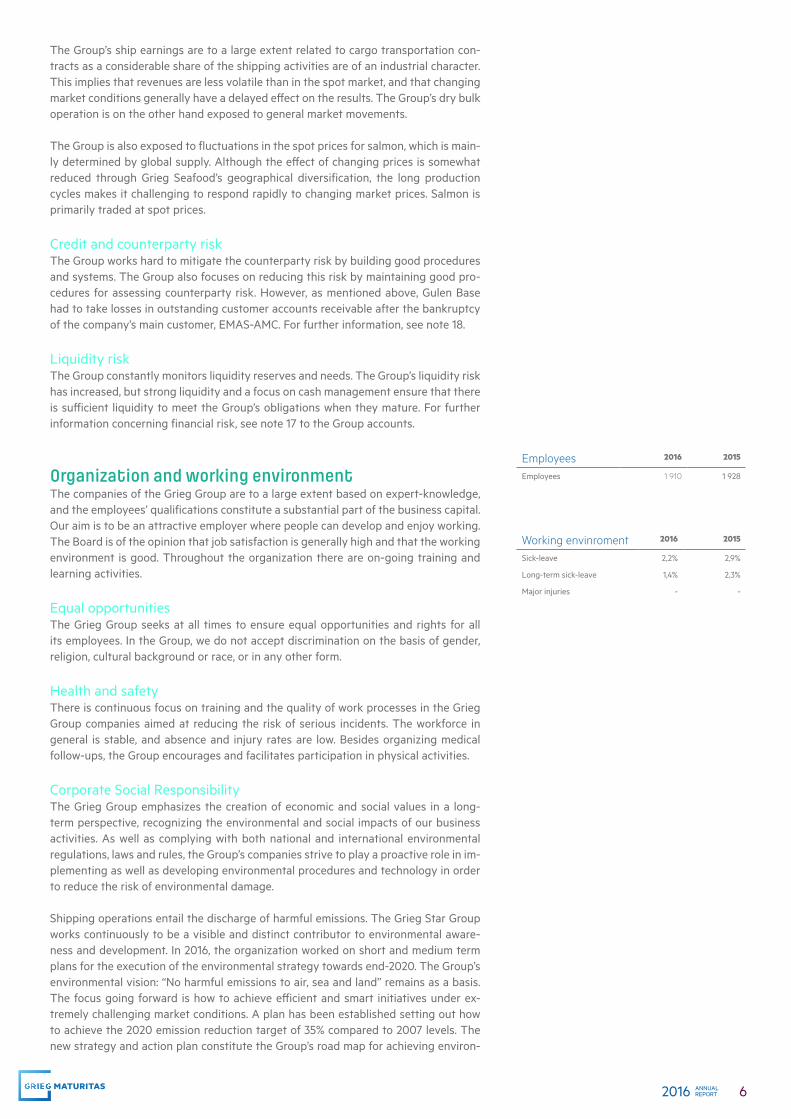
The Group’s ship earnings are to a large extent related to cargo transportation con-tracts as a considerable share of the shipping activities are of an industrial character. This implies that revenues are less volatile than in the spot market, and that changing market conditions generally have a delayed effect on the results. The Group’s dry bulk operation is on the other hand exposed to general market movements.
The Group is also exposed to fluctuations in the spot prices for salmon, which is main-ly determined by global supply. Although the effect of changing prices is somewhat reduced through Grieg Seafood’s geographical diversification, the long production cycles makes it challenging to respond rapidly to changing market prices. Salmon is primarily traded at spot prices.
Credit and counterparty risk The Group works hard to mitigate the counterparty risk by building good procedures and systems. The Group also focuses on reducing this risk by maintaining good pro-cedures for assessing counterparty risk. However, as mentioned above, Gulen Base had to take losses in outstanding customer accounts receivable after the bankruptcy of the company’s main customer, EMAS-AMC. For further information, see note 18.
Liquidity riskThe Group constantly monitors liquidity reserves and needs. The Group’s liquidity risk has increased, but strong liquidity and a focus on cash management ensure that there is sufficient liquidity to meet the Group’s obligations when they mature. For further information concerning financial risk, see note 17 to the Group accounts.
Organization and working environment The companies of the Grieg Group are to a large extent based on expert-knowledge, and the employees’ qualifications constitute a substantial part of the business capital. Our aim is to be an attractive employer where people can develop and enjoy working. The Board is of the opinion that job satisfaction is generally high and that the working environment is good. Throughout the organization there are on-going training and learning activities.
Equal opportunitiesThe Grieg Group seeks at all times to ensure equal opportunities and rights for all its employees. In the Group, we do not accept discrimination on the basis of gender, religion, cultural background or race, or in any other form.
Health and safetyThere is continuous focus on training and the quality of work processes in the Grieg Group companies aimed at reducing the risk of serious incidents. The workforce in general is stable, and absence and injury rates are low. Besides organizing medical follow-ups, the Group encourages and facilitates participation in physical activities.
Corporate Social Responsibility The Grieg Group emphasizes the creation of economic and social values in a long-term perspective, recognizing the environmental and social impacts of our business activities. As well as complying with both national and international environmental regulations, laws and rules, the Group’s companies strive to play a proactive role in im-plementing as well as developing environmental procedures and technology in order to reduce the risk of environmental damage.
Shipping operations entail the discharge of harmful emissions. The Grieg Star Group works continuously to be a visible and distinct contributor to environmental aware-ness and development. In 2016, the organization worked on short and medium term plans for the execution of the environmental strategy towards end-2020. The Group’s environmental vision: “No harmful emissions to air, sea and land” remains as a basis. The focus going forward is how to achieve efficient and smart initiatives under ex-tremely challenging market conditions. A plan has been established setting out how to achieve the 2020 emission reduction target of 35% compared to 2007 levels. The new strategy and action plan constitute the Group’s road map for achieving environ-
Employees 2016 2015
Employees 1 910 1 928
Working envinroment 2016 2015
Sick-leave 2,2% 2,9%
Long-term sick-leave 1,4% 2,3%
Major injuries - -

7 ANNUAL REPORT2016
mental responsibility in the conduct of its business going forward. Grieg Star is com-mitted to the UN Global Compact and transparent reporting on progress.
As demand for seafood continues to grow, intense pressure has been put on the in-dustry in aquaculture to meet this demand in a sustainable manner. The salmon indus-try is currently favoured as a long-term solution to global animal protein shortages, which gives it a competitive advantage compare to other industries. Grieg Seafood’s main cost drivers, risks and opportunities are increasingly connected to managing the impact on the environment. Systematic efforts to secure balanced sustainability are therefore fundamental in order to facilitate long-term profitable growth and are also increasingly becoming a premise for the survival of the industry.
In 2016 Grieg Seafood continued the work on their common sustainability goals through the Global Salmon Initiative (GSI) and has made great progress to improve its impact on society and the local community, ensuring that it produces a healthy and nutritious product in a sustainable way.
The Grieg Group’s head office at Grieg-Gaarden is certified as an eco-lighthouse.
Corporate GovernanceIn order to ensure that the division of responsibility of tasks and roles between the administration, the Board of Directors and the General Meeting is based on sound practice, the Norwegian Recommendation on Corporate Governance is applied. Devi-ation may arise given the fact that the Group is privately owned.
The companies of Grieg Group operate independently, but close cooperation across company borders is encouraged. This contributes to a higher knowledge level and a shared culture. In order to ensure an ethical foundation for its business as well as a solid company culture, we have four common core values; Solid, Proud, Open and Committed. These values define the compass by which we navigate when doing busi-ness across the world.
OutlookThe Grieg Group has a continuous focus on innovation and product development, which we believe is vital for future growth and profitability.
Grieg Seafood aims to bring the cost level down to the industry average or lower, shorten the production time in sea. Shortening of the production time in sea will, in addition to higher production capacity, reduce the biological risk. The company ex-pects to harvest 70 000 tons in 2017, up 8% from 2016. There is still potential for higher utilization of concessions in Norway, which will be one of the focus areas. The company is aiming for production growth of 10% per annum in the period 2017-2020.
For Grieg Star, the outlook going forward is still challenging with modest demand and supply growth expectations. Most likely a longer period will be needed before market fundamentals are in balance, and the oversupply of capacity (i.e. vessels) is reduced. Going into 2017 dry bulk rates are at a historical low level, and there may be several unexpected drivers for additional demand or improved market conditions over the year to come.For 2017, Grieg Star expects a positive trading effect from the establishment of the joint venture pool company G2 Ocean together with Gearbulk. This restructuring combined with general cost cutting efforts and optimization of fleet operations, should drive improved earnings for Grieg Star from conventional bulk and open hatch operations. Grieg Star has a long-term commitment to its shipping operations, and is set on taking advantage of improved market conditions going forward and possible opportunities that may arise.
Grieg Shipbrokers have an overall positive outlook for 2017. The sentiment amongst their clients is generally positive and they expect activity to pick up within their cho-sen segments, both as regards the secondhand and contracting markets.

8 ANNUAL REPORT2016
In the past years, Grieg Logistics Group has focused on digital development through Seamless AS. At the start of 2017 Grieg Logistics made a further investment in dig-italization through the purchase of a 51% shareholding in Shiplog AS. By combining the products of Shiplog and Seamless, Grieg Logistics Group aim to become a leading provider of software for ports, terminals, bases and vessels in the future, in addition to developing their core products as agents and maritime service operators. Grieg Investor believes that the increased focus on competent and independent fi-nancial and advisory services in addition to the new digital customer portfolio system Enigma, will make a positive contribution to further growth in the client base and revenues, as well as profits in the period ahead.
Although the Grieg Group is exposed to volatility and uncertainty in our main markets, shipping and seafood, we see signs of increasing shipping rates and we believe that we can look forward to strong seafood markets. The Group is well positioned for the future, with a strong balance sheet, a good liquidity and a competent and innovative organization.
Going concernThe Board of Directors confirms that the annual accounts have been prepared on a going concern basis and that this assumption is valid, based on the Group’s solid financial position and expectations of future profits. The Board believes that the sub-mitted annual accounts give a correct picture of the result, cash flow and economic situation. No events have taken place after the balance sheet date that could materi-ally affect the accounts.
The employees’ daily contribution to the Grieg Group has an impact beyond our financial results. The Board of Directors would like to thank all employees for their untiring efforts throughout the year.
Bergen, 4th of April 2017 The Board of Directors of Grieg Maturitas AS
Elna-Kathrine Grieg Chair
Per Grieg jr. Board Member
Elisabeth Grieg Board Member
Camilla Grieg Board Member
Stig Grimsgaard Andersen Board Member
Wenche Kjølås Managing Director

9 ANNUAL REPORT2016
PROFIT AND LOSS STATEMENT
GRIEG MATURITAS AS GRIEG GROUP(Amounts in NOK 1000) (Amounts in NOK 1000)
2015 2016 Note 2016 2015
3 037 3 421 2 Operating Revenue 10 984 508 9 519 717
Operating Costs-3 404 -3 340 4 Payroll and social security costs -952 515 -904 918
- - Profit (loss) sale of tangible assets -4 470 -
- - 6,7 Depreciation -560 550 -539 879
- - 6 Reversal (write-down) fixed assets 6 033 -205 847
- - 3 Operating costs - shipping -2 974 948 -3 583 352
- - 3 Cost of sales - fish farming -3 327 298 -2 752 235
-723 -916 3,23 Other operating expenses -1 890 355 -1 683 800
-4 128 -4 256 Total operating expenses -9 704 105 -9 670 031
-1 090 -835 2 Operating profit - EBIT 1 280 403 -150 314
Financial items67 500 74 525 8 Income from investments in subsidiaries - -
1 818 1 216 10 Financial income 89 940 87 749
- - Change in value of market based assets 22 441 -37 453
- - 9 Results of investments in associated companies 12 637 11 921
-5 1 10 Financial expenses -535 845 -367 476
69 313 75 741 2 Net financial items -410 827 -305 258
68 222 74 906 2 Profit before tax 869 576 -455 572
-199 -107 19 Tax -215 705 -7 310
68 023 74 799 20 Profit for the year 653 871 -462 882
To minority interests 484 871 -84 409
Majority proportion 169 000 -378 473
67 500 74 525 Proposed dividend
523 274 Transferred to/(from) other equity
10 ANNUAL REPORT2016
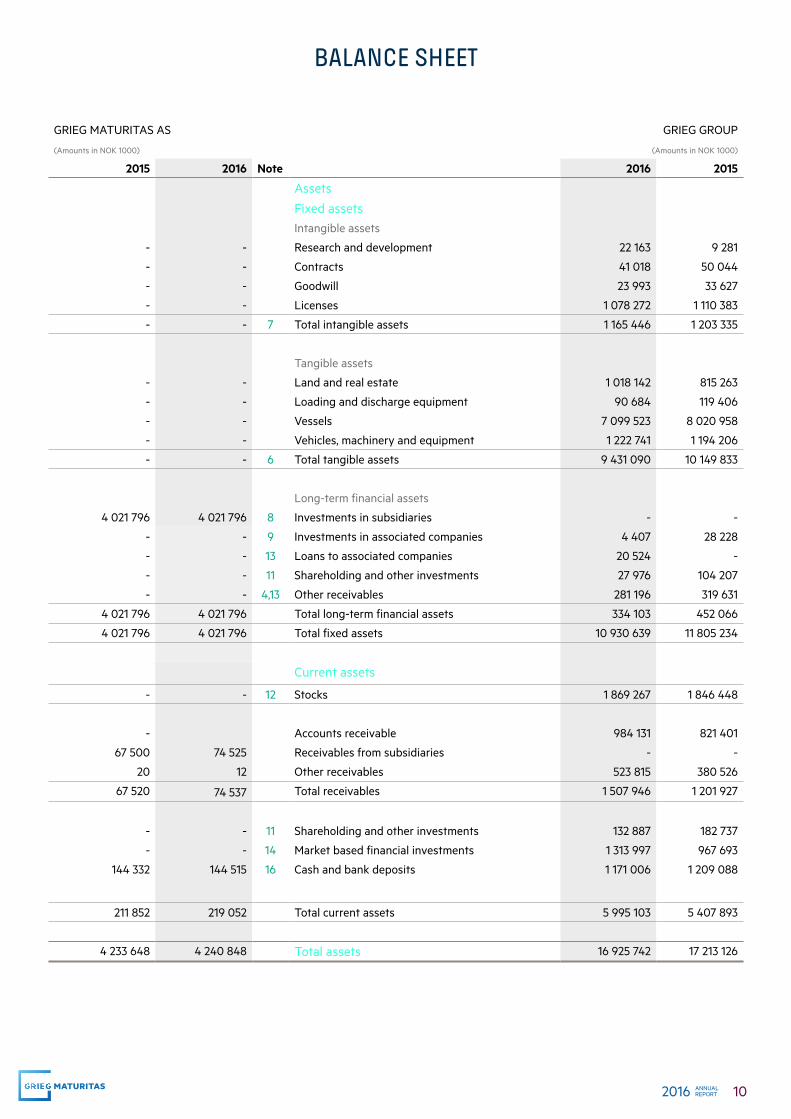
BALANCE SHEET
GRIEG MATURITAS AS GRIEG GROUP
(Amounts in NOK 1000) (Amounts in NOK 1000)
2015 2016 Note 2016 2015
Assets
Fixed assetsIntangible assets
- - Research and development 22 163 9 281
- - Contracts 41 018 50 044
- - Goodwill 23 993 33 627
- - Licenses 1 078 272 1 110 383
- - 7 Total intangible assets 1 165 446 1 203 335
Tangible assets
- - Land and real estate 1 018 142 815 263
- - Loading and discharge equipment 90 684 119 406
- - Vessels 7 099 523 8 020 958
- - Vehicles, machinery and equipment 1 222 741 1 194 206
- - 6 Total tangible assets 9 431 090 10 149 833
Long-term financial assets
4 021 796 4 021 796 8 Investments in subsidiaries - -
- - 9 Investments in associated companies 4 407 28 228
- - 13 Loans to associated companies 20 524 -
- - 11 Shareholding and other investments 27 976 104 207
- - 4,13 Other receivables 281 196 319 631
4 021 796 4 021 796 Total long-term financial assets 334 103 452 066
4 021 796 4 021 796 Total fixed assets 10 930 639 11 805 234
Current assets
- - 12 Stocks 1 869 267 1 846 448
- Accounts receivable 984 131 821 401
67 500 74 525 Receivables from subsidiaries - -
20 12 Other receivables 523 815 380 526
67 520 74 537 Total receivables 1 507 946 1 201 927
- - 11 Shareholding and other investments 132 887 182 737
- - 14 Market based financial investments 1 313 997 967 693
144 332 144 515 16 Cash and bank deposits 1 171 006 1 209 088
211 852 219 052 Total current assets 5 995 103 5 407 893
4 233 648 4 240 848 Total assets 16 925 742 17 213 126

11 ANNUAL REPORT2016
BALANCE SHEET
GRIEG MATURITAS AS GRIEG GROUP(Amounts in NOK 1 000) (Amounts in NOK 1000)
2015 2016 Note 2016 2015
Equity and liabilities
Equity Paid-up equity
1 124 1 124 21 Share capital (1 123 530 shares of NOK 1 ) 1 124 1 124
702 263 702 263 Share premium 702 263 702 263
703 387 703 387 Total 703 387 703 387
Retained earnings
3 461 552 3 461 825 Other equity/group reserves 4 111 162 3 878 449
- - Minority interests 2 824 977 2 688 850
3 461 552 3 461 825 Total retained earnings 6 936 139 6 567 299
4 164 939 4 165 212 20 Total equity 7 639 526 7 270 686
LiabilitiesProvisions
- - 5 Pension liabilities 74 610 76 683
36 28 19 Deferred tax 360 019 286 231
- - Other provisions 12 424 5 590
36 28 Total provisions 447 053 368 503
Other long-term liabilities
- - 15,16 Liabilities to financial institutions 6 623 751 7 406 728
- - 15,16 Other long-term liabilities 3 329 1 350
- - Total long-term liabilities 6 627 080 7 408 078
Current liabilities
- - 15,16 Bank overdrafts 512 535 338 231
46 25 Accounts payable 612 075 789 851
- 22 Accounts payable group companies - -
212 115 19 Taxes payable 177 956 44 062
270 271 Public duties payable 91 239 61 188
67 500 74 525 20 Dividend 103 016 104 744
645 650 Other current liabilities 715 262 827 784
68 673 75 608 Total current liabilities 2 212 084 2 165 860
68 672 75 636 Total liabilities 9 286 216 9 942 440
4 233 648 4 240 848 Total equity and liabilities 16 925 742 17 213 126
Bergen, 4th of April 2017 The Board of Directors of Grieg Maturitas AS
Elna-Kathrine Grieg Chair
Per Grieg jr. Board Member
Elisabeth Grieg Board Member
Camilla Grieg Board Member
Stig Grimsgaard Andersen Board Member
Wenche Kjølås Managing Director
12 ANNUAL REPORT2016
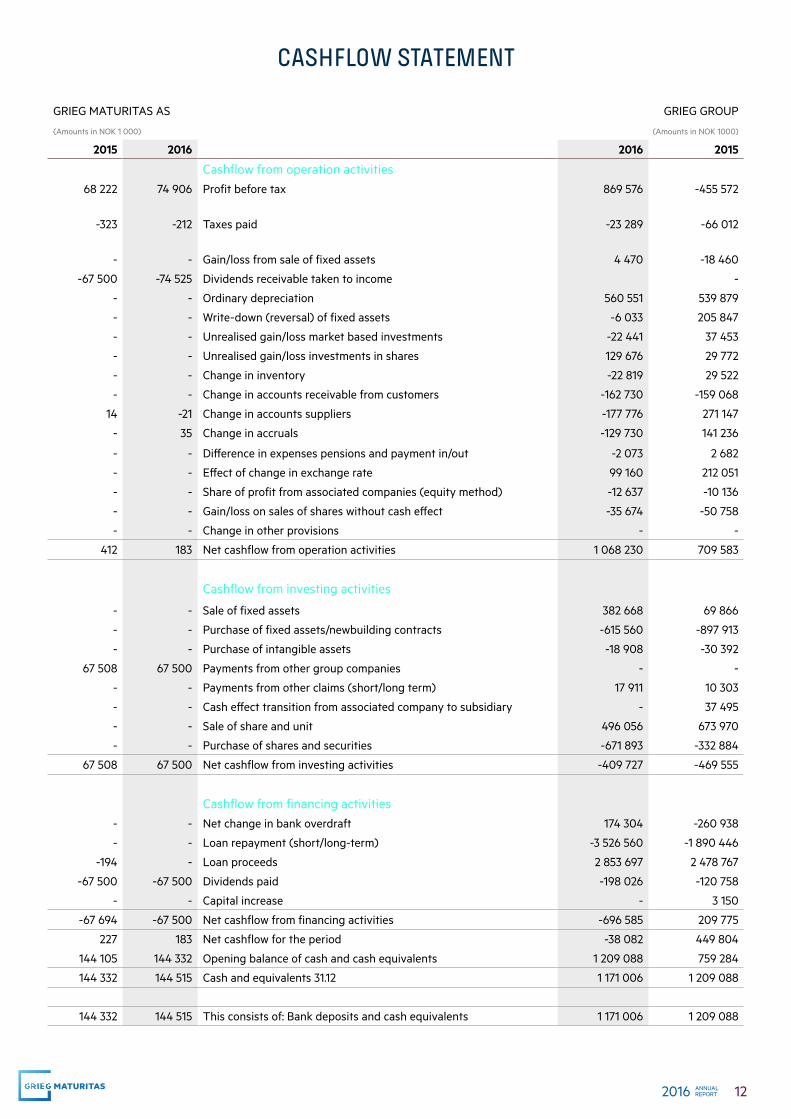
CASHFLOW STATEMENT
GRIEG MATURITAS AS GRIEG GROUP
(Amounts in NOK 1 000) (Amounts in NOK 1000)
2015 2016 2016 2015
Cashflow from operation activities 68 222 74 906 Profit before tax 869 576 -455 572
-323 -212 Taxes paid -23 289 -66 012
- - Gain/loss from sale of fixed assets 4 470 -18 460
-67 500 -74 525 Dividends receivable taken to income -
- - Ordinary depreciation 560 551 539 879
- - Write-down (reversal) of fixed assets -6 033 205 847
- - Unrealised gain/loss market based investments -22 441 37 453
- - Unrealised gain/loss investments in shares 129 676 29 772
- - Change in inventory -22 819 29 522
- - Change in accounts receivable from customers -162 730 -159 068
14 -21 Change in accounts suppliers -177 776 271 147
- 35 Change in accruals -129 730 141 236
- - Difference in expenses pensions and payment in/out -2 073 2 682
- - Effect of change in exchange rate 99 160 212 051
- - Share of profit from associated companies (equity method) -12 637 -10 136
- - Gain/loss on sales of shares without cash effect -35 674 -50 758
- - Change in other provisions - -
412 183 Net cashflow from operation activities 1 068 230 709 583
Cashflow from investing activities
- - Sale of fixed assets 382 668 69 866
- - Purchase of fixed assets/newbuilding contracts -615 560 -897 913
- - Purchase of intangible assets -18 908 -30 392
67 508 67 500 Payments from other group companies - -
- - Payments from other claims (short/long term) 17 911 10 303
- - Cash effect transition from associated company to subsidiary - 37 495
- - Sale of share and unit 496 056 673 970
- - Purchase of shares and securities -671 893 -332 884
67 508 67 500 Net cashflow from investing activities -409 727 -469 555
Cashflow from financing activities- - Net change in bank overdraft 174 304 -260 938
- - Loan repayment (short/long-term) -3 526 560 -1 890 446
-194 - Loan proceeds 2 853 697 2 478 767
-67 500 -67 500 Dividends paid -198 026 -120 758
- - Capital increase - 3 150
-67 694 -67 500 Net cashflow from financing activities -696 585 209 775
227 183 Net cashflow for the period -38 082 449 804
144 105 144 332 Opening balance of cash and cash equivalents 1 209 088 759 284
144 332 144 515 Cash and equivalents 31.12 1 171 006 1 209 088
144 332 144 515 This consists of: Bank deposits and cash equivalents 1 171 006 1 209 088

13 ANNUAL REPORT2016
NOTES
NOTE 1 Accounting principles 14
NOTE 2 Segment information 16
NOTE 3 Other operating expenses 16
NOTE 4 Payroll costs, number of employees, remuneration etc. 17
NOTE 5 Pensions and pension commitments 18
NOTE 6 Fixed assets 19
NOTE 7 Intangible assets 20
NOTE 8 Investments in subsidiaries 20
NOTE 9 Investments in associated companies 23
NOTE 10 Financial items 23
NOTE 11 Shareholdings and other investments 24
NOTE 12 Stock and bunkers 25
NOTE 13 Receivables due in more than one year 25
NOTE 14 Market based financial investments 25
NOTE 15 Debt payable after 5 year 25
NOTE 16 Mortgages/guarantee liability/restricted funds 26
NOTE 17 Financial risk 27
NOTE 18 Contingencies and subsequent events 28
NOTE 19 Taxes 28
NOTE 20 Equity 30
NOTE 21 Share capital and share information 30
NOTE 22 Related parties 31
NOTE 23 Remuneration to auditor 31
14 ANNUAL REPORT2016
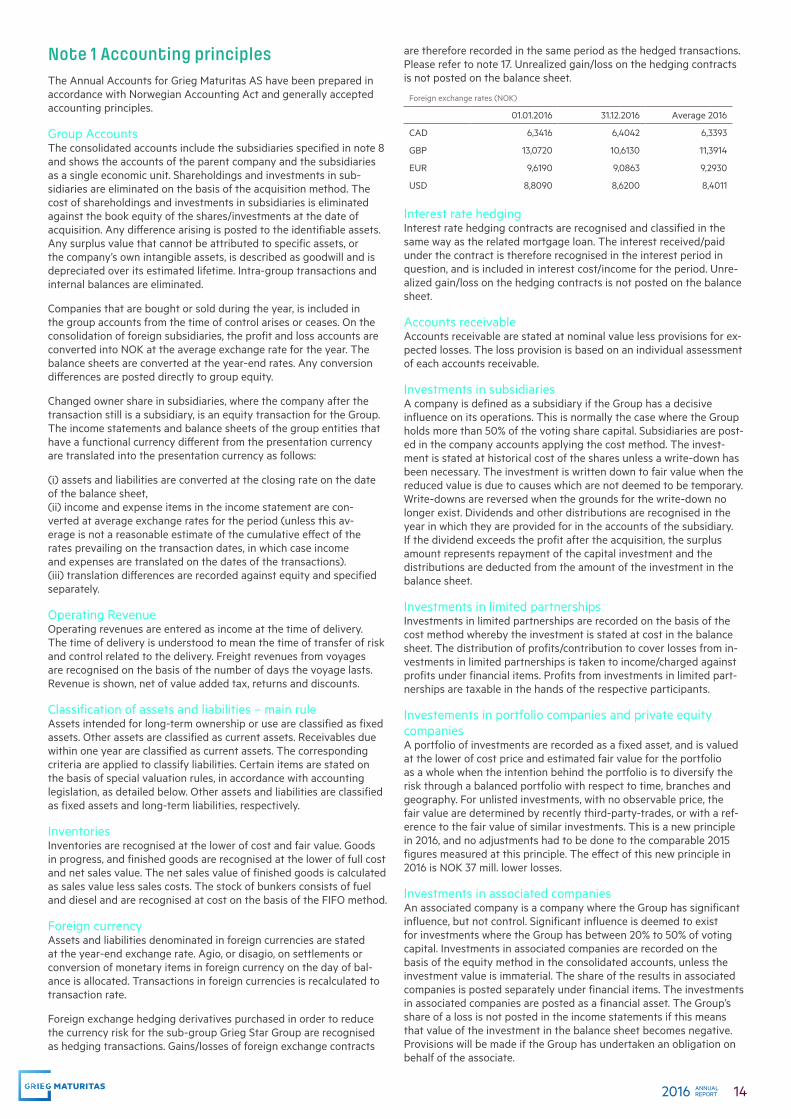
Note 1 Accounting principlesThe Annual Accounts for Grieg Maturitas AS have been prepared in accordance with Norwegian Accounting Act and generally accepted accounting principles.
Group AccountsThe consolidated accounts include the subsidiaries specified in note 8 and shows the accounts of the parent company and the subsidiaries as a single economic unit. Shareholdings and investments in sub-sidiaries are eliminated on the basis of the acquisition method. The cost of shareholdings and investments in subsidiaries is eliminated against the book equity of the shares/investments at the date of acquisition. Any difference arising is posted to the identifiable assets. Any surplus value that cannot be attributed to specific assets, or the company’s own intangible assets, is described as goodwill and is depreciated over its estimated lifetime. Intra-group transactions and internal balances are eliminated.
Companies that are bought or sold during the year, is included in the group accounts from the time of control arises or ceases. On the consolidation of foreign subsidiaries, the profit and loss accounts are converted into NOK at the average exchange rate for the year. The balance sheets are converted at the year-end rates. Any conversion differences are posted directly to group equity.
Changed owner share in subsidiaries, where the company after the transaction still is a subsidiary, is an equity transaction for the Group.The income statements and balance sheets of the group entities that have a functional currency different from the presentation currency are translated into the presentation currency as follows:
(i) assets and liabilities are converted at the closing rate on the date of the balance sheet, (ii) income and expense items in the income statement are con-verted at average exchange rates for the period (unless this av-erage is not a reasonable estimate of the cumulative effect of the rates prevailing on the transaction dates, in which case income and expenses are translated on the dates of the transactions). (iii) translation differences are recorded against equity and specified separately.
Operating RevenueOperating revenues are entered as income at the time of delivery. The time of delivery is understood to mean the time of transfer of risk and control related to the delivery. Freight revenues from voyages are recognised on the basis of the number of days the voyage lasts. Revenue is shown, net of value added tax, returns and discounts.
Classification of assets and liabilities – main ruleAssets intended for long-term ownership or use are classified as fixed assets. Other assets are classified as current assets. Receivables due within one year are classified as current assets. The corresponding criteria are applied to classify liabilities. Certain items are stated on the basis of special valuation rules, in accordance with accounting legislation, as detailed below. Other assets and liabilities are classified as fixed assets and long-term liabilities, respectively.
InventoriesInventories are recognised at the lower of cost and fair value. Goods in progress, and finished goods are recognised at the lower of full cost and net sales value. The net sales value of finished goods is calculated as sales value less sales costs. The stock of bunkers consists of fuel and diesel and are recognised at cost on the basis of the FIFO method.
Foreign currencyAssets and liabilities denominated in foreign currencies are stated at the year-end exchange rate. Agio, or disagio, on settlements or conversion of monetary items in foreign currency on the day of bal-ance is allocated. Transactions in foreign currencies is recalculated to transaction rate.
Foreign exchange hedging derivatives purchased in order to reduce the currency risk for the sub-group Grieg Star Group are recognised as hedging transactions. Gains/losses of foreign exchange contracts
are therefore recorded in the same period as the hedged transactions. Please refer to note 17. Unrealized gain/loss on the hedging contracts is not posted on the balance sheet.
Foreign exchange rates (NOK)
01.01.2016 31.12.2016 Average 2016
CAD 6,3416 6,4042 6,3393
GBP 13,0720 10,6130 11,3914
EUR 9,6190 9,0863 9,2930
USD 8,8090 8,6200 8,4011 Interest rate hedging Interest rate hedging contracts are recognised and classified in the same way as the related mortgage loan. The interest received/paid under the contract is therefore recognised in the interest period in question, and is included in interest cost/income for the period. Unre-alized gain/loss on the hedging contracts is not posted on the balance sheet.
Accounts receivableAccounts receivable are stated at nominal value less provisions for ex-pected losses. The loss provision is based on an individual assessment of each accounts receivable.
Investments in subsidiariesA company is defined as a subsidiary if the Group has a decisive influence on its operations. This is normally the case where the Group holds more than 50% of the voting share capital. Subsidiaries are post-ed in the company accounts applying the cost method. The invest-ment is stated at historical cost of the shares unless a write-down has been necessary. The investment is written down to fair value when the reduced value is due to causes which are not deemed to be temporary. Write-downs are reversed when the grounds for the write-down no longer exist. Dividends and other distributions are recognised in the year in which they are provided for in the accounts of the subsidiary. If the dividend exceeds the profit after the acquisition, the surplus amount represents repayment of the capital investment and the distributions are deducted from the amount of the investment in the balance sheet.
Investments in limited partnershipsInvestments in limited partnerships are recorded on the basis of the cost method whereby the investment is stated at cost in the balance sheet. The distribution of profits/contribution to cover losses from in-vestments in limited partnerships is taken to income/charged against profits under financial items. Profits from investments in limited part-nerships are taxable in the hands of the respective participants.
Investements in portfolio companies and private equity companiesA portfolio of investments are recorded as a fixed asset, and is valued at the lower of cost price and estimated fair value for the portfolio as a whole when the intention behind the portfolio is to diversify the risk through a balanced portfolio with respect to time, branches and geography. For unlisted investments, with no observable price, the fair value are determined by recently third-party-trades, or with a ref-erence to the fair value of similar investments. This is a new principle in 2016, and no adjustments had to be done to the comparable 2015 figures measured at this principle. The effect of this new principle in 2016 is NOK 37 mill. lower losses.
Investments in associated companiesAn associated company is a company where the Group has significant influence, but not control. Significant influence is deemed to exist for investments where the Group has between 20% to 50% of voting capital. Investments in associated companies are recorded on the basis of the equity method in the consolidated accounts, unless the investment value is immaterial. The share of the results in associated companies is posted separately under financial items. The investments in associated companies are posted as a financial asset. The Group’s share of a loss is not posted in the income statements if this means that value of the investment in the balance sheet becomes negative. Provisions will be made if the Group has undertaken an obligation on behalf of the associate.
15 ANNUAL REPORT2016
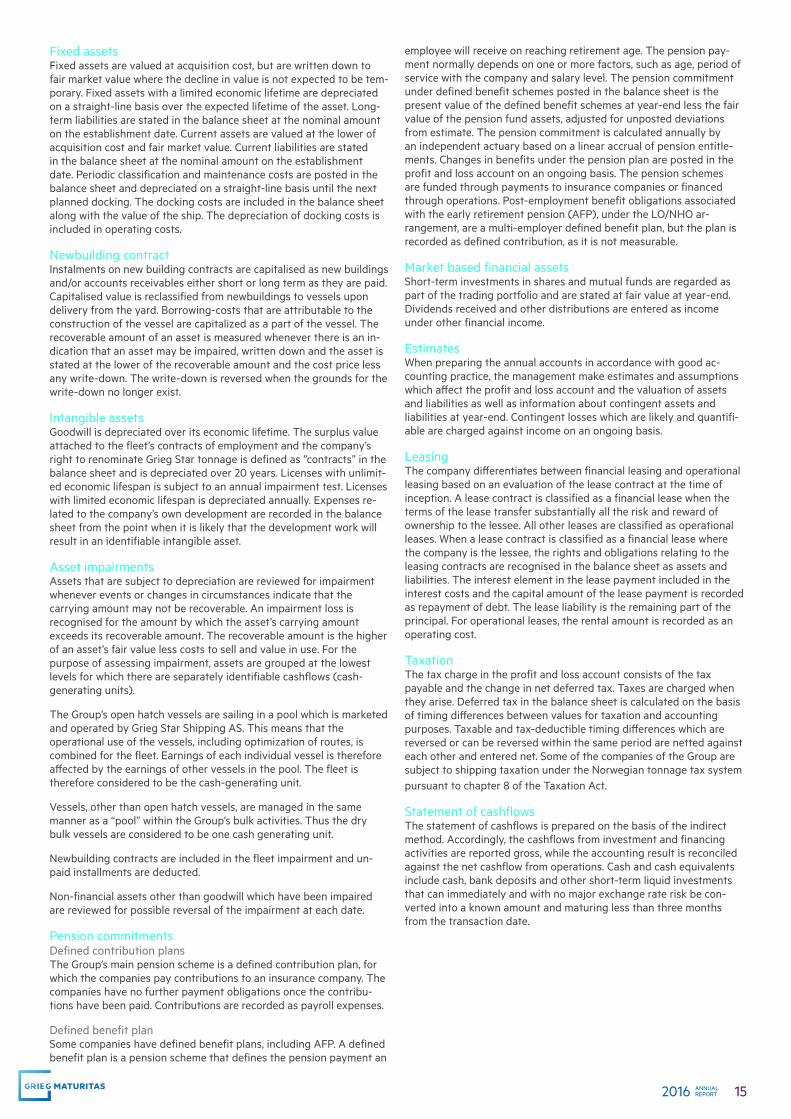
Fixed assetsFixed assets are valued at acquisition cost, but are written down to fair market value where the decline in value is not expected to be tem-porary. Fixed assets with a limited economic lifetime are depreciated on a straight-line basis over the expected lifetime of the asset. Long-term liabilities are stated in the balance sheet at the nominal amount on the establishment date. Current assets are valued at the lower of acquisition cost and fair market value. Current liabilities are stated in the balance sheet at the nominal amount on the establishment date. Periodic classification and maintenance costs are posted in the balance sheet and depreciated on a straight-line basis until the next planned docking. The docking costs are included in the balance sheet along with the value of the ship. The depreciation of docking costs is included in operating costs.
Newbuilding contractInstalments on new building contracts are capitalised as new buildings and/or accounts receivables either short or long term as they are paid. Capitalised value is reclassified from newbuildings to vessels upon delivery from the yard. Borrowing-costs that are attributable to the construction of the vessel are capitalized as a part of the vessel. The recoverable amount of an asset is measured whenever there is an in-dication that an asset may be impaired, written down and the asset is stated at the lower of the recoverable amount and the cost price less any write-down. The write-down is reversed when the grounds for the write-down no longer exist.
Intangible assetsGoodwill is depreciated over its economic lifetime. The surplus value attached to the fleet’s contracts of employment and the company’s right to renominate Grieg Star tonnage is defined as ”contracts” in the balance sheet and is depreciated over 20 years. Licenses with unlimit-ed economic lifespan is subject to an annual impairment test. Licenses with limited economic lifespan is depreciated annually. Expenses re-lated to the company’s own development are recorded in the balance sheet from the point when it is likely that the development work will result in an identifiable intangible asset.
Asset impairmentsAssets that are subject to depreciation are reviewed for impairment whenever events or changes in circumstances indicate that the carrying amount may not be recoverable. An impairment loss is recognised for the amount by which the asset’s carrying amount exceeds its recoverable amount. The recoverable amount is the higher of an asset’s fair value less costs to sell and value in use. For the purpose of assessing impairment, assets are grouped at the lowest levels for which there are separately identifiable cashflows (cash-generating units).
The Group’s open hatch vessels are sailing in a pool which is marketed and operated by Grieg Star Shipping AS. This means that the operational use of the vessels, including optimization of routes, is combined for the fleet. Earnings of each individual vessel is therefore affected by the earnings of other vessels in the pool. The fleet is therefore considered to be the cash-generating unit.
Vessels, other than open hatch vessels, are managed in the same manner as a “pool” within the Group’s bulk activities. Thus the dry bulk vessels are considered to be one cash generating unit.
Newbuilding contracts are included in the fleet impairment and un-paid installments are deducted.
Non-financial assets other than goodwill which have been impaired are reviewed for possible reversal of the impairment at each date.
Pension commitments Defined contribution plansThe Group’s main pension scheme is a defined contribution plan, for which the companies pay contributions to an insurance company. The companies have no further payment obligations once the contribu-tions have been paid. Contributions are recorded as payroll expenses.
Defined benefit planSome companies have defined benefit plans, including AFP. A defined benefit plan is a pension scheme that defines the pension payment an
employee will receive on reaching retirement age. The pension pay-ment normally depends on one or more factors, such as age, period of service with the company and salary level. The pension commitment under defined benefit schemes posted in the balance sheet is the present value of the defined benefit schemes at year-end less the fair value of the pension fund assets, adjusted for unposted deviations from estimate. The pension commitment is calculated annually by an independent actuary based on a linear accrual of pension entitle-ments. Changes in benefits under the pension plan are posted in the profit and loss account on an ongoing basis. The pension schemes are funded through payments to insurance companies or financed through operations. Post-employment benefit obligations associated with the early retirement pension (AFP), under the LO/NHO ar-rangement, are a multi-employer defined benefit plan, but the plan is recorded as defined contribution, as it is not measurable.
Market based financial assetsShort-term investments in shares and mutual funds are regarded as part of the trading portfolio and are stated at fair value at year-end. Dividends received and other distributions are entered as income under other financial income.
EstimatesWhen preparing the annual accounts in accordance with good ac-counting practice, the management make estimates and assumptions which affect the profit and loss account and the valuation of assets and liabilities as well as information about contingent assets and liabilities at year-end. Contingent losses which are likely and quantifi-able are charged against income on an ongoing basis.
LeasingThe company differentiates between financial leasing and operational leasing based on an evaluation of the lease contract at the time of inception. A lease contract is classified as a financial lease when the terms of the lease transfer substantially all the risk and reward of ownership to the lessee. All other leases are classified as operational leases. When a lease contract is classified as a financial lease where the company is the lessee, the rights and obligations relating to the leasing contracts are recognised in the balance sheet as assets and liabilities. The interest element in the lease payment included in the interest costs and the capital amount of the lease payment is recorded as repayment of debt. The lease liability is the remaining part of the principal. For operational leases, the rental amount is recorded as an operating cost.
TaxationThe tax charge in the profit and loss account consists of the tax payable and the change in net deferred tax. Taxes are charged when they arise. Deferred tax in the balance sheet is calculated on the basis of timing differences between values for taxation and accounting purposes. Taxable and tax-deductible timing differences which are reversed or can be reversed within the same period are netted against each other and entered net. Some of the companies of the Group are subject to shipping taxation under the Norwegian tonnage tax system pursuant to chapter 8 of the Taxation Act.
Statement of cashflowsThe statement of cashflows is prepared on the basis of the indirect method. Accordingly, the cashflows from investment and financing activities are reported gross, while the accounting result is reconciled against the net cashflow from operations. Cash and cash equivalents include cash, bank deposits and other short-term liquid investments that can immediately and with no major exchange rate risk be con-verted into a known amount and maturing less than three months from the transaction date.
16 ANNUAL REPORT2016
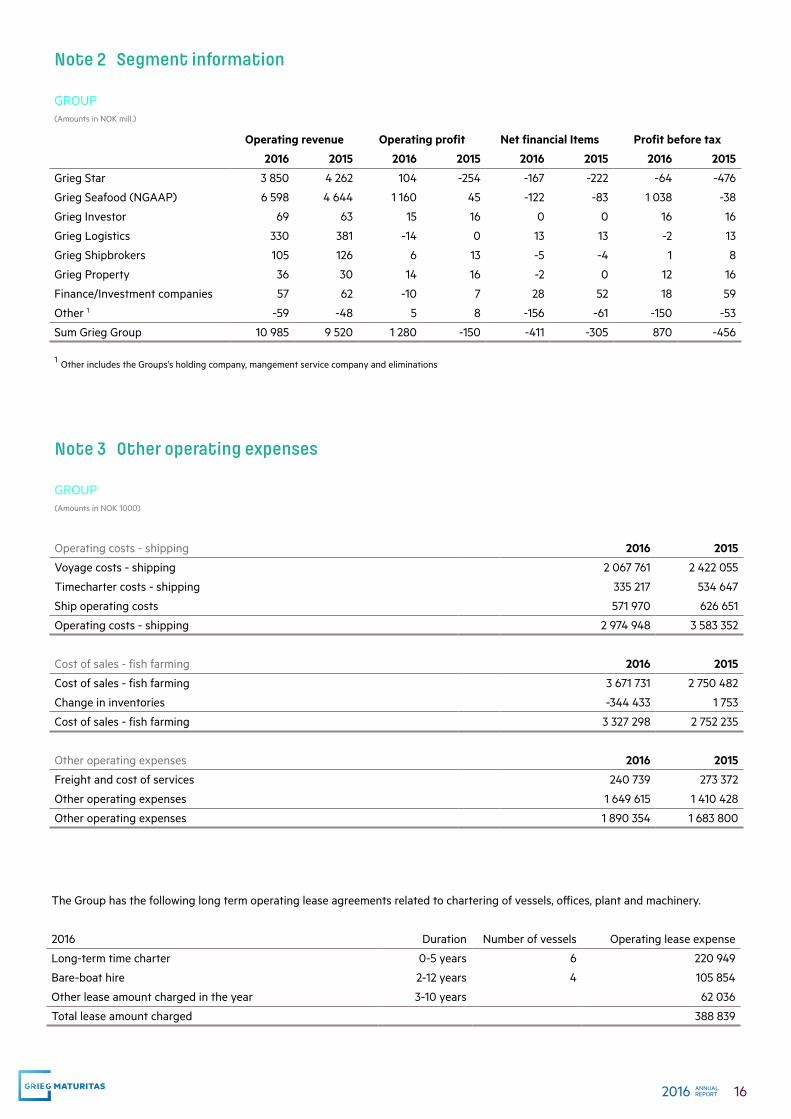
Note 2 Segment information
GROUP(Amounts in NOK mill.)
Operating revenue Operating profit Net financial Items Profit before tax
2016 2015 2016 2015 2016 2015 2016 2015
Grieg Star 3 850 4 262 104 -254 -167 -222 -64 -476
Grieg Seafood (NGAAP) 6 598 4 644 1 160 45 -122 -83 1 038 -38
Grieg Investor 69 63 15 16 0 0 16 16
Grieg Logistics 330 381 -14 0 13 13 -2 13
Grieg Shipbrokers 105 126 6 13 -5 -4 1 8
Grieg Property 36 30 14 16 -2 0 12 16
Finance/Investment companies 57 62 -10 7 28 52 18 59
Other 1 -59 -48 5 8 -156 -61 -150 -53
Sum Grieg Group 10 985 9 520 1 280 -150 -411 -305 870 -456
1 Other includes the Groups’s holding company, mangement service company and eliminations
Note 3 Other operating expenses
GROUP(Amounts in NOK 1000)
Operating costs - shipping 2016 2015
Voyage costs - shipping 2 067 761 2 422 055
Timecharter costs - shipping 335 217 534 647
Ship operating costs 571 970 626 651
Operating costs - shipping 2 974 948 3 583 352
Cost of sales - fish farming 2016 2015
Cost of sales - fish farming 3 671 731 2 750 482
Change in inventories -344 433 1 753
Cost of sales - fish farming 3 327 298 2 752 235
Other operating expenses 2016 2015
Freight and cost of services 240 739 273 372
Other operating expenses 1 649 615 1 410 428
Other operating expenses 1 890 354 1 683 800
The Group has the following long term operating lease agreements related to chartering of vessels, offices, plant and machinery.
2016 Duration Number of vessels Operating lease expense
Long-term time charter 0-5 years 6 220 949
Bare-boat hire 2-12 years 4 105 854
Other lease amount charged in the year 3-10 years 62 036
Total lease amount charged 388 839
17 ANNUAL REPORT2016
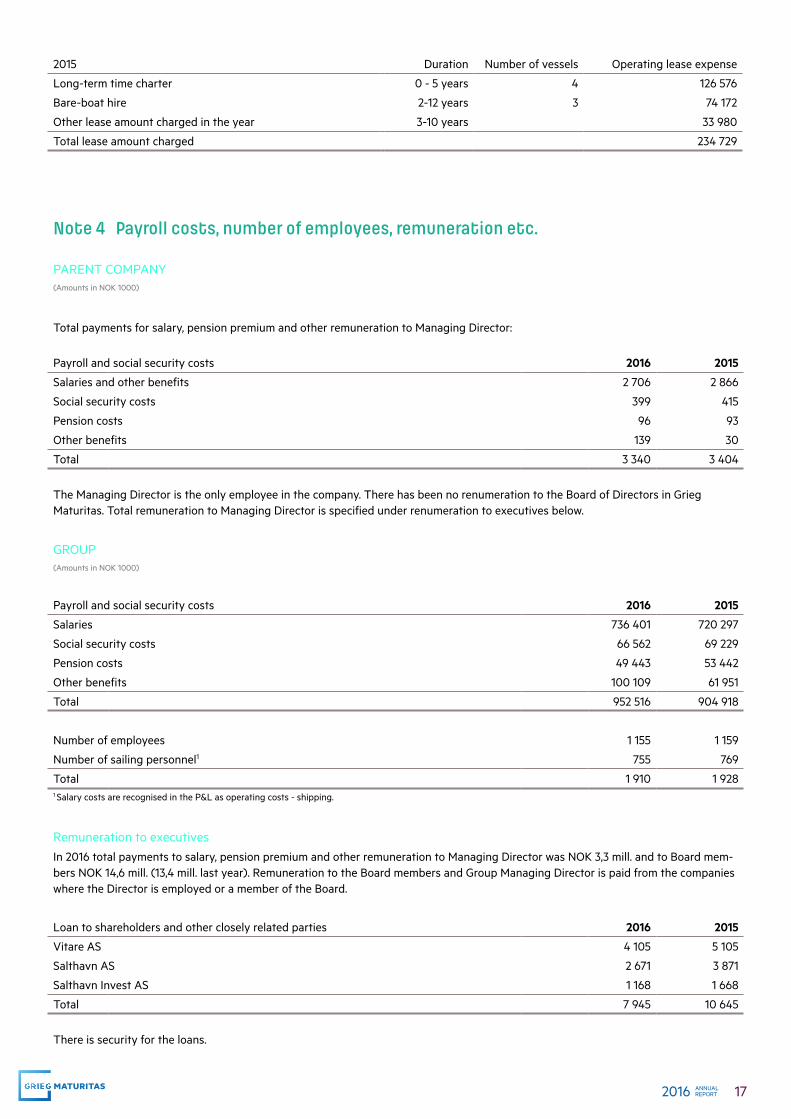
Note 4 Payroll costs, number of employees, remuneration etc.
PARENT COMPANY(Amounts in NOK 1000)
Total payments for salary, pension premium and other remuneration to Managing Director:
Payroll and social security costs 2016 2015
Salaries and other benefits 2 706 2 866
Social security costs 399 415
Pension costs 96 93
Other benefits 139 30
Total 3 340 3 404
The Managing Director is the only employee in the company. There has been no renumeration to the Board of Directors in Grieg Maturitas. Total remuneration to Managing Director is specified under renumeration to executives below.
GROUP(Amounts in NOK 1000)
Payroll and social security costs 2016 2015
Salaries 736 401 720 297
Social security costs 66 562 69 229
Pension costs 49 443 53 442
Other benefits 100 109 61 951
Total 952 516 904 918
Number of employees 1 155 1 159
Number of sailing personnel1 755 769
Total 1 910 1 9281 Salary costs are recognised in the P&L as operating costs - shipping.
Remuneration to executivesIn 2016 total payments to salary, pension premium and other remuneration to Managing Director was NOK 3,3 mill. and to Board mem-bers NOK 14,6 mill. (13,4 mill. last year). Remuneration to the Board members and Group Managing Director is paid from the companies where the Director is employed or a member of the Board.
Loan to shareholders and other closely related parties 2016 2015
Vitare AS 4 105 5 105
Salthavn AS 2 671 3 871
Salthavn Invest AS 1 168 1 668
Total 7 945 10 645
There is security for the loans.
2015 Duration Number of vessels Operating lease expense
Long-term time charter 0 - 5 years 4 126 576
Bare-boat hire 2-12 years 3 74 172
Other lease amount charged in the year 3-10 years 33 980
Total lease amount charged 234 729
18 ANNUAL REPORT2016
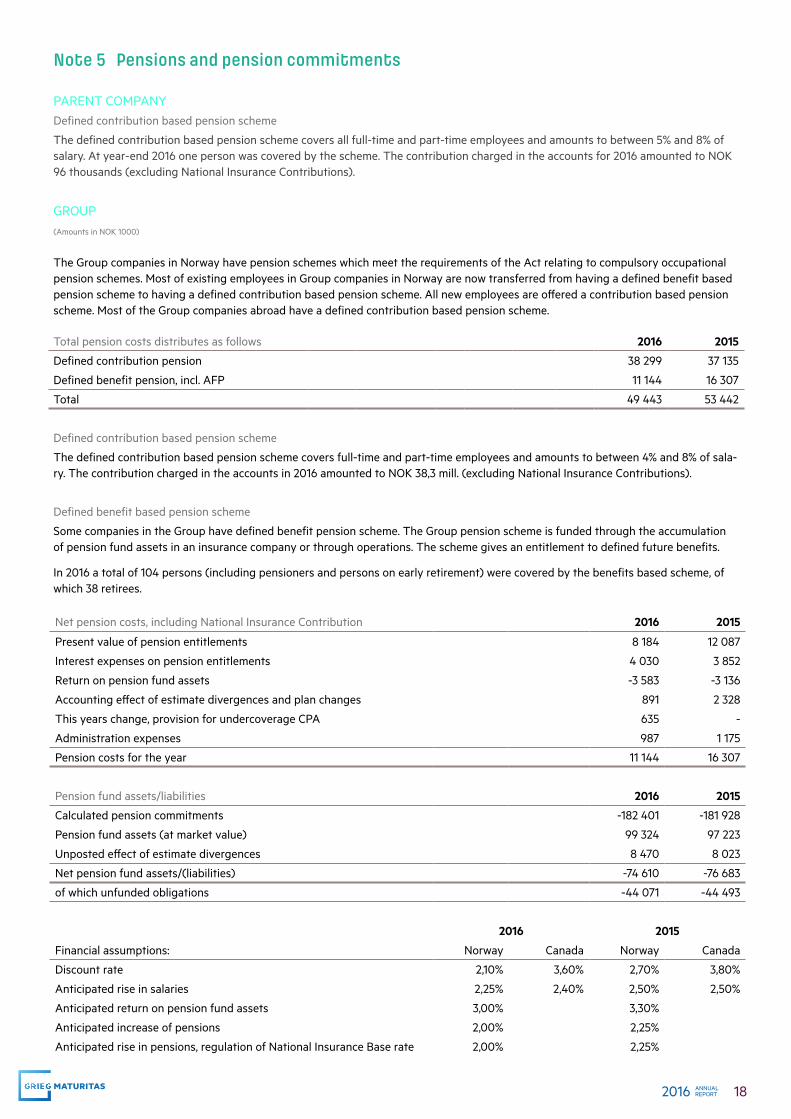
Note 5 Pensions and pension commitments
PARENT COMPANYDefined contribution based pension scheme
The defined contribution based pension scheme covers all full-time and part-time employees and amounts to between 5% and 8% of salary. At year-end 2016 one person was covered by the scheme. The contribution charged in the accounts for 2016 amounted to NOK 96 thousands (excluding National Insurance Contributions).
GROUP(Amounts in NOK 1000)
The Group companies in Norway have pension schemes which meet the requirements of the Act relating to compulsory occupational pension schemes. Most of existing employees in Group companies in Norway are now transferred from having a defined benefit based pension scheme to having a defined contribution based pension scheme. All new employees are offered a contribution based pension scheme. Most of the Group companies abroad have a defined contribution based pension scheme.
Total pension costs distributes as follows 2016 2015
Defined contribution pension 38 299 37 135
Defined benefit pension, incl. AFP 11 144 16 307
Total 49 443 53 442
Defined contribution based pension scheme
The defined contribution based pension scheme covers full-time and part-time employees and amounts to between 4% and 8% of sala-ry. The contribution charged in the accounts in 2016 amounted to NOK 38,3 mill. (excluding National Insurance Contributions).
Defined benefit based pension scheme
Some companies in the Group have defined benefit pension scheme. The Group pension scheme is funded through the accumulation of pension fund assets in an insurance company or through operations. The scheme gives an entitlement to defined future benefits.
In 2016 a total of 104 persons (including pensioners and persons on early retirement) were covered by the benefits based scheme, of which 38 retirees.
Net pension costs, including National Insurance Contribution 2016 2015
Present value of pension entitlements 8 184 12 087
Interest expenses on pension entitlements 4 030 3 852
Return on pension fund assets -3 583 -3 136
Accounting effect of estimate divergences and plan changes 891 2 328
This years change, provision for undercoverage CPA 635 -
Administration expenses 987 1 175
Pension costs for the year 11 144 16 307
Pension fund assets/liabilities 2016 2015
Calculated pension commitments -182 401 -181 928
Pension fund assets (at market value) 99 324 97 223
Unposted effect of estimate divergences 8 470 8 023
Net pension fund assets/(liabilities) -74 610 -76 683
of which unfunded obligations -44 071 -44 493
2016 2015
Financial assumptions: Norway Canada Norway Canada
Discount rate 2,10% 3,60% 2,70% 3,80%
Anticipated rise in salaries 2,25% 2,40% 2,50% 2,50%
Anticipated return on pension fund assets 3,00% 3,30%
Anticipated increase of pensions 2,00% 2,25%
Anticipated rise in pensions, regulation of National Insurance Base rate 2,00% 2,25%
19 ANNUAL REPORT2016
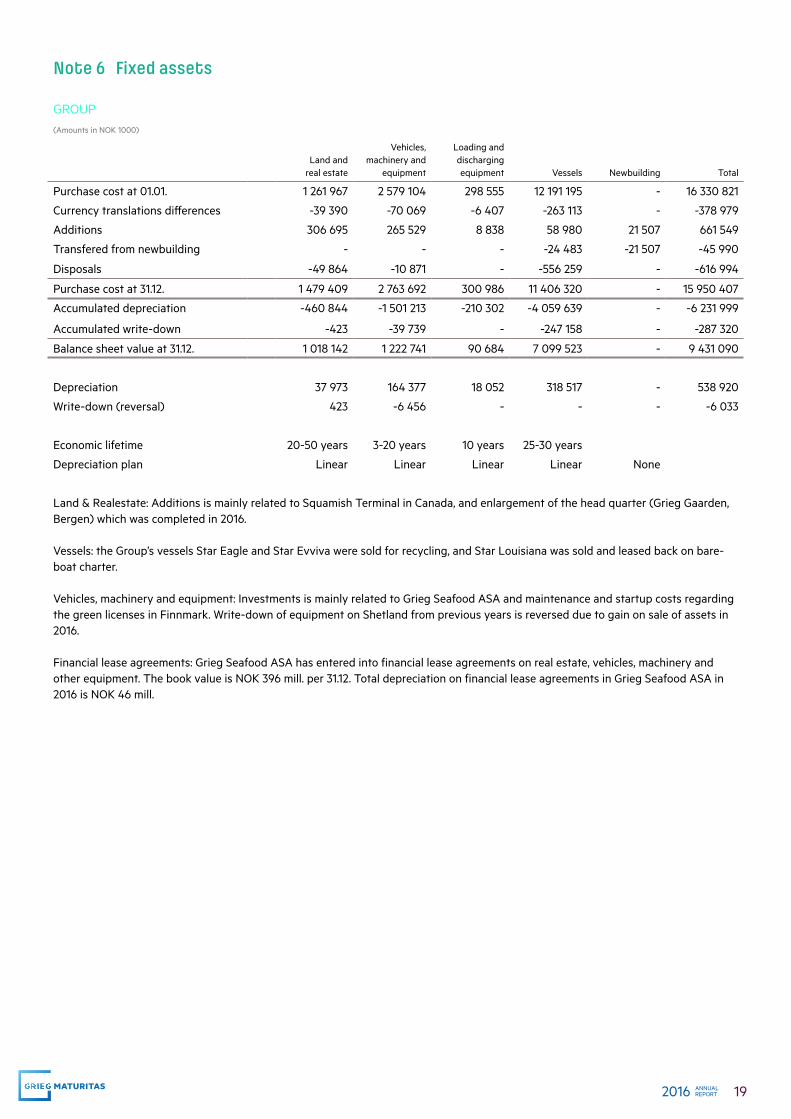
Note 6 Fixed assets
GROUP(Amounts in NOK 1000)
Land and real estate
Vehicles, machinery and
equipment
Loading and discharging equipment Vessels Newbuilding Total
Purchase cost at 01.01. 1 261 967 2 579 104 298 555 12 191 195 - 16 330 821
Currency translations differences -39 390 -70 069 -6 407 -263 113 - -378 979
Additions 306 695 265 529 8 838 58 980 21 507 661 549
Transfered from newbuilding - - - -24 483 -21 507 -45 990
Disposals -49 864 -10 871 - -556 259 - -616 994
Purchase cost at 31.12. 1 479 409 2 763 692 300 986 11 406 320 - 15 950 407
Accumulated depreciation -460 844 -1 501 213 -210 302 -4 059 639 - -6 231 999
Accumulated write-down -423 -39 739 - -247 158 - -287 320
Balance sheet value at 31.12. 1 018 142 1 222 741 90 684 7 099 523 - 9 431 090
Depreciation 37 973 164 377 18 052 318 517 - 538 920
Write-down (reversal) 423 -6 456 - - - -6 033
Economic lifetime 20-50 years 3-20 years 10 years 25-30 years
Depreciation plan Linear Linear Linear Linear None
Land & Realestate: Additions is mainly related to Squamish Terminal in Canada, and enlargement of the head quarter (Grieg Gaarden, Bergen) which was completed in 2016. Vessels: the Group’s vessels Star Eagle and Star Evviva were sold for recycling, and Star Louisiana was sold and leased back on bare-boat charter.
Vehicles, machinery and equipment: Investments is mainly related to Grieg Seafood ASA and maintenance and startup costs regarding the green licenses in Finnmark. Write-down of equipment on Shetland from previous years is reversed due to gain on sale of assets in 2016.
Financial lease agreements: Grieg Seafood ASA has entered into financial lease agreements on real estate, vehicles, machinery and other equipment. The book value is NOK 396 mill. per 31.12. Total depreciation on financial lease agreements in Grieg Seafood ASA in 2016 is NOK 46 mill.

20 ANNUAL REPORT2016
Note 8 Investments in subsidiaries
COMPANY(Amounts in NOK 1000)
CompanyRegistered office Ownership
Proportion of voting shares, %
Book equity 100% Book value Dividend
Grieg Maturitas II AS Bergen 75% 100% 5 333 426 4 021 796 74 525
Grieg Maturitas II AS, which is owned 75% by Grieg Maturitas AS and 25% by Grieg Foundation, is the common holding company of the Group.
GROUP
The consolidated financial statements comprise the company Grieg Maturitas AS and Grieg Maturitas II AS with the following subsidiaries:
Grieg Maturitas II AS owns the following companies: Registered officeDirectly
ownership %
Directly and indirectly
ownership %
Grieg Star Group AS Bergen 45,5% 100%
Grieg Logistics AS Bergen 100% 100%
Grieg Holdings AS Bergen 83,7% 100%
Grieg Property AS Bergen 58,99% 100%
Grieg International AS Oslo 100% 100%
Grieg Ltd AS Bergen 100% 100%
Note 7 Intangible assets
GROUP(Amounts in NOK 1000)
Goodwill ContractsResearch and development Licenses Total
Purchase cost at 01.01 178 006 154 409 15 934 1 150 770 1 499 119
Currency translations differences -3 520 -3 297 0 -34 143 -40 960
Additions 708 0 11 131 7 069 18 908
Disposals 0 0 0 0 -
Purchase cost at 31.12 175 193 151 113 27 065 1 123 696 1 477 067
Accumulated depreciation -61 597 -110 095 -4 902 -45 424 -222 018
Accumulated write-down -89 603 0 0 0 -89 603
Balance sheet value at 31.12. 23 993 41 018 22 163 1 078 272 1 165 446
Depreciation 7 735 7 750 1 109 5 036 21 630
Economic lifetime 3-20 years 20 years 3-7 years 5 years/unlimited
Depreciation plan Linear Linear Linear Linear/none
Contracts: represent excess values related to the vessels' contracts of affreightment through the participation in the Grieg Star Ship-ping pool.
Research and development: relates to logistic systems in Grieg Logistics Group and new digital software solutions in Grieg Investor AS.
Licenses: relates to fish-farming licenses in Grieg Seafood ASA and Ryfylke Rensefisk Group. Most licenses have an unlimited economic lifetime, but is subject to a yearly value assessment to determine if write-downs are required.
21 ANNUAL REPORT2016
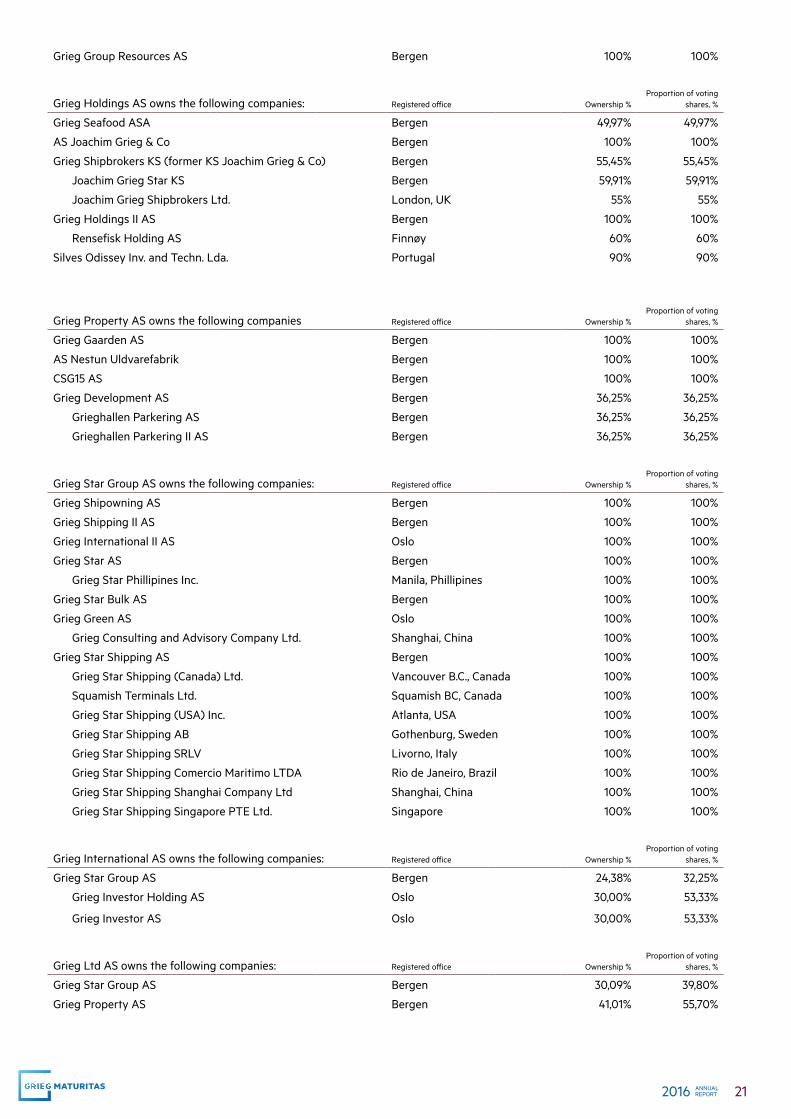
Grieg Group Resources AS Bergen 100% 100%
Grieg Holdings AS owns the following companies: Registered office Ownership %Proportion of voting
shares, %
Grieg Seafood ASA Bergen 49,97% 49,97%
AS Joachim Grieg & Co Bergen 100% 100%
Grieg Shipbrokers KS (former KS Joachim Grieg & Co) Bergen 55,45% 55,45%
Joachim Grieg Star KS Bergen 59,91% 59,91%
Joachim Grieg Shipbrokers Ltd. London, UK 55% 55%
Grieg Holdings II AS Bergen 100% 100%
Rensefisk Holding AS Finnøy 60% 60%
Silves Odissey Inv. and Techn. Lda. Portugal 90% 90%
Grieg Property AS owns the following companies Registered office Ownership %Proportion of voting
shares, %
Grieg Gaarden AS Bergen 100% 100%
AS Nestun Uldvarefabrik Bergen 100% 100%
CSG15 AS Bergen 100% 100%
Grieg Development AS Bergen 36,25% 36,25%
Grieghallen Parkering AS Bergen 36,25% 36,25%
Grieghallen Parkering II AS Bergen 36,25% 36,25%
Grieg Star Group AS owns the following companies: Registered office Ownership %Proportion of voting
shares, %
Grieg Shipowning AS Bergen 100% 100%
Grieg Shipping II AS Bergen 100% 100%
Grieg International II AS Oslo 100% 100%
Grieg Star AS Bergen 100% 100%
Grieg Star Phillipines Inc. Manila, Phillipines 100% 100%
Grieg Star Bulk AS Bergen 100% 100%
Grieg Green AS Oslo 100% 100%
Grieg Consulting and Advisory Company Ltd. Shanghai, China 100% 100%
Grieg Star Shipping AS Bergen 100% 100%
Grieg Star Shipping (Canada) Ltd. Vancouver B.C., Canada 100% 100%
Squamish Terminals Ltd. Squamish BC, Canada 100% 100%
Grieg Star Shipping (USA) Inc. Atlanta, USA 100% 100%
Grieg Star Shipping AB Gothenburg, Sweden 100% 100%
Grieg Star Shipping SRLV Livorno, Italy 100% 100%
Grieg Star Shipping Comercio Maritimo LTDA Rio de Janeiro, Brazil 100% 100%
Grieg Star Shipping Shanghai Company Ltd Shanghai, China 100% 100%
Grieg Star Shipping Singapore PTE Ltd. Singapore 100% 100%
Grieg International AS owns the following companies: Registered office Ownership %Proportion of voting
shares, %
Grieg Star Group AS Bergen 24,38% 32,25%
Grieg Investor Holding AS Oslo 30,00% 53,33%
Grieg Investor AS Oslo 30,00% 53,33%
Grieg Ltd AS owns the following companies: Registered office Ownership %Proportion of voting
shares, %
Grieg Star Group AS Bergen 30,09% 39,80%
Grieg Property AS Bergen 41,01% 55,70%
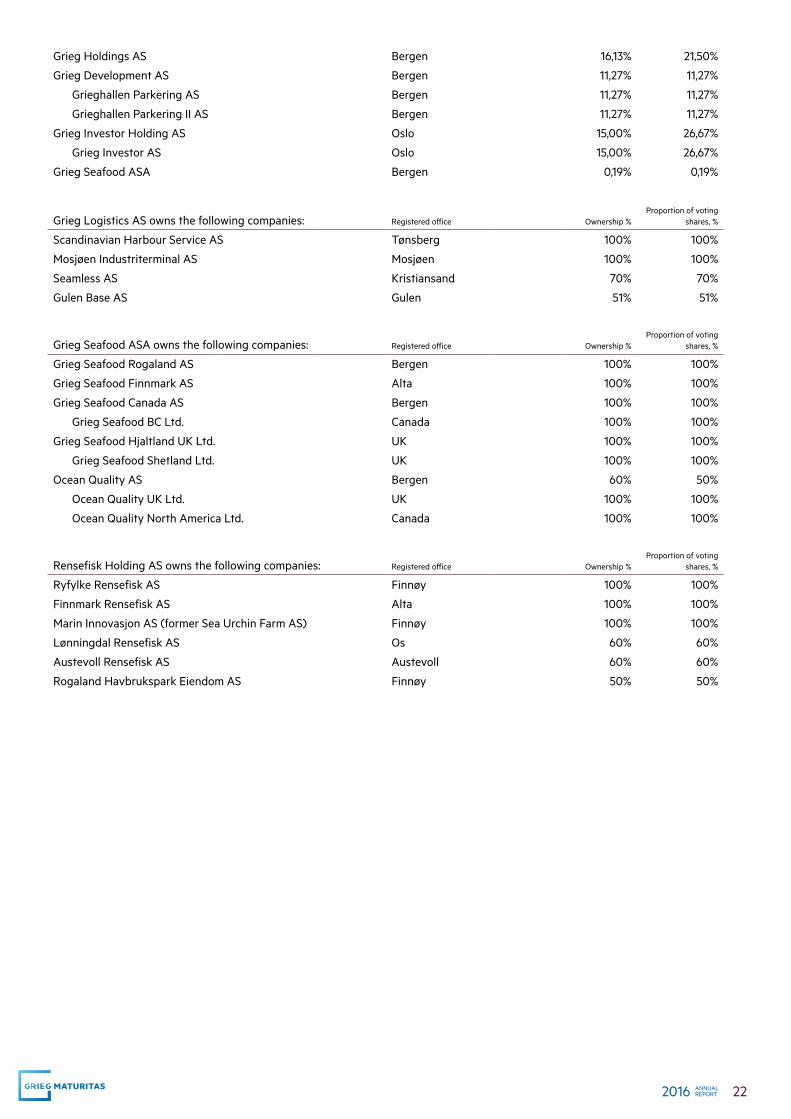
22 ANNUAL REPORT2016
Grieg Holdings AS Bergen 16,13% 21,50%
Grieg Development AS Bergen 11,27% 11,27%
Grieghallen Parkering AS Bergen 11,27% 11,27%
Grieghallen Parkering II AS Bergen 11,27% 11,27%
Grieg Investor Holding AS Oslo 15,00% 26,67%
Grieg Investor AS Oslo 15,00% 26,67%
Grieg Seafood ASA Bergen 0,19% 0,19%
Grieg Logistics AS owns the following companies: Registered office Ownership %Proportion of voting
shares, %
Scandinavian Harbour Service AS Tønsberg 100% 100%
Mosjøen Industriterminal AS Mosjøen 100% 100%
Seamless AS Kristiansand 70% 70%
Gulen Base AS Gulen 51% 51%
Registered officeGrieg Seafood ASA owns the following companies: Ownership %Proportion of voting
shares, %
Grieg Seafood Rogaland AS Bergen 100% 100%
Grieg Seafood Finnmark AS Alta 100% 100%
Grieg Seafood Canada AS Bergen 100% 100%
Grieg Seafood BC Ltd. Canada 100% 100%
Grieg Seafood Hjaltland UK Ltd. UK 100% 100%
Grieg Seafood Shetland Ltd. UK 100% 100%
Ocean Quality AS Bergen 60% 50%
Ocean Quality UK Ltd. UK 100% 100%
Ocean Quality North America Ltd. Canada 100% 100%
Rensefisk Holding AS owns the following companies: Registered office Ownership %Proportion of voting
shares, %
Ryfylke Rensefisk AS Finnøy 100% 100%
Finnmark Rensefisk AS Alta 100% 100%
Marin Innovasjon AS (former Sea Urchin Farm AS) Finnøy 100% 100%
Lønningdal Rensefisk AS Os 60% 60%
Austevoll Rensefisk AS Austevoll 60% 60%
Rogaland Havbrukspark Eiendom AS Finnøy 50% 50%
23 ANNUAL REPORT2016
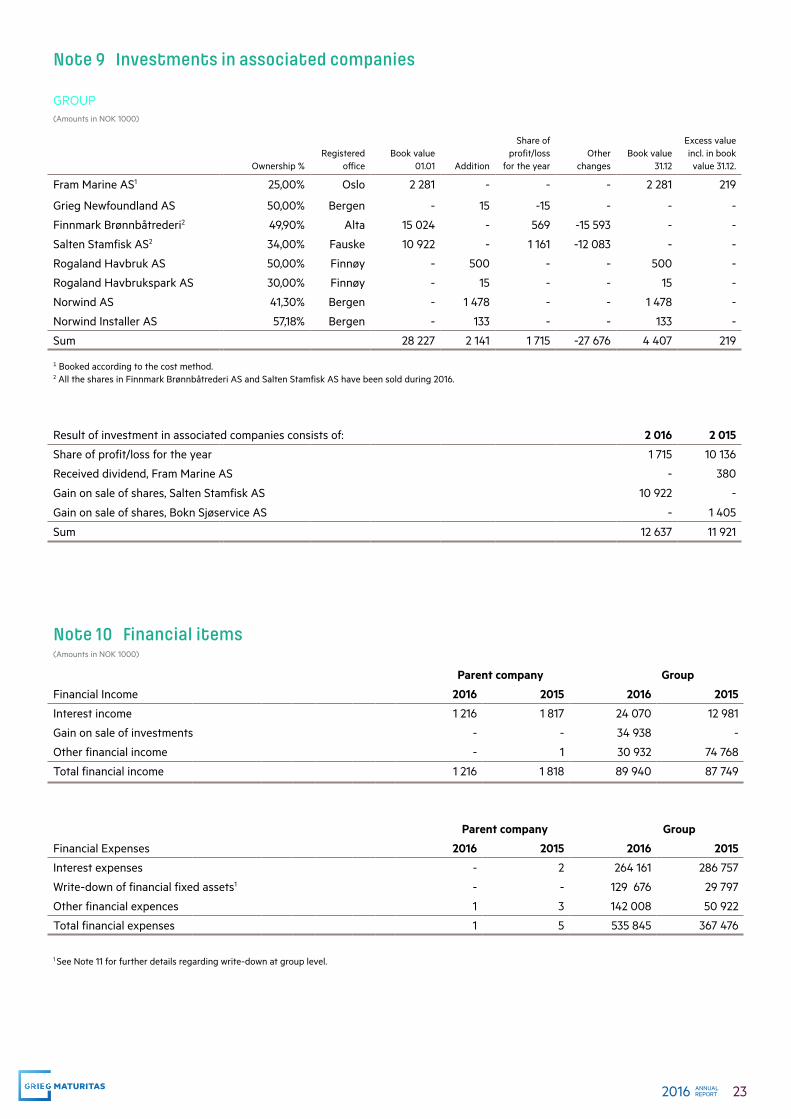
Note 9 Investments in associated companies
GROUP(Amounts in NOK 1000)
Ownership %Registered
officeBook value
01.01 Addition
Share of profit/loss
for the yearOther
changesBook value
31.12
Excess value incl. in book value 31.12.
Fram Marine AS1 25,00% Oslo 2 281 - - - 2 281 219
Grieg Newfoundland AS 50,00% Bergen - 15 -15 - - -
Finnmark Brønnbåtrederi2 49,90% Alta 15 024 - 569 -15 593 - -
Salten Stamfisk AS2 34,00% Fauske 10 922 - 1 161 -12 083 - -
Rogaland Havbruk AS 50,00% Finnøy - 500 - - 500 -
Rogaland Havbrukspark AS 30,00% Finnøy - 15 - - 15 -
Norwind AS 41,30% Bergen - 1 478 - - 1 478 -
Norwind Installer AS 57,18% Bergen - 133 - - 133 -
Sum 28 227 2 141 1 715 -27 676 4 407 219
� Booked according to the cost method.2 All the shares in Finnmark Brønnbåtrederi AS and Salten Stamfisk AS have been sold during 2016.
Result of investment in associated companies consists of: 2 016 2 015
Share of profit/loss for the year 1 715 10 136
Received dividend, Fram Marine AS - 380
Gain on sale of shares, Salten Stamfisk AS 10 922 -
Gain on sale of shares, Bokn Sjøservice AS - 1 405
Sum 12 637 11 921
Note 10 Financial items(Amounts in NOK 1000)
Parent company Group
Financial Income 2016 2015 2016 2015
Interest income 1 216 1 817 24 070 12 981
Gain on sale of investments - - 34 938 -
Other financial income - 1 30 932 74 768
Total financial income 1 216 1 818 89 940 87 749
Parent company Group
Financial Expenses 2016 2015 2016 2015
Interest expenses - 2 264 161 286 757
Write-down of financial fixed assets1 - - 129 676 29 797
Other financial expences 1 3 142 008 50 922
Total financial expenses 1 5 535 845 367 476
1 See Note 11 for further details regarding write-down at group level.
24 ANNUAL REPORT2016
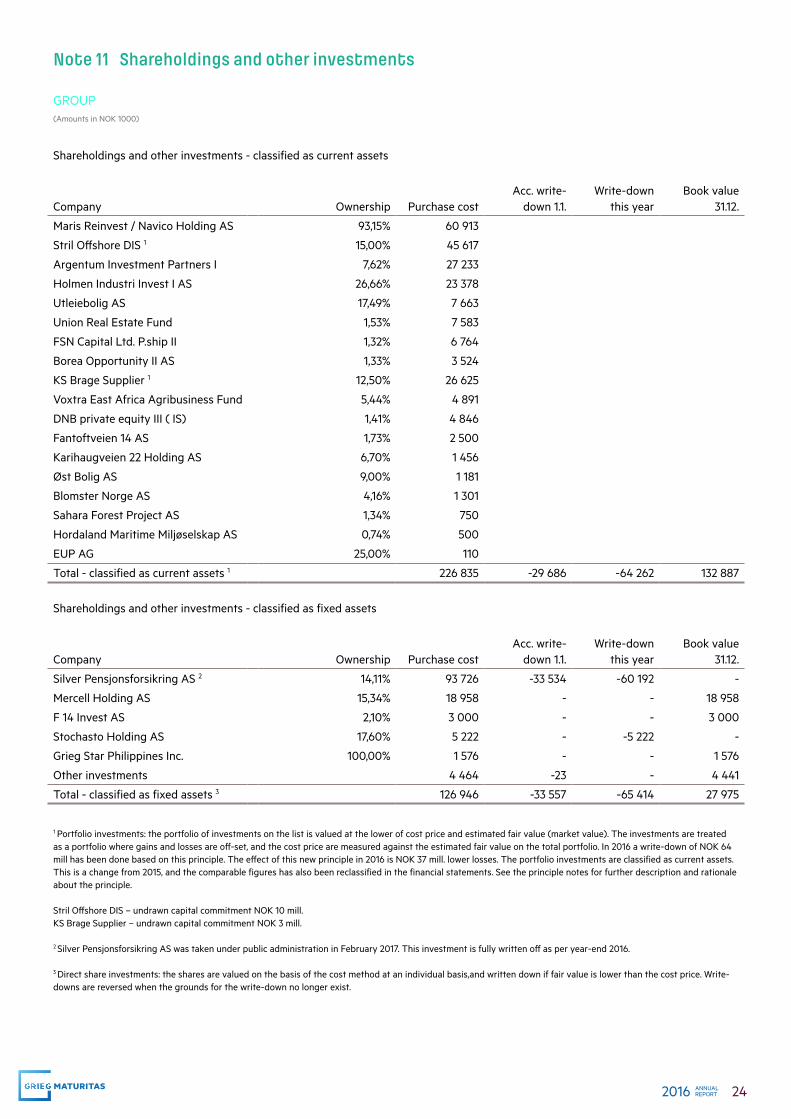
Note 11 Shareholdings and other investments
GROUP(Amounts in NOK 1000)
Shareholdings and other investments - classified as current assets
Company Ownership Purchase costAcc. write-
down 1.1.Write-down
this yearBook value
31.12.
Maris Reinvest / Navico Holding AS 93,15% 60 913
Stril Offshore DIS 1 15,00% 45 617
Argentum Investment Partners I 7,62% 27 233
Holmen Industri Invest I AS 26,66% 23 378
Utleiebolig AS 17,49% 7 663
Union Real Estate Fund 1,53% 7 583
FSN Capital Ltd. P.ship II 1,32% 6 764
Borea Opportunity II AS 1,33% 3 524
KS Brage Supplier 1 12,50% 26 625
Voxtra East Africa Agribusiness Fund 5,44% 4 891
DNB private equity III ( IS) 1,41% 4 846
Fantoftveien 14 AS 1,73% 2 500
Karihaugveien 22 Holding AS 6,70% 1 456
Øst Bolig AS 9,00% 1 181
Blomster Norge AS 4,16% 1 301
Sahara Forest Project AS 1,34% 750
Hordaland Maritime Miljøselskap AS 0,74% 500
EUP AG 25,00% 110
Total - classified as current assets 1 226 835 -29 686 -64 262 132 887
Shareholdings and other investments - classified as fixed assets
Company Ownership Purchase costAcc. write-
down 1.1.Write-down
this yearBook value
31.12.
Silver Pensjonsforsikring AS 2 14,11% 93 726 -33 534 -60 192 -
Mercell Holding AS 15,34% 18 958 - - 18 958
F 14 Invest AS 2,10% 3 000 - - 3 000
Stochasto Holding AS 17,60% 5 222 - -5 222 -
Grieg Star Philippines Inc. 100,00% 1 576 - - 1 576
Other investments 4 464 -23 - 4 441
Total - classified as fixed assets 3 126 946 -33 557 -65 414 27 975
1 Portfolio investments: the portfolio of investments on the list is valued at the lower of cost price and estimated fair value (market value). The investments are treated as a portfolio where gains and losses are off-set, and the cost price are measured against the estimated fair value on the total portfolio. In 2016 a write-down of NOK 64 mill has been done based on this principle. The effect of this new principle in 2016 is NOK 37 mill. lower losses. The portfolio investments are classified as current assets. This is a change from 2015, and the comparable figures has also been reclassified in the financial statements. See the principle notes for further description and rationale about the principle.
Stril Offshore DIS – undrawn capital commitment NOK 10 mill.KS Brage Supplier – undrawn capital commitment NOK 3 mill. 2 Silver Pensjonsforsikring AS was taken under public administration in February 2017. This investment is fully written off as per year-end 2016. 3 Direct share investments: the shares are valued on the basis of the cost method at an individual basis,and written down if fair value is lower than the cost price. Write-downs are reversed when the grounds for the write-down no longer exist.
25 ANNUAL REPORT2016
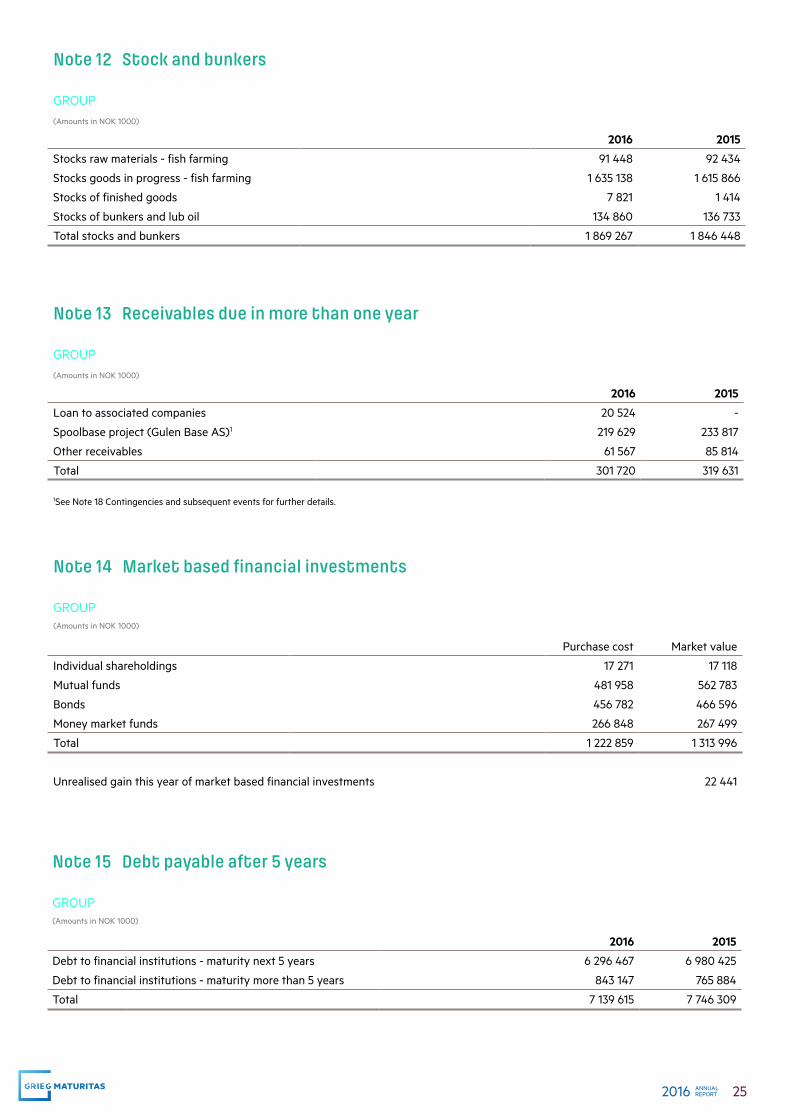
Note 13 Receivables due in more than one year
GROUP(Amounts in NOK 1000)
2016 2015
Loan to associated companies 20 524 -
Spoolbase project (Gulen Base AS)1 219 629 233 817
Other receivables 61 567 85 814
Total 301 720 319 631
1See Note 18 Contingencies and subsequent events for further details.
Note 14 Market based financial investments
GROUP(Amounts in NOK 1000)
Purchase cost Market value
Individual shareholdings 17 271 17 118
Mutual funds 481 958 562 783
Bonds 456 782 466 596
Money market funds 266 848 267 499
Total 1 222 859 1 313 996
Unrealised gain this year of market based financial investments 22 441
Note 15 Debt payable after 5 years
GROUP(Amounts in NOK 1000)
2016 2015
Debt to financial institutions - maturity next 5 years 6 296 467 6 980 425
Debt to financial institutions - maturity more than 5 years 843 147 765 884
Total 7 139 615 7 746 309
Note 12 Stock and bunkers
GROUP(Amounts in NOK 1000)
2016 2015
Stocks raw materials - fish farming 91 448 92 434
Stocks goods in progress - fish farming 1 635 138 1 615 866
Stocks of finished goods 7 821 1 414
Stocks of bunkers and lub oil 134 860 136 733
Total stocks and bunkers 1 869 267 1 846 448
26 ANNUAL REPORT2016
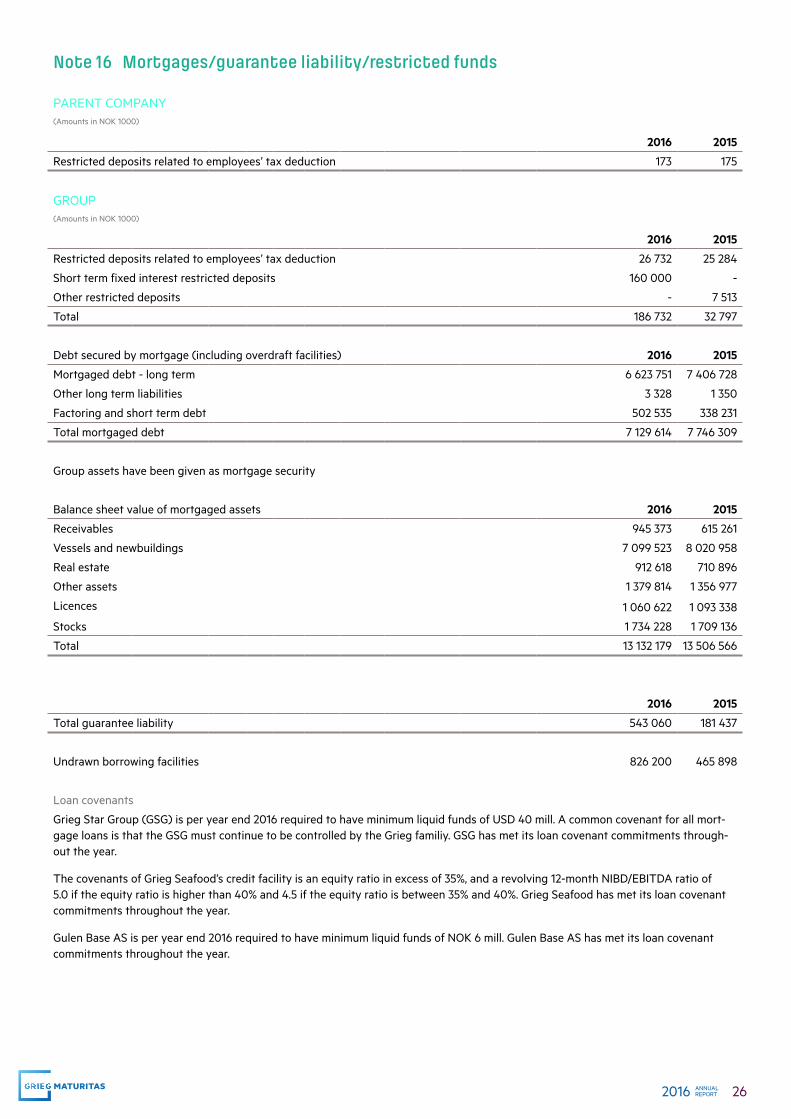
Note 16 Mortgages/guarantee liability/restricted funds
PARENT COMPANY(Amounts in NOK 1000)
2016 2015
Restricted deposits related to employees’ tax deduction 173 175
GROUP(Amounts in NOK 1000)
2016 2015
Restricted deposits related to employees’ tax deduction 26 732 25 284
Short term fixed interest restricted deposits 160 000 -
Other restricted deposits - 7 513
Total 186 732 32 797
Debt secured by mortgage (including overdraft facilities) 2016 2015
Mortgaged debt - long term 6 623 751 7 406 728
Other long term liabilities 3 328 1 350
Factoring and short term debt 502 535 338 231
Total mortgaged debt 7 129 614 7 746 309
Group assets have been given as mortgage security
Balance sheet value of mortgaged assets 2016 2015
Receivables 945 373 615 261
Vessels and newbuildings 7 099 523 8 020 958
Real estate 912 618 710 896
Other assets 1 379 814 1 356 977
Licences 1 060 622 1 093 338
Stocks 1 734 228 1 709 136
Total 13 132 179 13 506 566
2016 2015
Total guarantee liability 543 060 181 437
Undrawn borrowing facilities 826 200 465 898
Loan covenants
Grieg Star Group (GSG) is per year end 2016 required to have minimum liquid funds of USD 40 mill. A common covenant for all mort-gage loans is that the GSG must continue to be controlled by the Grieg familiy. GSG has met its loan covenant commitments through-out the year.
The covenants of Grieg Seafood’s credit facility is an equity ratio in excess of 35%, and a revolving 12-month NIBD/EBITDA ratio of 5.0 if the equity ratio is higher than 40% and 4.5 if the equity ratio is between 35% and 40%. Grieg Seafood has met its loan covenant commitments throughout the year.
Gulen Base AS is per year end 2016 required to have minimum liquid funds of NOK 6 mill. Gulen Base AS has met its loan covenant commitments throughout the year.

27 ANNUAL REPORT2016
Note 17 Financial risk
The Group is exposed to a range of financial risks; market risk (including currency risk, cashflow interest rate risk, fair value interest rate risk and price risk), credit risk and liquidity risk. The Group uses various financial derivatives to manage its financial risk.
Market riskInterest rate risk
Interest rate risk arises in the short and long term as most parts of the Group’s debt are at a floating rate of interest. A change in interest rates will result in either an increase or a reduction of the financing cost. If certain interest rate derivatives are applied then the predictability of the financing cost will increase due to a limitation of the net effect of a change in interest rates. In addition a change in interest rates will affect the returns on the investment portfolio and the rates on cash deposits. The Group’s strategy is to employ a certain level of hedging using interest rate swap agreements to establish greater stability for the Group’s loan interest expenses.
Gains and losses rising from interest rate swaps in the Grieg Star Group are recognised in the same period as the related interest expense.
At 31.12.16 the Grieg Star Group held interest rate swap agreements of USD 237.5 mill. and had six forward starting interest rate swaps for a total of USD 90 mill. Total unrealized MTM value, not recognized in the balance sheet, was USD -10,5 mill.
Gains and losses rising from interest rate swaps in Grieg Seafood are not subject to hedge accounting and are recognised as the gains or losses arise. Grieg Seafood had interest swap agreement totalling NOK 400 mill. at 31.12.16. Unrealized loss attached to this agree-ment, recognised in the balance sheet, amounts to NOK -5,3 mill. Interest rate swap agreements have a horizon of 4 years and whether these periods are to be rolled over is a matter of constant evaluation.
Foreign exchange risk
The Group operates globally and is exposed in foreign exchange risk arising from various currency exposures, mainly USD, CAD, GBP and EUR. Foreign exchange risk arises when transactions, recognized assets or liabilities is in a currency other than company’s func-tional currency. The Group’s main focus in relation to foreign exchange hedging is to ensure that costs and liabilities are denominated in the same currency as revenues and assets. The foreign exchange risk is largely covered through forward foreign exchange contracts. Gains/losses on foreign exchange contracts are booked in the same period as the period when the hedged transactions are settled. Non-USD denominated financial investments which are part of the Group’s financial investment portfolio are also taken into consider-ation when the Group’s net foreign exchange exposure is assessed.
At 31.12.16 the Grieg Star Group had entered into hedging through the use of currency swaps for USD 14,6 mill. Total unrealized MTM value, not recognized in the balance sheet was USD -0,7 mill. at 31.12.16.
Grieg Shipbrokers had at 31.12.16 forward contracts to hedge a total of USD 16,7 mill. with an unrealized, not posted loss in the balance sheet, of NOK 2,2 mill.
At 31.12.16 the Grieg Seafood Group had entered into contracts to hedge actual sales contracts in foreign currency. The positive value of the contracts, not recognized in the balance sheet at 31.12.2016, was NOK 6,1 mill.
Freight rate risk
As a part of Grieg Star Group’s risk management, Forward Freight Agreements (FFA) are from time to time used as a risk managmenet instrument. The Group did not have any FFA contracts at 31.12.16.
Bunker price risk
The Grieg Star Group uses derivative contracts to hedge bunker prices related to freight agreements without bunker clauses. The result of the hedging contracts is classified as an adjustment of operating costs and is posted in the hedging period.
As of 31.12.16 the Group had bunkers commodity swaps for a total of 1 200 mt bunkers. Total unrealized MTM value, not recognized in the balance sheet at 31.12.2016, was USD 0,1 mill.
Salmon prices
Grieg Seafood Group is exposed to fluctuations in the spot prices for salmon, which is mainly determined by the global supply of salmon. The effect of price changes is reduced by geographical diversification, but due to the long production cycle it can be difficult to respond rapidly to global trends in market prices. Salmon is primarily traded at spot prices. The price risk is partly hedged through financial purchase contracts. At 31.12.2016 Grieg Seafood Group had such contracts with a net positive value of NOK 22,9 mill. not recognized in the Financial Statements.
28 ANNUAL REPORT2016
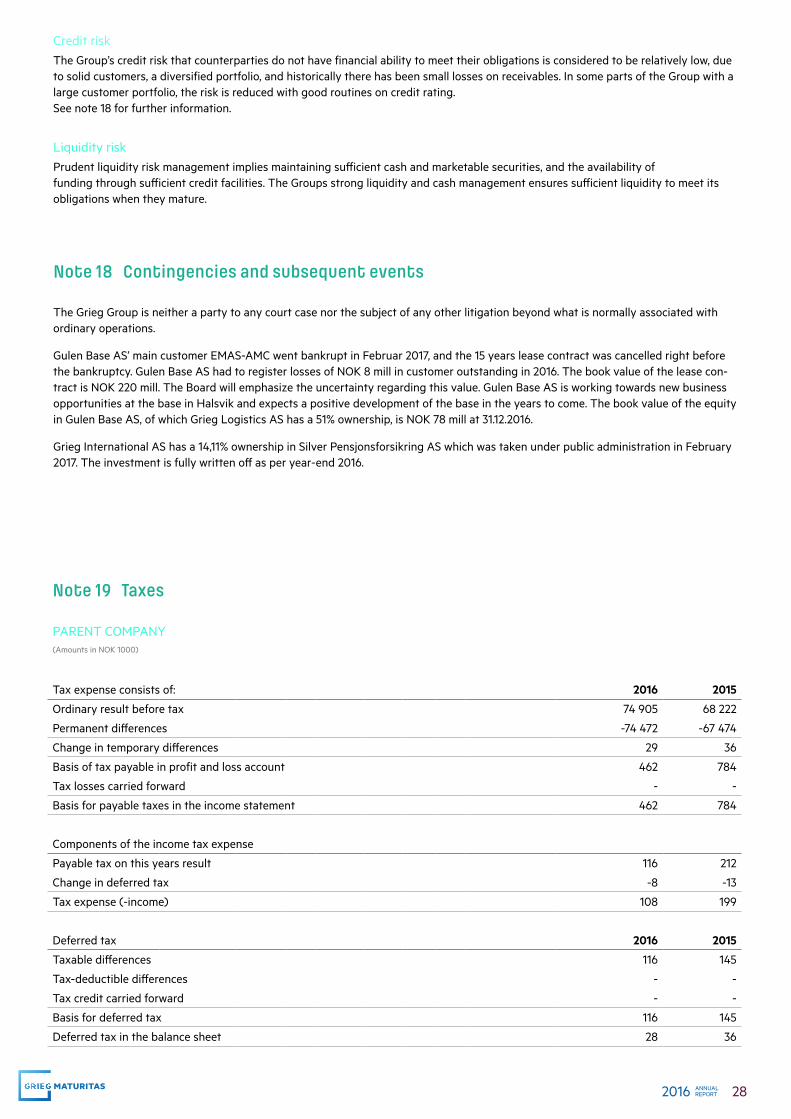
Credit riskThe Group’s credit risk that counterparties do not have financial ability to meet their obligations is considered to be relatively low, due to solid customers, a diversified portfolio, and historically there has been small losses on receivables. In some parts of the Group with a large customer portfolio, the risk is reduced with good routines on credit rating. See note 18 for further information.
Liquidity riskPrudent liquidity risk management implies maintaining sufficient cash and marketable securities, and the availability of funding through sufficient credit facilities. The Groups strong liquidity and cash management ensures sufficient liquidity to meet its obligations when they mature.
Note 18 Contingencies and subsequent events
The Grieg Group is neither a party to any court case nor the subject of any other litigation beyond what is normally associated with ordinary operations.
Gulen Base AS’ main customer EMAS-AMC went bankrupt in Februar 2017, and the 15 years lease contract was cancelled right before the bankruptcy. Gulen Base AS had to register losses of NOK 8 mill in customer outstanding in 2016. The book value of the lease con-tract is NOK 220 mill. The Board will emphasize the uncertainty regarding this value. Gulen Base AS is working towards new business opportunities at the base in Halsvik and expects a positive development of the base in the years to come. The book value of the equity in Gulen Base AS, of which Grieg Logistics AS has a 51% ownership, is NOK 78 mill at 31.12.2016.
Grieg International AS has a 14,11% ownership in Silver Pensjonsforsikring AS which was taken under public administration in February 2017. The investment is fully written off as per year-end 2016.
Note 19 Taxes
PARENT COMPANY(Amounts in NOK 1000)
Tax expense consists of: 2016 2015
Ordinary result before tax 74 905 68 222
Permanent differences -74 472 -67 474
Change in temporary differences 29 36
Basis of tax payable in profit and loss account 462 784
Tax losses carried forward - -
Basis for payable taxes in the income statement 462 784
Components of the income tax expense
Payable tax on this years result 116 212
Change in deferred tax -8 -13
Tax expense (-income) 108 199
Deferred tax 2016 2015
Taxable differences 116 145
Tax-deductible differences - -
Tax credit carried forward - -
Basis for deferred tax 116 145
Deferred tax in the balance sheet 28 36
29 ANNUAL REPORT2016
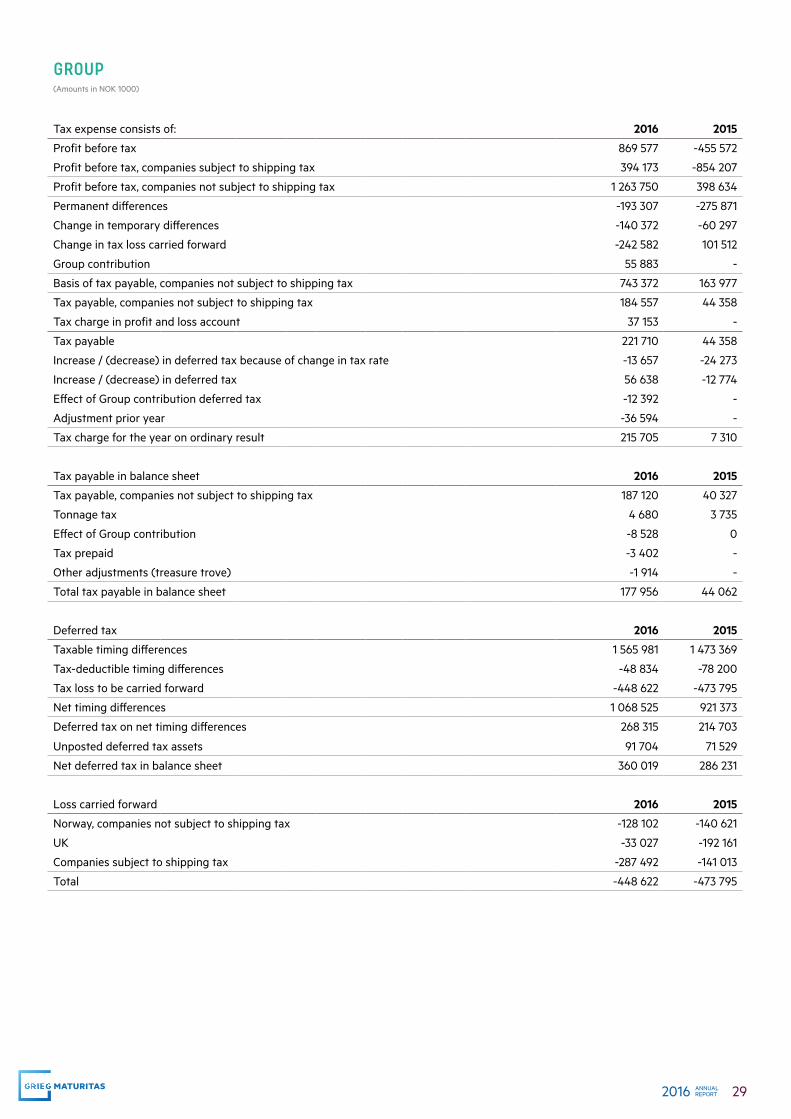
GROUP(Amounts in NOK 1000)
Tax expense consists of: 2016 2015
Profit before tax 869 577 -455 572
Profit before tax, companies subject to shipping tax 394 173 -854 207
Profit before tax, companies not subject to shipping tax 1 263 750 398 634
Permanent differences -193 307 -275 871
Change in temporary differences -140 372 -60 297
Change in tax loss carried forward -242 582 101 512
Group contribution 55 883 -
Basis of tax payable, companies not subject to shipping tax 743 372 163 977
Tax payable, companies not subject to shipping tax 184 557 44 358
Tax charge in profit and loss account 37 153 -
Tax payable 221 710 44 358
Increase / (decrease) in deferred tax because of change in tax rate -13 657 -24 273
Increase / (decrease) in deferred tax 56 638 -12 774
Effect of Group contribution deferred tax -12 392 -
Adjustment prior year -36 594 -
Tax charge for the year on ordinary result 215 705 7 310
Tax payable in balance sheet 2016 2015
Tax payable, companies not subject to shipping tax 187 120 40 327
Tonnage tax 4 680 3 735
Effect of Group contribution -8 528 0
Tax prepaid -3 402 -
Other adjustments (treasure trove) -1 914 -
Total tax payable in balance sheet 177 956 44 062
Deferred tax 2016 2015
Taxable timing differences 1 565 981 1 473 369
Tax-deductible timing differences -48 834 -78 200
Tax loss to be carried forward -448 622 -473 795
Net timing differences 1 068 525 921 373
Deferred tax on net timing differences 268 315 214 703
Unposted deferred tax assets 91 704 71 529
Net deferred tax in balance sheet 360 019 286 231
Loss carried forward 2016 2015
Norway, companies not subject to shipping tax -128 102 -140 621
UK -33 027 -192 161
Companies subject to shipping tax -287 492 -141 013
Total -448 622 -473 795
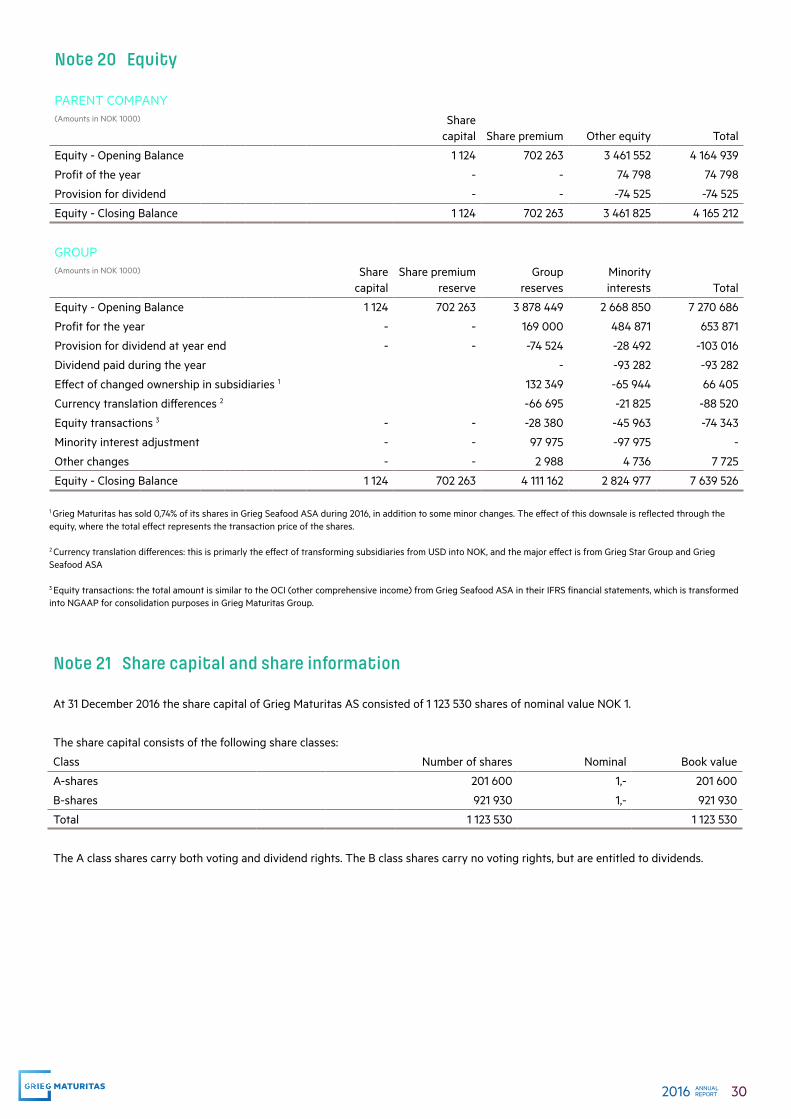
30 ANNUAL REPORT2016
Note 21 Share capital and share information
At 31 December 2016 the share capital of Grieg Maturitas AS consisted of 1 123 530 shares of nominal value NOK 1.
The share capital consists of the following share classes:
Class Number of shares Nominal Book value
A-shares 201 600 1,- 201 600
B-shares 921 930 1,- 921 930
Total 1 123 530 1 123 530
The A class shares carry both voting and dividend rights. The B class shares carry no voting rights, but are entitled to dividends.
Note 20 Equity
PARENT COMPANY(Amounts in NOK 1000) Share
capital Share premium Other equity Total
Equity - Opening Balance 1 124 702 263 3 461 552 4 164 939
Profit of the year - - 74 798 74 798
Provision for dividend - - -74 525 -74 525
Equity - Closing Balance 1 124 702 263 3 461 825 4 165 212
GROUP(Amounts in NOK 1000) Share
capitalShare premium
reserveGroup
reservesMinority interests Total
Equity - Opening Balance 1 124 702 263 3 878 449 2 668 850 7 270 686
Profit for the year - - 169 000 484 871 653 871
Provision for dividend at year end - - -74 524 -28 492 -103 016
Dividend paid during the year - -93 282 -93 282
Effect of changed ownership in subsidiaries 1 132 349 -65 944 66 405
Currency translation differences 2 -66 695 -21 825 -88 520
Equity transactions 3 - - -28 380 -45 963 -74 343
Minority interest adjustment - - 97 975 -97 975 -
Other changes - - 2 988 4 736 7 725
Equity - Closing Balance 1 124 702 263 4 111 162 2 824 977 7 639 526
1 Grieg Maturitas has sold 0,74% of its shares in Grieg Seafood ASA during 2016, in addition to some minor changes. The effect of this downsale is reflected through the equity, where the total effect represents the transaction price of the shares. 2 Currency translation differences: this is primarly the effect of transforming subsidiaries from USD into NOK, and the major effect is from Grieg Star Group and Grieg Seafood ASA 3 Equity transactions: the total amount is similar to the OCI (other comprehensive income) from Grieg Seafood ASA in their IFRS financial statements, which is transformed into NGAAP for consolidation purposes in Grieg Maturitas Group.

31 ANNUAL REPORT2016
Note 22 Related parties(Amounts in NOK 1000)
Members of the board and managing director of the parent company, including their related parties, are with companies in the Group considered as closely related parties. Transactions and intercompany balances with group companies are eliminated in the Group accounts, and is not mentioned below.
Remuneration to directors and managing director, see Note 4.
Operating revenue
Operating cost
Financial income
Financial expenses
Long-term receivables
Current receivables
Transactions 6 361 16 245 215 - 7 945 268
Transactions with related parties are governed by market terms and conditions in accordance with the arms length principle.
Note 23 Remuneration to auditor
Specification of Group auditor’s fee (Amounts in NOK 1000)
Parent company Group
Auditor 2016 2015 2016 2015
Statutory audit 30 60 5 803 6 008
Taxation advice - - 1 140 1 592
Other assurance services - - 257 452
Other assistance - 1 2 026 1 031
Total (exluding VAT) 30 61 9 226 9 083
The amount above includes remuneration to other auditors with: 1 999 1 302
The company’s shareholders are as follows: A-shares B-shares Total
Nye Kvasshøgdi AS 14,52% 50 400 112 755 163 155
Ystholmen AS 7,85% - 88 192 88 192
Salthavn AS 15,64% 35 224 140 440 175 664
Salthavn Invest AS 6,74% 15 176 60 507 75 683
GMC Invest AS 22,37% 50 400 200 947 251 347
Suletind AS 22,37% 50 400 200 947 251 347
Capelka AS 10,52% - 118 142 118 142
Total 100% 201 600 921 930 1 123 530
Through the companies specified above, the Board of Directors, Per Grieg sr. and their families have control of 100% of the shares in Grieg Maturitas AS.
PricewaterhouseCoopers AS, Sandviksbodene 2A, Postboks 3984 - Sandviken, NO-5835 Bergen
T: 02316, org.no.: 987 009 713 VAT, www.pwc.no
State authorised public accountants, members of The Norwegian Institute of Public Accountants, and authorised accounting firm
To the General Meeting of Grieg Maturitas AS
Independent Auditor’s Report
Report on the Audit of the Financial Statements
Opinion
We have audited the financial statements of Grieg Maturitas AS showing a profit of NOK 74 799 000 in the financial statements of the parent company and profit of NOK 653 871 000 in the financial statements of the group. The financial statements comprise:
• The financial statements of the parent company, which comprise the balance sheet as at 31 December 2016, and the income statement and cash flow statement for the year then ended, and notes to the financial statements, including a summary of significant accounting policies, and
• The financial statements of the group, which comprise the balance sheet as at 31 December 2016, and the income statement and cash flow statement for the year then ended, and notes to the financial statements, including a summary of significant accounting policies.
In our opinion:
• The financial statements are prepared in accordance with the law and regulations.
• The accompanying financial statements give a true and fair view of the financial position of the parent company as at 31 December 2016, and its financial performance and its cash flows for the year then ended in accordance with the Norwegian Accounting Act and accounting standards and practices generally accepted in Norway.
• The accompanying financial statements give a true and fair view of the financial position of the group as at 31 December 2016, and its financial performance and its cash flows for the year then ended in accordance with the Norwegian Accounting Act and accounting standards and practices generally accepted in Norway.
Basis for Opinion
We conducted our audit in accordance with laws, regulations, and auditing standards and practices generally accepted in Norway, including International Standards on Auditing (ISAs). Our responsibilities under those standards are further described in the Auditor’s Responsibilities for the Audit of the Financial Statements section of our report. We are independent of the Company and the Group as required by laws and regulations, and we have fulfilled our other ethical responsibilities in accordance with these requirements. We believe that the audit evidence we have obtained is sufficient and appropriate to provide a basis for our opinion.
Independent Auditor's Report - Grieg Maturitas AS
(2)
Other information
Management is responsible for the other information. The other information comprises the Board of Directors’ report, but does not include the financial statements and our auditor's report thereon.
Our opinion on the financial statements does not cover the other information and we do not express any form of assurance conclusion thereon.
In connection with our audit of the financial statements, our responsibility is to read the other information and, in doing so, consider whether the other information is materially inconsistent with the financial statements or our knowledge obtained in the audit or otherwise appears to be materially misstated.
If, based on the work we have performed, we conclude that there is a material misstatement of this other information, we are required to report that fact. We have nothing to report in this regard.
Responsibilities of the Board of Directors and the Managing Director for the Financial Statements
The Board of Directors and the Managing Director (management) are responsible for the preparation in accordance with law and regulations, including fair presentation of the financial statements in accordance with the Norwegian Accounting Act and accounting standards and practices generally accepted in Norway, and for such internal control as management determines is necessary to enable the preparation of financial statements that are free from material misstatement, whether due to fraud or error.
In preparing the financial statements, management is responsible for assessing the Company’s and the Group’s ability to continue as a going concern, disclosing, as applicable, matters related to going concern. The financial statements use the going concern basis of accounting insofar as it is not likely that the enterprise will cease operations.
Auditor’s Responsibilities for the Audit of the Financial Statements
Our objectives are to obtain reasonable assurance about whether the financial statements as a whole are free from material misstatement, whether due to fraud or error, and to issue an auditor’s report that includes our opinion. Reasonable assurance is a high level of assurance, but is not a guarantee that an audit conducted in accordance with laws, regulations, and auditing standards and practices generally accepted in Norway, including ISAs will always detect a material misstatement when it exists. Misstatements can arise from fraud or error and are considered material if, individually or in aggregate, they could reasonably be expected to influence the economic decisions of users taken on the basis of these financial statements.
As part of an audit in accordance with laws, regulations, and auditing standards and practices generally accepted in Norway, including International Standards on Auditing (ISAs), we exercise professional judgment and maintain professional scepticism throughout the audit. We also:
• identify and assess the risks of material misstatement of the financial statements, whether due to fraud or error. We design and perform audit procedures responsive to those risks, and obtain audit evidence that is sufficient and appropriate to provide a basis for our opinion. The
Independent Auditor's Report - Grieg Maturitas AS
(3)
risk of not detecting a material misstatement resulting from fraud is higher than for one resulting from error, as fraud may involve collusion, forgery, intentional omissions, misrepresentations, or the override of internal control.
• obtain an understanding of internal control relevant to the audit in order to design audit procedures that are appropriate in the circumstances, but not for the purpose of expressing an opinion on the effectiveness of the Company's or the Group's internal control.
• evaluate the appropriateness of accounting policies used and the reasonableness of accounting estimates and related disclosures made by management.
• conclude on the appropriateness of management’s use of the going concern basis of accounting and, based on the audit evidence obtained, whether a material uncertainty exists related to events or conditions that may cast significant doubt on the Company’s ability to continue as a going concern. If we conclude that a material uncertainty exists, we are required to draw attention in our auditor’s report to the related disclosures in the financial statements or, if such disclosures are inadequate, to modify our opinion. Our conclusions are based on the audit evidence obtained up to the date of our auditor’s report. However, future events or conditions may cause the Company to cease to continue as a going concern.
• evaluate the overall presentation, structure and content of the financial statements, including the disclosures, and whether the financial statements represent the underlying transactions and events in a manner that achieves fair presentation.
• obtain sufficient appropriate audit evidence regarding the financial information of the entities or business activities within the Group to express an opinion on the consolidated financial statements. We are responsible for the direction, supervision and performance of the group audit. We remain solely responsible for our audit opinion.
We communicate with the Board of Directors regarding, among other matters, the planned scope and timing of the audit and significant audit findings, including any significant deficiencies in internal control that we identify during our audit
Report on Other Legal and Regulatory Requirements
Opinion on the Board of Directors’ report
Based on our audit of the financial statements as described above, it is our opinion that the information presented in the Board of Directors’ report concerning the financial statements, the going concern assumption is consistent with the financial statements and complies with the law and regulations.
Independent Auditor's Report - Grieg Maturitas AS
(4)
Opinion on Registration and Documentation
Based on our audit of the financial statements as described above, and control procedures we have considered necessary in accordance with the International Standard on Assurance Engagements (ISAE) 3000, Assurance Engagements Other than Audits or Reviews of Historical Financial Information, it is our opinion that management has fulfilled its duty to produce a proper and clearly set out registration and documentation of the company’s accounting information in accordance with the law and bookkeeping standards and practices generally accepted in Norway.
Bergen, 4 April 2017 PricewaterhouseCoopers AS Jon Haugervåg State Authorised Public Accountant
grieg.no