Anil Arya Ohio State University Brian Mittendorf Yale
33
Supply Chains and Segment Profitability: How Input Pricing Creates a Latent Cross-Segment Subsidy Anil Arya Ohio State University Brian Mittendorf Yale School of Management August 2009
Transcript of Anil Arya Ohio State University Brian Mittendorf Yale

Supply Chains and Segment Profitability:
How Input Pricing Creates a Latent Cross-Segment Subsidy
Anil Arya
Ohio State University
Brian Mittendorf
Yale School of Management
August 2009

Supply Chains and Segment Profitability:
How Input Pricing Creates a Latent Cross-Segment Subsidy
Abstract
Recent years have seen an increasing emphasis on developing more precise accounting
measures of market- and customer-level profitability. These efforts are aimed at helping
prune unprofitable constituencies and targeting resources to more profitable segments. This
paper demonstrates that even if perfected, such refined segment profitability measures may
unwittingly neglect a latent cross-subsidization effect linked with firm participation in
multiple markets. In particular, when a firm relies on a privately informed supplier for
inputs used across markets, the wholesale price it pays depends on the average profitability
of its markets. Thus, if a firm were not to serve its less profitable markets, it may face a
steeper wholesale price. Taking such interaction between upstream pricing and the firm's
downstream reach into account, the paper shows that: (i) segment profit calculations can
understate or overstate the value added by the segment depending on the segment's relative
contribution margin, and (ii) the firm sometimes benefits from devoting resources to less
profitable segments and perhaps even from serving unprofitable markets and/or customers.

I. Introduction
Accountants have been persistent in attempts to generate disaggregate data that
provides meaningful measures of segment profitability, both at the market and customer
levels. While joint costs and resource utilization have long been a sticking point in such
endeavors, recent developments stemming from activity-based costing (ABC) and customer
lifetime value (CLV) analysis have been highly touted as means of better divining which
markets and customers to service and how much resources to devote to them. As a result,
reliance on such measures has grown substantially in recent years.
While the desire to finely parse performance is certainly commendable, history is
rife with examples in which seemingly perfect performance measures failed to fully reflect
opportunity costs of decisions.1 In the context of market- and customer-level profitability,
the benefits of having a loss leader product for complementary demand-side effects on other
products or incurring sustained losses for competitive posturing (e.g., dumping or predatory
pricing) have been well recognized, and practitioners frequently account for such spillover
effects in making resource allocation decisions. The notion of freebie marketing, pioneered
by Gillette, is a prominent example. Despite routine losses on cheap or even free razors,
firms keep such lines in operation because they create captive consumers for their (more
profitable) razor blade lines.
In this paper, we demonstrate that in addition to the well-known demand-side
spillovers, supply-side spillovers too may be present necessitating adjustments to segment
profits in order to evaluate the value added by a segment. In particular, we show that even if
market and customer profitability measures perfectly reveal individual segment profitability,
they do not fully reflect the latent cross-subsidization that can arise when a multi-segment
firm relies on a supplier for key inputs. The cross-subsidization stems from the fact that
1 Commonly discussed examples include the fact that accounting accruals occur in undiscounted termsand thus fail to reflect the cost of capital, product line costs do not reflect constrained capacity, andfixed cost allocations potentially induce a "death spiral" (see, for example, Zimmerman 2003).

2
supplier pricing is influenced by the extent and profitability of the firm's downstream reach.
Thus, resource allocation that is based solely on segment profits fails to fully incorporate
the positive supply chain ramifications obtained from serving less profitable markets.
The notion that less profitable segments may help place downward pressure on
wholesale prices for more profitable segments can intuitively be seen through an
intertemporal analog. When downstream market conditions deteriorate over time, firms
often obtain more favorable upstream pricing terms. Examples include supplier price
breaks for automobile firms in the wake of falling domestic sales; lower wholesale prices
for CDs and DVDs due to competition from digital media; and labor concessions in
response to unfavorable earnings news (e.g., Bova 2008; Menn 2006). In other words, as
retail profitability goes up and down over time, so too do input prices.
The premise in this paper is that such time-series phenomena can also arise in the
cross-section of a multi-segment firm. That is, less profitable segments can often keep
input prices low for other, more profitable, segments. As an example, when Target
complained of low margins on DVD sales due to competition from digital downloads,
Disney responded by cutting a deal for reduced-fee licensing of clothing lines (Menn
2006). Similarly, easyJet, a prominent no-frills air carrier, was able to obtain favorable
prices in a contract with Airbus in part by stressing the low margins it obtains in several of
its routes (Prada 2002). In these cases, the value added by an underperforming segment (be
it DVDs or low-profit routes) went beyond the profit of the segment due to its beneficial
effect on supplier pricing for other segments (be they clothing lines or high-profit routes).
More broadly, the point stressed herein is that the input prices secured by a
conglomerate depend on the conditions faced by the portfolio of markets in which it
operates. As a result, altering the portfolio of markets a firm serves will alter the supply
environment as well. It may be tempting to conclude that a large retail conglomerate that has
expanded beyond the "low hanging fruit" of its prime markets to markets with more modest
profitability is able to secure lower input prices due to the buyer power its size affords. The

3
results here suggest that there may be more to buyer power than mere size: prices are
affected by average market conditions and expansion to less profitable markets has the
concomitant silver lining of lower overall input pricing.2 Besides demonstrating such a
cross-subsidization due to supplier pricing, the results herein may provide some justification
for a variety of puzzling phenomenon, from perceptions of corporate socialism to the
staying power of full-service retailers.
Formally, we consider a basic model of a supplier and buyer under which the buyer
operates in multiple segments. The supplier, who is privy to its own costs, produces and
transfers inputs (e.g., labor, materials) to the buyer, who uses the inputs in its various
segments (e.g., markets, geographical areas, or customer groups). The parties agree to a
supply contract that stipulates the price and usage of inputs conditioned on the supplier's
reported cost. Supply chain frictions arise because private information provides the supplier
an opportunity to overstate its costs so as to extract greater profit from the buyer. Aware of
this possibility, the buyer commits to reducing volume for high cost reports. As is typical in
such settings, the buyer weighs information rents (manifest in wholesale price markups)
with restricted purchase quantities when designing the preferred supply contract. The
question we ask is how this familiar production-rents tradeoff can induce a divergence
between segment value added and segment profit measurement.
Intuitively, the supplier profits from a markup above cost. The size of the markup is
tied to the supplier's information advantage as well as to the buyer's potential (downstream)
profitability from utilizing the inputs. As might be expected, the higher is the average
profitability of the buyer's segments, the more it is willing to pay for the input, and the
greater is the wholesale price. This implies that each segment's impact on the markup is tied
to its relative profitability. In particular, serving a segment with less-than-average
2 As an example, the major American auto makers have argued that their large dealer networks to ruraland less-profitable metropolitan areas (as compared to the small, targeted dealership network of theirforeign counterparts) make them deserving of lower prices from parts suppliers, more favorable laborcontracts, and even cheaper capital (from government loans).

4
profitability lowers the markup, a benefit obtained by inputs procured in all segments.
Segment profit calculations, of course, focus on the realized input price, missing out on such
cross-segment effects.
Put slightly differently, if the firm ceased operation in one of its less profitable
segments, firmwide profit would decrease by more than indicated by segment profit figures
due to the fact that the low-profit segment plays a larger role in cutting the required supplier
wholesale price markup. Since such wholesale price adjustments are off-equilibrium, they
are not reflected in (on-equilibrium) profit calculations and, as such, represent a latent
subsidy provided by less-profitable markets to more-profitable markets. This force, in turn,
means that retaining an unprofitable market may even be the right course of action for a
profit-maximizing firm.
Practitioners routinely criticize firms for maintaining unprofitable segments, while
academics frown upon apparent corporate socialism in that a small set of highly profitable
divisions are often seen to support the many far less profitable divisions. While such
criticisms may often be well deserved, the analysis herein demonstrates a caveat: divisions
with low (or even negative) profitability are not necessarily a drag on overall profits as they
can help support lower input prices. In fact, when a firm relies on an external supplier for
key inputs, the positive input pricing benefits an underperforming division heaps on
overperforming divisions may negate the notion of corporate socialism. Further, due to the
upstream pricing effect, a firm that blindly eliminates segments on the basis of them being
unprofitable does so at its own peril. What may seem like benign trimming of unseemly
dimensions of a firm's operations may turn out to induce a death spiral. The typical death
spiral is driven by a tendency to assign costs which are fixed with respect to the keep-or-
drop decision in a way that they appear variable. In our supply chain setting, a death spiral
arises where a cost which is variable with respect to the keep-or-drop decision (wholesale
price) is treated as fixed.
Another circumstance in which segment profit calculations are relied upon is when a
5
retailer can serve a variety of customer groups, some of which are more profitable than
others.3 A recent incarnation of this issue is the retailer conundrum of reaching customers
via an online arm, bricks-and-mortar store, or both. The expansion of online sales has
typically been viewed as a challenge to traditional retailers and even as a precursor to their
elimination. Yet, while online retailers have thrived, traditional retailers have maintained a
strong presence, suggesting rumors of their death have been exaggerated. In fact, many of
the most svelte online operations (e.g., Dell, Gateway, Apple) have opted to open traditional
outlets as a means of serving less tech-savvy customers. Viewed in the context of this
paper's results, the mutual success of online and traditional retail channels each operated
under the auspices of one firm may not be as surprising even if traditional channels
perpetually run at a loss. The results herein suggest that having "loss leader customers" can
put downward pressure on wholesale prices which, in turn, can boost margins obtained on
the more profitable consumers.
Broadly speaking, the theme of this paper lies at the intersection of discussions
about measuring segment profitability and coordinating self-interested supply chain
partners. In the realm of profitability measurement, activity-based costing (ABC) has
created a substantial shift in the ability to track profits at the market or customer level (e.g.,
Cooper and Kaplan 1988). Through improved cost allocations, these processes are viewed
both by academics and practitioners as critical to properly evaluating product line choices,
resource allocation across segments, and keep-or-drop decisions (e.g., Goebel et al. 1998;
Searcy 2004; Sopariwala 2005). At the customer level, ABC and customer lifetime value
(CLV) calculations are used jointly to evaluate which customers to serve and target (e.g.,
Hogan et al. 2002; Kuchta and Troska 2007; Searcy 2004; Venkatesan and Kumar 2004).
While significant efforts have been made to incorporate effects of downstream competition
3 Technically speaking, different customer groups can present a circumstance distinct from differentproduct lines in that retail price discrimination among different consumers for the same product is oftenprohibited and, even when permitted, may be impractical. Our analysis of this case includes such retailpricing constraints.

6
and demand-side complementarities in such calculations, this paper points to strategic
upstream supplier pricing as another consideration.
Supply chain frictions have been scrutinized by researchers in many areas of
management. A fundamental concern at the forefront of such studies is the inherent conflict
of interest in pricing. While supply chain partners have many common goals, individual
interests can lead to inefficiencies that harm all. Since Spengler's (1950) analysis of
double-marginalization, many studies have considered the extent of pricing-induced
distortions in supply chains and the myriad of means to alleviate such distortions (for
summaries, see Katz 1989 and Lariviere 2008). This stream of work has also considered a
variety of other conflicts of interest, including moral hazard among supply chain participants
(Baiman et al. 2000; Saouma 2008), the role of private information and innovation (Baiman
and Rajan 2002), and performance measurement (Baiman et al. 2001). In this paper, we
examine whether (and how) such supply chain coordination concerns interact with decisions
an input buyer makes with regard to the markets it serves. In doing so, we demonstrate a
supply chain induced interdependency among product lines (and customers) in a
conglomerate that is not reflected in standard segment profit calculations.
The remainder of this paper proceeds as follows. Section 2 presents the basic
model. Section 3 presents the results: 3.1 identifies the equilibrium supply contracts; 3.2
compares segment profit and segment value added; and 3.3 considers an application to
customer-level profitability analyses and examines the consequences of uniform pricing.
Section 4 revisits the analysis under more simple (and common) supply chain contracts.
Section 5 concludes.
2. Model
A downstream (retail) buyer relies on an upstream (wholesale) supplier for a key
input. The supplier produces the input at a constant unit cost, c, c ∈[cL ,cH ]. Because of
its expertise and proximity to operations, the supplier is privately informed of the precise

7
value of c. The buyer is only aware of g(c), the (common knowledge) probability density
function of c; the associated cumulative distribution function is G(c). As is standard, we
presume the hazard rate of the distribution is monotonic, i.e., ′H (c) ≥ 0, where
H(c) = G(c) g(c) .4
The retailer serves n segments, n ≥ 2, and requires one unit of input per unit of
output in each segment. In segment i, i = 1,K,n , the retailer is a monopolist and faces an
inverse consumer demand curve pi = ai − qi , where ai is the demand intercept, pi is the
retail price for each unit and qi is the number of units sold in segment i. The selling and
operating cost for segment i is viqi + Fi where vi is the (per unit) variable cost and Fi is the
fixed cost of downstream operations. For ease of notation, define α i = ai − vi and
α n =α ii=1
n∑n
. That is, αi is the demand intercept net of variable cost for segment i and
α n is the cross-segment average α -value. To ensure nontrivial participation in each
segment (i.e., interior solutions), we assume αi > cH + H(cH ).
Given these supply and demand conditions, the buyer and supplier agree to a supply
contract that specifies quantities used in each segment, q , q = {qi}i=1n , and the (per unit)
wholesale price, w. Under such a contract, segment i profit, i = 1,K,n , is π i (qi ,w) ,
πi (qi ,w) = [ai − qi ]qi − wqi − viqi − Fi , and the firm's profit from the first s segments, s ≤
n, is Π s (q,w), Πs (q,w) = πi (qi ,w)i=1s∑ .
To determine the buyer's optimal supply contract, from the Revelation Principle
(Myerson 1979), it is without loss of generality to restrict attention to direct revelation
mechanisms that induce truthful supplier reporting. That is, upon deciding to operate in n
segments, the buyer commits to a menu of contracts specifying {q(c),w(c)}, where
q(c) = {qi (c)}i=1n represents the (vector of) inputs purchased and w(c) denotes the
wholesale price given a supplier cost report of c , c ∈[cL ,cH ]. The buyer's chosen menu
4 The monotone hazard rate assumption ensures the "local" incentive constraints are binding in traditionaladverse selection models. The assumption is satisfied by several common distributions, includinguniform, normal, logistic, chi-squared, exponential, and Laplace. For more on this and the related issueof log-concavity, see Bagnoli and Bergstrom (2005).

8
solves program (P). In the program, the (IR) constraints require that the supplier receive a
minimum level of profit, normalized to zero, while the (IC) constraints require that the
supplier's profit when providing a truthful cost report is at least as high as under any other
cost report.
(P) Max{q(c),w(c)}
[Πn (q(c),w(c))]cL
cH∫ g(c)dc
s.t. [1 ⋅q(c)][w(c) − c] ≥ 0 ∀c (IR)
[1 ⋅q(c)][w(c) − c] ≥ [1 ⋅q(c)][w(c) − c] ∀c, c (IC)
Denote the solution to (P) by {qn(c),wn(c)}, where qn(c) = {qin(c)}i=1
n . Given this
setup, our interest is in determining the value added by a segment. Without loss of
generality, consider the value of segment n. Using the above notation, in equilibrium,
segment n's realized accounting profit, denoted by πn∗(c) , is πn
∗(c) = πn(qnn(c),wn(c)),
while firm-wide profit is Πn(qn(c),wn(c)) . The value added by segment n is firm profit
with segment n less firm profit that would be realized in the absence of segment n. That is,
t h e v a l u e a d d e d b y s e g m e n t n , d eno t ed Vn(c) , i s
Vn (c) = Πn (qn (c),wn (c)) − Πn−1(qn−1(c),wn−1(c)) . The question we address in
subsequent analyses is if and how accounting segment profit, πn∗(c) , differs from segment
value added, Vn(c) .
3. Results
3.1. Equilibrium Supply Contracts
Before comparing the accounting measure of segment value with the underlying
value added by a segment, we first derive the equilibrium outcome for operations in a given
set of segments. Then, comparing outcomes under n vs. n-1 segments can provide a full
characterization of the effects of segment n on firm profit. With n segments, n ≥ 2, the

9
solution to (P) can be determined as follows. First, as one may expect, contractual
inefficiency arises because the supplier is tempted to overstate its cost so as to secure a
higher wholesale price. And, since there is no possibility of such overreporting for c = cH ,
the (IR) constraint binds (only) in that case, i.e., w(cH ) = cH . Turning to the (IC)
constraints, the solution is eased by replacing these constraints by their "local" counterparts.
In particular, the "local" (IC) constraint specifies:
[1 ⋅q(c)][w(c) − c] = [1 ⋅q(c)]ccH∫ dc . (1)
Intuitively, the "local" (IC) condition in (1) demonstrates that if the buyer orders
greater quantities (greater 1 ⋅q(c)) for a cost realization c , it requires providing a more
attractive combination of prices (higher w(c)) and/or purchase quantities (higher 1 ⋅q(c) )
for all lower c-values so as to induce truthful revelation. So, in choosing purchase
quantities, the buyer equates its marginal revenues with marginal costs where the costs
include not just the traditional production and sales cost but also the cost of information
rents paid to the privately informed supplier. Given such procurement volume, then, the
wholesale price is set so as to satisfy (1). In particular, Lemma 1 presents the solution to
(P). (Formal proofs are provided in the appendix.)
Lemma 1. If the firm operates in n segments, the equilibrium outcome entails:
(i) qin (c) = [1 2][α i − c − H(c)]; and
(ii) wn (c) = c +[α n − c − H(c)]dcc
cH∫
α n − c − H(c).
The lemma provides a crisp presentation of the above intuition. In Lemma 1(i), the
quantity procured for use in segment i, i = 1,K,n , depends on the benefit of purchases net
of downstream cost in that segment (αi ), less the supplier's direct cost (c), less the
supplier's information rents ( H(c)). The information rents term, H(c), reflects that an
increase in purchases for a given c affects revenues (via a g(c) consequence) but requires

10
additional payments for all lower costs (via a G(c) consequence).
The quantities in Lemma 1(i), coupled with the local (IC) constraint in (1), yield the
agreed-upon wholesale price in Lemma 1(ii). The wholesale price reflects a cost-
reimbursement (c) plus a markup for information rent. Importantly, the markup depends on
average segment profitability (α n), and is increasing in this measure:
d[wn (c) − c]
dα n =[c + H(c) − c − H(c)]dcc
cH∫
[α n − c − H(c)]2 ≥ 0.
Intuitively, the more attractive procurement is to the buyer, the less willing the buyer
is to cut production and, thus, the more willing it is to grant the supplier rents via a higher
wholesale price. This supply chain inter linkage – the upstream price markup depends on
the average profitability of downstream segments – proves critical in our analysis. The
linkage implies that each segment's impact on the wholesale price depends on how it
changes average segment profitability.
Using the supply contract in Lemma 1, the expected buyer profit (the objective
function value in (P)) is E{Πn (qn (c),wn (c))} = [1 / 4] E{[α i − c − H(c)]2}i=1n∑ − Fii=1
n∑ .
Given the equilibrium contract, we next consider if and how segment profit differs from
segment value added.
3.2. Segment Value Added vs. Segment Profit
Segment profit is the primary means through which a firm (and outsiders) view the
contribution each segment makes to the firm's overall profit. When evaluating a segment's
worth, it is often discussed that accounting profit measures may leave out positive (or
negative) demand-side spillovers across segments. In particular, one product line may be a
"loss leader" in that its segment profit is negative yet it is worth maintaining due to its
positive effect on the demand for other, more profitable, product lines. Inkjet printers
represent a prominent example – printers are often sold near or below cost, but create a
11
captive customer for cartridges which are sold at a substantial profit. In that case, looking at
poor margins on printers reflected in segment profit clearly does not represent the whole
story.
In a similar manner to such demand-side effects, this paper seeks to identify the role
of supply-side effects on segment value added. In both cases, accounting segment profit
figures fairly reflect "what is" but may fail to answer "what if." Segment value added, on
the other hand, is a measure of the incremental value of a segment in that it compares current
firm value with the value that would have been attained in the absence of that segment. As
the following lemma demonstrates, the difference between segment profit and segment value
added can crisply be captured by supply-side and demand-side spillovers.
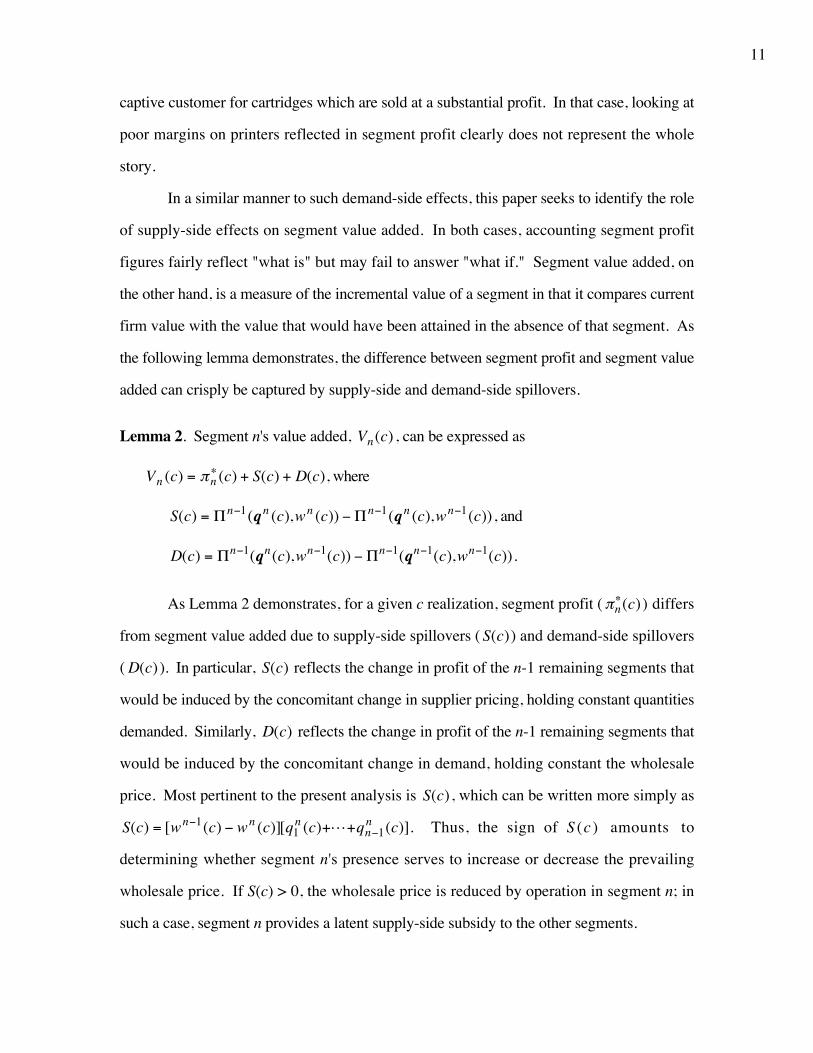
Lemma 2. Segment n's value added, Vn(c) , can be expressed as
Vn (c) = πn∗ (c) + S(c) + D(c), where
S(c) = Πn−1(qn (c),wn (c)) − Πn−1(qn (c),wn−1(c)), and
D(c) = Πn−1(qn(c),wn−1(c)) − Πn−1(qn−1(c),wn−1(c)).
As Lemma 2 demonstrates, for a given c realization, segment profit (πn∗(c) ) differs
from segment value added due to supply-side spillovers ( S(c)) and demand-side spillovers
( D(c) ). In particular, S(c) reflects the change in profit of the n-1 remaining segments that
would be induced by the concomitant change in supplier pricing, holding constant quantities
demanded. Similarly, D(c) reflects the change in profit of the n-1 remaining segments that
would be induced by the concomitant change in demand, holding constant the wholesale
price. Most pertinent to the present analysis is S(c), which can be written more simply as
S(c) = [wn−1(c) − wn (c)][q1n (c)+L+qn−1
n (c)]. Thus, the sign of S (c ) amounts to
determining whether segment n's presence serves to increase or decrease the prevailing
wholesale price. If S(c) > 0, the wholesale price is reduced by operation in segment n; in
such a case, segment n provides a latent supply-side subsidy to the other segments.

12
Determination of the extent of both the supply-side and demand-side effects
requires simply substituting the values for qn(c), qn−1(c), wn(c), and wn−1(c) from
Lemma 1 into Πn−1(q(c),w(c)). This exercise reveals that the value added by segment n is
Vn (c) =14
[αn − c]2 − [H(c)]2 − 2 [αn − c − H(c)]dcccH∫( ) − Fn. Further, denoting the
segment i (per unit contribution) margin by mi (c) = [α i − qin (c)]− wn (c) , and the cross-
segment average margin by m(c) = mi (c)i=1n∑ n , the following proposition follows.
Proposition 1.
(i) S(c) = [1 / 2][α n − αn ]k(c), and D(c) = 0, where
k(c) =[c + H(c) − c − H(c)]dcc
cH∫α n − c − H(c)
≥ 0 ; and
(ii) Segments with lower (higher) margins have profit that understates (overstates) the value
they provide for all c < cH . That is, if mn(c) < m(c) , then πn∗(c) < Vn(c) , and if
mn(c) > m(c) , then πn∗(c) > Vn(c) .
Two implications follow immediately from Proposition 1(i). First, since D(c) = 0,
this setting is one in which there are no demand-side spillovers from one segment to
another. Because the upfront contract entails commitment to production levels for each
segment and each segment's demand is presumed to be independent of the operations in
other segments, the removal of one segment only affects wholesale pricing and not
procurement quantities in the other segments. Second, provided α n ≠ αn, there are supply-
side spillovers across segments not reflected in the segment profit calculations.
Proposition 1(ii) demonstrates that the nature of supply-side spillovers can be
captured succinctly by looking at segment margins. If segment n's margin is below average,
its presence helps keep wholesale price low. As such, the segment's value added is greater
than what segment profit indicates, reflecting a latent cross-subsidization of the other, more
profitable, segments. Recall, the extent to which the buyer is willing to hand over rents (in
the form of a greater wholesale price) depends on the average profitability of the segments

13
in which it operates (reflected in α n ). If the buyer operates without a less profitable
segment, it implicitly increases the (per unit) rents it is willing to hand over. This, in turn,
leads to an increase in the wholesale price.
Besides demonstrating an inherent inter linkage in segments when a firm relies on
external input supply, the proposition may shed some light on the widely held view that in
multi-segment firms, underperforming segments are propped up by overperforming
segments (e.g., Gertner et al. 2002; Rajan et al. 2000; Shin and Stulz 1998). Since such
findings are derived in part from accounting segment profit measures, they may not reflect
the latent input price subsidy provided in the reverse direction, i.e., a subsidy to
overperforming segments provided by an underperforming segment.
Even more broadly, the proposition suggests that a firm with multiple segments
which utilize common inputs would exhibit seemingly excessive (constrained) investment in
underperforming (overperforming) segments, despite such behavior being value-
maximizing. Viewed in this light, apparent inefficiencies in resource allocation may not be
evidence of value destruction from diversification but rather reflect a form of selection bias
in that multi-segment firms are inherently different from their single-segment counterparts
(e.g., Chevalier 2004). Roughly stated, contrasting a multi-segment firm with a linear
disaggregation of its segments misses out on the fact that third-party relationships of
presumptive stand alone segments may be strikingly different than those nurtured by the
aggregate firm. Clearly, such shifts have to be accounted for in order to calculate a
meaningful segment diversification discount/premium. If this view were borne out
empirically, then one would expect the most (least) profitable divisions of a multi-segment
firm to perform better (worse) than their single segment counterparts. Further, this feature
would be expected to be more pronounced the more critical input supply is to the multi-
segment firm.
The input pricing effect of an underperforming segment can also translate into the
firm benefiting from retaining a segment that is, at least in accounting terms, unprofitable.

14
Since segment profit fails to reflect the wholesale price effect of maintaining a low-margin
segment, its value is understated. And, if the segment also faces substantial fixed operating
costs, the understatement may even lead to the segment being classified as not viable. In
particular, comparing segment value added and segment profit, and taking expectations
yields the following proposition.
Proposition 2. If mn(c) < m(c) , and Fn ∈(F, F), expected profit of segment n is negative
while expected value added by segment n is positive, where
F = [1 / 4]E{[αn − c − H(c)]2}− [1 / 2][α n − αn ]E{k(c)}, and
F = [1 / 4]E{[αn − c − H(c)]2}.
The proposition provides a contrast to the view that by precisely tracing costs and
revenues to product lines (segments), Activity-Based Costing (ABC) provides an ideal
metric for keep-or-drop decisions (e.g., Devine et al. 2005; Sopariwala 2005). While the
typical concern in tracking product line profitability is that allocated fixed costs may
incorrectly be viewed as variable, a wholly different problem arises here. With input pricing
effects of market reach in play, it turns out that a variable cost with respect to the keep-or-
drop decision (wholesale price) is treated as fixed in any accounting treatment (since
accounting naturally only tracks equilibrium outcomes) – even though wholesale price is the
same for all segments of the firm that utilize the same input, that does not mean the input
price will not change once a segment is dropped.
The following two-segment numerical example demonstrates the first two
propositions, exhibiting a stark contrast to conventional wisdom: α1 = 30 , α2 = 20,
F1 = 110, F2 = 30, and c is uniformly distributed over [0,10]. For the example, Table 1
describes the equilibrium quantities, wholesale price, expected segment profits, and expected
firm profits under all possible keep-or-drop scenarios. In the table, given the buyer's market
reach, its optimal production level and wholesale price are determined using Lemma 1;

15
segment i's expected profit is E{[α i − qi ]qi − wqi}− Fi if the firm operates in segment i
and 0, otherwise; and the firm's expected profit is the sum of the segment profits.
Firm's market
reachq1(c) q2 (c) w(c)
Segment 1's
expected profit
Segment 2's
expected profit
Firm's expected
profit
Segments 1 & 2 15 - c 10 - c 150 − c2
25 − 2c2.716 -1.049 1.667
Segment 1 15 - c 0 200 − c2
30 − 2c-1.667 0 -1.667
Segment 2 0 10 - c 5 + c / 2 0 3.333 3.333
Table 1: Firm's optimal horizontal reach.
In the absence of information asymmetry (first-best), with wholesale price equal to c,
it is optimal for the firm to operate in both segments, and produce 15 − c / 2 and 10 − c / 2
in segments 1 and 2, respectively. From Table 1, the optimal wholesale price, production,
and reach are all impacted by information asymmetry. In this second-best setting, where
supply chain frictions are nontrivial, the firm pays more than c (i.e., the supplier earns
information rents) and production is cut for all c other than at the "top" (i.e., c = 0) in
response.
If the firm opts to operate in both markets, as would be suggested by the first-best
setting, the resulting segment profit calculations seemingly imply that the firm is better off
operating only in segment 1 since it is the only segment with positive profit. However, this
argument misses the fact that when the firm's horizontal reach changes, so does its
wholesale price. In particular, note the expected margins of segment 1 and segment 2 are
11.75 and 6.75, respectively. From Proposition 1, it then follows that operating in only the
high-margin segment (segment 1) results in an increase in w(c): 200 − c2
30 − 2c>
150 − c2
25 − 2c.
As can be gleaned from the table, not only is expected segment profit a poor
measure of the value added by segment 2 due to the latent input pricing subsidy it provides

16
to segment 1, but that difference may incorrectly imply that the firm would be better off
without segment 2. In fact, if one were to utilize the segment profit measure as the
determinant of the keep-or-drop decision, the decision to drop the losing segment 2 and
keep segment 1 would lead to a circumstance in which the remaining segment is then
unprofitable. In other words, wholesale pricing effects can introduce a death spiral of sorts,
despite the fact that the fixed costs of operating in each segment are presumed to disappear
along with the segment. That is, while the usual death spiral arises due to treating a fixed
(common) cost as variable with respect to the keep-or-drop decision, in this case the
problem is that a cost which is variable with respect to the keep-or-drop decision (wholesale
price) is treated as fixed.
Importantly, as a result of the latent subsidy segment 2 provides to segment 1, not
only is segment 2's contribution to firm profit understated, but segment 1's contribution to
firm profit is overstated. This effect yields a stark reversal in the example: while the
segment profit calculations in the first row of the table might lead one to conclude the firm
should operate only in segment 1, the firm's preferred reach is to operate only in segment 2.
3.3. Customer Profitability Analysis
The emphasis in the analysis thus far has decidedly been on analyzing value added
by particular segments, product lines, or stores that rely on related inputs. Though these
represent more traditional units of accounting analysis, recent developments in more micro-
level profitability calculations suggest further application at the individual customer level. In
particular, recent years have seen expanded use of Activity-Based Costing (ABC) to
determine the costs of serving different customers and, thereby, to determine which
customers to target and how much resources to devote to each. As an example, retail firms
routinely serve customers that require little or no customer service (e.g., on-line buyers) as
well as those requiring substantial service (e.g., bricks-and-mortar shoppers seeking
purchase advice). Similarly, some retailers offer no-questions-asked returns to

17
heterogeneous consumers, some of whom never return products whereas others are deemed
serial returners. These circumstances often prompt consideration of whether firms should
offer these additional services so as to "be all things to all customers" or whether they
should develop a "no-frills" niche. In making such decisions, customer-level profitability
analysis plays an integral role.
Provided the firm can charge different prices to different consumer-types (i.e., offer
only on-line discounts, charge restocking fees for returns, etc.), customer-level analysis is
readily seen to be a special case of the preceding analysis. Roughly speaking, say
customers fall into one of two groups, the no-frills customers (segment 1) and the full-
service customers (segment 2). Though the two types have equal willingness to pay,
a1 = a2 = a , the cost of selling and servicing the customer groups is different, v2 > v1.
Given this classification, the following corollary presents an application of Proposition 1 to
the case of customer profitability calculations.
Corollary 1. Customer profitability calculations understate the benefits of full service
sales, i.e., π2∗ (c) < V2 (c) for all c < cH .
In other words, despite being less profitable, full service customers have an upside
not reflected in customer profitability calculations in that they help put downward pressure
on wholesale prices. If the buyer (retailer) were instead to focus on higher margin
customers, they would be faced with a higher wholesale price. Again, despite the fact that
the inputs are identical across consumer-types, the fact that they entail differential
profitability means that the input price depends on the portfolio of ultimate consumers.
And, as the portfolio changes, so does input pricing.
A natural follow-up question may be how the results change if the retailer is unable
to charge different prices to different consumers. Such prohibitions on price discrimination
at the retail level may arise due either to regulatory restrictions or practical considerations
(e.g., it is hard to track how much time a particular sales agent spends with a customer and

18
thus impractical to charge customers for such time). In such circumstances, the contract has
an additional restriction that the prevailing retail price across groups is the same, i.e.,
a − q1(c) = a − q2(c).
In this case, if the firm operates only in the no-frills market, the solution is as
prescribed by Lemma 1 for n = 1. That is, the firm procures q11(c) units at a per-unit price
of w1(c). When the firm serves both consumer groups, the solution to the revised
contracting program ((P) with the added uniform pricing constraint) entails a simple
adjustment to the previous contract: the buyer procures [1 / 2][q12 (c) + q2
2 (c)] units for each
of its two segments. And, since total procurement is the same as without the equal pricing
constraint, the agreed-upon wholesale price is w2 (c), also as before. In this case, the
expected firm profit is [1 / 2]E{[a − [1 / 2][v1 + v2 ]− c − H(c)]2}− F1 − F2. Another way
of viewing the outcome is that it is the same as under unrestricted retail price discrimination,
with the vi in each market being of "average" value. Relative to when the firm only operates
in the no-frills market, by serving both types of customers, the effective variable cost in
market 1 increases from v1 to [1 / 2][v1 + v2 ] which translates into a lowering of wholesale
price, a subsidy not accounted for in segment profit calculations for market 2. That is, the
same supply-side consideration highlighted in Proposition 1 and Corollary 1 persists even
in the case of uniform retail pricing restrictions.
In the case of uniform retail pricing, however, there is also a demand-side
consideration. Not only does the segment profitability figure fail to reflect the wholesale
pricing spillover that operation in the full service market entails, but it also fails to reflect the
retail pricing spillover. Intuitively, if the firm operates only in the cheaper no-frills market, it
is able to set lower retail prices (procure higher quantities). With operation in both no-frills
and full service markets, the firm considers average profitability and, thus, sets a higher retail
price. Proposition 3 provides a succinct characterization of both the supply-side and
demand-side effects.

19
Proposition 3. In the case of customer profitability analysis and uniform retail pricing,
S(c) = [1 / 4][v2 − v1]t(c) ≥ 0, and
D(c) = [1 / 4][v2 − v1][cH − (1 / 4)(v2 − v1) − c − H(c) − t(c)], where
t(c) =[c + H(c) − c − H(c)]dcc
cH∫a − v1 − c − H(c)
≥ 0.
Note that S(c) in Proposition 3 is similar to that in Proposition 1, with n = 2, and
a1 = a2 = a (the difference being k(c) vs. t(c)). In other words, restrictions on retail-level
price discrimination have no substantive effect on the paper's main consideration of
wholesale price consequences of extended market reach. The difference now is that there is
also a demand-side effect, D(c). While the supply-side effect represents a latent subsidy
from serving full-service customers, the demand-side effect is sure to be a tax at large c.
Since the demand side condition too depends critically on the relative margins of the two
customer lines, so does the net effect of S(c) + D(c).
In particular, for m(c) − m2 (c) < 2[cH − c − H(c)], π2∗ (c) < V2 (c) , and for
m(c) − m2 (c) > 2[cH − c − H(c)], π2∗ (c) > V2 (c) . Note m(c) − m2 (c) > 0 in line with
segment 2 having a lower margin ( v2 > v1). Hence, for sufficiently large c (and surely for c
such that cH − c − H(c) < 0), π2∗ (c) > V2 (c) – the negative demand-side externality of
serving full-service customers outweighs the positive supply-side externality, so the
requirement of uniform retail pricing reverses the ordering in Corollary 1. Even in this case,
the demand-side tax is moderated by the wholesale price subsidy provided by operations in
the full-service market. Thus, the broader point to take from the analysis is not that
demand-side effects of participation in multiple markets are insignificant, just that the
supply-side wholesale pricing effect may provide an additional consideration.
4. Limited Commitment and Requirements Contracting
In analyzing the role of extended downstream market reach on upstream pricing in

20
the presence of adverse selection, we have thus far presumed report-contingent (menu-
based) supply contracts. While the revelation principle ensures that such contracts surely
capture the buyer's preferred equilibrium under any more detailed arrangement, one may
also argue that contracting on all possible contingencies is often unrealistic. After all, in
practice many firms sign more simple requirements contracts, in which the supplier
maintains discretion over wholesale price but agrees to provide as much inputs as the buyer
desires at the stated price.
In this section, we revisit the results under the presumption of simple requirements
contracts. That is, instead of the buyer committing to a menu of contracts, the buyer only
makes a commitment to what segments it will operate. Then, the supplier specifies w, after
which the buyer retains discretion over q.5
In this case, the equilibrium outcome can be derived by working backward in the
game. Given participation in n segments and a wholesale price of w, the buyer's chosen
quantities solve:
Maxq
Πn (q,w). (2)
The first-order condition of (2) yields quantities qi (w) = [αi − w] 2 . Given these
quantities, the supplier sets the wholesale price, w, to solve:
Maxw
qi (w)[w − c]i=1n∑ . (3)
The first-order condition of (3) then yields the supplier's preferred wholesale price,
wn (c) (the ~ reflects the requirements contracting case). Using wn(c) in qi (w) then
yields the quantities procured in equilibrium, denoted qin(c), i.e., qi
n(c) = qi (wn(c)) . The
outcome is summarized in Lemma 3.
5 In this case, the assumption needed to ensure nontrivial participation in each segment is
α i > [α n + c] / 2 .

21
Lemma 3. Under requirements contracting, the equilibrium outcome entails:
(i) qin (c) = [1 / 4][2α i − α
n − c]; and
(ii) wn (c) = c + [1 / 2][α n − c].
Notice, under requirements contracting, the wholesale price markup again depends
on average segment profitability, and is increasing in the measure:
d[wn (c) − c]
dα n =12> 0.
Given the above implications for the markup, it follows that the relative profitability
of segments continues to play a critical role. Using the equilibrium outcome outlined in
Lemma 3, the results in the case of requirements contracting as precisely as before. That is,
Lemma 2 continues to apply, with qin(c) replaced by qi
n (c) and wn(c) replaced by wn(c).
Simplifying these expressions yields the following analog to Proposition 1.
Proposition 4. Under requirements contracting,
(i) S(c) =α n − αn[ ] qi
n (c)i=1n−1∑[ ]
2 n −1[ ], and D(c) = −
α n − αn[ ]216 n −1[ ]
; and
(ii) Segments with lower (higher) margins have profit that understates (overstates) the value
they provide for all c . That is, if mn(c) < m(c) , then πn∗(c) < Vn(c) , and if
mn(c) > m(c) , then πn∗(c) > Vn(c) .
Inspection of Proposition 4 confirms that the sign of S(c) is again dependent only
on α n − αn. That is, relative to the case of complete report-contingent contracting, the
supply-side effects of eliminating segment n in the case of requirements contracting differ
only in terms of magnitude (not the sign). In this case, since there is a wholesale price
effect and quantities are directly tied to wholesale prices, there is also an induced demand-
side effect, as reflected in D(c). Consistent with this intuition, when wholesale prices are

22
altered due to segment n, quantities set without regard to such alterations are inefficient for
the buyer (reflected in D(c) < 0).
As confirmed in Proposition 4(ii), despite requirements contracting introducing a
demand-side consideration, the supply-side consideration is more pressing leading to the
same characterization of the sign of Vn(c) − πn∗(c) as in the case of complete report-
contingent contracting:
Vn (c) − πn∗ (c) = S(c) + D(c) = [α n − αn ]l(c), where
l(c) =[2n +1]α n − 3αn − 2[n −1]c
16[n −1]> 0.
In short, though requirements contracting alters the magnitude of segment profit and
segment value added calculations it does not alter the essence of the point herein: when a
segment has low margins, it has the latent upside of supporting lower wholesale prices.
5. Conclusion
Determining the contribution of various segments to the overall profit of a
diversified entity is a delicate exercise. Refined costing measures have substantially
improved this process and, hence, led to additional reliance on segment profit measures for
resource allocation choices. Yet, since accounting profit metrics neglect opportunity costs,
segment profit figures can deviate from the value added by a segment. The common
concern in this vein is of downstream complementarities brought by loss leader products or
locations as means of furthering brand recognition and/or product loyalty. This paper
examines a divergence between segment profit and segment value added due instead to
upstream considerations.
We demonstrate that even if product demand and long-term competitive posturing
are not pressing considerations, a firm may nonetheless benefit from its less stellar retail
performers so as to support more favorable supplier pricing terms. Since less profitable

23
markets (be they product lines or customer groups) solidify a reluctance to accept markups
in supplier pricing, a firm's active participation in less profitable markets can help support
lower input prices. This effect, in turn, points to an additional consideration in keep-or-drop
decisions.
While this fundamental phenomenon is demonstrated in a model wherein industrial
structure is taken as given, further research could seek to endogenize the structure of
industries and, in particular, the varied product offerings that a conglomerate would
optimally seek in light of input pricing considerations. Future study may also shed light on
other forms of perceived "weakness" that could prove useful in supply chain relationships,
such as public disclosure of proprietary information or even limited acquisition of relevant
information.

24
Appendix
Proof of Lemma 1. Denote the supplier's profit when its true cost is c and its reported cost
is c by ψ (c|c). That is, ψ (c|c) = [w(c) − c]Q(c) , where Q(c) = 1 ⋅q(c) = qi=1n∑ i (c).
Step 1. In this step, we show global incentive compatibility constraints, labeled (IC) in (P),
imply the local incentive compatibility constraints and the monotonicity of Q(c).
Without loss of generality consider two types c and ′c , ′c > c . Global incentive
compatibility dictates,
ψ (c|c) ≥ ψ ( ′c |c) = ψ ( ′c | ′c ) + [ ′c − c]Q( ′c ),
⇒ ψ (c|c) − ψ ( ′c | ′c ) ≥ [ ′c − c]Q( ′c ).
Reversing c and ′c and combining with the above inequality implies:
Q( ′c ) ≤ −[ψ ( ′c | ′c ) − ψ (c|c)
′c − c] ≤ Q(c). (A1)
From (A1), Q( ′c ) ≤ Q(c), so Q(⋅) is (at least weakly) decreasing. Further, taking
the limit of (A1) as ′c → c yields −dψ (c|c)
dc= Q(c) . Integrating both sides, with
ψ (cH |cH ) as the constant of integration, yields the local (IC) below:
ψ (c|c) = ψ (cH |cH ) + Q(c)dccH∫ c . (A2)
Step 2. In this step, we show local incentive compatibility constraint in (A2) and Q(c)
decreasing in c imply the global incentive compatibility constraints.
Again, consider two types c and ′c , ′c > c . From (A2):
ψ ( ′c | ′c ) = ψ (c|c) − Q(c)dc′c
∫ c .
Given Q(⋅) is monotonically decreasing, the above equality implies:
ψ ( ′c | ′c ) ≥ ψ (c|c) − [ ′c − c]Q(c),
⇒ψ ( ′c | ′c ) ≥ [w(c) − ′c ]Q(c) = ψ (c| ′c ) .
A similar argument shows that ψ (c|c) ≥ ψ ( ′c |c) . Thus, the global incentive
compatibility constraints for all c-types are satisfied.

25
Step 3. From (A2), it follows that if (IR) for c = cH is satisfied, (IR) constraints for all other
c -values are also satisfied. Further, (A2) yields w(c)Q(c) =
cQ(c) + ψ (cH |cH ) + Q(c)dccH∫ c . Substituting this into the objective function in (P), the
program can be written as:
Maxqi (c),i=1,L,n
[α i − qi (c)]qi (c) − cqi (c) − qi (c)dccH∫ c − Fi[ ]cL
cH∫ g(c)dci=1n∑ − ψ (cH |cH )
s.t. ψ (cH |cH ) ≥ 0
dqi (c)
dci=1n∑ ≤ 0
Clearly, from above, ψ (cH |cH ) = 0. Also, integrating by parts,
qi (c)dccH∫ c[ ]cL
cH∫ g(c)dc = H(c)qi (c)cL
cH∫ g(c)dc . Thus the first-order condition of the
relaxed program, one without the constraint on the monotonicity of Q(c), is:
α i − 2qi (c) − c − H(c) = 0 ,
⇒ qi (c) = [1 2][α i − c − H(c)]. (A3)
Using qi (c) from (A3), dqi (c)
dci=1n∑ = −
n
21+
dH(c)dc
⎡
⎣⎢
⎤
⎦⎥ . Given the hazard rate
assumption dH(c)
dc≥ 0,
dqi (c)
dci=1n∑ ≤ 0. Hence, the solution to the relaxed program is also
the solution to (P), i.e., the choice of qi (c) in (A3) is qin (c) in Lemma 1(i).
From (A2), and ψ (cH |cH ) = 0, w(c) = c +Q(c)dc
cH∫ c
Q(c). Using qi
n (c) from part (i),
Q(c) = n[α n − c − H(c)]. Using this in w(c) yields wn (c) in part (ii). This completes the
proof of Lemma 1.
Proof of Lemma 2. The value added by segment n is Vn (c) ,
Vn (c) = Πn (qn (c),wn (c)) − Πn−1(qn−1(c),wn−1(c)) . Segment n's realized (accounting)
profit is πn∗ (c) , πn
∗ (c) = πn (qnn (c),wn (c)). Hence,
Vn (c) − πn∗ (c) = Πn (qn (c),wn (c)) − Πn−1(qn−1(c),wn−1(c)) − πn (qn
n (c),wn (c)).
Since Πn (qn (c),wn (c)) = Πn−1(qn (c),wn (c)) + πn (qnn (c),wn (c)), the above can

26
be written as:
Vn (c) − πn∗ (c) = Πn−1(qn (c),wn (c)) − Πn−1(qn−1(c),wn−1(c)).
Finally, adding and subtracting Πn−1(qn (c),wn−1(c)), the difference can be written as:
Vn (c) − πn∗ (c) = Πn−1(qn (c),wn (c)) − Πn−1(qn (c),wn−1(c))[ ] +
Πn−1(qn (c),wn−1(c)) − Πn−1(qn−1(c),wn−1(c))[ ] . (A4)
The first term on the right-hand-side of (A4) is S(c) and the second term is D(c).
This completes the proof of Lemma 2.
Proof of Proposit ion 1. Since Πn−1(q,w) = π i (qi ,w)i=1n−1∑ and
π i (qi ,w) = [α i − qi ]qi − wqi − Fi , the S(c) and D(c) expressions in Lemma 2 can be
equivalently written as:
S(c) = wn−1(c) − wn (c)[ ] qin
i=1n−1∑ (c)[ ] , and
D(c) = α i − wn−1(c) − qin (c) − qi
n−1(c)[ ] qin (c) − qi
n−1(c)[ ]⎧⎨⎩
⎫⎬⎭
i=1n−1∑ . (A5)
From Lemma 1, qin (c) = qi
n−1(c) = [1 2][α i − c − H(c)] for i = 1,L,n −1;
wn (c) = c +[α n − c − H(c)]dcc
cH∫
α n − c − H(c); a n d wn−1(c) = c +
[α n−1 − c − H(c)]dcccH∫
α n−1 − c − H(c).
Substituting these in (A5), and replacing α n−1 by using the identity
α n =n −1
nα n−1 +
1nαn , yields the expressions for S(c) and D(c) in part (i). Since c +
H(c) is increasing in c and α i > cH + H(cH ), k(c) ≥ 0 with equality only at c = cH .
From Lemma 2 and Proposition 1(i),
Vn (c) − πn∗ (c) = S(c) + D(c) = [1 / 2][α n − αn ]k(c). (A6)
From Lemma 1(i), qnn (c) = [1 2][αn − c − H(c)], so mn (c) = [αn − qn
n (c)]− wn (c)
= [1 2][αn + c + H(c)]− wn (c) and m(c) = [1 2][α n + c + H(c)]− wn (c). This implies
m(c) − mn (c) = [1 2][α n − αn ]. Thus, (A6) can be written as:
Vn (c) − πn∗ (c) = [m(c) − mn (c)]k(c).

27
Since k(c) > 0 for c < cH , the sign of Vn (c) − πn∗ (c) is the same as the sign of
m(c) − mn (c) leading to the result in part (ii). This completes the proof of Proposition 1.
Proof of Proposition 2. From Lemma 1, qin (c) = qi
n−1(c) for i = 1,L,n −1. Hence,
Vn (c) = Πn (qn (c),wn (c)) − Πn−1(qn−1(c),wn−1(c)) can be written as:
Vn (c) = αn − qnn (c) − wn (c)[ ]qn
n (c) + wn−1(c) − wn (c)[ ] qin
i=1n−1∑ (c)[ ] − Fn . (A7)
Substituting the solution from Lemma 1 in (A7), and simplifying, yields:
Vn (c) =14
[αn − c]2 − [H(c)]2 − 2 [αn − c − H(c)]dcccH∫( ) − Fn. (A8)
Since [αn − c − H(c)]dcccH∫( )cL
cH∫ g(c)dc = [αn − c − H(c)]cL
cH∫ H(c)g(c)dc , the
expected value of (A8) can be written as:
E{Vn (c)} = [1 / 4]E{[αn − c − H(c)]2}− Fn. (A9)
Using (A6), and taking expectations, yields:
E{πn∗ (c)} = [1 / 4]E{[αn − c − H(c)]2}− [1 / 2][α n − αn ]E{k(c)}− Fn . (A10)
From the proof of Proposition 1, m(c) − mn (c) = [1 2][α n − αn ]. Hence, if
mn(c) < m(c) , from (A9) and (A10), E{πn∗ (c)}< E{Vn (c)}. Further, for Fn ∈(F, F),
E{Vn (c)}> 0 and E{πn∗ (c)}< 0. This completes the proof of Proposition 2.
Proof of Corollary 1. The net demand intercept in segment 1 (the no-frills market) and
segment 2 (the full service market) is α1 = a − v1 and α2 = a − v2, respectively. Hence,
α 2 − α2 = [1 / 2][v2 − v1]. Using (A6),
V2 (c) − π2∗ (c) = [1 / 4][v2 − v1]k(c).
Since v2 > v1 and k(c) > 0 for c < cH , it follows that V2 (c) − π2∗ (c) > 0. This
completes the proof of Corollary 1.
Proof of Proposition 3. In the two segment setting, with uniform pricing, a − q1 = a − q2,

28
so q1 = q2 = qu. Using the same arguments as in Lemma 1, the wholesale price in the
uniform case is wu (c) = c +2qu (c)dc
cH∫ c
2qu (c), where qu (c) solves:
Maxq(c)
[a − vi − q(c)]q(c) − cq(c) − H(c)q(c)[ ]cL
cH∫ g(c)dci=12∑ .
The first-order condition of the above yields:
qu (c) =12
a −v1 + v2
2− c − H(c)
⎡
⎣⎢
⎤
⎦⎥ .
In the uniform case, with n = 2, (A5) implies:
S(c) = w1(c) − wu (c)[ ] qu (c)[ ] , and
D(c) = a − v1 − w1(c) − qu (c) − q11(c)[ ] qu (c) − q1
1(c)[ ] . (A11)
Using q11(c) and w1(c) from Lemma 1 and qu (c) and wu (c) from above in (A11),
yields the expressions in Proposition 3. Since c + H (c) is increasing in c and
a − v1 > cH + H(cH ), it follows that t(c) ≥ 0. This completes the proof of Proposition 3.
Proof of Lemma 3. Given the supplier's wholesale price w, the firm chooses quantities to
maximize its total profit:
Max
qi ,i=1,L,n (α i − qi )qi − wqi − Fi[ ]i=1
n∑ . (A12)
The first-order condition of (A12) yields:
qi (w) =α i − w
2. (A13)
Given the firm's response in (A13), the supplier chooses w to maximize its profit:
Maxw
[w − c]i=1n∑ qi (w) ⇔ Max
w
n[w − c][α n − w]2
. (A14)
The first-order condition of (A14) yields wn (c) in Lemma 3(ii). Substituting wn (c) for w
in (A13) yields qin (c) in Lemma 3(i). This completes the proof of Lemma 3.
Proof of Proposition 4. Using the analog to (A5), and substituting wholesale prices from

29
Lemma 3(ii), yields:
S(c) = wn−1(c) − wn (c)[ ] qin
i=1n−1∑ (c)[ ] ,
⇒ S(c) =12α n−1 − α n[ ] qi
ni=1n−1∑ (c)[ ]. (A15)
Replacing α n−1 in (A15) by using the identity α n =n −1
nα n−1 +
1nαn , yields the
expression for S(c) in part (i). To obtain D (c), substitute wn−1(c) = c +α n−1 − c
2,
qin−1(c) = [1 / 4][2α i − α
n−1 − c], and qin (c) = [1 / 4][2α i − α
n − c] from Lemma 3 into
(A16) given below:
D(c) = α i − wn−1(c) − qin (c) − qi
n−1(c)[ ] qin (c) − qi
n−1(c)[ ]⎧⎨⎩
⎫⎬⎭
i=1n−1∑ . (A16)
From Lemma 2, Vn (c) − πn∗ (c) = S(c) + D(c). Using S (c ) and D (c ) from
Proposition 4(i) yields Vn (c) − πn∗ (c) = [α n − αn ]l(c). Using qn
n (c) from Lemma 3(i),
mn (c) = [αn − qnn (c)]− wn (c) = [1 4][2αn + α
n + c]− wn (c) a n d m(c) =
[1 4][3α n + c]− wn (c). This implies Vn (c) − πn∗ (c) = 2[m(c) − mn (c)]l(c). Thus,
proving part (ii) is equivalent to showing l(c) > 0.
Using Proposition 4(i), l(c) can be written as:
l(c) =8 qi
ni=1n−1∑ (c)[ ] + αn − α n
16[n −1].
Since qin
i=1n−1∑ (c) > 0 , it follows that l(c) > 0 if αn ≥ α n . Now suppose αn < α
n .
In this case,
l(c) =[2n +1]α n − 3αn − 2[n −1]c
16[n −1],
⇒ l(c) >[2n +1]α n − 3α n − 2[n −1]c
16[n −1]=
[α n − c]8
=qi
ni=1n∑ (c)
2n> 0 .
This completes the proof of Proposition 4.

30
REFERENCES
Bagnoli, M., Bergstrom, T. 2005. Log-concave Probability and its Applications. Economic
Theory 26, 445-569.
Baiman, S., Fischer, P., Rajan, M. 2000. Information, Contracting, and Quality Costs.
Management Science 46, 776-789.
Baiman, S., Fischer, P., Rajan, M. 2001. Performance Measurement and Design in Supply
Chains. Management Science 47, 173-188.
Baiman, S., Rajan, M. 2002. The Role of Information and Opportunism in the Choice of
Buyer-Supplier Relationships. Journal of Accounting Research 40, 247-278.
Bova, F. 2008. Labor Unions, Employee Ownership, and Management's Incentive to Signal
Declining Profitability. University of Toronto working paper.
Chevalier, J. 2004. What Do We Know About Cross-subsidization? Evidence from
Merging Firms. Advances in Economic Analysis & Policy 4, Article 3.
Cooper, R., Kaplan, 4. 1988. Measure Costs Right: Make the Right Decisions. Harvard
Business Review 66, 96-103.
Devine, K., Lammert, T., O'Clock, P. 2005. Product Line and Customer ROI: The Next
Generation of ABC. Management Accounting Quarterly 7, 1-11.
Gertner, R., Powers, E., Scharfstein, D. 2002. Learning about Internal Capital Markets from
Corporate Spin-offs. The Journal of Finance 52, 2479-2505.
Goebel, D., Marshall, G., Locander, W. 1998. Activity-Based Costing Accounting for a
Market Orientation. Industrial Marketing Management 27, 497-510.
Hogan, J. Lehmann, D., Merino, M., Srivastava, R., Thomas, J., Verhoef, P. 2002. Linking
Customer Assets to Financial Performance. Journal of Service Research 5, 26-38.
Katz, M. 1989. Vertical Contractual Relations, in Handbook of Industrial Organization,
Vol. 1, Schmalensee, R., Willig, R., (Eds.) Elsevier, 655-721.
Kuchta, D., Troska, M. 2007. Activity-Based Costing and Customer Profitability. Cost
Management 21, 18-25.
Lariviere, M. 2008. Supply Chains, in The New Palgrave Dictionary of Economics, 2nd
Ed., Blume, L. and Durlauf, S. (Eds.), Palgrave Macmillan, Forthcoming.
Menn, J. 2006. Target, Disney in DVD Truce: The Upcoming Release of 'Pirates' Prompts
the Retailer to Back Off in a Dispute over Terms. Los Angeles Times Nov. 18, C1.

31
Myerson, R. 1979. Incentive Compatibility and the Bargaining Problem. Econometrica 47,
61-74.
Prada, P. EasyJet May Look Beyond Boeing for Big New Order -- Small Carrier Could
Depart From Strategy of Using One Supplier to Cut Costs. Wall Street Journal Jan. 8,
A13.
Rajan, R., Servaes, H., Zingales, L. 2000. The Cost of Diversity: The Diversification
Discount and Inefficient Investment. The Journal of Finance 55, 35-80.
Saouma, R. 2008. Optimal Second Stage Outsourcing. Management Science 54, 1147-
1160.
Searcy, D. 2004. Using Activity-Based Costing to Assess Channel/customer Profitability.
Management Accounting Quarterly 5, 51-60.
Shin, H., Stulz, R. 1998. Are Internal Capital Markets Efficient? Quarterly Journal of
Economics 133, 531-552.
Sopariwala, P. 2005. Evaluating the "Keep-or-Drop" Decision. The Journal of Corporate
Accounting & Finance 16, 47-61.
Spengler, J. 1950. Vertical Integration and Antitrust Policy. The Journal of Political
Economy 58, 347-352.
Venkatesan, R., Kumar, V. 2004. A Customer Lifetime Value Framework for Customer
Selection and Resource Allocation Strategy. Journal of Marketing 68, 106-125.
Zimmerman, J. 2003. Accounting for Decision Making and Control. McGraw-Hill Irwin.