and Producing Limited Line Lists with Pure Theory · Combining Ab Initio Theory with Experiment !...
31
Combining Ab Initio Theory with Experiment to Obtain Highly Accurate Line Lists and Producing Limited Line Lists with Pure Theory Timothy J. Lee, Xinchuan Huang, Ryan Fortenberry, and David W. Schwenke Space Science and Astrobiology Division NASA Ames Research Center, Moffett Field, CA, USA
-
Upload
duongthuan -
Category
Documents
-
view
216 -
download
0
Transcript of and Producing Limited Line Lists with Pure Theory · Combining Ab Initio Theory with Experiment !...
Combining Ab Initio Theory with Experiment to Obtain Highly Accurate Line Lists
and Producing Limited Line Lists with Pure Theory
Timothy J. Lee, Xinchuan Huang, Ryan Fortenberry, and David W. Schwenke
Space Science and Astrobiology Division NASA Ames Research Center, Moffett Field, CA, USA

Some Recent & Current Projects
• High-resolution rovibrational spectroscopy: NH3, CO2, CH3OH, CH3CN, SO2, CH3OCH3 (X. Huang, D. W. Schwenke, and others)
• Highly accurate quartic force fields => spectroscopic data for small astrochemistry molecules and their isotopologues: C3H3
+, HC2N, C3H+, N2OH+, HOCO isomers, etc. (X. Huang, N. Inostroza Pino, R. Fortenberry, and others)
• Comparison of basis set extrapolation vs. use of explicitly correlated R12 (or F12) methods at the CCSD(T) level of theory (E. Valeev and X. Huang)
• Global warming studies, specifically the radiative efficiency of various fluorinated compounds used in industry (P. Bera, J. Francisco, S. Kokkila)
• Determination of the mechanism for the UV-induced oxidation of pyrimidine/water ice mixtures into uracil (P. Bera, S. Sandford, M. Nuevo, S. Milam)
• Studies of ionic complexes between small astrochemistry molecules and their growth into larger ringed organic molecules (P. Bera and M. Head-Gordon)
• On the use of Morse-Cosine coordinates for variational calculations of rovibrational levels and spectroscopic constants with QFFs (R. Fortenberry,X. Huang, W. Thiel)

Early HIFI Spectra
HIFI spectrum of water and organics in the Orion Nebula © ESA, HEXOS, and the HIFI consortium. E. Bergin
Outline
• Brief summary of the theoretical approach for computing highly accurate ab initio potential energy surfaces (PESs)
• Brief summary of the empirical refinement procedure to
improve the PES • Illustrative applications to:
– NH3 – CO2
– SO2
• Example of a limited line list: trans-HOCO
• Conclusions

Approach for Accurate Ab Initio Potential Energy Surfaces (PESs)
• Determine “reference” geometry (5Z basis set; include core-correlation) • Set up grid of points for a PES about the reference geometry • Calculate CCSD(T) energies for the TZ, QZ, and 5Z basis sets • Compute ic-ACPF energies (or different higher-order method); TZ or QZ basis • Compute core-correlation correction with CCSD(T) and QZ basis set • Compute scalar relativity effects at CCSD(T)/TZ level • Compute correction for diffuse functions or include explicitly • If desired, compute DBOC and non-adiabatic corrections • Extrapolate CCSD(T) TZ/QZ/5Z energies to basis set limit • Include higher-order correlation, core-correlation, scalar relativity, diffuse
function corrections (+DBOC) • Fit the “local” part of the PES to high precision • Combine with the long range part of the PES that allows dissociation • Run many tests on the PES to eliminate holes and improve fit (more points;
low weight “bridge” points; etc.) X. Huang, D. W. Schwenke, and T. J. Lee, JCP 129, 214304 (2008); Huang, Schwenke, and Lee, JCP 134, 044320 (2011); Huang, Schwenke, and Lee, JCP 134, 044321 (2011); X. Huang, D. W. Schwenke, S. Tashkun, and T. J. Lee, J. Chem. Phys., 136, 124311 (2012).
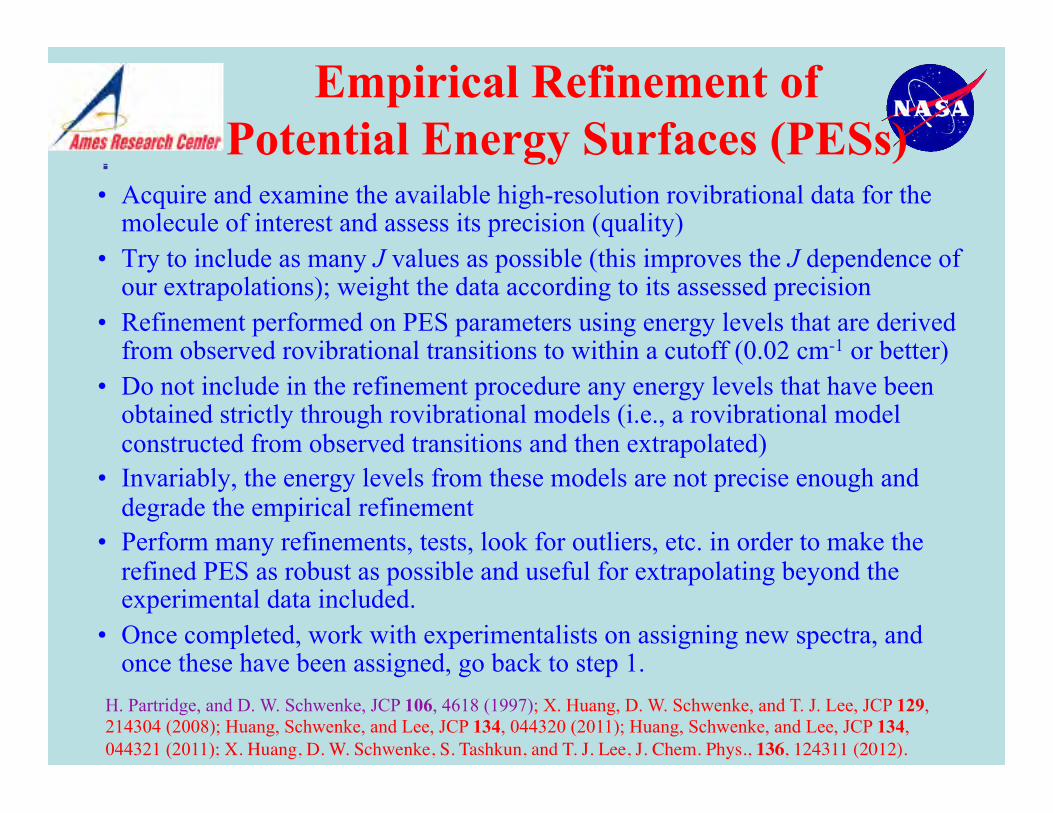
Empirical Refinement of Potential Energy Surfaces (PESs)
• Acquire and examine the available high-resolution rovibrational data for the molecule of interest and assess its precision (quality)
• Try to include as many J values as possible (this improves the J dependence of our extrapolations); weight the data according to its assessed precision
• Refinement performed on PES parameters using energy levels that are derived from observed rovibrational transitions to within a cutoff (0.02 cm-1 or better)
• Do not include in the refinement procedure any energy levels that have been obtained strictly through rovibrational models (i.e., a rovibrational model constructed from observed transitions and then extrapolated)
• Invariably, the energy levels from these models are not precise enough and degrade the empirical refinement
• Perform many refinements, tests, look for outliers, etc. in order to make the refined PES as robust as possible and useful for extrapolating beyond the experimental data included.
• Once completed, work with experimentalists on assigning new spectra, and once these have been assigned, go back to step 1.
H. Partridge, and D. W. Schwenke, JCP 106, 4618 (1997); X. Huang, D. W. Schwenke, and T. J. Lee, JCP 129, 214304 (2008); Huang, Schwenke, and Lee, JCP 134, 044320 (2011); Huang, Schwenke, and Lee, JCP 134, 044321 (2011); X. Huang, D. W. Schwenke, S. Tashkun, and T. J. Lee, J. Chem. Phys., 136, 124311 (2012).
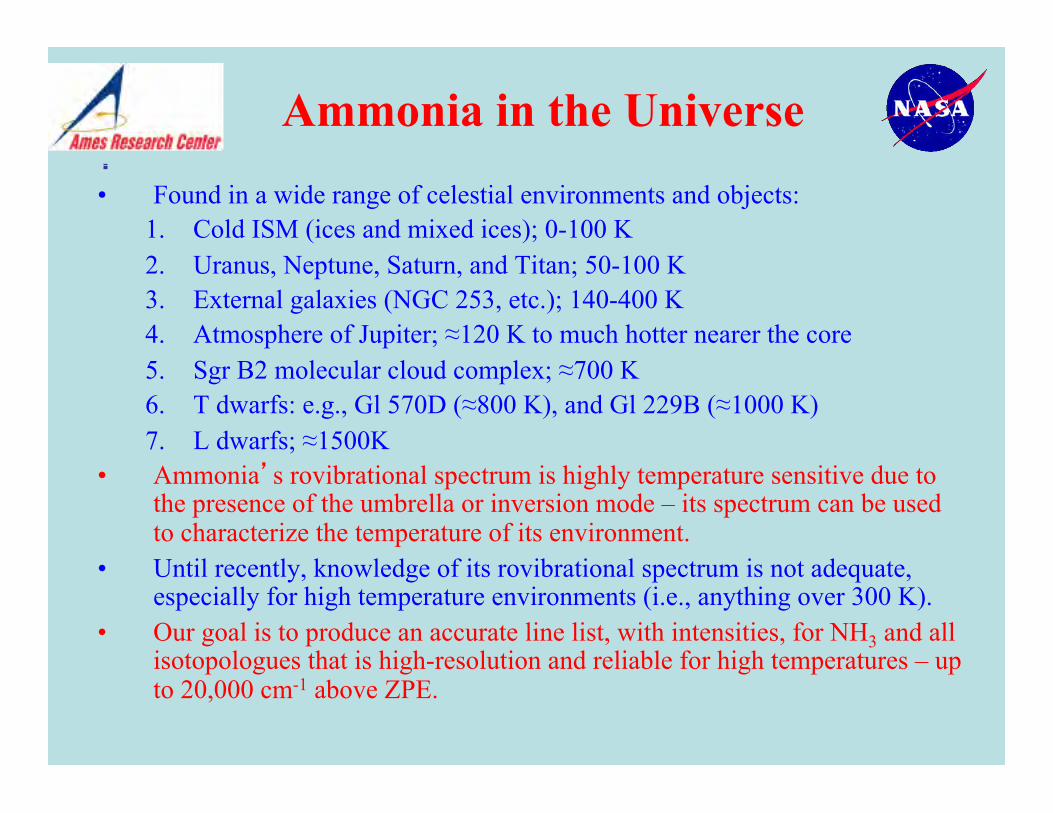
Ammonia in the Universe • Found in a wide range of celestial environments and objects:
1. Cold ISM (ices and mixed ices); 0-100 K 2. Uranus, Neptune, Saturn, and Titan; 50-100 K 3. External galaxies (NGC 253, etc.); 140-400 K 4. Atmosphere of Jupiter; ≈120 K to much hotter nearer the core 5. Sgr B2 molecular cloud complex; ≈700 K 6. T dwarfs: e.g., Gl 570D (≈800 K), and Gl 229B (≈1000 K) 7. L dwarfs; ≈1500K
• Ammonia’s rovibrational spectrum is highly temperature sensitive due to the presence of the umbrella or inversion mode – its spectrum can be used to characterize the temperature of its environment.
• Until recently, knowledge of its rovibrational spectrum is not adequate, especially for high temperature environments (i.e., anything over 300 K).
• Our goal is to produce an accurate line list, with intensities, for NH3 and all isotopologues that is high-resolution and reliable for high temperatures – up to 20,000 cm-1 above ZPE.

Global PESs: NH3
• We have reported previously on our purely ab initio PES for NH3 (HSL-0), and an initial refined PES (HSL-1), refined using high-resolution experimental data.
• These are global PESs that allow for dissociation to all possible molecular/atomic fragments – but the PES is designed for high-resolution spectroscopy, not dynamics calculations.
• For HSL-1, the rms error for 13 HITRAN bands for J=0-2 was 0.023 cm-1; for J=3-5 the rms error for each band was ≤0.15 cm-1.
• For inversion splittings, the rms error was ≤ 0.03 cm-1 for all J values up to 5, and ≤ 0.05 cm-1 for J=6.
• We proposed further work that would improve our PES and allow us to compute accurate transition frequencies and intensities up to 20,000 cm-1 above the zero-point level:
– Inclusion of non-adibatic corrections to reduce the deterioration on going to higher J values – Further refinement including up to J=6 transition frequencies that are reliable
• In early 2011, we reported a new PES, HSL-2. X. Huang, D. W. Schwenke, and T. J. Lee, JCP 129, 214304 (2008); Huang, Schwenke, and Lee, JCP 134, 044320 (2011); Huang, Schwenke, and Lee, JCP 134, 044321 (2011).

NH3: The HSL-0 and HSL-1 PESs
• The purely ab initio global PES showed good agreement with experiment for a global surface.
• HSL-1, our first empirically refined PES, showed very good agreement with experiment – the best to date of any PES.
• HSL-1 exhibits deterioration on going to higher J values.

NH3: The HSL-1 and HSL-2 PESs
• HSL-2 shows an order of magnitude improvement over HSL-1! • The deterioration on going to higher J values is markedly less! • The rms error for J=0-6 energy levels is only 0.015 cm-1! • For J=7/8 the rms error is only 0.020 and 0.023 cm-1, respectively! • The rms error for inversion splittings is about 1/3 that for energy levels!

NH3: Highlights of HSL-2
• Selected J=0-4/6 HITRAN levels used in the PES refinement • Non-adiabatic & DBOC correction terms included • 0.01 ~ 0.02 cm-1 accuracy for J ≤ 8 and energy levels < 5300 cm-1
• Reproduced most high-resolution HITRAN and CDMS line positions • Determined that the experimental 2ν4 models are unreliable • Proposed new analysis for some 2ν4 and n3+n4 transitions • Identified some missing levels (e.g. 2ν4 62
l=0s/a) in existing HITRAN data • Identified new bands (e.g. 2ν2+ν4, (ν3+ν4)l=0, etc) in existing HITRAN data • Achieved ~10 MHz accuracy for 15NH3 pure inversion-rotational transitions • 15N Isotopic shifts have been determined for all HITRAN levels. • Assessed accuracy of line positions beyond 5300 cm-1 through comparisons
with work by Lees & Xu, and by comparison with new spectra from Keeyoon Sung and Linda Brown (varie between 0.4 to 1.5 cm-1)
• This latter work has lead to the start of a newly refined PES, HSL-Pre3 Huang, Schwenke, and Lee, JCP 134, 044320 (2011); Huang, Schwenke, and Lee, JCP 134, 044321 (2011); K. Sung, L. R. Brown, X. Huang, D. W. Schwenke, T. J. Lee, S. L. Coy, and K. K. Lehmann, JQSRT, 113, 1066 (2012). .

Comparison of New JPL Experiments to HSL-Pre3
• Observed 14NH3 spectrum in top panel with 6 computed bands (under experimental conditions) below.
• Sum of intensity for the 6 bands is 63% of the total 14NH3 opacity.
• The bottom panel shows the remaining unassigned features.
• From HSL-1 to HSL-Pre3: – We use 6 J=0/1/2/4/6 A” symmetry blocks, 112
HITRAN levels + 29 previously analyzed levels to refine HSL-1
– Final σRMS = 0.019 cm-1
• We have computed J=0-8 spectra on HSL-Pre3 and used this for the synthetic spectra at right
• The level of precision found for HSL-2 for < 5300 cm-1 has been expanded to approximately 7000 cm-1
• Work continues on a newly refined PES

CO2 : Motivation • Venus Express is an ESA mission with NASA participation • Venus Express completed its Primary Mission Sept 2007, and Extended
Mission no. 1 Dec 2009 • Extended Mission no. 2 extends to Dec 2014 subject to validation in mid-2012 • Two of the goals of Venus Express are to study the atmospheric dynamics of
Venus, and to study the atmospheric composition and chemistry • CO2 is the principle component of the Venusian atmosphere • But the spectroscopy of CO2 is not well characterized under the high
temperature (750 K) and high pressure (100 bar) conditions present on Venus • The current state of knowledge severely limits the analysis of data from the
PFS and SOIR instruments • Our goals:
– to use state-of-the art ab initio calculations to construct a global PES for CO2 and to use the best high-resolution experimental data to refine the PES (similar to NH3 and H2O)
– To compute an accurate dipole moment surface (DMS) and to generate a highly accurate line list for CO2 up to 20,000 cm-1 above zero-point
– To determine line shape parameters relevant to the conditions on Venus – To repeat this for the other isotopologues of CO2

Global PES for CO2: Initial Empirical Refinement of Ames-0
• Initial attempts to refine the PES used J=0-4 and then J=0-10 data from HITRAN2008; the increased J data significantly reduced the J dependent errors.
• As was done with NH3, only up through the quartic constants were allowed to vary (22), and the maximum change was less than 2% in all cases.
• Use of higher J values (>40) was a disaster; the problem is that many of the HITRAN2008 energy levels are from models and not experimentally observed.
• Enter our collaborator Dr. Sergey Tashkun, who has compiled a set of 8142 experimentally determined energy levels for 12C16O2. X. Huang, D. W. Schwenke, S. Tashkun, and T. J. Lee, J. Chem. Phys., 136, 124311 (2012).
0 3000 6000 9000 12000 15000-4
-2
0
2
4
J = 0 - 4 J = 0, 5, 10, 15, ..., 95
1st r
efin
ed P
ES -
HIT
RA
N /
cm
-1
HITRAN Levels / cm-1
0 3000 6000 9000 12000 15000-4
-2
0
2
4
J = 0 - 10 J = 0, 5, 10, 15, ..., 95
HITRAN Levels / cm-1
2nd
refin
ed P
ES -
HIT
RA
N /
cm
-1

Global PES for CO2: Refinement using only Expt (Ames-1)
• Refinement included all J=0,1,2,10,25,40,55,70,85 IR rovibrational levels (471); 3 levels above 20,000 cm-1 and one J=85 level given smaller weight.
• We started with the previous J=0-4 refined PES: the change in all 22 coefficients was less than 0.7%.
• The RMS error is reduced from 0.085 cm-1 on the J=0-4 PES to 0.0197 cm-1 for Ames-1 for the 467 equally weighted energy levels.
• RMS errors range from 0.01 to 0.015 cm-1 up to 8000 cm-1, rising to 0.04 cm-1 at 14,000 cm-1 (J up to 117), with accumulated RMS of 0.0156 cm-1 (6873 levels).
X. Huang, D. W. Schwenke, S. Tashkun, and T. J. Lee, J. Chem. Phys., 136, 124311 (2012).
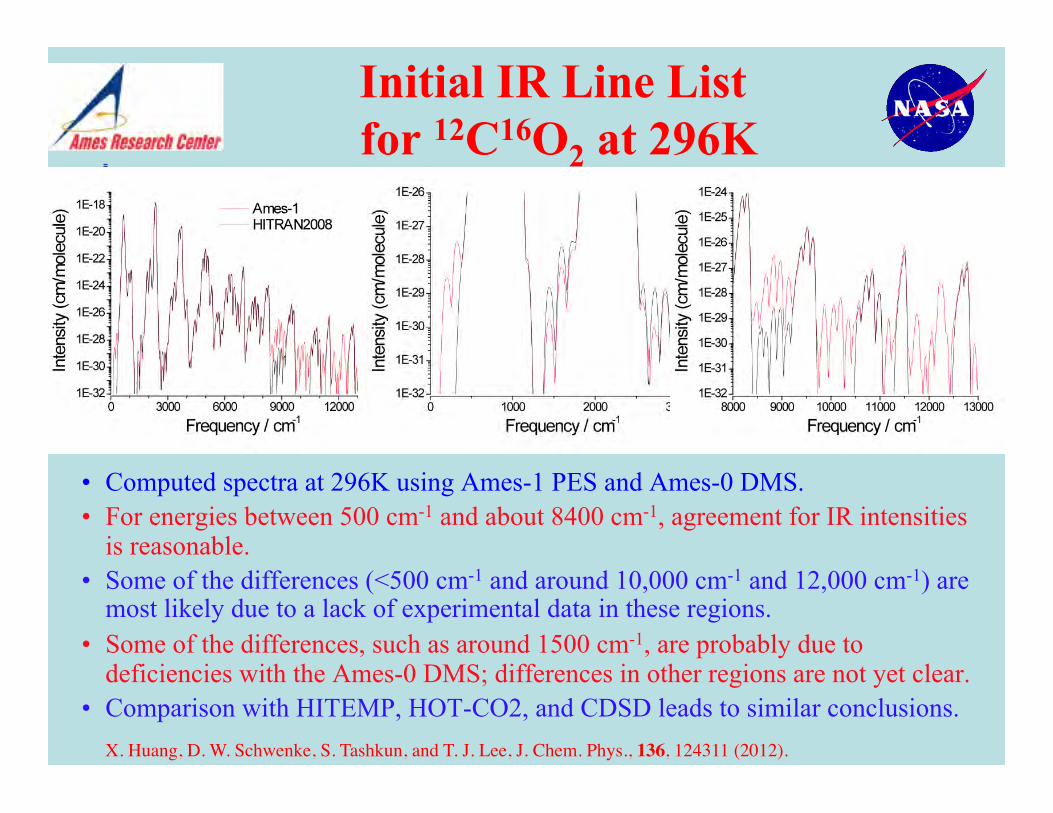
Initial IR Line List for 12C16O2 at 296K
• Computed spectra at 296K using Ames-1 PES and Ames-0 DMS. • For energies between 500 cm-1 and about 8400 cm-1, agreement for IR intensities
is reasonable. • Some of the differences (<500 cm-1 and around 10,000 cm-1 and 12,000 cm-1) are
most likely due to a lack of experimental data in these regions. • Some of the differences, such as around 1500 cm-1, are probably due to
deficiencies with the Ames-0 DMS; differences in other regions are not yet clear. • Comparison with HITEMP, HOT-CO2, and CDSD leads to similar conclusions.
X. Huang, D. W. Schwenke, S. Tashkun, and T. J. Lee, J. Chem. Phys., 136, 124311 (2012).

12C16O2: Ames296 vs. HITEMP and Wattson
• Computed spectra at 3000K using Ames-1 PES and Ames-0 DMS. • Regions where HITEMP is incomplete and we are complete, but… • Regions where our intensities do not agree • Similar comparisons with CDSD show that our Ames-0 DMS is lacking
X. Huang, D. W. Schwenke, S. Tashkun, and T. J. Lee, J. Chem. Phys., 136, 124311 (2012).
Computed by Richard Freedman; unpublished.

12C16O2: New DMSs
• Computed spectra at 296K using the Ames-1 PES and new DMSs. • DMS-N2 (or DMS-N1) are preferred; tests show that DMS-N3 is over determined • There are significant changes above 11,500 cm-1. • Changes around 2000 cm-1 are not large – minor differences in this region.
0 3000 6000 9000 12000 150001E-34
1E-32
1E-30
1E-28
1E-26
1E-24
1E-22
1E-20
1E-18
1E-16
Inte
nsity
/ cm
.mol
ecul
e-1
Frequency / cm-1
HITRAN DMS-0Z DMS-N1 DMS-N2 DMS-N3

12C16O2; New DMSs: 9000 cm-1 region
• Computed spectra at 296K using the Ames-1 PES and new DMSs. • Still significant disagreement (two orders of magnitude) with HITRAN • Which is correct?
8400 8600 8800 9000 9200 94001E-31
1E-29
1E-27
1E-25
Inte
nsity
/ cm
.mol
ecul
e-1
Frequency / cm-1
HITRAN DMS-0Z DMS-N1 DMS-N2 DMS-N3
50014 50013
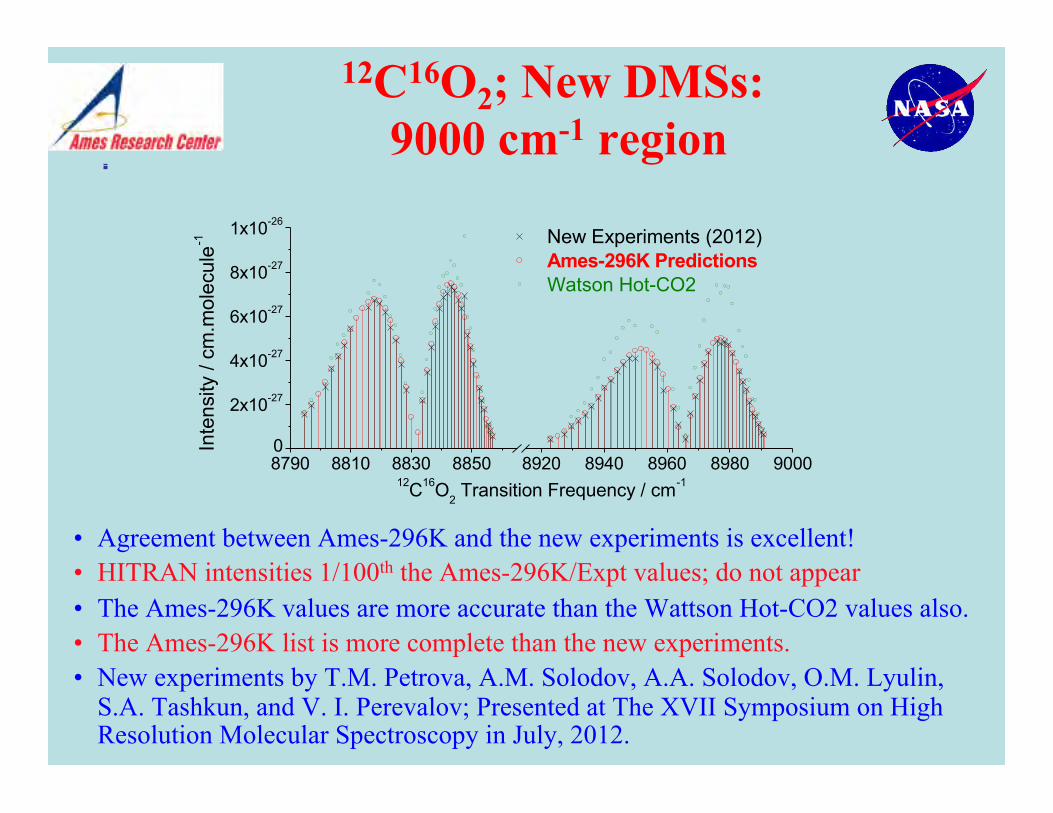
12C16O2; New DMSs: 9000 cm-1 region
• Agreement between Ames-296K and the new experiments is excellent! • HITRAN intensities 1/100th the Ames-296K/Expt values; do not appear • The Ames-296K values are more accurate than the Wattson Hot-CO2 values also. • The Ames-296K list is more complete than the new experiments. • New experiments by T.M. Petrova, A.M. Solodov, A.A. Solodov, O.M. Lyulin,
S.A. Tashkun, and V. I. Perevalov; Presented at The XVII Symposium on High Resolution Molecular Spectroscopy in July, 2012.
8790 8810 8830 8850 8920 8940 8960 8980 90000
2x10-27
4x10-27
6x10-27
8x10-27
1x10-26In
tens
ity /
cm.m
olec
ule-1
12C16O2 Transition Frequency / cm-1
New Experiments (2012) Ames-296K Predictions Watson Hot-CO2

Isotopologues of CO2
• The Ames-1 PES has been used to compute the J=0 band origins for 13 major isotopologues of CO2, including:12C16O2, 13C16O2, 12C18O2, 12C17O2, 13C18O2, 13C17O2, 14C16O2, 16O12C18O, 16O12C17O, 16O13C18O, 16O13C17O, 17O12C18O, and 17O13C18O.
• The RMS error is less than 0.13 cm-1 for all isotopologues • For all known Gv values of these isotopologues (minus outliers), the RMS error
from Ames-1 is 0.08 cm-1, with Emax = 25,865 cm-1
• Gv outliers were confirmed by comparison of Ames-1 values with those obtained from an Effective Hamiltonian model (Tashkun, to be published).

SO2 : Motivation • SO2 has been identified as a “2nd-class weed” by the HIFI community • As such, its lines will obscure those from other (more interesting) molecules in
various astrophysical environments. • It is also an important minor constituent in some planetary atmospheres, such
as Venus.
• There are regions where there is no CO2 absorption, and there is SO2 absorption but it is missing in HITRAN.
• This is the spectral region covered by the high resolution SOIR instrument on Venus Express

From Ames-0 to Ames-1: Details
489 selected geometries CCSD(T)/(aug-)cc-pV(X+d)Z basis, X=T,Q,5 CCSD(T)/aug-cc-pcwVXZ, X=T,Q CCSD(T)/aug-cc-pV(Q+d)Z dipoles core/scalar relativistic effects��� 219 unique coeffs, i,j,k ≤ 8, i+j+k ≤ 12, i ≤ j Higher weights on ~400 points < 30,000 cm-1
Initial Ames-0: CCSD(T)/cc-pVQZ-DK For 0 – 30,000 cm-1, PES Δ(avg) = 0.21 cm-1 , σRMS = 0.31 cm-1
DMS δ(avg) = 1.2E-5 D, σRMS = 1.96E-5 D DMS δ%(avg) = 0.02%
Refined with 465 selected HITRAN levels 5/43/183/158/57 levels at J=0/4/20/50/70 with weights: 2.5/1.0/1.5/2.0/3.0. ��� 80/73/49/47/43/30/22/74/28/ levels from GS/ν3/2ν3/ν2/ν2+ν3/2ν2/ν1/ν1+ν2 Plus 19 high res band origins. In short, a HITRAN-based refinement On the Final Refined Ames-1 PES σRMS = 0.024 cm-1 (weighted) 0.010 cm-1 (unweighted)
)()1()1( 412
211
)(2.02
1
42
2
1
21
22
21 aAaAeeDeDV ee
rr
i
re
i
reLong
ii Δ+Δ⋅+−+−= Δ+Δ⋅−
=
Δ⋅−
=
Δ⋅− ∑∑ ββ
De1 = 233,156 cm-1, De2 = 5,250 cm-1, Ae1 = 56,000 cm-1, Ae2 = 50,000 cm-1
β = 1.152733 Å-1, Δri = ri – 1.43108 Å, Δα1 = cosα(∠OSO)-cos(119.3209°)
41
21
2
1
42
1
2 )(4)(3)(2)(1969
1121 ,)]()()[(
ααα
Δ⋅−Δ⋅−∑ Δ−∑ Δ−
=
===ΔΔΔ= ∑dampdamprdamprdamp
dampn
kjinijkdampShort
ii
ii
efrrPCfV
E = Long-range terms (Morse-type) + Short-range terms * damping function

SO2 : Relabeling a few 2ν3/ν1+3ν2 Ka=11 levels
• 9 HITRAN levels and 21 transitions have been relabeled • 2ν3: J=51-57 è ν1+3ν2: J=51-57 • ν1+3ν2: J=51-52 è 2ν3: J=51-52
10 20 30 40 50 60-0.10
-0.05
0.00
0.05
0.10
0.15
0.20 Ka=11 levels of 002/130 in HITRAN E(Ames-1) - E(Expt), 002 E(Ames-1) - E(Expt), 130 E(002) - E(130) Expt E(002) - E(130) Ames-1
Ener
gy D
iffer
ence
/ cm
-1
J10 20 30 40 50 60
-0.10
-0.05
0.00
0.05
0.10
0.15
0.20 New Ka=11 levels of 002 and 130 E(Ames-1) - E(Expt), 002 E(Ames-1) - E(Expt), 130 E(002) - E(130) Expt E(002) - E(130) Ames-1
Ener
gy D
iffer
ence
/ cm
-1J
Based on existing HITRAN assignments After relabeling 9 HITRAN levels
and 21 transitions

SO2 : Line Lists
• 32S16O2 Line list above. Results for 34S16O2 look very good as well. • Clearly, there are a lot of gaps in HITRAN for 32S16O2 (and for 34S16O2, the
situation is not improved). • But there is work to be done…
0 1000 2000 3000 4000 5000 6000 70001E-30
1E-28
1E-26
1E-24
1E-22
1E-20
1E-18
1E-16In
tens
ity /
cm.m
olec
ule-1
32S16O2 IR Frequency / cm-1
HITRAN2008 Ames-296K (J=0-80)

Comparison to Fitted CDMS: Purely rotational GS transitions
• Ames-296K vs. CDMS at 300K: 518 transitions from CDMS fitted set • Symmetric residual: δ(I)% = 50% * (IAmes/Iobs - Iobs/Iames)
• Range for Δfreq = -0.0155 – 0.0203 cm-1; for δ(I)% = -4.5% - 10.7%
0 5 10 15 20 25 30-0.10
-0.05
0.00
0.05
0.10
Ka + J/100
Tran
sitio
n Fr
eq D
ev /
cm-1
0
20
40
60
80
100 Relative Intensity D
eviation δ %
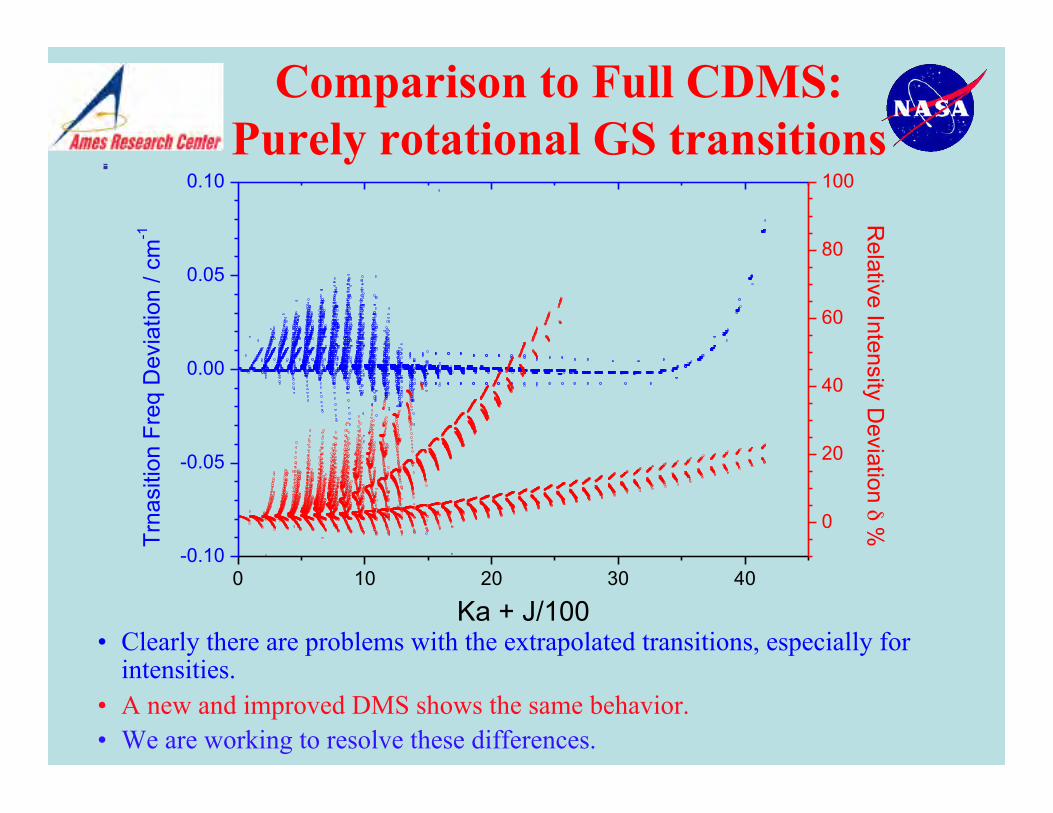
Comparison to Full CDMS: Purely rotational GS transitions
• Clearly there are problems with the extrapolated transitions, especially for intensities.
• A new and improved DMS shows the same behavior. • We are working to resolve these differences.
0 10 20 30 40-0.10
-0.05
0.00
0.05
0.10
Ka + J/100
Trna
sitio
n Fr
eq D
evia
tion
/ cm
-1
0
20
40
60
80
100R
elative Intensity Deviation δ %

Accuracy for 32S16O2: 0.01-0.02 cm-1
• Agreement with experiment is very good (both 2 cm-1 windows) • Experiment from: Ulenikov et al. JQSRT 112, 486 (2011).
3414.0 3413.8 3413.6 3413.4 3413.2 3413.0 3412.8 3412.6 3412.4 3412.2 3412.0Ames-296K Prediction
Observed (New Expt)
1870.0 1870.2 1870.4 1870.6 1870.8 1871.0 1871.2 1871.4 1871.6 1871.8 1872.0
Observed (New Expt) 2ν2 + ν3 ß ν2
Ames-296K Prediction
32S16O2 Transition Frequency / cm-1
3ν1
ν2 + ν3
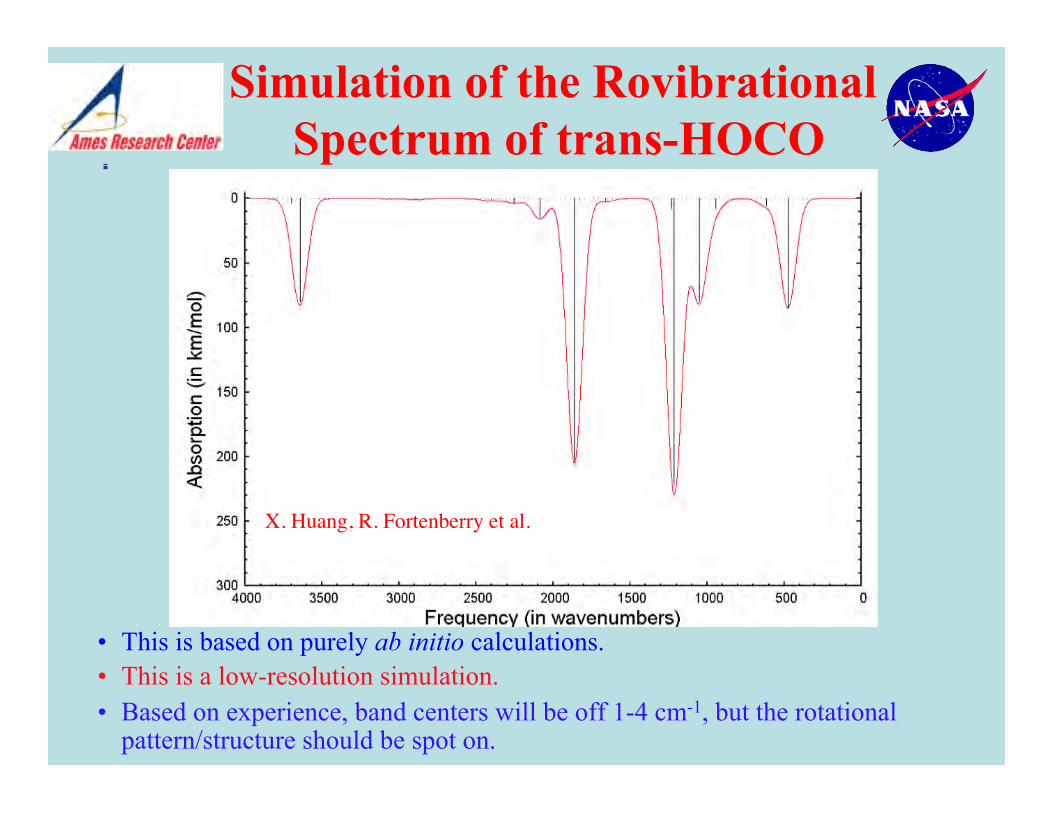
Simulation of the Rovibrational Spectrum of trans-HOCO
• This is based on purely ab initio calculations. • This is a low-resolution simulation. • Based on experience, band centers will be off 1-4 cm-1, but the rotational
pattern/structure should be spot on.
X. Huang, R. Fortenberry et al.
Conclusions & Future Work
• State-of-the art for accurate line lists involves a combination of ab initio theory and high-resolution laboratory experiment.
• For NH3, < 0.03 cm-1 errors for rovibrational transitions (up to 5300 cm-1); for J=0-6 levels the RMS error only 0.015 cm-1 (HSL-2; HSL-3 coming soon)!
• Overall RMS error of 0.0156 cm-1 for 6873 rovibrational energy levels of 12C16O2 with J up to 117 for the Ames-1 PES.
• For 32S16O2, the weighted σRMS is 0.023 cm-1 (in preparation); more to come. • Molecules with large amplitude motions, such as NH3, can be used by astronomers
to characterize the environment è accurate line lists needed. • It is essential to use quality control in determining which experimental data is
reliable and thus can be used in the refinement step. (energy levels obtained from spectroscopic models should be excluded in the refinement procedure)
• Determining high-quality molecular rovibrational line lists an iterative procedure. • DMSs need to be evaluated with their own (larger) grid of points. • Similar work on purely ab initio limited line lists for “flowers” is beginning.

Acknowledgements
• Laboratory Astrophysics Consortium (NASA; APRA) • Astrophysics Research and Analysis (NASA; APRA) • Venus Express Participating Scientists (NASA)
Funding from the following programs is gratefully acknowledged:
Collaborations with many experimentalists and modelers, are gratefully acknowledged, particularly K. Sung, L. Brown, H. Müller, R. Freedman, and M. Marley.
See Poster by Xinchuan Huang with more details for CO2 and SO2