and Artificial Materials for Musical Instrument Reeds
13
materials Article Longitudinal and Transversal Elasticity of Natural and Artificial Materials for Musical Instrument Reeds Enis Ukshini * and Joris Jan Jozef Dirckx Department of Physics, Laboratory of Biomedical Physics BIMEF, The University of Antwerp, Groenenborgerlaan 171, 2020 Antwerp, Belgium; [email protected] * Correspondence: [email protected] Received: 17 September 2020; Accepted: 12 October 2020; Published: 14 October 2020 Abstract: The reed is the primary component in single-reed woodwind instruments to generate the sound. The airflow of the player’s mouth is the energy source and the airflow is modulated by the reed. The oscillations of the reed control the airflow. Traditionally, instrument reeds are made out of natural cane (Arundo Donax), but in efforts to overcome variability problems, synthetic reeds have been introduced. Previous investigations mainly focused on natural cane reeds and direct elasticity measurements did not discriminate between elasticity moduli along different directions. In order to obtain the mechanical properties along the direction of the reed fibres and in the orthogonal direction separately, a three-point bending testing setup was developed, which accommodates the small samples that can be cut from an instrument reed. Static moduli of elasticity were acquired in both directions. Much higher ratios between longitudinal and transversal moduli were seen in the natural cane reed as compared to the artificial reeds. Wet natural reeds showed a strong decrease in moduli of elasticity as compared to dry reeds. Elasticity was significantly higher in artificial reeds. The force–displacement curves of the wet natural reed show hysteresis, whereas the artificial materials did not. In the cane reed, higher energy losses were found in the transversal direction compared to the longitudinal direction Keywords: elasticity modulus; arundo donax; musical instruments; synthetic reeds; musical acoustics 1. Introduction In single-reed instruments such as the clarinet and saxophone, the source of the sound is formed by periodic motions of the tip of the reed, which is driven into oscillation by an airstream. During playing, the overpressure in the mouth generates an airstream passing through the small slit between the tip of the reed and the mouthpiece. Due to the Bernoulli effect, this air stream causes a pressure difference between the upper and lower surface of the reed. When the flow is high enough, the negative Bernoulli pressure causes the reed to bend further towards the mouthpiece, thus decreasing the flow when air pressure in the mouth is increased. This effect corresponds to a negative hydrodynamic resistance, which is the source of energy to drive the reed in periodic, usually non-harmonic motion. The motion of the reed depends on many parameters, and reed elasticity is one of the prime factors. The vibrations of the reed modulate the airstream, which is the sound source of the instrument. In order to control the vibrations and the acoustic impedance of the mouthpiece (which in turn influences the pitch produced by the instrument), the pressure of the player’s lips on the top side of the reed makes the reed bend towards the mouthpiece, thus changing its mechanical properties. The player aims at forming a specific opening between the tip of the reed and the tip of the mouthpiece while bending the rest of the reed towards the side rails of the mouthpiece to form an airtight fit. The tip of the reed needs to be very light and stiff so that the natural frequency of this spring-mass system is high enough to adapt to all musical tones that can be played on the instrument. So, in the direction along the long axis of the mouthpiece, Materials 2020, 13, 4566; doi:10.3390/ma13204566 www.mdpi.com/journal/materials
Transcript of and Artificial Materials for Musical Instrument Reeds

materials
Article
Longitudinal and Transversal Elasticity of Naturaland Artificial Materials for Musical Instrument Reeds
Enis Ukshini * and Joris Jan Jozef Dirckx
Department of Physics, Laboratory of Biomedical Physics BIMEF, The University of Antwerp,Groenenborgerlaan 171, 2020 Antwerp, Belgium; [email protected]* Correspondence: [email protected]
Received: 17 September 2020; Accepted: 12 October 2020; Published: 14 October 2020�����������������
Abstract: The reed is the primary component in single-reed woodwind instruments to generate thesound. The airflow of the player’s mouth is the energy source and the airflow is modulated by thereed. The oscillations of the reed control the airflow. Traditionally, instrument reeds are made out ofnatural cane (Arundo Donax), but in efforts to overcome variability problems, synthetic reeds havebeen introduced. Previous investigations mainly focused on natural cane reeds and direct elasticitymeasurements did not discriminate between elasticity moduli along different directions. In orderto obtain the mechanical properties along the direction of the reed fibres and in the orthogonaldirection separately, a three-point bending testing setup was developed, which accommodates thesmall samples that can be cut from an instrument reed. Static moduli of elasticity were acquired inboth directions. Much higher ratios between longitudinal and transversal moduli were seen in thenatural cane reed as compared to the artificial reeds. Wet natural reeds showed a strong decrease inmoduli of elasticity as compared to dry reeds. Elasticity was significantly higher in artificial reeds.The force–displacement curves of the wet natural reed show hysteresis, whereas the artificial materialsdid not. In the cane reed, higher energy losses were found in the transversal direction compared tothe longitudinal direction
Keywords: elasticity modulus; arundo donax; musical instruments; synthetic reeds; musical acoustics
1. Introduction
In single-reed instruments such as the clarinet and saxophone, the source of the sound is formed byperiodic motions of the tip of the reed, which is driven into oscillation by an airstream. During playing,the overpressure in the mouth generates an airstream passing through the small slit between the tip ofthe reed and the mouthpiece. Due to the Bernoulli effect, this air stream causes a pressure differencebetween the upper and lower surface of the reed. When the flow is high enough, the negative Bernoullipressure causes the reed to bend further towards the mouthpiece, thus decreasing the flow when airpressure in the mouth is increased. This effect corresponds to a negative hydrodynamic resistance,which is the source of energy to drive the reed in periodic, usually non-harmonic motion. The motionof the reed depends on many parameters, and reed elasticity is one of the prime factors. The vibrationsof the reed modulate the airstream, which is the sound source of the instrument. In order to control thevibrations and the acoustic impedance of the mouthpiece (which in turn influences the pitch producedby the instrument), the pressure of the player’s lips on the top side of the reed makes the reed bendtowards the mouthpiece, thus changing its mechanical properties. The player aims at forming a specificopening between the tip of the reed and the tip of the mouthpiece while bending the rest of the reedtowards the side rails of the mouthpiece to form an airtight fit. The tip of the reed needs to be very lightand stiff so that the natural frequency of this spring-mass system is high enough to adapt to all musicaltones that can be played on the instrument. So, in the direction along the long axis of the mouthpiece,
Materials 2020, 13, 4566; doi:10.3390/ma13204566 www.mdpi.com/journal/materials
Materials 2020, 13, 4566 2 of 13
the elasticity modulus of the reed material needs to be sufficiently high. We will refer to this orientationas the longitudinal direction. In the transversal direction, the reed needs to be flexible enough so thatthe player’s lips can bend the reed to form the airtight fit with the side rails of the mouthpiece.
Traditionally, these material parameters have been realized by using reeds made out of naturalcane, a giant reed grass (Arundo Donax). The Arundo Donax grows to a height of 4–6 meters, and thestem is hollow. The outer diameter is approximately 2–3 cm [1]. The material characteristics of theArundo Donax are influenced by different growing and harvesting conditions. Climate, soil conditions,and time of harvest are such examples. These factors induce that the reed is the component with by farthe most variability compared to the mouthpiece and instrument tube, and it therefore has a substantialinfluence on the sound of the instrument. The macroscopic structure of the natural cane is made up ofthree concentric layers [2]. The outer layer consists of hard waxy epidermis and outer cortical cells.The second layer is a thick sclerified fibre which comprises mostly parenchyma cells where the cellwall is thicker (sclerified) than in normal thin-walled parenchyma cells. The inner layer consists ofvascular bundles and parenchyma cells [3]. To manufacture a reed, the outer and middle layer of themacroscopic structure of Arundo Donax are removed towards the tip of the reed so that the vibrationpart consists of the vascular bundles and the parenchyma cells. Those vascular bundles are commonlyreferred to as the fibre of the reed. The longitudinal direction of the reed is chosen parallel to thecane fibres. When the reed is bent, fibres are stretched, which gives the reed a high stiffness along thelongitudinal direction. No transversal fibres are present, so to bend the reed in that direction only thematrix of parenchyma cells needs to be bent, which has a lower elasticity modulus than the fibres.
For many years, reeds have only been produced out of natural cane. Acoustically, this materialperforms very well, but it also has specific drawbacks. Before starting to play, the reed needs to bewetted, which strongly alters its elasticity properties. Therefore, the shape of the reed is made sothat it is aimed to have the desired mechanical properties in wet condition. Prolonged exposure to awet environment makes the fibres disintegrate, and bacteria in the player’s saliva gradually fill thechannels in the reed fibres, thus altering the reeds behaviour. Material fatigue also progresses ratherfast, so that the performance of the reed degrades over periods of tens of hours of playing. As cane isa natural material, fibre density and irregularities in fibre orientation differ between reeds, so eachchange to another reed necessitates an adaptation by the player. For these reasons, many attemptshave been made to seek artificial materials that can replace the natural reed. Plastic materials such aspolycarbonate or polyacrylate have been used, but with little success. These materials have isotropicmaterial parameters, making them either too soft in one direction or too hard in the other. For about adecade [4], artificial reeds have emerged on the market which contain fibres, giving them stronglyanisotropic elasticity parameters comparable to natural reeds. Two leading manufacturers in this fieldare the Fiberreed [5] (Harry Hartmann’s Fiberreed, 70771 LE-Oberaichen, Leinfelden-Echterdingen,Germany) and the Légère reeds (Légère Reed Ltd., Barrie, Ontario, Canada). Fiberreed consists of aHollow Fiber Foamresin Compound (HFC), and Légère reeds are made of a homogeneous materialconsisting of polypropylene fibres (US6087571).
The elasticity of cane reeds has been measured in previous studies using indentation testing [6].This test method has the advantage that the test can be performed on tiny samples. However, the testdoes not give information on the anisotropic elasticity values separately in the two principal directionsof the reed. A limited number of papers report on elasticity parameters of natural reed materials.In [7,8], the longitudinal elasticity modulus of natural cane was measured, and values between 4and 7 GPa are reported. Taillard et al. [9] pointed out the importance of the bending of the reed inthe direction perpendicular to its axis, and presented modelling results using different mechanicalparameters in the directions along and perpendicular to the length axis of the reed.
In the current paper, we will investigate the anisotropic elasticity parameters of both artificialmaterials (Carbon Fiberreed and Légère Reed) and compare them to wet and dry natural reeds.Natural reeds are produced by many manufacturers, and we will use reeds of one of the world leadingcompanies, Vandoren (Paris, France).
Materials 2020, 13, 4566 3 of 13
Reeds are produced in different strengths, which mainly refers to the stiffness of the thinnedportion and tip of the reed. In natural reeds, the strength can also be influenced by the part of the canestem where the reed is cut. In the present study, we use material taken from tenor saxophone reeds ofstrength 3, which is a commonly used average strength.
Because natural reeds are cut out of cane, their size in transversal direction is limited to about15 mm. We therefore developed a setup that allows us to perform a three-point bending test onreed samples that are just 14 mm in length. Based on this method, we will report in this paper onlongitudinal and transversal elasticity of natural and artificial reeds.
2. Measurement Setup and Specimen Preparation
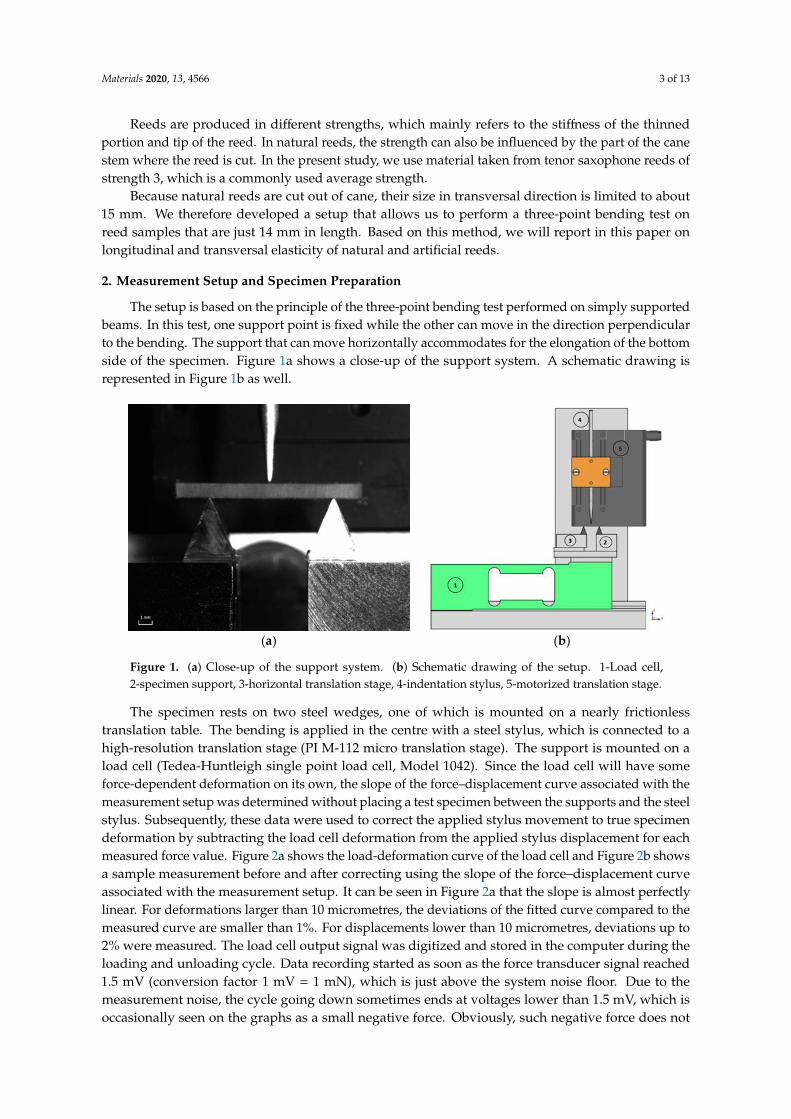
The setup is based on the principle of the three-point bending test performed on simply supportedbeams. In this test, one support point is fixed while the other can move in the direction perpendicularto the bending. The support that can move horizontally accommodates for the elongation of the bottomside of the specimen. Figure 1a shows a close-up of the support system. A schematic drawing isrepresented in Figure 1b as well.
Materials 2020, 13, x FOR PEER REVIEW 3 of 12
In the current paper, we will investigate the anisotropic elasticity parameters of both artificial
materials (Carbon Fiberreed and Légère Reed) and compare them to wet and dry natural reeds.
Natural reeds are produced by many manufacturers, and we will use reeds of one of the world
leading companies, Vandoren (Paris, France).
Reeds are produced in different strengths, which mainly refers to the stiffness of the thinned portion
and tip of the reed. In natural reeds, the strength can also be influenced by the part of the cane stem
where the reed is cut. In the present study, we use material taken from tenor saxophone reeds of
strength 3, which is a commonly used average strength.
Because natural reeds are cut out of cane, their size in transversal direction is limited to about 15
millimetres. We therefore developed a setup that allows us to perform a three-point bending test on
reed samples that are just 14mm in length. Based on this method, we will report in this paper on
longitudinal and transversal elasticity of natural and artificial reeds.
2. Measurement Setup and Specimen Preparation
The setup is based on the principle of the three-point bending test performed on simply
supported beams. In this test, one support point is fixed while the other can move in the direction
perpendicular to the bending. The support that can move horizontally accommodates for the
elongation of the bottom side of the specimen. Figure 1a shows a close-up of the support system. A
schematic drawing is represented in Figure 1b as well.
(a) (b)
Figure 1. (a) Close-up of the support system. (b) Schematic drawing of the setup. 1-Load cell, 2-
specimen support, 3-horizontal translation stage, 4-indentation stylus, 5-motorized translation stage.
The specimen rests on two steel wedges, one of which is mounted on a nearly frictionless
translation table. The bending is applied in the centre with a steel stylus, which is connected to a high-
resolution translation stage (PI M-112 micro translation stage). The support is mounted on a load cell
(Tedea-Huntleigh single point load cell, Model 1042). Since the load cell will have some force-
dependent deformation on its own, the slope of the force–displacement curve associated with the
measurement setup was determined without placing a test specimen between the supports and the
steel stylus. Subsequently, these data were used to correct the applied stylus movement to true
specimen deformation by subtracting the load cell deformation from the applied stylus displacement
for each measured force value. Figure 2a shows the load-deformation curve of the load cell and Figure
2b shows a sample measurement before and after correcting using the slope of the force–
displacement curve associated with the measurement setup. It can be seen in Figure 2a that the slope
is almost perfectly linear. For deformations larger than 10 micrometres, the deviations of the fitted
curve compared to the measured curve are smaller than 1%. For displacements lower than 10
micrometres, deviations up to 2% were measured. The load cell output signal was digitized and
stored in the computer during the loading and unloading cycle. Data recording started as soon as the
Figure 1. (a) Close-up of the support system. (b) Schematic drawing of the setup. 1-Load cell,2-specimen support, 3-horizontal translation stage, 4-indentation stylus, 5-motorized translation stage.
The specimen rests on two steel wedges, one of which is mounted on a nearly frictionlesstranslation table. The bending is applied in the centre with a steel stylus, which is connected to ahigh-resolution translation stage (PI M-112 micro translation stage). The support is mounted on aload cell (Tedea-Huntleigh single point load cell, Model 1042). Since the load cell will have someforce-dependent deformation on its own, the slope of the force–displacement curve associated with themeasurement setup was determined without placing a test specimen between the supports and the steelstylus. Subsequently, these data were used to correct the applied stylus movement to true specimendeformation by subtracting the load cell deformation from the applied stylus displacement for eachmeasured force value. Figure 2a shows the load-deformation curve of the load cell and Figure 2b showsa sample measurement before and after correcting using the slope of the force–displacement curveassociated with the measurement setup. It can be seen in Figure 2a that the slope is almost perfectlylinear. For deformations larger than 10 micrometres, the deviations of the fitted curve compared to themeasured curve are smaller than 1%. For displacements lower than 10 micrometres, deviations up to2% were measured. The load cell output signal was digitized and stored in the computer during theloading and unloading cycle. Data recording started as soon as the force transducer signal reached1.5 mV (conversion factor 1 mV = 1 mN), which is just above the system noise floor. Due to themeasurement noise, the cycle going down sometimes ends at voltages lower than 1.5 mV, which isoccasionally seen on the graphs as a small negative force. Obviously, such negative force does not

Materials 2020, 13, 4566 4 of 13
exist in reality, and the value falls within the noise interval around zero. The sampling rate was set to100 kHz, and the acquisition time was 100 ms. The same computer controlled the translation stage withan accuracy of better than 10 nanometres. This assured that the displacement was applied withoutshocks. When the motion of the stage is reversed at the end of the cycle, the stage has a mechanicalbacklash of approximately 2 micrometres. Because of this inevitable mechanical limitation, data pointsat the end of the bending cycle will not be used in calculations of modulus of elasticity.
Materials 2020, 13, x FOR PEER REVIEW 4 of 12
force transducer signal reached 1.5 mV (conversion factor 1 mV = 1 mN), which is just above the
system noise floor. Due to the measurement noise, the cycle going down sometimes ends at voltages
lower than 1.5 mV, which is occasionally seen on the graphs as a small negative force. Obviously,
such negative force does not exist in reality, and the value falls within the noise interval around zero.
The sampling rate was set to 100 kHz, and the acquisition time was 100 ms. The same computer
controlled the translation stage with an accuracy of better than 10 nanometres. This assured that the
displacement was applied without shocks. When the motion of the stage is reversed at the end of the
cycle, the stage has a mechanical backlash of approximately 2 micrometres. Because of this inevitable
mechanical limitation, data points at the end of the bending cycle will not be used in calculations of
modulus of elasticity.
(a) (b)
Figure 2. (a) Force–displacement curve of the load cell. (b) Typical measurement curve before and
after correcting for load cell compliance.
Specimens of 14 mm length, 1 mm thickness, and 2 mm width were prepared by cutting samples
out of the thick end part of the reeds, flattening, and polishing them as well as possible to the desired
dimensions. As thickness has an important influence on the elasticity values obtained from a three-
point bending test (power to the third), the obtained dimensions were measured with a calliper with
an accuracy of 10 micrometres. The actual thickness varied between 0.88 and 0.99 mm amongst
samples. The samples were tested in the custom-made setup using three subsequent bending cycles
of 100 micrometres, at intervals of 2.5 micrometres. This deformation range ensured that the
specimens were not permanently deformed in order to determine the elastic properties of the reeds.
Between each bending step, the specimen was left to relax for 0.1 seconds to avoid viscoelasticity
effects. One full indentation and release cycle takes 86 seconds. The specimens of the natural reeds
were drained in water during 15 minutes. A test was done on specimens drained for several hours,
and no measurable changes were found. A high-resolution calibrated camera (2056 × 2464 pixels) was
used to follow the bending process, and to determine the distance between the support points with
an accuracy of 11 micrometres.
From the measurement data, the modulus of elasticity E was calculated according to the Euler–
Bernoulli equation:
𝐸 =𝐹𝑙3
48𝐼𝑤 (1)
in which w is the deflection, F is the force, l is the distance between the supports, and I is the second
moment of area of the specimen. I is calculated from I = 𝑏ℎ3
12 , with b the width of the specimen and h
the height. The slope of the force-displacement curve determined the Young’s modulus of the reed
specimens.
Figure 2. (a) Force–displacement curve of the load cell. (b) Typical measurement curve before and aftercorrecting for load cell compliance.
Specimens of 14 mm length, 1 mm thickness, and 2 mm width were prepared by cutting samplesout of the thick end part of the reeds, flattening, and polishing them as well as possible to thedesired dimensions. As thickness has an important influence on the elasticity values obtained from athree-point bending test (power to the third), the obtained dimensions were measured with a calliperwith an accuracy of 10 micrometres. The actual thickness varied between 0.88 and 0.99 mm amongstsamples. The samples were tested in the custom-made setup using three subsequent bending cycles of100 micrometres, at intervals of 2.5 micrometres. This deformation range ensured that the specimenswere not permanently deformed in order to determine the elastic properties of the reeds. Between eachbending step, the specimen was left to relax for 0.1 seconds to avoid viscoelasticity effects. One fullindentation and release cycle takes 86 seconds. The specimens of the natural reeds were drained inwater during 15 minutes. A test was done on specimens drained for several hours, and no measurablechanges were found. A high-resolution calibrated camera (2056 × 2464 pixels) was used to followthe bending process, and to determine the distance between the support points with an accuracy of11 micrometres.
From the measurement data, the modulus of elasticity E was calculated according to theEuler–Bernoulli equation:
E =Fl3
48Iw(1)
in which w is the deflection, F is the force, l is the distance between the supports, and I is the secondmoment of area of the specimen. I is calculated from I = bh3
12 , with b the width of the specimen andh the height. The slope of the force-displacement curve determined the Young’s modulus of thereed specimens.

Materials 2020, 13, 4566 5 of 13
The modulus was determined over intervals along the bending cycle. As a trade-off betweenresolution and noise, we used intervals of approximately 10 micrometres of bending yielding fivemeasurement points along the bending trajectory. Over the intervals, the curve was approximated bylinear interpolation of the recorded force data. Elasticity was calculated separately for the loading andunloading part of the cycle.
To validate the setup and method, measurements were performed on a 1.0 mm thick sample ofpolystyrene and a 0.5 mm thick sample of copper with a span length of 14 mm. For copper, we used athinner sample to stay within the force range of the setup. The loading curves are shown in Figure 3.For copper, we found an elasticity modulus of 121 GPa, with a literature value between 117 GPa and133 GPa [10–12].
Materials 2020, 13, x FOR PEER REVIEW 5 of 12
The modulus was determined over intervals along the bending cycle. As a trade-off between
resolution and noise, we used intervals of approximately 10 micrometres of bending yielding five
measurement points along the bending trajectory. Over the intervals, the curve was approximated
by linear interpolation of the recorded force data. Elasticity was calculated separately for the loading
and unloading part of the cycle.
To validate the setup and method, measurements were performed on a 1.0 mm thick sample of
polystyrene and a 0.5 mm thick sample of copper with a span length of 14 mm. For copper, we used
a thinner sample to stay within the force range of the setup. The loading curves are shown in Figure
3. For copper, we found an elasticity modulus of 121 GPa, with a literature value between 117 GPa
and 133 GPa [10–12].
Figure 3. Force–displacement curve of a copper 0.5 mm sample, polystyrene 1.5 mm sample, and
polystyrene 1.5 mm sample, obtained in the three-point bending test.
According to the ASTM D143 standard, the thickness-to-length ratio of samples in a three-point
bending test should be minimal 1:14 to get good results. The length of the reed samples is limited to
14 mm, so we tried to do all measurements on samples of 1 mm thickness. For some experiments, we
had to use thicker samples to obtain force values that were high enough to get reliable measurements.
We will come back to this in the discussion. For the polystyrene sample of 1.0 mm thickness, we
found a value of 3.1 GPa. This is in the range reported in literature, which varies between 3 and 3.5
GPa [13].
As the actual dimensions of the specimens differ slightly from the desired dimensions, we will
report the measured force data after normalizing everything to 1 mm thickness and 2 mm width,
according to the linear dependence of bending force on the width and the power to the third
dependence on thickness.
3. Results
Table 1 gives an overview of the actual dimensions of the specimens. The length between the
support points was 13.6 mm. The mean thickness and width were calculated from three
measurements across the geometry of the specimen. Since the thickness and width of the moisturized
reeds will change due to the swelling, the wet specimens were measured again instantly after the
draining in water.
Figure 3. Force–displacement curve of a copper 0.5 mm sample, polystyrene 1.5 mm sample, andpolystyrene 1.5 mm sample, obtained in the three-point bending test.
According to the ASTM D143 standard, the thickness-to-length ratio of samples in a three-pointbending test should be minimal 1:14 to get good results. The length of the reed samples is limitedto 14 mm, so we tried to do all measurements on samples of 1 mm thickness. For some experiments,we had to use thicker samples to obtain force values that were high enough to get reliable measurements.We will come back to this in the discussion. For the polystyrene sample of 1.0 mm thickness, we founda value of 3.1 GPa. This is in the range reported in literature, which varies between 3 and 3.5 GPa [13].
As the actual dimensions of the specimens differ slightly from the desired dimensions, we willreport the measured force data after normalizing everything to 1 mm thickness and 2 mm width,according to the linear dependence of bending force on the width and the power to the third dependenceon thickness.
3. Results
Table 1 gives an overview of the actual dimensions of the specimens. The length between thesupport points was 13.6 mm. The mean thickness and width were calculated from three measurementsacross the geometry of the specimen. Since the thickness and width of the moisturized reeds willchange due to the swelling, the wet specimens were measured again instantly after the drainingin water.

Materials 2020, 13, 4566 6 of 13
Table 1. Thickness and width of different specimens.
Specimen Name Mean Thickness (mm) Mean Width (mm)
Carbon Fiberreed 1 Transversal 0.95 ± 0.01 1.91 ± 0.02Carbon Fiberreed 1 Longitudinal 0.95 ± 0.02 1.92 ± 0.01
Légère Reed 1 Transversal 0.95 ± 0.01 2.01 ± 0.01Légère Reed 1 Longitudinal 0.95 ± 0.01 1.93 ± 0.02
Dry Natural Reed 1 Transversal 0.95 ± 0.02 2.05 ± 0.01Dry Natural Reed 1 Longitudinal 0.97 ± 0.01 1.93 ± 0.03Wet Natural Reed 1 Transversal 0.98 ± 0.02 2.04 ± 0.01
Wet Natural Reed 1 Longitudinal 0.99 ± 0.02 1.96 ± 0.02
Carbon Fiberreed 2 Transversal 0.95 ± 0.01 1.95 ± 0.02Carbon Fiberreed 2 Longitudinal 0.97 ± 0.02 1.90 ± 0.02
Légère Reed 2 Transversal 0.95 ± 0.01 2.00 ± 0.01Légère Reed 2 Longitudinal 0.96 ± 0.01 1.86 ± 0.02
Dry Natural Reed 2 Transversal 0.88 ± 0.03 2.02 ± 0.01Dry Natural Reed 2 Longitudinal 0.95 ± 0.02 1.94 ± 0.02Wet Natural Reed 2 Transversal 0.99 ± 0.02 1.94 ± 0.01
Wet Natural Reed 2 Longitudinal 0.99 ± 0.02 1.94 ± 0.02
Carbon Fiberreed 3 Transversal 0.93 ± 0.03 1.97 ± 0.03Carbon Fiberreed 3 Longitudinal 0.92 ± 0.01 2.00 ± 0.01
Légère Reed 3 Transversal 0.95 ± 0.01 2.01 ± 0.02Légère Reed 3 Longitudinal 0.94 ± 0.02 1.89 ± 0.03
Dry Natural Reed 3 Transversal 0.94 ± 0.01 2.00 ± 0.02Dry Natural Reed 3 Longitudinal 0.91 ± 0.03 2.00 ± 0.02Wet Natural Reed 3 Transversal 0.95 ± 0.01 2.00 ± 0.02
Wet Natural Reed 3 Longitudinal 0.93 ± 0.02 2.03 ± 0.02
To compare the different materials and specimens with each other, preconditioning of the specimenswas needed so that the measured force-displacement curves became repeatable. For the wet naturalreed, the difference between the first and second cycle is large. After the second cycle, differencesbetween the cycles were less than 1% for most measurements from 10 micrometres onwards. Deviationsbetween cycles are far smaller than the differences between the materials and directions seen in Figure 4below. Therefore, the final third bending cycle is shown for all the specimens.
Figure 4 shows the results of the loading curves obtained in the third bending cycles for all fourmaterials (purple: Dry natural cane; green: Wet natural cane, red: Carbon Fiberreed; blue: Legèrereed) in the longitudinal and transversal direction. The different curves for each material are the threedifferent specimens.
The results show that the measured force in the longitudinal direction was for all four materialslarger than the transversal direction showing the anisotropic properties of the different materials.Table 2 shows the mean normalized (thickness: 1 mm; width: 2 mm) force at 40 micrometres. The forcefor the Carbon Fiberreed specimens in the longitudinal direction was 2.27 N with a deviation of 0.6 Nor more than 25%. Since the Carbon Fiberreed specimens are layered, the amount of carbon layers hasa substantial influence on the measured force and stiffness of the specimen.
We noticed that the Carbon Fiberreed longitudinal specimen with the lowest measured forcehad one layer of carbon less compared to the other two specimens. The force increased linearly.In the transversal direction, the deviation between the Carbon Fiberreed samples was small (0.02 N)compared to the mean force value of 0.62 N.
The longitudinal elasticity of Légère specimens is in the same order of magnitude as the longitudinalelasticity of the dry reed samples. The mean force at 40 micrometres for the Légère longitudinal reedsamples was 0.85 N, whereas 0.57 N for the dry reed specimens. The slope of the longitudinal Légèrespecimens’ curve is also more in trend with the longitudinal natural reed specimens compared to thelongitudinal Carbon Fiberreed samples. The measured normalized force for the transversal Légèrespecimens was 0.24 N and 0.07 N for the transversal dry reed samples.

Materials 2020, 13, 4566 7 of 13Materials 2020, 13, x FOR PEER REVIEW 7 of 12
(a) (b)
Figure 4. (a) Force–displacement curves of different reed materials in transversal direction. (b) Force–
displacement curves of different reed materials in longitudinal direction.
For the wet natural reed specimens, the measured normalized values at 40 micrometres were
0.015 N for the transversal direction and 0.28 N for the longitudinal direction. Due to the natural
character of the reed and the low measured values for the force, deviations were high, at. 0.008 N and
0.1 N, respectively. Wetting of the natural reed specimens has a much higher impact in the transversal
direction than the longitudinal direction. In the longitudinal direction, the force values decreased
with a factor of approximately two whereas in the transversal direction, a decrease with a factor of
more than five was observed.
Table 2. Summary of the measured force and moduli of elasticity for the different reed materials.
Force at 40 μm
Transversal (N)
Force at 40 μm
Longitudinal (N)
Ratio
Longitudinal/
Transversal
Young’s Modulus
Transversal (GPa)
Young’s Modulus
Longitudinal (GPa)
Carbon
Fibereed 0.62 (± 0.02) 2.27 (± 0.6) 3.6 (± 1.5) 5.3 (± 0.3) 18.9 (± 6.4)
Légère Reed 0.24 (± 0.02) 0.85 (± 0.06) 4.0 (± 0.3) 1.9 (± 0.1) 7.5 (± 0.3)
Dry Reed 0.07 (± 0.002) 0.57 (± 0.07) 10.0 (± 2.1) 0.5 (± 0.03) 5.0 (± 0.7)
Wet Reed 0.015 (± 0.008) 0.28 (± 0.1) 24.3 (± 8.0) 0.1 (± 0.05) 3.1 (± 0.4)
To compare the different slopes of the force–displacement curves of the materials, we calculated
the elasticity modulus of each measured specimen from the slope of the loading curve. The results
are also shown in Table 2. In the longitudinal direction, the Carbon Fiberreed had the highest
modulus of elasticity. A mean value of 18.9 GPa was found with a high standard deviation of 6.4 GPa,
probably mainly caused by the different number of carbon layers in different samples. When
comparing this value to the natural dry reed, it is seen that the slope of the Carbon Fiberreed was
much steeper than the natural dry reed. The mean Young’s modulus of the dry reed in the
longitudinal direction was 5.0 (±0.7) GPa or more than three times less stiff compared to the
longitudinal Carbon Fiberreed specimen. When the natural reed was drained in water, the Young’s
modulus in the longitudinal direction decreased to 3.1 (±0.4) GPa. The longitudinal Légère specimens
had an elasticity modulus of 7.5 (±0.3) GPa. This is in good trend, seen by the slopes from Figure 4,
with the elasticity modulus of the natural dry longitudinal specimens. Nevertheless, this value is
more than two times higher compared to the wet longitudinal reed Young’s modulus. Generally, the
natural wet reed is the most flexible material resulting in the lowest Young’s modulus in both
directions.
Furthermore, in the transversal direction, the Carbon Fiberreed had the highest modulus of
elasticity at 5.3 (±0.3) GPa. Subsequently, the plastic Légère reeds had the second-highest elasticity
modulus with a value of 1.9 (±0.1) GPa. When comparing those values to the dry natural reed, the
Carbon Fiberreed and plastic Légère reed were a factor of 10.6 and 3.8 stiffer in the transversal
Figure 4. (a) Force–displacement curves of different reed materials in transversal direction.(b) Force–displacement curves of different reed materials in longitudinal direction.
For the wet natural reed specimens, the measured normalized values at 40 micrometres were0.015 N for the transversal direction and 0.28 N for the longitudinal direction. Due to the naturalcharacter of the reed and the low measured values for the force, deviations were high, at. 0.008 N and0.1 N, respectively. Wetting of the natural reed specimens has a much higher impact in the transversaldirection than the longitudinal direction. In the longitudinal direction, the force values decreased witha factor of approximately two whereas in the transversal direction, a decrease with a factor of morethan five was observed.
Table 2. Summary of the measured force and moduli of elasticity for the different reed materials.
Force at 40 µmTransversal
(N)
Force at 40 µmLongitudinal
(N)
RatioLongitudinal/Transversal
Young’sModulus
Transversal(GPa)
Young’sModulus
Longitudinal(GPa)
Carbon Fibereed 0.62 (±0.02) 2.27 (±0.6) 3.6 (±1.5) 5.3 (±0.3) 18.9 (±6.4)Légère Reed 0.24 (±0.02) 0.85 (±0.06) 4.0 (±0.3) 1.9 (±0.1) 7.5 (±0.3)
Dry Reed 0.07 (±0.002) 0.57 (±0.07) 10.0 (±2.1) 0.5 (±0.03) 5.0 (±0.7)Wet Reed 0.015 (±0.008) 0.28 (±0.1) 24.3 (±8.0) 0.1 (±0.05) 3.1 (±0.4)
To compare the different slopes of the force–displacement curves of the materials, we calculatedthe elasticity modulus of each measured specimen from the slope of the loading curve. The results arealso shown in Table 2. In the longitudinal direction, the Carbon Fiberreed had the highest modulus ofelasticity. A mean value of 18.9 GPa was found with a high standard deviation of 6.4 GPa, probablymainly caused by the different number of carbon layers in different samples. When comparing thisvalue to the natural dry reed, it is seen that the slope of the Carbon Fiberreed was much steeperthan the natural dry reed. The mean Young’s modulus of the dry reed in the longitudinal directionwas 5.0 (±0.7) GPa or more than three times less stiff compared to the longitudinal Carbon Fiberreedspecimen. When the natural reed was drained in water, the Young’s modulus in the longitudinaldirection decreased to 3.1 (±0.4) GPa. The longitudinal Légère specimens had an elasticity modulus of7.5 (±0.3) GPa. This is in good trend, seen by the slopes from Figure 4, with the elasticity modulusof the natural dry longitudinal specimens. Nevertheless, this value is more than two times highercompared to the wet longitudinal reed Young’s modulus. Generally, the natural wet reed is the mostflexible material resulting in the lowest Young’s modulus in both directions.
Furthermore, in the transversal direction, the Carbon Fiberreed had the highest modulus ofelasticity at 5.3 (±0.3) GPa. Subsequently, the plastic Légère reeds had the second-highest elasticitymodulus with a value of 1.9 (±0.1) GPa. When comparing those values to the dry natural reed,

Materials 2020, 13, 4566 8 of 13
the Carbon Fiberreed and plastic Légère reed were a factor of 10.6 and 3.8 stiffer in the transversaldirection. The Young’s modulus of dry natural reed was 0.5 (±0.03) GPa. Nevertheless, when thenatural reed was drained in water, the Young’s modulus decreased to 0.1 (±0.05) GPa. As a result,the Carbon Fiberreed and plastic Légère reed were now more than a factor of 50 and 19 stiffer in thetransversal direction.
The ratio between the longitudinal and transversal elasticity moduli is given in Table 2. For theLégère reeds, the ratio is 4.0. A comparable value of 3.6 is found for the Carbon Fiber reeds. A muchhigher value of 10.0 was found for the natural dry reeds, and this ratio becomes much higher when thereeds are wet. The standard deviation of the ratio longitudinal/transversal of the wet reed is higher(24.3 (±8.0)), so the wettening process increases variability between reeds.
No noticeable differences between the loading and unloading curve were found in the CarbonFiberreed and plastic Légère reeds. For the natural reeds, the loading and unloading curves didnot coincide, which indicated the visco-elastic properties of the natural cane. Figure 5 shows theforce–displacement curves of the longitudinal reed samples. The blue curves represent the dry reedspecimens. The brown/orange curves show the measurement of wet reed specimens. The full line isthe forward bending part of the cycle and the dashed line represents the relaxation part. It is seen thatthe loading and unloading curve of the dry reed specimens coincided when taking into account themechanical backlash at the top of the curves. However, for the wet reed specimens, hysteresis wasclearly visible.
Materials 2020, 13, x FOR PEER REVIEW 8 of 12
direction. The Young’s modulus of dry natural reed was 0.5 (±0.03) GPa. Nevertheless, when the
natural reed was drained in water, the Young’s modulus decreased to 0.1 (±0.05) GPa. As a result, the
Carbon Fiberreed and plastic Légère reed were now more than a factor of 50 and 19 stiffer in the
transversal direction.
The ratio between the longitudinal and transversal elasticity moduli is given in Table 2. For the
Légère reeds, the ratio is 4.0. A comparable value of 3.6 is found for the Carbon Fiber reeds. A much
higher value of 10.0 was found for the natural dry reeds, and this ratio becomes much higher when
the reeds are wet. The standard deviation of the ratio longitudinal/transversal of the wet reed is
higher (24.3 (±8.0)), so the wettening process increases variability between reeds.
No noticeable differences between the loading and unloading curve were found in the Carbon
Fiberreed and plastic Légère reeds. For the natural reeds, the loading and unloading curves did not
coincide, which indicated the visco-elastic properties of the natural cane. Figure 5 shows the force–
displacement curves of the longitudinal reed samples. The blue curves represent the dry reed
specimens. The brown/orange curves show the measurement of wet reed specimens. The full line is
the forward bending part of the cycle and the dashed line represents the relaxation part. It is seen
that the loading and unloading curve of the dry reed specimens coincided when taking into account
the mechanical backlash at the top of the curves. However, for the wet reed specimens, hysteresis
was clearly visible.
In the wet natural reeds, elastic strain energy is dissipated in the wet cane material. Since we
measure the force with the corresponding displacement, the enclosed surface area represents the
energy loss in µJ. Table 3 summarizes the energy losses for each measured specimen calculated from
the third bending cycle. Energy losses are given as a percentage as well to enable a relative
comparison since differences in maximum displacement were noticed between specimens.
Figure 5. Force–displacement curves of dry and wet reed samples in the longitudinal direction.
To be able to better measure the hysteresis of the wet reeds, specimens with a thickness of 1.5
mm were also tested. For these specimens, hysteresis was apparently noticeable for both the
longitudinal and transversal direction. The corresponding values are reported in Table 3. The energy
loss is calculated by firstly determining the surface under the loading curve and hereafter subtracting
the surface under the unloading curve. For the thicker specimens a higher energy loss was seen in
the longitudinal direction. The energy loss raised from 15.7% for the 1mm high specimens to 24.1%
for the 1.5mm thick specimens. When comparing the energy losses in the transversal direction to the
longitudinal direction, it was observed that more energy (33.3%) is dissipated in the transversal
direction.
All the loading and unloading curves of the tested specimens showed a nearly linear behaviour,
except the wet reed specimens. For the wet reed specimens, the measured points showed a larger
deviation from a linear fit in the unloading curve in the [0, 10] µm range where the closing of the
hysteresis occurred.
Figure 5. Force–displacement curves of dry and wet reed samples in the longitudinal direction.
In the wet natural reeds, elastic strain energy is dissipated in the wet cane material. Since wemeasure the force with the corresponding displacement, the enclosed surface area represents the energyloss in µJ. Table 3 summarizes the energy losses for each measured specimen calculated from the thirdbending cycle. Energy losses are given as a percentage as well to enable a relative comparison sincedifferences in maximum displacement were noticed between specimens.
To be able to better measure the hysteresis of the wet reeds, specimens with a thickness of 1.5 mmwere also tested. For these specimens, hysteresis was apparently noticeable for both the longitudinal andtransversal direction. The corresponding values are reported in Table 3. The energy loss is calculatedby firstly determining the surface under the loading curve and hereafter subtracting the surface underthe unloading curve. For the thicker specimens a higher energy loss was seen in the longitudinaldirection. The energy loss raised from 15.7% for the 1 mm high specimens to 24.1% for the 1.5 mmthick specimens. When comparing the energy losses in the transversal direction to the longitudinaldirection, it was observed that more energy (33.3%) is dissipated in the transversal direction.

Materials 2020, 13, 4566 9 of 13
Table 3. Hysteresis losses for different samples of wet natural reed.
LongitudinalThickness 1.5 mm
TransversalThickness 1.5 mm
LongitudinalThickness 1.0 mm
Energy Loss[µJ]
Energy Loss[%]
Energy Loss[µJ]
Energy Loss[%]
Energy Loss[µJ]
Energy Loss[%]
Sample 1 7.3 14.2 1.6 30.6 4.7 19.1Sample 2 11.7 32.8 1.2 28.1 3.9 16.1Sample 3 11.2 25.3 1.8 41.2 2.3 11.9
All the loading and unloading curves of the tested specimens showed a nearly linear behaviour,except the wet reed specimens. For the wet reed specimens, the measured points showed a largerdeviation from a linear fit in the unloading curve in the [0, 10] µm range where the closing of thehysteresis occurred.
When the mean elasticity modulus was calculated for the wet longitudinal specimens, the valuesfor the three different samples were, respectively, 3.36 GPa, 3.38 GPa, and 2.61 GPa for the loadingcurve and 3.44 GPa, 3.45 GPa, and 2.58 GPa for the unloading curve, so the moduli of elasticity arenearly the same for loading and unloading. Furthermore, no trend was seen between the stiffness ofthe reed specimens and the amount of losses due to visco-elasticity.
For the wet natural reeds, we needed to use samples of 1.5 mm thickness to obtain large enoughforce values for reliable measurements. As we will discuss later, this leads to an artefact. To have abetter view on this effect, we also tested the other reed materials on samples with 1.5 mm thickness.The elasticity calculations for the specimens with different thicknesses are shown in Table 4. In thelongitudinal direction, higher elasticity moduli were found when the thickness of the samples wasreduced. In the transversal direction, the effect is limited to less than 20% for the artificial materialsand for dry cane. For wet cane the effect is nearly 60%. In the longitudinal direction, the effect was,respectively, 22.7% and 27.1% for the Carbon Fiberreed and the Légère reed. For wet cane, the effectwas 47.6% and for dry cane, 66.7%. In general, reducing the thickness of the specimens had a largerinfluence in the longitudinal direction compared to the transversal direction, and was more pronouncedon the natural material.
Table 4. Moduli of elasticity for reed specimens with different thickness.
1.5 mmYoung’s
ModulusTransversal
(GPa)
1 mmYoung’s
ModulusTransversal
(GPa)
Difference(%)
1.5 mmYoung’s
ModulusLongitudinal
(GPa)
1mmYoung’s
ModulusLongitudinal
(GPa)
Difference(%)
Carbon Fiberreed 4.3 (±0.3) 5.3 (±0.3) 19.1 15.4 (±1.1) 18.9 (±6.4) 22.7Légère Reed 1.8 (±0.01) 1.9 (±0.1) 7.7 5.9 (±0.2) 7.5 (±0.3) 27.1
Dry Reed 0.4 (±0.06) 0.5 (±0.03) 11.6 3.0 (±0.2) 5.0 (±0.7) 66.7Wet Reed 0.2 (±0.02) 0.1 (±0.05) 59.5 2.1 (±0.3) 3.1 (±0.4) 47.6
4. Discussion
4.1. Methodology
The reed materials used for testing were only available in limited size, so a special setup needed tobe developed to do a three-point bending test on such small samples. The aspect ratio of the specimensneeds to fulfil certain criteria so that the correct desired stress–strain rate is induced from the appliedboundary conditions. The elasticity modulus can be underestimated by the three-point bending testdue to the shear forces and the indentation effect of the loading head and supports [14]. Since theinfluence of the shear stresses is highly influenced by the span-to-height ratio, a span-to-height ratio ofa minimum of 14 needs to be ensured, according to the ASTM D143 for static bending testing [15].When the samples were cut to 1.5 mm, this criterion was not fulfilled, and a lower modulus of elasticity

Materials 2020, 13, 4566 10 of 13
was measured. On the other hand, forces are higher for the thicker samples so they can be measuredwith better accuracy. For this reason, we reduced our samples to less than 1 mm at the given maximallength of 14 mm so that influence of shear stresses was minimized. Only for the measurements on wetnatural reeds in transversal direction did the 1.5 mm samples prove to be necessary to obtain bettersignal to noise ratio in the force measurement.
The recording of the force–displacement curves was triggered when the output voltage of the straingage amplifier reached 1.5 mV, corresponding to a force of 1.5 mN. The maximum displacement wasset to 100 micrometres to assure the samples were elastically deformed and not damaged. A difficultyin the mechanical setup was the positioning of the samples between the supports. A high-resolutioncamera was used to observe the positioning of the sample so that it could be aligned with the supportsto minimize torsional effects and to assure that the steel stylus was perfectly perpendicular on thesurface specimen. We verified with the copper and polystyrene samples that, despite remaininginaccuracies, reliable results were obtained that correspond to literature values.
4.2. Experimental Results
No literature values of modulus of elasticity were available for the Carbon Fiberreeds.The force-displacement curves in Figure 4 showed that the Carbon Fiberreed samples had thehighest stiffness. Besides the Hollow Fiber Foamresin Compound (HFC) material, the Carbon Fiberreedalso contained carbon fibres mimicking the fibres of the natural cane. The observed high stiffness inthe current study is more due to the carbon fibres than HFC since moduli of elasticity of reinforcedcarbon are high [16]. Besides this, the elasticity modulus of carbon fibre materials is highly dependenton the composite material used. In the longitudinal direction, the stiffness of the Carbon Fiberreed issix times higher than the stiffness of wet natural cane, while in the transversal direction, it is more than50 times stiffer. Moreover, the Carbon Fiberreeds were non-homogeneous due to the alternating layersof carbon and HFC. In [17], it is described that only the last one-quarter to three-eighths of an inch atthe tip of the reed controls the elastic response. Remarkably, no carbon fibres were observed in thisregion so that the contribution to the elastic response and longitudinal stiffness of the reed is minimalwhen played. Only the HFC material was seen at the reed tip.
For the polypropylene reed, the patent of Légère reports that a synthetic reed with an orientedsemi-crystalline thermoplastic material has been made with the longitudinal modulus and densitythe same as cane in playing conditions. At the beginning of the patent, it is reported that isotropicpolypropylene with a density of approximately 0.91 g/mL has an elastic modulus of approximately 1.0to 1.6 GPa, less than one-third the modulus of cane. It is not known how, for the patent, the modulus ofelasticity was determined for both polypropylene and cane. A longitudinal modulus of a conditionedreed of 5-10 GPa is mentioned further on in the patent. Our results show a longitudinal elasticitymodulus of 7.5 GPa for the Légère reeds, which lies between the reported values of 5–10 GPa,and a transversal modulus of 1.9 GPa. Compared to the 3.1 GPa found in the longitudinal direction ofwet cane, the Légère reed material comes the closest to the properties of the natural material. In thetransversal direction however, the Légère material (1.9 GPa) is nearly 20 times stiffer than wet naturalcane (0.1 GPa). For the transversal direction, no values for modulus of elasticity are given in [4] for theLégère reeds, but the patent does state that the transversal modulus of the Légère polypropylene reedis considerably higher compared to the transversal elasticity modulus of the natural cane.
More literature data can be found for natural cane. In [1], the Young’s modulus on hollowcylinders were determined of the hypodermal sterome or the outer layer of the cane in the longitudinaldirection from which the parenchyma cells were removed. Values of approximately 10 GPa werefound in the lower and middle part of the stem. These values decreased in the high part of the stem.The Young’s modulus of the parenchyma cells was determined as well by subtracting the contributionof the hypodermal sterome from the overall stiffness, which was measured by a three-point bendingtest. The average longitudinal Young’s modulus was 9 GPa in the middle of the stem and reducedsignificantly in the upper part of the stem (values of 1–2 GPa). The experiments of the current study
Materials 2020, 13, 4566 11 of 13
show an average modulus of elasticity of 5.0 ± 0.7 GPa in the longitudinal direction for the naturaldry reed which is in the measured range reported by Spatz et al. [1]. In a more recent study of thesame authors [18], the modulus of elasticity was obtained for seven natural cane plants with noleaves in the base part. The authors compared the results acquired from their experiment to theresults of a three-point bending test on an independent set from the same clonal stand of the ArundoDonax (H. Beissner, unpublished data). The average values were 4.79 ± 0.7 GPa and 5.23 ± 1.25 GPawhich are in trend with our results obtained on small samples. Weidenfeller et al. [8] compared thestorage modulus of two Arundo Donax samples by DMA and found a value of 5.25 GPa and 6.25 GPa.Although the static modulus of elasticity is similar conceptually to the storage modulus, values willdiffer. Nonetheless, the loss factor was small at low frequencies in order for the difference between thestorage and elastic modulus to be low.
Soaking the natural cane samples in water reduced the modulus of elasticity both in longitudinaland transversal directions. Especially in the transversal direction, the effect was huge: Elasticitydropped from 0.5 GPa to 0.1 GPa, while in the longitudinal direction, it decreased from 5.0 GPa to3.1 GPa. Obataya et al. [19] studied the effect of relative humidity (RH) on the Arundo Donax andshowed that the dynamic Young’s modulus decreased with increasing the RH as well. In future, moreinsight in the macroscopic and microscopic elastic behaviour of reed material could be obtained usingultrasonic techniques to generate longitudinal waves. From the wave propagation velocity, elasticityparameters could be calculated not only in longitudinal and transversal directions of the specimens,but also along the thickness axis.
It is likely that the low elasticity modulus in the transversal direction is related to a better sealingto the mouthpiece as it will help the player to easily bend the sides of the reed with the lips to makea tight seal with the mouthpiece. Open sides lead to the so-called, and feared, “squeak” sound,especially in less-practiced players. Also, the very low transversal modulus can lead to an effectivede-coupling between vibrating fibres, which in turn may have a huge effect on vibrational modes of thereed tip when playing the instrument. In wet natural cane, the ratio of longitudinal over transversalmodulus of elasticity is a factor of more than 24. In the artificial materials, this ratio is approximately4. The difference can be compensated by using different thickness profiles, but a technical problemcan occur when thickness needs to be reduced so far as to obtain stiffness values that approximate thenatural reeds.
The purpose of the loading-unloading curves was to estimate hysteresis effects caused byvisco-elasticity. Dissipation of energy due to visco-elasticity has been reported in Arundo Donax [20].The current measurements showed a significant difference in visco-elasticity between dry and wet reedsamples. The hysteresis increased when the reeds were soaked in water. This is advantageous sincevisco-elasticity in wood materials dampens the vibrations [21], thus leading to less sharp resonancepeaks in the vibration spectrum.
5. Conclusions
The elastic material parameters were investigated for natural and artificial reeds in the twoprincipal directions of the reed. A setup was designed to evaluate the moduli of elasticity on smallreed specimens by a three-point bending test. A comparison of the longitudinal moduli of elasticity tothe transversal bending moduli indicates that currently used instrument reed materials are anisotropic.The highest moduli of elasticity were found for the Carbon Fiberreed with mean values of 18.9 GPain the longitudinal direction and 5.3 GPa in the transversal direction. For the plastic Légère reeds,mean values of 7.5 GPa and 1.9 GPa were obtained. These values were higher than those of naturaldry reed, but the values measured on wet natural reeds, mimicking the playing condition, are still farlower, especially in transversal direction, with values of 3.1 GPa in the longitudinal and 0.1 GPa inthe transversal direction. The ratio of the longitudinal/transversal modulus of elasticity was about24 for the wet natural reed specimens, which is much higher than for any of the other materials.No visco-elasticity was observed in the synthetic reed materials and natural dry reed, but it was clearly

Materials 2020, 13, 4566 12 of 13
present in the natural wet reed specimens. The results showed that energy losses were higher in thetransversal direction compared to the longitudinal direction.
Author Contributions: Conceptualization, E.U. and J.J.J.D.; methodology, software and validation, E.U.;writing—original draft preparation, E.U.; writing—review and editing, J.J.J.D.; supervision, J.J.J.D.; All authorshave read and agreed to the published version of the manuscript.
Funding: This research received no external funding.
Conflicts of Interest: The authors declare that they have no conflict of interest.
References
1. Spatz, H.-C.; Beismann, H.; Brüchert, F.; Emanns, A.; Speck, T. Biomechanics of the giant reed Arundo donax.Philos. Trans. R. Soc. B Biol. Sci. 1997, 352, 1–10. [CrossRef]
2. Kolesik, P.; Mills, A.; Sedgley, M. Anatomical Characteristics Affecting the Musical Performance of ClarinetReeds Made from Arundo donax L. (Gramineae). Ann. Bot. 1998, 81, 151–155. [CrossRef]
3. Casadonte, D.J. The Clarinet Reed: An Introduction to Its Biology, Chemistry, and Physics. Ph.D. Thesis,The Ohio State University, Columbus, OH, USA, 1995.
4. Legere, G. Oriented polymer reeds for musical instruments. U.S. Patent 6,087,571, 11 July 2000.5. Harry Hartmann Fiberreed. Available online: https://fiberreed.de/en/the-idea/ (accessed on 10 August 2020).6. Kawasaki, M.; Nobuchi, T.; Nakafushi, Y.; Nose, M.; Shibata, M.; Li, P.; Shiojiri, M. Structural observations
and biomechanical measurements of clarinet reeds made from Arundo donax. Microsc. Res. Tech. 2017, 80,959–968. [CrossRef] [PubMed]
7. Bucur, V. Handbook of Materials for Wind Musical Instruments; Springer Science and Business Media LLC:Berlin/Heidelberg, Germany, 2019.
8. Weidenfeller, B.; Lambri, O.A.; Bonifacich, F.G.; Arlic, U.; Gargicevich, D. Damping of the WoodwindInstrument Reed Material Arundo donax L. Mater. Res. 2018, 21, e20170795. [CrossRef]
9. Taillard, P.-A.; Laloë, F.; Gross, M.; Dalmont, J.-P.; Kergomard, J. Statistical Estimation of MechanicalParameters of Clarinet Reeds Using Experimental and Numerical Approaches. Acta Acust. United Acust.Aims Scope 2014, 100, 555–573. [CrossRef]
10. Merchant, H.D.; Khatibi, G.; Weiss, B. Elastic and elastoplastic response of thin copper foil. J. Mater. Sci.2004, 39, 4157–4170. [CrossRef]
11. Xu, L.; Xie, X.; Fan, H. Polycrystalline aggregates in the thin-wire configuration. J. Appl. Phys. 2011, 110, 84909.[CrossRef]
12. Zhu, J.; Feng, J.; Guo, Z. Mechanical properties of commercial copper current-collector foils. RSC Adv. 2014,4, 57671–57678. [CrossRef]
13. Engineering Toolbox. Young’s Modulus—Tensile and Yield Strength for Common Materials. Availableonline: https://www.engineeringtoolbox.com/young-modulus-d_417.html (accessed on 9 August 2020).
14. Hein, P.R.G.; Brancheriau, L. Comparison between three-point and four-point flexural tests to determinewood strength of Eucalyptus specimens. Maderas Cienc. Tecnol. 2018, 20, 333–342. [CrossRef]
15. ASTM D143-09. Standard Test Methods for Small Clear Specimens of Timber; ASTM International:West Conshohocken, PA, USA, 2009.
16. Miyagawa, H.; Sato, C.; Mase, T.; Drown, E.; Drzal, L.T.; Ikegami, K. Transverse elastic modulus of carbonfibers measured by Raman spectroscopy. Mater. Sci. Eng. A 2005, 412, 88–92. [CrossRef]
17. Backus, J.G. Reeds for Woodwind Instruments. U.S. Patent 3,420,132, 7 January 1969.18. Speck, O.; Spatz, H. Damped oscillations of the giant reed Arundo donax (Poaceae). Am. J. Bot. 2004, 91,
789–796. [CrossRef] [PubMed]19. Obataya, E.; Norimoto, M. Acoustic properties of a reed (Arundo donax L.) used for the vibrating plate of a
clarinet. J. Acoust. Soc. Am. 1999, 106, 1106–1110. [CrossRef]

Materials 2020, 13, 4566 13 of 13
20. Lord, A.E. Viscoelasticity of the giant reed material Arundo donax. Wood Sci. Technol. 2003, 37, 177–188.[CrossRef]
21. Gambhir, M.L.; Jamwal, N. Building and Construction Materials; McGraw-Hill Education India: New York, NY,USA, 2014.
Publisher’s Note: MDPI stays neutral with regard to jurisdictional claims in published maps and institutionalaffiliations.
© 2020 by the authors. Licensee MDPI, Basel, Switzerland. This article is an open accessarticle distributed under the terms and conditions of the Creative Commons Attribution(CC BY) license (http://creativecommons.org/licenses/by/4.0/).