Anatomical Region Differences and Age-Related Changes in Copper, Zinc, and Manganese Levels in the...
12
Anatomical Region Differences and Age-Related Changes in Copper, Zinc, and Manganese Levels in the Human Brain Patrícia Ramos & Agostinho Santos & Nair Rosas Pinto & Ricardo Mendes & Teresa Magalhães & Agostinho Almeida Received: 4 June 2014 /Accepted: 25 July 2014 # Springer Science+Business Media New York 2014 Abstract Using inductively coupled plasma-mass spectrometry after samples microwave-assisted acid digestion, zinc (Zn), copper (Cu), and manganese (Mn) levels were measured in 14 different areas of the human brain of adult individuals (n =42; 71±12, range 50–101 years old) without a known history of neurodegenerative, neurological, or psychi- atric disorder. The main goals of the work were to establish the “normal” (reference) values for those elements in the human brain and to evaluate the age-related changes, a prior and indispensable step in order to enlighten the role of trace element (TE) in human brain physiology and their involve- ment in aging and neurodegenerative processes. Considering the mean values for the 14 regions, Zn (mean ± sd; range 53± 5; 43–61 μg/g) was found at higher levels, followed by Cu (22 ±5; 10–37 μg/g) and Mn (1.3±0.3; 0.5–2.7 μg/g). The TE distribution across the brain tissue showed to be quite hetero- geneous: the highest levels of Zn were found in the hippocam- pus (70±10; 49–95 μg/g) and superior temporal gyrus (68±10; 44–88 μg/g) and the lowest in the pons (33±8; 19–51 μg/g); the highest levels of Cu and Mn were found in the putamen (36±13; 21–76 μg/g and 2.5±0.8; 0.7–4.5 μg/g, respectively) and the lowest in the medulla (11±6; 2–30 μg/g and 0.8±0.3; 0.2–1.8 μg/g, respectively). A tendency for an age-related in- crease in Zn and Mn levels was observed in most brain regions while Cu levels showed to be negatively correlated with age. Keywords Human brain . Copper . Zinc . Manganese . Aging . Postmortem analysis . Inductively coupled plasma-mass spectrometry Introduction As a result of longer life expectancy, neurodegenerative dis- eases (ND) will become one of the most prevalent diseases worldwide during the next decades [1]. Along with “natural” aging, genetic predisposition, and environmental factors [2], imbalances on both essential and toxic trace elements’ ho- meostasis in particular areas of the brain have been identified as potentially responsible for the development of some ND [3–5], but the evidence is still fragmentary and the link re- mains to be elucidated. Zinc (Zn) is catalytic and structural cofactor of more than 100 enzymes, including the antioxidant enzyme superoxide dismutase (Cu,Zn-SOD) [6]. In the brain, colocalized with glutamate, Zn is also involved in the function of the gluta- matergic synapses, acting as a neuromodulator [7]. Being the catalytic component of several enzymes, copper (Cu) also has a great importance in the normal development and functioning of the brain, being involved in essential P. Ramos : A. Almeida (*) REQUIMTE, Department of Chemical Sciences, Laboratory of Applied Chemistry, Faculty of Pharmacy, Porto University, Rua de Jorge Viterbo Ferreira 228, 4050-313 Porto, Portugal e-mail: [email protected] A. Santos : N. R. Pinto : R. Mendes : T. Magalhães National Institute of Legal Medicine and Forensic Sciences, North Branch, Jardim Carrilho Videira, 4050-167 Porto, Portugal A. Santos : T. Magalhães CENCIFOR – Forensic Science Center, Largo da Sé Nova, s/n, 3000-213 Coimbra, Portugal A. Santos : T. Magalhães Faculty of Medicine, Porto University, Al. Prof. Hernâni Monteiro, 4200-319 Porto, Portugal A. Santos School of Health Sciences, Minho University, Campus Gualtar, 4710-057 Braga, Portugal T. Magalhães Biomedical Sciences Institute Abel Salazar, Porto University, Rua de Jorge Viterbo Ferreira 228, 4050-313 Porto, Portugal Biol Trace Elem Res DOI 10.1007/s12011-014-0093-6
Transcript of Anatomical Region Differences and Age-Related Changes in Copper, Zinc, and Manganese Levels in the...

Anatomical Region Differences and Age-Related Changesin Copper, Zinc, and Manganese Levels in the Human Brain
Patrícia Ramos & Agostinho Santos & Nair Rosas Pinto &
Ricardo Mendes & Teresa Magalhães &Agostinho Almeida
Received: 4 June 2014 /Accepted: 25 July 2014# Springer Science+Business Media New York 2014
Abstract Using inductively coupled plasma-massspectrometry after samples microwave-assisted acid digestion,zinc (Zn), copper (Cu), and manganese (Mn) levels weremeasured in 14 different areas of the human brain of adultindividuals (n=42; 71±12, range 50–101 years old) without aknown history of neurodegenerative, neurological, or psychi-atric disorder. The main goals of the work were to establish the“normal” (reference) values for those elements in the humanbrain and to evaluate the age-related changes, a prior andindispensable step in order to enlighten the role of traceelement (TE) in human brain physiology and their involve-ment in aging and neurodegenerative processes. Consideringthe mean values for the 14 regions, Zn (mean ± sd; range 53±5; 43–61μg/g) was found at higher levels, followed byCu (22
±5; 10–37 μg/g) and Mn (1.3±0.3; 0.5–2.7 μg/g). The TEdistribution across the brain tissue showed to be quite hetero-geneous: the highest levels of Zn were found in the hippocam-pus (70±10; 49–95 μg/g) and superior temporal gyrus (68±10;44–88 μg/g) and the lowest in the pons (33±8; 19–51 μg/g);the highest levels of Cu and Mn were found in the putamen(36±13; 21–76 μg/g and 2.5±0.8; 0.7–4.5 μg/g, respectively)and the lowest in the medulla (11±6; 2–30 μg/g and 0.8±0.3;0.2–1.8 μg/g, respectively). A tendency for an age-related in-crease in Zn and Mn levels was observed in most brain regionswhile Cu levels showed to be negatively correlated with age.
Keywords Human brain . Copper . Zinc .Manganese .
Aging . Postmortem analysis . Inductively coupledplasma-mass spectrometry
Introduction
As a result of longer life expectancy, neurodegenerative dis-eases (ND) will become one of the most prevalent diseasesworldwide during the next decades [1]. Along with “natural”aging, genetic predisposition, and environmental factors [2],imbalances on both essential and toxic trace elements’ ho-meostasis in particular areas of the brain have been identifiedas potentially responsible for the development of some ND[3–5], but the evidence is still fragmentary and the link re-mains to be elucidated.
Zinc (Zn) is catalytic and structural cofactor of more than100 enzymes, including the antioxidant enzyme superoxidedismutase (Cu,Zn-SOD) [6]. In the brain, colocalized withglutamate, Zn is also involved in the function of the gluta-matergic synapses, acting as a neuromodulator [7].
Being the catalytic component of several enzymes, copper(Cu) also has a great importance in the normal developmentand functioning of the brain, being involved in essential
P. Ramos :A. Almeida (*)REQUIMTE, Department of Chemical Sciences, Laboratory ofApplied Chemistry, Faculty of Pharmacy, Porto University, Rua deJorge Viterbo Ferreira 228, 4050-313 Porto, Portugale-mail: [email protected]
A. Santos :N. R. Pinto : R. Mendes : T. MagalhãesNational Institute of Legal Medicine and Forensic Sciences, NorthBranch, Jardim Carrilho Videira, 4050-167 Porto, Portugal
A. Santos : T. MagalhãesCENCIFOR – Forensic Science Center, Largo da Sé Nova, s/n,3000-213 Coimbra, Portugal
A. Santos : T. MagalhãesFaculty of Medicine, Porto University, Al. Prof. Hernâni Monteiro,4200-319 Porto, Portugal
A. SantosSchool of Health Sciences, Minho University, Campus Gualtar,4710-057 Braga, Portugal
T. MagalhãesBiomedical Sciences Institute Abel Salazar, Porto University, Rua deJorge Viterbo Ferreira 228, 4050-313 Porto, Portugal
Biol Trace Elem ResDOI 10.1007/s12011-014-0093-6
processes such as energy metabolism, antioxidant defense,iron metabolism, and neurotransmitter synthesis [8].
Manganese (Mn) also plays a key role in a number ofphysiologic processes, being a constituent of several enzymes(e.g., Mn-SOD, the principal antioxidant enzyme in the mito-chondria). In the brain, the Mn-activated enzyme glutaminesynthetase participates in the glutamate metabolism,converting the amino acid glutamate to glutamine [9].
Based on the above considerations, it is assumed that Cu,Zn, and Mn homeostasis are crucial in maintaining normalmetabolic and redox balance in the brain, and their dysregu-lation may contribute to oxidative stress, which have beenassociated to the pathogenesis of several ND, such asAlzheimer’s and Parkinson’s disease [3, 10–12].
Most of the current information about the relationship be-tween trace elements (TE) and brain functioning is based onanimal studies [13, 14] or relies on determinations in cerebro-spinal fluid, whole blood, or blood serum or plasma [15–17, 13,18, 19]. The direct study of TE levels in normal and patholog-ical human brain are scarce, limited to a few brain areas [20,21], and/or involve a small number of subjects [22, 23]. Addi-tionally, and regarding the specific topic of the TE levels in thedifferent brain areas, most of the published postmortem [23, 24]and in vivo [25, 26] studies are focused solely on iron. There-fore, more extensive elemental mappings are needed in order tounderstand the specific roles of TE in the human brain and tointerpret the data obtained from ND patients.
It must be emphasized that increased evidence exists show-ing that “the brain is a heterogeneous organ with anatomicallyand physiologically different areas which may be affected indifferent manners by the aging process” [27]. Therefore, oldstudies examining the whole brain or large cerebral regions,including a number of heterogeneous areas, are of little value[27]. Based on this background, the main goal of the presentstudy was to directly determine the Cu, Zn, andMn levels in 14different areas of the human brain in order to establish “normal”(reference) levels for these TE in each region and to evaluatethe age-related changes. This kind of data is indispensable toenlighten the role of Cu, Zn, and Mn in human brain physiol-ogy and their involvement in aging. Furthermore, it will allowfuture interpretation of results found in individuals affected byND and understand the underlying disease mechanisms. Theresults for one Parkinson’s disease (PD) and two Alzheimer’sdisease (AD) patients are also presented.
Material and Methods
Subjects
Brain samples were obtained from men (n=27; 67±11 yearsold) and women (n=15; 77±12 years old) not registered in thePortuguese National Registry of Refusal to Organ Donation
database and complying with all the current regulations re-garding human tissue collection for scientific researchpurposes.
Samples were collected from individuals submitted to fo-rensic autopsy exams during the first semester of 2012 at theNorth Branch (Porto) of the Portuguese National Institute ofLegal Medicine and Forensic Sciences (INMLCF). Individ-uals from each of the following age groups were studied: 50–59 (n=10), 60–69 (n=10), 70–79 (n=10), 80–89 (n=9), and≥90 (n=3) years old. Inclusion criteria were (a) the absence ofa history of known neurodegenerative, neurological, or psy-chiatric disorder, (b) the absence of injuries involving thecentral nervous system (CNS), and (c) macroscopically nor-mal brain tissue.
Samples from two individuals with documented AD(women, 73 and 85 years old) and one individual with PD(woman, 91 years old) were also collected and studied.
Sample Collection
Samples were collected by the pathologists at the INMLCFfollowing a standard protocol.
To prevent sample contamination, all materials, includingthe stainless steel tools used by the pathologists, were previ-ously decontaminated with a 5 % (v/v) nitric acid solutionprepared from concentrated (≥69 %) HNO3 (Sigma-Aldrich,Germany) and thoroughly rinsed with ultrapure water (resis-tivity 18.2 MΩ cm at 25 °C) produced by a Milli-Q RG waterpurification system (Millipore, USA).
After removing the brain from the cranium, the contami-nating blood was washed away with ultrapure water. Themeninges were removed with plastic tweezers, and the brainwas washed again with ultrapure water to minimize samplecontamination with blood or cerebrospinal fluid.
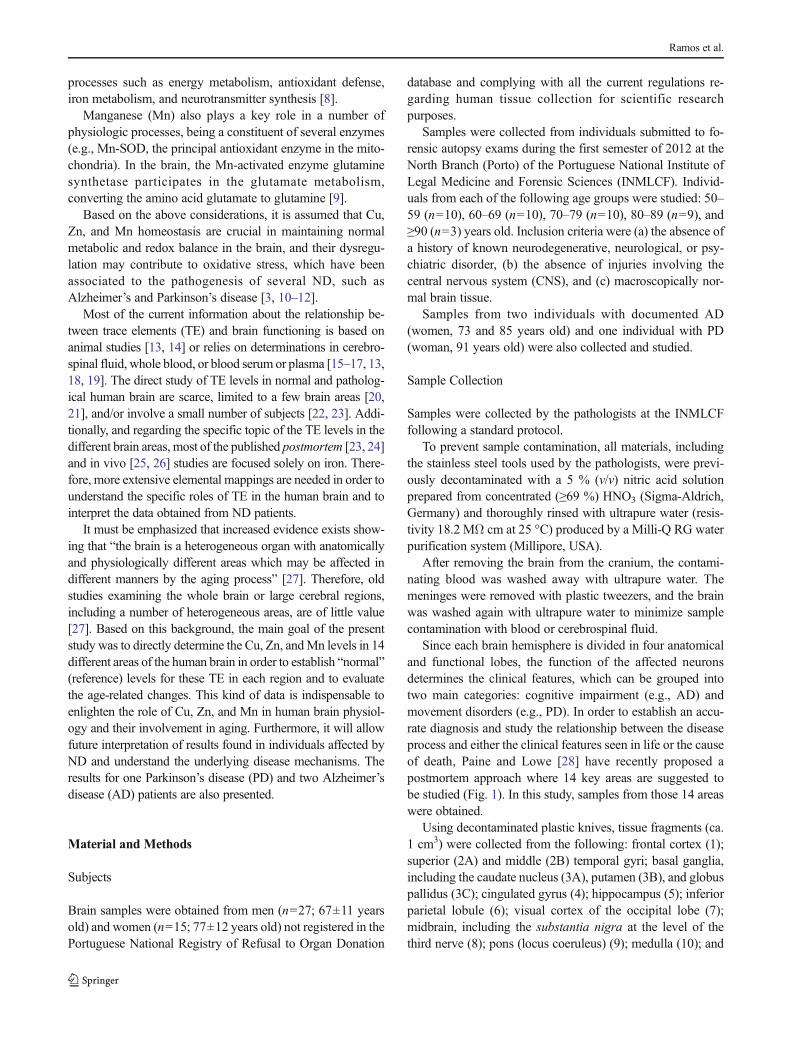
Since each brain hemisphere is divided in four anatomicaland functional lobes, the function of the affected neuronsdetermines the clinical features, which can be grouped intotwo main categories: cognitive impairment (e.g., AD) andmovement disorders (e.g., PD). In order to establish an accu-rate diagnosis and study the relationship between the diseaseprocess and either the clinical features seen in life or the causeof death, Paine and Lowe [28] have recently proposed apostmortem approach where 14 key areas are suggested tobe studied (Fig. 1). In this study, samples from those 14 areaswere obtained.
Using decontaminated plastic knives, tissue fragments (ca.1 cm3) were collected from the following: frontal cortex (1);superior (2A) and middle (2B) temporal gyri; basal ganglia,including the caudate nucleus (3A), putamen (3B), and globuspallidus (3C); cingulated gyrus (4); hippocampus (5); inferiorparietal lobule (6); visual cortex of the occipital lobe (7);midbrain, including the substantia nigra at the level of thethird nerve (8); pons (locus coeruleus) (9); medulla (10); and
Ramos et al.
cerebellum (dentate nucleus) (11). Samples were thoroughlywashed with ultrapure water and stored in decontaminatedpolypropylene tubes (Sarstedt, Germany) at −4 °C untilanalysis.
Sample Pretreatment
After defrosting, the samples were placed in a dry oven(Raypa, Spain) at 110 °C until constant weight (ca. 24 h).Dried samples (ca. 100–500 mg) were weighed directly in themic rowave oven d iges t ion vesse l s , p rev ious lydecontaminated with 10 % (v/v) HNO3 and thoroughly rinsedwith ultrapure water. Samples were digested with 2.5 mL ofconcentrated (≥65 % w/w) HNO3 (TraceSELECT®, Fluka,France) and 1.0 mL of ≥30 % (v/v) H2O2 solution(TraceSELECT®) in an MLS 1200 Mega microwave oven(Milestone, Italy), equipped with an HPR 1,000/10 rotor, andusing the following power (W)/time (min) program: 250/1,0/2, 250/5, 400/5, and 600/5. After cooling, sample solutionswere made up to 50 mL with ultrapure water and stored inclosed propylene tubes at 4 °C until analysis.
Copper, Zinc, and Manganese Determination
Copper, Zn, andMn quantification was performed by ICP-MSusing a VG Elemental (Winsford, UK), PlasmaQuad 3(quadrupole-based) instrument equipped with a glass concen-tric nebulizer (Meinhard® type A), a water-cooled glass spraychamber with impact bead, a standard quartz tube torch, andnickel sampling and skimmer cones. Both the spray chamberand sampling interface were cooled to 12 °C by circulatingwater. For sample introduction, a Minipuls 3 (Gilson, France)peristaltic pump was used. High-purity (99.9999 %) argon(Gasin, Portugal) was used as the nebulizer and plasma gas.The equipment control and data acquisition were made
through the PlasmaLab software (Thermo Scientific, Bremen,Germany). The ICP-MS analysis was carried out under thefollowing conditions: argon flow rate, 13 L/min; auxiliaryargon flow rate, 0.92 L/min; nebulizer flow rate, 0.60 L/min;RF power, 1,350 W; scan regions dwell time, 200 ms; detec-tion mode: pulse counting. Besides other 15 elements from9Be to 238U, whose results will be published later, the elemen-tal isotopes (m/z ratios) 55Mn, 65Cu, and 66Zn were monitoredfor analytical determination, and 45Sc, 89Y, 115In, 159Tb, and209Bi were monitored as internal standards.
The instrument was daily tuned for maximum signal sen-sitivity and stability using 115In as the target isotope with a10 μg/L tuning solution prepared by dilution of a commercialmultielement aqueous solution (AccuTrace™, ICP-MS 200.8-TUN-1; AccuStandards, New Haven, CT, USA).
ICP-MS calibrating solutions were prepared by dilution ofa commercial multielement aqueous solution (AccuTrace™Reference Standard, ICP-MS 200.8-CAL1R-1; Isostandardsmaterial, Madrid, Spain). Calibration curve was obtained withsix solutions of element concentrations within the 1–200 μg/Lrange. An internal standard (Sc, Y, In, Tb, and Bi) solutionwas prepared by dilution of a commercial solution(AccuTrace™ Reference Standard, ICP-MS 200.8-IS-1;AccuStandards), and it was added to all samples and standardssolutions in order to obtain a 10-μg/L final concentration. Allthe solutions were prepared with 2 % (v/v) HNO3.
Analytical Quality Control
Because human brain tissue is not available as a certifiedreference material (CRM) for Cu, Zn, and Mn determination,fish protein (DORM-3) and dogfish liver (DOLT-4) CertifiedReference Material for Trace Metals (National ResearchCouncil, Canada) were used for analytical quality controlpurposes. CRMs were subjected to the same sample
Fig. 1 Sampled brain regions, as suggested by Paine and Lowe [28]:frontal cortex (1), superior (2A) and middle (2B) temporal gyri, basalganglia including the caudate nucleus (3A), putamen (3B) and globuspallidus (3C), cingulated gyrus (4), hippocampus (5), inferior parietal
lobule (6), visual cortex of the occipital lobe (7), midbrain (including thesubstantia nigra at the level of the third nerve) (8), pons-locus coeruleus(9), medulla (10), and cerebellum-dentate nucleus (11)
Distribution of Copper, Zinc, and Manganese in the Human Brain
pretreatment. The values obtained proved the accuracy of theanalytical procedure (Table 1).
One sample blank was performed in each microwave-assisted acid digestion series (10 samples). In total, 77 sampleblanks were run, and the mean value (Cu=0.16 μg/L (range0.08–0.46); Zn=4.31 μg/L (range 0.04–18.46); Mn=0.02 μg/L (range 0.01–0.14)) was subtracted from the samplevalues.
Statistical Analysis
The descriptive statistics and correlations were calculatedusing Microsoft Office Excel 2010 (Microsoft Co., USA).The means were compared by unpaired Student’s t test atα=0.05 significance level using GraphPad Prism 5 (GraphPadSoftware, USA).
Results
Anatomical Region Differences on Zn, Cu, and Mn Levels
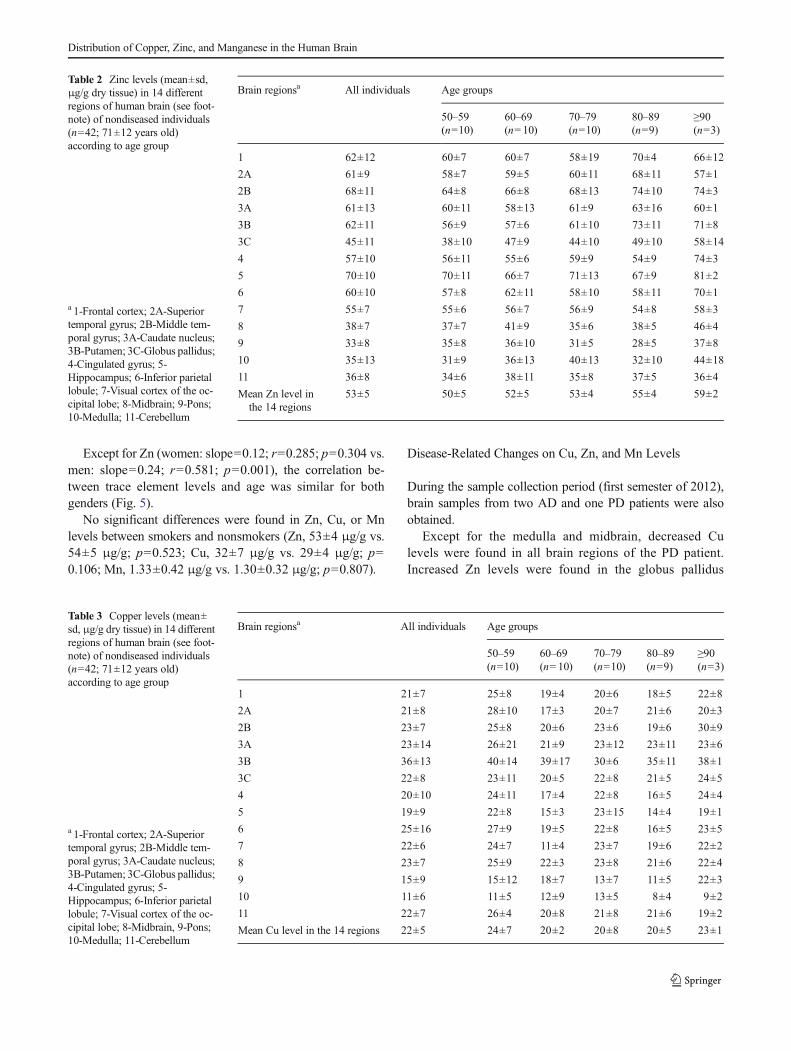
The results (mean±sd μg/g dry tissue) obtained for each of the14 different brain regions studied are summarized in Tables 2(Zn), 3 (Cu), and 4 (Mn). Zinc (53±5; 43–61 μg/g) waspresent at higher levels than Cu (22±5; 10–37 μg/g) and Mn(1.3±0.3; 0.5–2.7 μg/g).
The results showed that the Zn, Cu, and Mn distribution isquite heterogeneous. Regardless of age group (i.e., all indi-viduals), Zn highest levels were found in the hippocampus (70±10 μg/g) and middle temporal gyrus (66±11 μg/g), the twomain regions associated to memory [29], and the lowest inpons (33±8 μg/g) and medulla (35±13μg/g). Copper andMnhighest levels were found in the putamen (Cu, 36±13 μg/g;Mn, 2.5±0.8 μg/g). High levels of Mn were also found in thecaudate nucleus (2.3±0.7 μg/g) and globus pallidus (2.0±1.2 μg/g).
As observed for Zn, the lowest levels of Cu and Mn werealso found in the pons (Cu, 15±9 μg/g; Mn, 0.8±0.3 μg/g)and medulla (Cu, 11±6 μg/g: Mn, 0.8±0.3 μg/g).
Considering the mean value for the 14 brain regions, Znlevels were positively correlated with Cu and Fe levels (datafor Fe are published elsewhere [24]) (Spearman correlationcoefficient 0.496 and 0.621, respectively; p<0.05). At indi-vidual regions, positive correlation was found for Cu and Znand for Cu andMn levels in 9 out of the 14 regions. In 6 out ofthe 14 regions, Cu and Fe levels were also positivelycorrelated.
Age-Related Changes on Cu, Zn, and Mn Levels
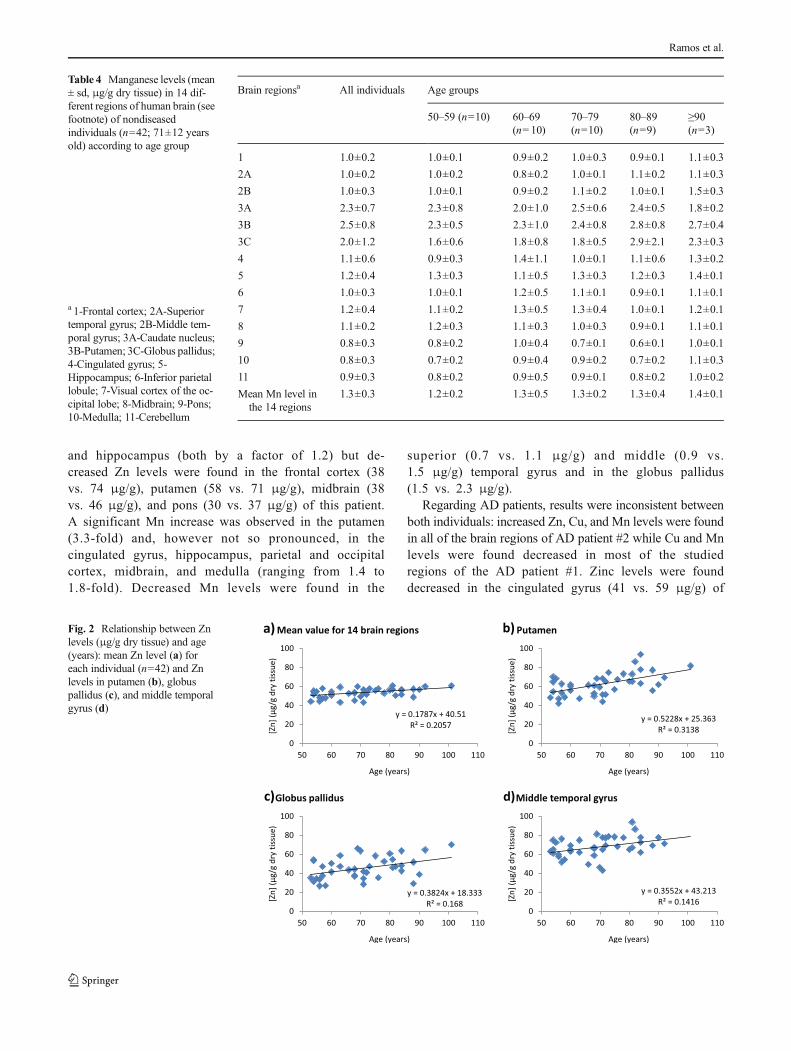
Considering the mean value of the results obtained for the 14regions, a tendency for an age-related increase in brain levelswas found for Zn and Mn but not for Cu (Fig. 2).
The tendency for a direct correlation between Zn brainlevels and age was observed in 10 out of the 14 regionsstudied, the most significant being for the putamen (r=0.560; p<0.0001), globus pallidus (r=0.410; p=0.008) andmiddle temporal gyrus (r=0.376; p=0.017) (Fig. 2).
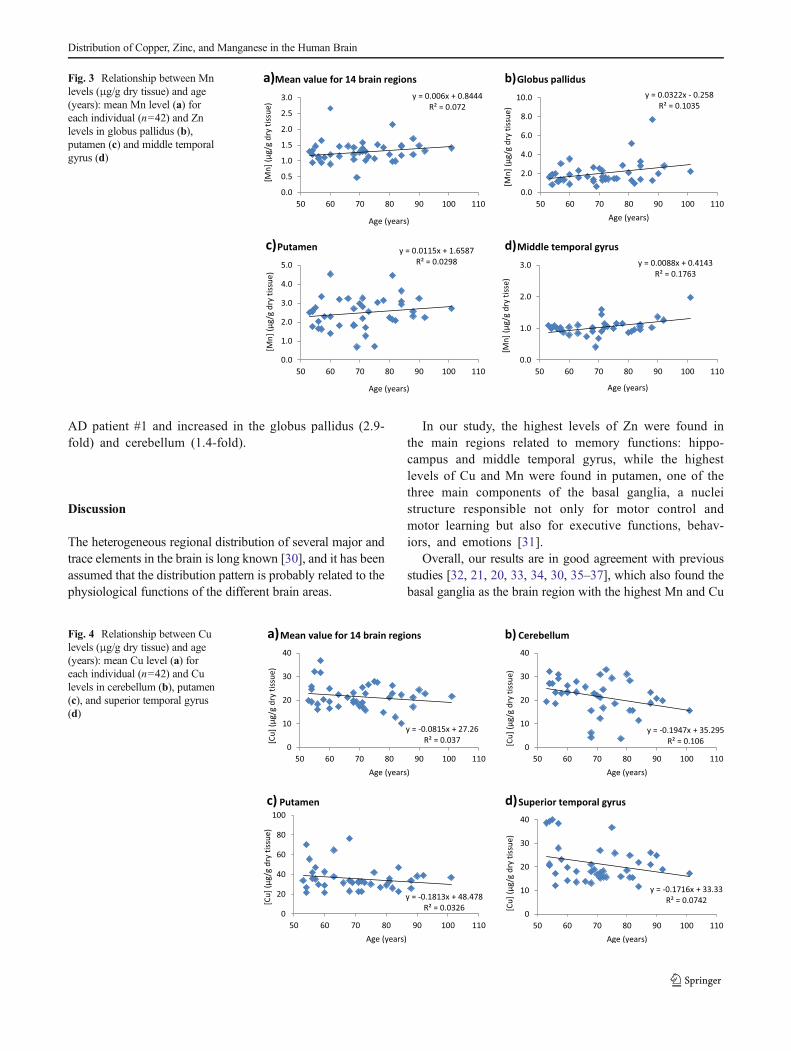
A positive correlation between Mn brain levels and agewas also observed. Again, putamen (r=0.173; p=0.274),globus pallidus (r=0.322; p=0.038), and middle temporalgyrus (r=0.281; p=0.079) were the regions where this ten-dency was more pronounced (Fig. 3).
On the contrary, a tendency for a negative correlationbetween Cu brain levels and age was found in 9 out of the14 regions studied, the most significant being for the cerebel-lum (r=0.312; p=0.047), and, although with no statisticalsignificance, in the putamen (r=0.118; p=0.461) and superiortemporal gyrus (r=0.229; p=0.150) (Fig. 4).
Gender-Related Differences and Effect of Smoking Habitson Cu, Zn, and Mn Levels
Considering the mean element level (i.e., the mean value forthe 14 regions of each subject), no gender-related statisticaldifferences (p>0.05) were found (Zn, 54±5 μg/g for womenvs. 54±5 μg/g for men; Cu, 20±5 μg/g for women vs. 22±5 μg/g for men; Mn, 1.2±0.3 μg/g for women vs. 1.3±0.4 μg/g for men). Also, no gender-related differences were found atany individual brain region.
Table 1 Results obtained in thedetermination of Cu, Zn, and Mn(μg/g dry weight basis) in certi-fied reference materials
a Information value (i.e., valuewhich could not be certified be-cause of insufficient informationto accurately assess uncertainties)
DORM-3 DOLT-4
Acceptable range Experimental value(n=3) (mean ± sd(min–max))
Acceptable range Experimental value(n=3) (mean ± sd(min–max))
Cu (μg/g) 15.5±0.63 15.2±0.3 (14.9–15.5) 31.2±1.1 31.5±0.3 (31.3–31.8)
Zn (μg/g) 51.3±3.1 52.1±0.6 (51.4–52.1) 116±6 118±8 (110–122)
Mna (μg/g) 4.6 4.5±0.2 (4.4–4.7) – 10.6±1.2 (9.8–12.0)
Ramos et al.
Except for Zn (women: slope=0.12; r=0.285; p=0.304 vs.men: slope=0.24; r=0.581; p=0.001), the correlation be-tween trace element levels and age was similar for bothgenders (Fig. 5).
No significant differences were found in Zn, Cu, or Mnlevels between smokers and nonsmokers (Zn, 53±4 μg/g vs.54±5 μg/g; p=0.523; Cu, 32±7 μg/g vs. 29±4 μg/g; p=0.106; Mn, 1.33±0.42 μg/g vs. 1.30±0.32 μg/g; p=0.807).
Disease-Related Changes on Cu, Zn, and Mn Levels
During the sample collection period (first semester of 2012),brain samples from two AD and one PD patients were alsoobtained.
Except for the medulla and midbrain, decreased Culevels were found in all brain regions of the PD patient.Increased Zn levels were found in the globus pallidus
Table 2 Zinc levels (mean±sd,μg/g dry tissue) in 14 differentregions of human brain (see foot-note) of nondiseased individuals(n=42; 71±12 years old)according to age group
a 1-Frontal cortex; 2A-Superiortemporal gyrus; 2B-Middle tem-poral gyrus; 3A-Caudate nucleus;3B-Putamen; 3C-Globus pallidus;4-Cingulated gyrus; 5-Hippocampus; 6-Inferior parietallobule; 7-Visual cortex of the oc-cipital lobe; 8-Midbrain; 9-Pons;10-Medulla; 11-Cerebellum
Brain regionsa All individuals Age groups
50–59(n=10)
60–69(n=10)
70–79(n=10)
80–89(n=9)
≥90(n=3)
1 62±12 60±7 60±7 58±19 70±4 66±12
2A 61±9 58±7 59±5 60±11 68±11 57±1
2B 68±11 64±8 66±8 68±13 74±10 74±3
3A 61±13 60±11 58±13 61±9 63±16 60±1
3B 62±11 56±9 57±6 61±10 73±11 71±8
3C 45±11 38±10 47±9 44±10 49±10 58±14
4 57±10 56±11 55±6 59±9 54±9 74±3
5 70±10 70±11 66±7 71±13 67±9 81±2
6 60±10 57±8 62±11 58±10 58±11 70±1
7 55±7 55±6 56±7 56±9 54±8 58±3
8 38±7 37±7 41±9 35±6 38±5 46±4
9 33±8 35±8 36±10 31±5 28±5 37±8
10 35±13 31±9 36±13 40±13 32±10 44±18
11 36±8 34±6 38±11 35±8 37±5 36±4
Mean Zn level inthe 14 regions
53±5 50±5 52±5 53±4 55±4 59±2
Table 3 Copper levels (mean±sd, μg/g dry tissue) in 14 differentregions of human brain (see foot-note) of nondiseased individuals(n=42; 71±12 years old)according to age group
a 1-Frontal cortex; 2A-Superiortemporal gyrus; 2B-Middle tem-poral gyrus; 3A-Caudate nucleus;3B-Putamen; 3C-Globus pallidus;4-Cingulated gyrus; 5-Hippocampus; 6-Inferior parietallobule; 7-Visual cortex of the oc-cipital lobe; 8-Midbrain, 9-Pons;10-Medulla; 11-Cerebellum
Brain regionsa All individuals Age groups
50–59(n=10)
60–69(n=10)
70–79(n=10)
80–89(n=9)
≥90(n=3)
1 21±7 25±8 19±4 20±6 18±5 22±8
2A 21±8 28±10 17±3 20±7 21±6 20±3
2B 23±7 25±8 20±6 23±6 19±6 30±9
3A 23±14 26±21 21±9 23±12 23±11 23±6
3B 36±13 40±14 39±17 30±6 35±11 38±1
3C 22±8 23±11 20±5 22±8 21±5 24±5
4 20±10 24±11 17±4 22±8 16±5 24±4
5 19±9 22±8 15±3 23±15 14±4 19±1
6 25±16 27±9 19±5 22±8 16±5 23±5
7 22±6 24±7 11±4 23±7 19±6 22±2
8 23±7 25±9 22±3 23±8 21±6 22±4
9 15±9 15±12 18±7 13±7 11±5 22±3
10 11±6 11±5 12±9 13±5 8±4 9±2
11 22±7 26±4 20±8 21±8 21±6 19±2
Mean Cu level in the 14 regions 22±5 24±7 20±2 20±8 20±5 23±1
Distribution of Copper, Zinc, and Manganese in the Human Brain
and hippocampus (both by a factor of 1.2) but de-creased Zn levels were found in the frontal cortex (38vs. 74 μg/g), putamen (58 vs. 71 μg/g), midbrain (38vs. 46 μg/g), and pons (30 vs. 37 μg/g) of this patient.A significant Mn increase was observed in the putamen(3.3-fold) and, however not so pronounced, in thecingulated gyrus, hippocampus, parietal and occipitalcortex, midbrain, and medulla (ranging from 1.4 to1.8-fold). Decreased Mn levels were found in the
superior (0.7 vs. 1.1 μg/g) and middle (0.9 vs.1.5 μg/g) temporal gyrus and in the globus pallidus(1.5 vs. 2.3 μg/g).
Regarding AD patients, results were inconsistent betweenboth individuals: increased Zn, Cu, and Mn levels were foundin all of the brain regions of AD patient #2 while Cu and Mnlevels were found decreased in most of the studiedregions of the AD patient #1. Zinc levels were founddecreased in the cingulated gyrus (41 vs. 59 μg/g) of
Table 4 Manganese levels (mean± sd, μg/g dry tissue) in 14 dif-ferent regions of human brain (seefootnote) of nondiseasedindividuals (n=42; 71±12 yearsold) according to age group
a 1-Frontal cortex; 2A-Superiortemporal gyrus; 2B-Middle tem-poral gyrus; 3A-Caudate nucleus;3B-Putamen; 3C-Globus pallidus;4-Cingulated gyrus; 5-Hippocampus; 6-Inferior parietallobule; 7-Visual cortex of the oc-cipital lobe; 8-Midbrain; 9-Pons;10-Medulla; 11-Cerebellum
Brain regionsa All individuals Age groups
50–59 (n=10) 60–69(n=10)
70–79(n=10)
80–89(n=9)
≥90(n=3)
1 1.0±0.2 1.0±0.1 0.9±0.2 1.0±0.3 0.9±0.1 1.1±0.3
2A 1.0±0.2 1.0±0.2 0.8±0.2 1.0±0.1 1.1±0.2 1.1±0.3
2B 1.0±0.3 1.0±0.1 0.9±0.2 1.1±0.2 1.0±0.1 1.5±0.3
3A 2.3±0.7 2.3±0.8 2.0±1.0 2.5±0.6 2.4±0.5 1.8±0.2
3B 2.5±0.8 2.3±0.5 2.3±1.0 2.4±0.8 2.8±0.8 2.7±0.4
3C 2.0±1.2 1.6±0.6 1.8±0.8 1.8±0.5 2.9±2.1 2.3±0.3
4 1.1±0.6 0.9±0.3 1.4±1.1 1.0±0.1 1.1±0.6 1.3±0.2
5 1.2±0.4 1.3±0.3 1.1±0.5 1.3±0.3 1.2±0.3 1.4±0.1
6 1.0±0.3 1.0±0.1 1.2±0.5 1.1±0.1 0.9±0.1 1.1±0.1
7 1.2±0.4 1.1±0.2 1.3±0.5 1.3±0.4 1.0±0.1 1.2±0.1
8 1.1±0.2 1.2±0.3 1.1±0.3 1.0±0.3 0.9±0.1 1.1±0.1
9 0.8±0.3 0.8±0.2 1.0±0.4 0.7±0.1 0.6±0.1 1.0±0.1
10 0.8±0.3 0.7±0.2 0.9±0.4 0.9±0.2 0.7±0.2 1.1±0.3
11 0.9±0.3 0.8±0.2 0.9±0.5 0.9±0.1 0.8±0.2 1.0±0.2
Mean Mn level inthe 14 regions
1.3±0.3 1.2±0.2 1.3±0.5 1.3±0.2 1.3±0.4 1.4±0.1
Fig. 2 Relationship between Znlevels (μg/g dry tissue) and age(years): mean Zn level (a) foreach individual (n=42) and Znlevels in putamen (b), globuspallidus (c), and middle temporalgyrus (d)
Ramos et al.
AD patient #1 and increased in the globus pallidus (2.9-fold) and cerebellum (1.4-fold).
Discussion
The heterogeneous regional distribution of several major andtrace elements in the brain is long known [30], and it has beenassumed that the distribution pattern is probably related to thephysiological functions of the different brain areas.
In our study, the highest levels of Zn were found inthe main regions related to memory functions: hippo-campus and middle temporal gyrus, while the highestlevels of Cu and Mn were found in putamen, one of thethree main components of the basal ganglia, a nucleistructure responsible not only for motor control andmotor learning but also for executive functions, behav-iors, and emotions [31].
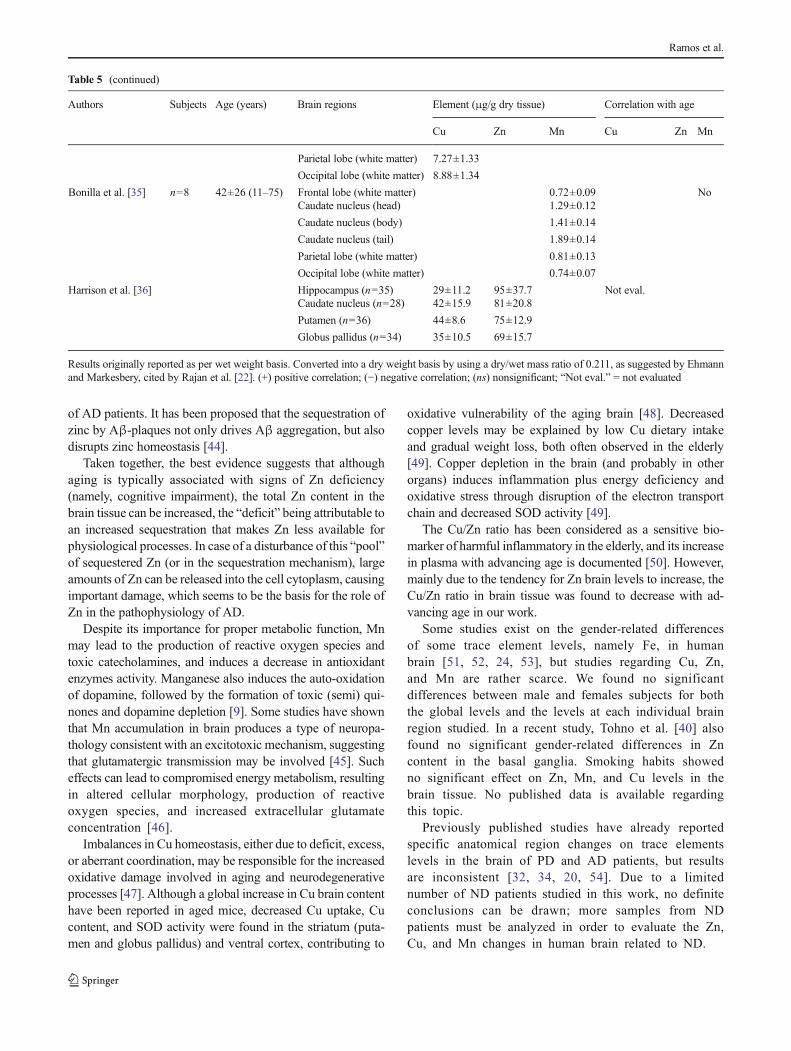
Overall, our results are in good agreement with previousstudies [32, 21, 20, 33, 34, 30, 35–37], which also found thebasal ganglia as the brain region with the highest Mn and Cu
Fig. 3 Relationship between Mnlevels (μg/g dry tissue) and age(years): mean Mn level (a) foreach individual (n=42) and Znlevels in globus pallidus (b),putamen (c) and middle temporalgyrus (d)
Fig. 4 Relationship between Culevels (μg/g dry tissue) and age(years): mean Cu level (a) foreach individual (n=42) and Culevels in cerebellum (b), putamen(c), and superior temporal gyrus(d)
Distribution of Copper, Zinc, and Manganese in the Human Brain
content and the hippocampus as one of the Zn-richest brainareas (Table 5).
In a very recent paper, Krebs et al. [38] also reported aheterogeneous distribution of Cu and Mn. For a group of 11individuals (65±10; 48–81 years old), they also found theputamen and the globus pallidus as the brain regions whereCu and Mn were present at higher levels, while the ponspresented the lowest levels. However, they found a quitehomogeneous distribution for Zn.
Rajan et al. [22] also reported a heterogeneous distributionof Zn (n=8; 50–60 years old individuals). However, comparedwith our results, significantly higher levels were found with avery different distribution: the highest Zn levels were found inthe medulla and parietal cortex and the lowest in the hippo-campus and pons. Their levels for Cu are in good agreementwith those found in our study.
The significant correlation between Zn and Fe and betweenCu and Fe in some specific regions of the brain was alsoobserved by other authors [38, 39], indicating a close physi-ological relationship between those elements [38].
A significant tendency for an age-related increase in brainlevels was found for Zn and Mn but not for Cu. At individualbrain regions, the tendency for an age-related increase in Znlevels was observed in 10 out of the 14 different regionsstudied.
Hebbrecht et al. [21] also found a significant increase withage of Zn andMn levels in the cortical structures (p<0.05) andbasal ganglia (p<0.01) of n=18 subjects (7 to 79 years old).However, Tohno et al. [40], in a study regarding minerals inthe basal ganglia, found no such relationship in the putamen,caudate nucleus, or globus pallidus of nondiseased elderlyindividuals (n=45; 70 to 101 years old). In a small study
(n=8; 11 to 75 years old individuals), Bonilla et al. [36] alsoreported no significant correlation between brain Mn levelsand age.
For Cu, concordant results were reported by Bonilla et al.[35], who also found a negative correlation between brain Culevels and age in a small study (n=7; 11 to 75 years oldindividuals), but Hebbrecht et al. [21] did not found suchtendency in any of the brain regions studied.
Besides its role in antioxidant cell response, Zn is involvedin glutaminergic transmission and confers biological activityto several brain enzymes and growth factors. Disturbances ofZn homeostasis have been associated with several brain dys-functions, including the age-related decline in brain functions.Zinc has the potential to act as a modulator of both excitatoryand inhibitory neurotransmission, and Zn imbalances canimpair transmitters’ release [41]. Zinc is released into thesynaptic cleft alongside glutamate, and this connection be-tween Zn and glutamatergic neurotransmission allows it tomodulate overall brain excitability and to influence synapticplasticity [42]. Studies in aging show that the brain gluta-matergic system is weakened, particularly in the frontal cor-tex, hippocampus, and striatum.
Moreover, experimental studies have shown that, despitean unchanged (or even an increased) total Zn content in thebrain of aged animals, the activity of some Zn dependentenzymes was significantly impaired [43]. On the other hand,disturbances on Zn-binding proteins (e.g., metallothioneins,α2-macroglobulin), which confer protection against stress andinflammation during young/adult age and control the concen-tration of readily available Zn, have been considered as re-sponsible for brain damage in advanced age [43], and a largeamount of Zn has been found in the core of amyloid-β plaques
Womeny = 0,1223x + 44,303
R² = 0,081Men
y = 0,2424x + 36,519R² = 0,3382
0
10
20
30
40
50
60
70
50 60 70 80 90 100 110
[Zn]
(μg/
g dr
y �s
sue)
Age (years)
Womeny = -0,0465x + 23,955
R² = 0,0134
Meny = -0,0666x + 26,545
R² = 0,01940
5
10
15
20
25
30
35
40
50 60 70 80 90 100 110
[Cu]
(μg/
g dr
y �s
sue)
Age (years)
Meny = 0,0106x + 0,5939
R² = 0,1573
Womeny = 0,0081x + 0,5923
R² = 0,1402
0.0
0.5
1.0
1.5
2.0
2.5
3.0
50 60 70 80 90 100 110[M
n] (μ
g/g
dry
�ssu
e)Age (years)
Fig. 5 Relationship between themean value for Zn, Cu, and Mn(μg/g dry tissue) in the 14 brainareas studied and age (years) inmen ( ) and women ( )
Ramos et al.
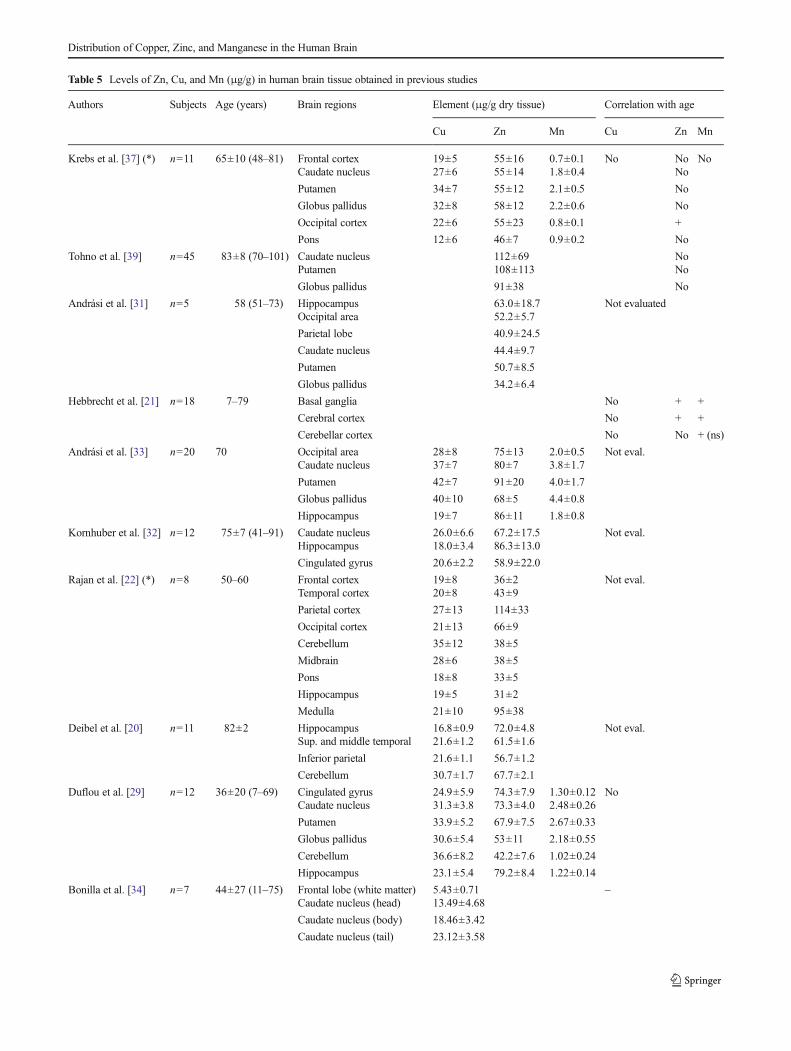
Table 5 Levels of Zn, Cu, and Mn (μg/g) in human brain tissue obtained in previous studies
Authors Subjects Age (years) Brain regions Element (μg/g dry tissue) Correlation with age
Cu Zn Mn Cu Zn Mn
Krebs et al. [37] (*) n=11 65±10 (48–81) Frontal cortex 19±5 55±16 0.7±0.1 No No NoCaudate nucleus 27±6 55±14 1.8±0.4 No
Putamen 34±7 55±12 2.1±0.5 No
Globus pallidus 32±8 58±12 2.2±0.6 No
Occipital cortex 22±6 55±23 0.8±0.1 +
Pons 12±6 46±7 0.9±0.2 No
Tohno et al. [39] n=45 83±8 (70–101) Caudate nucleus 112±69 NoPutamen 108±113 No
Globus pallidus 91±38 No
Andrási et al. [31] n=5 58 (51–73) Hippocampus 63.0±18.7 Not evaluatedOccipital area 52.2±5.7
Parietal lobe 40.9±24.5
Caudate nucleus 44.4±9.7
Putamen 50.7±8.5
Globus pallidus 34.2±6.4
Hebbrecht et al. [21] n=18 7–79 Basal ganglia No + +
Cerebral cortex No + +
Cerebellar cortex No No + (ns)
Andrási et al. [33] n=20 70 Occipital area 28±8 75±13 2.0±0.5 Not eval.Caudate nucleus 37±7 80±7 3.8±1.7
Putamen 42±7 91±20 4.0±1.7
Globus pallidus 40±10 68±5 4.4±0.8
Hippocampus 19±7 86±11 1.8±0.8
Kornhuber et al. [32] n=12 75±7 (41–91) Caudate nucleus 26.0±6.6 67.2±17.5 Not eval.Hippocampus 18.0±3.4 86.3±13.0
Cingulated gyrus 20.6±2.2 58.9±22.0
Rajan et al. [22] (*) n=8 50–60 Frontal cortex 19±8 36±2 Not eval.Temporal cortex 20±8 43±9
Parietal cortex 27±13 114±33
Occipital cortex 21±13 66±9
Cerebellum 35±12 38±5
Midbrain 28±6 38±5
Pons 18±8 33±5
Hippocampus 19±5 31±2
Medulla 21±10 95±38
Deibel et al. [20] n=11 82±2 Hippocampus 16.8±0.9 72.0±4.8 Not eval.Sup. and middle temporal 21.6±1.2 61.5±1.6
Inferior parietal 21.6±1.1 56.7±1.2
Cerebellum 30.7±1.7 67.7±2.1
Duflou et al. [29] n=12 36±20 (7–69) Cingulated gyrus 24.9±5.9 74.3±7.9 1.30±0.12 NoCaudate nucleus 31.3±3.8 73.3±4.0 2.48±0.26
Putamen 33.9±5.2 67.9±7.5 2.67±0.33
Globus pallidus 30.6±5.4 53±11 2.18±0.55
Cerebellum 36.6±8.2 42.2±7.6 1.02±0.24
Hippocampus 23.1±5.4 79.2±8.4 1.22±0.14
Bonilla et al. [34] n=7 44±27 (11–75) Frontal lobe (white matter) 5.43±0.71 –Caudate nucleus (head) 13.49±4.68
Caudate nucleus (body) 18.46±3.42
Caudate nucleus (tail) 23.12±3.58
Distribution of Copper, Zinc, and Manganese in the Human Brain
of AD patients. It has been proposed that the sequestration ofzinc by Aβ-plaques not only drives Aβ aggregation, but alsodisrupts zinc homeostasis [44].
Taken together, the best evidence suggests that althoughaging is typically associated with signs of Zn deficiency(namely, cognitive impairment), the total Zn content in thebrain tissue can be increased, the “deficit” being attributable toan increased sequestration that makes Zn less available forphysiological processes. In case of a disturbance of this “pool”of sequestered Zn (or in the sequestration mechanism), largeamounts of Zn can be released into the cell cytoplasm, causingimportant damage, which seems to be the basis for the role ofZn in the pathophysiology of AD.
Despite its importance for proper metabolic function, Mnmay lead to the production of reactive oxygen species andtoxic catecholamines, and induces a decrease in antioxidantenzymes activity. Manganese also induces the auto-oxidationof dopamine, followed by the formation of toxic (semi) qui-nones and dopamine depletion [9]. Some studies have shownthat Mn accumulation in brain produces a type of neuropa-thology consistent with an excitotoxic mechanism, suggestingthat glutamatergic transmission may be involved [45]. Sucheffects can lead to compromised energy metabolism, resultingin altered cellular morphology, production of reactiveoxygen species, and increased extracellular glutamateconcentration [46].
Imbalances in Cu homeostasis, either due to deficit, excess,or aberrant coordination, may be responsible for the increasedoxidative damage involved in aging and neurodegenerativeprocesses [47]. Although a global increase in Cu brain contenthave been reported in aged mice, decreased Cu uptake, Cucontent, and SOD activity were found in the striatum (puta-men and globus pallidus) and ventral cortex, contributing to
oxidative vulnerability of the aging brain [48]. Decreasedcopper levels may be explained by low Cu dietary intakeand gradual weight loss, both often observed in the elderly[49]. Copper depletion in the brain (and probably in otherorgans) induces inflammation plus energy deficiency andoxidative stress through disruption of the electron transportchain and decreased SOD activity [49].
The Cu/Zn ratio has been considered as a sensitive bio-marker of harmful inflammatory in the elderly, and its increasein plasma with advancing age is documented [50]. However,mainly due to the tendency for Zn brain levels to increase, theCu/Zn ratio in brain tissue was found to decrease with ad-vancing age in our work.
Some studies exist on the gender-related differencesof some trace element levels, namely Fe, in humanbrain [51, 52, 24, 53], but studies regarding Cu, Zn,and Mn are rather scarce. We found no significantdifferences between male and females subjects for boththe global levels and the levels at each individual brainregion studied. In a recent study, Tohno et al. [40] alsofound no significant gender-related differences in Zncontent in the basal ganglia. Smoking habits showedno significant effect on Zn, Mn, and Cu levels in thebrain tissue. No published data is available regardingthis topic.
Previously published studies have already reportedspecific anatomical region changes on trace elementslevels in the brain of PD and AD patients, but resultsare inconsistent [32, 34, 20, 54]. Due to a limitednumber of ND patients studied in this work, no definiteconclusions can be drawn; more samples from NDpatients must be analyzed in order to evaluate the Zn,Cu, and Mn changes in human brain related to ND.
Table 5 (continued)
Authors Subjects Age (years) Brain regions Element (μg/g dry tissue) Correlation with age
Cu Zn Mn Cu Zn Mn
Parietal lobe (white matter) 7.27±1.33
Occipital lobe (white matter) 8.88±1.34
Bonilla et al. [35] n=8 42±26 (11–75) Frontal lobe (white matter) 0.72±0.09 NoCaudate nucleus (head) 1.29±0.12
Caudate nucleus (body) 1.41±0.14
Caudate nucleus (tail) 1.89±0.14
Parietal lobe (white matter) 0.81±0.13
Occipital lobe (white matter) 0.74±0.07
Harrison et al. [36] Hippocampus (n=35) 29±11.2 95±37.7 Not eval.Caudate nucleus (n=28) 42±15.9 81±20.8
Putamen (n=36) 44±8.6 75±12.9
Globus pallidus (n=34) 35±10.5 69±15.7
Results originally reported as per wet weight basis. Converted into a dry weight basis by using a dry/wet mass ratio of 0.211, as suggested by Ehmannand Markesbery, cited by Rajan et al. [22]. (+) positive correlation; (−) negative correlation; (ns) nonsignificant; “Not eval.” = not evaluated
Ramos et al.
Conclusions
In this study, the direct determination of Cu, Zn, andMn in samples from 14 different brain regions of 42nondiseased individuals (70.5±12.2 years old) was per-formed. It provides updated data on the actual levels,regional distribution, and age-related changes of thesethree important trace elements in the human brain, con-tributing for defining the “normal” levels, a fundamentalstep in order to allow future comparisons with dataobtained from individuals affected by ND.
Globally (i.e., considering the mean value for the 14 re-gions of the 42 individuals), Zn levels were found ca. 2.5-foldhigher than Cu, 53±5 μg/g (43–61 μg/g) vs. 22±5 μg/g (10–37 μg/g). Manganese was found at significantly lower levels,1.3±0.3 μg/g (0.5–2.7 μg/g).
Trace element distribution within the brain showed to bequite heterogeneous: the highest levels of Zn were found inmemory-related regions, the hippocampus (70±10; 49–95μg/g) and superior temporal gyrus (68±10; 44–88 μg/g), and thehighest levels of Cu and Mn were found in the putamen (Cu,36±13; 21–76 μg/g; Mn, 2.5±0.8; 0.7–4.5 μg/g), a structurerelated to motor control. The lowest levels were found in thepons (Zn, 33±8; 19–51 μg/g) and medulla (Cu, 11±6; 2–30 μg/g; Mn, 0.8±0.3; 0.2–1.8 μg/g). A tendency for an age-related increase in Zn and Mn levels was found, namely in theputamen, globus pallidus, and middle temporal gyrus. On thecontrary, Cu showed to be negatively correlated with age. Nogender- or smoking-related differences were found for anyelement studied.
Imbalances in Cu, Zn, and Mn levels in some brain regionsof one PD and two AD patients were found, suggesting thatdyshomeostasis of these metals may play a role in ND, butfurther investigation is necessary.
Acknowledgments The authors thank the Universidade do Porto andSantander Totta for financial support through the project “TRAIN: Traceelements in human brain: age-related changes and anatomic region spe-cific differences” (PP_IJUP 2011 342).
References
1. National Institute on Aging/US National Institutes of Health andWHO (2011) Global health and aging report. NIH Publication no11–7737
2. Castellani RJ, Rolston RK, SmithMA (2010) Alzheimer disease. DisMon 56(9):484–546
3. Jomova K, Vondrakova D, Lawson M, Valko M (2010) Metals,oxidative stress and neurodegenerative disorders. Mol CellBiochem 345(1–2):91–104
4. Rivera-Mancia S, Perez-Neri I, Rios C, Tristan-Lopez L,Rivera-Espinosa L, Montes S (2010) The transition metalscopper and iron in neurodegenerative diseases. Chem BiolInteract 186(2):184–199
5. SchragM,Mueller C, Oyoyo U, SmithMA, KirschWM (2011) Iron,zinc and copper in the Alzheimer’s disease brain: a quantitative meta-analysis. Some insight on the influence of citation bias on scientificopinion. Prog Neurobiol 94(3):296–306
6. Mocchegiani E, Bertoni-Freddari C, Marcellini F, Malavolta M(2005) Brain, aging and neurodegeneration: role of zinc ion avail-ability. Prog Neurobiol 75(6):367–390
7. Frederickson CJ, Suh SW, Silva D, Frederickson CJ, Thompson RB(2000) Importance of zinc in the central nervous system: the zinc-containing neuron. J Nutr 130(5S Suppl):1471s–1483s
8. Scheiber IF, Mercer JF, Dringen R (2014) Metabolism and functionsof copper in brain. Prog Neurobiol 116:33–57
9. Takeda A (2003) Manganese action in brain function. Brain ResBrain Res Rev 41(1):79–87
10. Barnham KJ, Bush AI (2008) Metals in Alzheimer’s and Parkinson’sdiseases. Curr Opin Chem Biol 12(2):222–228
11. Castellani RJ, Honda K, Zhu X, Cash AD, Nunomura A, Perry G,Smith MA (2004) Contribution of redox-active iron and copper tooxidative damage in Alzheimer disease. Ageing Res Rev 3(3):319–326
12. Bowman AB, Kwakye GF, Herrero Hernández E, Aschner M (2011)Role of manganese in neurodegenerative diseases. J Trace ElemMedBiol 25(4):191–203
13. Paul MC, Parsons CH, Calford MB, von Nagy-Felsobuki EI (2004)Multi-elemental analysis of brain tissue from healthy Wistar ratsusing sector field inductively coupled plasma mass spectrometry.Spectrochim Acta B 59(9):1485–1490
14. Saito T, Itoh T, Fujimura M, Saito K (1995) Age-dependent andregion-specific differences in the distribution of trace elements in 7brain regions of Long-Evans Cinnamon (LEC) rats with hereditaryabnormal copper metabolism. Brain Res 695(2):240–244
15. Hozumi I, Hasegawa T, Honda A, Ozawa K, Hayashi Y, HashimotoK, Yamada M, Koumura A, Sakurai T, Kimura A, Tanaka Y, SatohM, Inuzuka T (2011) Patterns of levels of biological metals in CSFdiffer among neurodegenerative diseases. J Neurol Sci 303(1–2):95–99
16. Alimonti A, Bocca B, Pino A, Ruggieri F, Forte G, Sancesario G(2007) Elemental profile of cerebrospinal fluid in patients withParkinson’s disease. J Trace Elem Med Biol 21(4):234–241
17. Forte G, Bocca B, Senofonte O, Petrucci F, Brusa L, Stanzione P,Zannino S, Violante N, Alimonti A, Sancesario G (2004) Trace andmajor elements in whole blood, serum, cerebrospinal fluid and urineof patients with Parkinson’s disease. J Neural Transm 111(8):1031–1040
18. Michalke B, Nischwitz V (2010) Review onmetal speciation analysisin cerebrospinal fluid-current methods and results: a review. AnalChim Acta 682(1–2):23–36
19. Gellein K, Skogholt JH, Aaseth J, Thoresen GB, Lierhagen S,Steinnes E, Syversen T, Flaten TP (2008) Trace elements incerebrospinal fluid and blood from patients with a rare pro-gressive central and peripheral demyelinating disease. J NeurolSci 266(1–2):70–78
20. Deibel MA, EhmannWD,Markesbery WR (1996) Copper, iron, andzinc imbalances in severely degenerated brain regions in Alzheimer’sdisease: possible relation to oxidative stress. J Neurol Sci 143(1–2):137–142
21. Hebbrecht G, Maenhaut W, Reuck JD (1999) Brain trace elementsand aging. Nucl Instrum Meth B 150(1–4):208–213
22. Rajan MT, Jagannatha Rao KS, Mamatha BM, Rao RV,Shanmugavelu P, Menon RB, Pavithran MV (1997)Quantification of trace elements in normal human brain byinductively coupled plasma atomic emission spectrometry. JNeurol Sci 146(2):153–166
23. Andrási E, Igaz S, Szoboszlai N, Farkas É, Ajtony Z (1999) Severalmethods to determine heavy metals in the human brain. SpectrochimActa B 54(5):819–825
Distribution of Copper, Zinc, and Manganese in the Human Brain
24. Ramos P, Santos A, Pinto NR, Mendes R, Magalhães T, Almeida A(2014) Iron levels in the human brain: a post-mortem study ofanatomical region differences and age-related changes. J TraceElem Med Biol 28(1):13–17
25. Bilgic B, Pfefferbaum A, Rohlfing T, Sullivan EV, Adalsteinsson E(2012) MRI estimates of brain iron concentration in normal agingusing quantitative susceptibility mapping. Neuroimage 59(3):2625–2635
26. Gorell JM, Ordidge RJ, Brown GG, Deniau JC, Buderer NM,Helpern JA (1995) Increased iron-related MRI contrast in thesubstantia nigra in Parkinson’s disease. Neurology 45(6):1138–1143
27. Segovia G, Porras A, Del Arco A, Mora F (2001) Glutamatergicneurotransmission in aging: a critical perspective. Mech Ageing Dev122(1):1–29
28. Paine SML, Lowe JS (2011) Approach to the post-mortem investi-gation of neurodegenerative diseases: from diagnosis to research.Diagn Histopathol 17(5):211–216
29. Broadbent NJ, Squire LR, Clark RE (2004) Spatial memory, recog-nition memory, and the hippocampus. Proc Natl Acad Sci U S A101(40):14515–14520
30. Duflou H, Maenhaut W, De Reuck J (1989) Regional distribution ofpotassium, calcium, and six trace elements in normal human brain.Neurochem Res 14(11):1099–1112
31. Lanciego JL, Luquin N, Obeso JA (2012) Functional neuroanatomyof the Basal Ganglia. Cold Spring Harb Perspect Med 2(12)
32. Andrási E, Farkas E, Gawlik D, RosickU, Bratter P (2000) Brain ironand zinc contents of German patients with Alzheimer disease. JAlzheimers Dis 2(1):17–26
33. Kornhuber J, Lange KW, Kruzik P, Rausch WD, Gabriel E, JellingerK, Riederer P (1994) Iron, copper, zinc, magnesium, and calcium inpostmortem brain tissue from schizophrenic patients. Biol Psychiatry36(1):31–34
34. Andrási E, Farkas E, Scheibler H, Reffy A, Bezur L (1995) Al, Zn,Cu, Mn and Fe levels in brain in Alzheimer’s disease. Arch GerontolGeriatr 21(1):89–97
35. Bonilla E, Salazar E, Villasmil JJ, Villalobos R, Gonzalez M, DavilaJO (1984) Copper distribution in the normal human brain.Neurochem Res 9(11):1543–1548
36. Bonilla E, Salazar E, Villasmil JJ, Villalobos R (1982) The regionaldistribution of manganese in the normal human brain. NeurochemRes 7(2):221–227
37. Harrison WW, Netsky MG, Brown MD (1968) Trace elements inhuman brain: copper, zinc, iron, and magnesium. Clin Chim Acta21(1):55–60
38. Krebs N, Langkammer C, Goessler W, Ropele S, Fazekas F, Yen K,Scheurer E (2014) Assessment of trace elements in human brainusing inductively coupled plasma mass spectrometry. J Trace ElemMed Biol 28(1):1–7
39. Hock A, Demmel U, Schicha H, Kasperek K, Feinendegen LE(1975) Trace element concentration in human brain. Activation anal-ysis of cobalt, iron, rubidium, selenium, zinc, chromium, silver,cesium, antimony and scandium. Brain J Neurol 98(1):49–64
40. Tohno Y, Tohno S, Azuma C, Minami T, Ke L, Ongkana N,Sinthubua A, Mahakkanukrauh P (2013) Mineral composition ofand the relationships between them of human basal ganglia in veryold age. Biol Trace Elem Res 151(1):18–29
41. Smart TG, Hosie AM, Miller PS (2004) Zn2+ ions: modulators ofexcitatory and inhibitory synaptic activity. Neurosci Rev J BringNeurobiol, Neurol Psychiatr 10(5):432–442
42. Watt NT, Griffiths HH, Hooper NM (2013) Neuronal zinc regulationand the prion protein. Prion 7(3):203–208
43. Mocchegiani E, Malavolta M (2007) Zinc dyshomeostasis,ageing and neurodegeneration: implications of A2M and in-flammatory gene polymorphisms. J Alzheimers Dis 12(1):101–109
44. Craddock TJ, Tuszynski JA, Chopra D, Casey N, Goldstein LE,Hameroff SR, Tanzi RE (2012) The zinc dyshomeostasis hypothesisof Alzheimer’s disease. PLoS One 7(3):e33552
45. Brouillet EP, Shinobu L, McGarvey U, Hochberg F, Beal MF(1993) Manganese injection into the rat striatum producesexcitotoxic lesions by impairing energy metabolism. Exp Neurol120(1):89–94
46. Normandin L, Hazell AS (2002)Manganese neurotoxicity: an updateof pathophysiologic mechanisms. Metab Brain Dis 17(4):375–387
47. Rossi L, ArcielloM, CapoC, Rotilio G (2006) Copper imbalance andoxidative stress in neurodegeneration. Ital J Biochem 55(3–4):212–221
48. Wang LM, Becker JS, Wu Q, Oliveira MF, Bozza FA, Schwager AL,Hoffman JM, Morton KA (2010) Bioimaging of copper alterations inthe aging mouse brain by autoradiography, laser ablation inductivelycoupled plasma mass spectrometry and immunohistochemistry.Metall Integrat Biometal sci 2(5):348–353
49. Klevay LM (2008) Alzheimer’s disease as copper deficiency. MedHypotheses 70(4):802–807
50. Malavolta M, Giacconi R, Piacenza F, Santarelli L, Cipriano C,Costarelli L, Tesei S, Pierpaoli S, Basso A, Galeazzi R, Lattanzio F,Mocchegiani E (2010) Plasma copper/zinc ratio: an inflammatory/nutritional biomarker as predictor of all-cause mortality in elderlypopulation. Biogerontology 11(3):309–319
51. Bartzokis G, Tishler TA, Lu PH, Villablanca P, Altshuler LL, CarterM, Huang D, Edwards N, Mintz J (2007) Brain ferritin iron mayinfluence age- and gender-related risks of neurodegeneration.Neurobiol Aging 28(3):414–423
52. Xu X, Wang Q, Zhang M (2008) Age, gender, and hemisphericdifferences in iron deposition in the human brain: an in vivo MRIstudy. Neuroimage 40(1):35–42
53. Correia H, Ramos P, Santos A, Pinto NR, Mendes R, Magalhães T,Almeida A (2014) A post-mortem study of the anatomical regiondifferences and age-related changes on Ca and Mg levels in thehuman brain. Microchem J 113:69–76
54. Dexter DT, Wells FR, Lees AJ, Agid F, Agid Y, Jenner P, MarsdenCD (1989) Increased nigral iron content and alterations in other metalions occurring in brain in Parkinson’s disease. J Neurochem 52(6):1830–1836
Ramos et al.


![BONE SUPPORT FORMULATM - Anabolic Labs aspartate, magnesium gluconate) 300 mg 75% Zinc (from zinc monomethionine [L-OptiZinc®] 6 mg 40% Copper (from copper gluconate) 0.5 mg 25% Manganese](https://static.fdocuments.us/doc/165x107/5b21db477f8b9a114a8b4862/bone-support-formulatm-anabolic-labs-aspartate-magnesium-gluconate-300-mg-75.jpg)