Analyzing occupational licensing among the states · Analyzing occupational licensing among the...
27
J Regul Econ DOI 10.1007/s11149-017-9333-y ORIGINAL ARTICLE Analyzing occupational licensing among the states Morris M. Kleiner 1,2 · Evgeny Vorotnikov 3 © Springer Science+Business Media New York 2017 Abstract The study provides new evidence of the influence of occupational regula- tions on the U.S. economy. Our analysis, unlike previous studies, was able to obtain a representative sample of the population at the state level, which allowed us to estimate the cross-sectional effects of occupational licensing for each state. The state-level analysis demonstrates considerable variation in percentage of the workforce that has attained a license, and unlike minimum wages or unionization, licensing shows no regional patterns in the distribution of occupational licensing. The analysis also shows considerable variation in the influence of licensing on earnings across the states. The national estimates suggest that occupational licensing raises wages by about 11% after controlling for human capital and other observable characteristics. Finally, our analysis shows the influence of occupational regulation on wage inequality across the income distribution. Keywords Occupational licensing · Wage determination with occupational licensing · Income inequality with occupational licensing We especially thank Dick M. Carpenter for the development of the data used in this study, and the editor and reviewer for their comments on earlier versions of the paper. We also thank discussants at the Southern Economic Association and the American Economic Association annual meetings for their comments and suggestions. B Morris M. Kleiner [email protected] 1 University of Minnesota, NBER, Minneapolis, MN, USA 2 Federal Reserve Bank of Minneapolis, Minneapolis, MN, USA 3 Fannie Mae, Washington, DC, USA 123
Transcript of Analyzing occupational licensing among the states · Analyzing occupational licensing among the...

J Regul EconDOI 10.1007/s11149-017-9333-y
ORIGINAL ARTICLE
Analyzing occupational licensing among the states
Morris M. Kleiner1,2 · Evgeny Vorotnikov3
© Springer Science+Business Media New York 2017
Abstract The study provides new evidence of the influence of occupational regula-tions on the U.S. economy. Our analysis, unlike previous studies, was able to obtain arepresentative sample of the population at the state level, which allowed us to estimatethe cross-sectional effects of occupational licensing for each state. The state-levelanalysis demonstrates considerable variation in percentage of the workforce that hasattained a license, and unlike minimum wages or unionization, licensing shows noregional patterns in the distribution of occupational licensing. The analysis also showsconsiderable variation in the influence of licensing on earnings across the states. Thenational estimates suggest that occupational licensing raises wages by about 11%after controlling for human capital and other observable characteristics. Finally, ouranalysis shows the influence of occupational regulation on wage inequality across theincome distribution.
Keywords Occupational licensing ·Wage determinationwith occupational licensing ·Income inequality with occupational licensing
We especially thank Dick M. Carpenter for the development of the data used in this study, and the editorand reviewer for their comments on earlier versions of the paper. We also thank discussants at theSouthern Economic Association and the American Economic Association annual meetings for theircomments and suggestions.
B Morris M. [email protected]
1 University of Minnesota, NBER, Minneapolis, MN, USA
2 Federal Reserve Bank of Minneapolis, Minneapolis, MN, USA
3 Fannie Mae, Washington, DC, USA
123

E. Vorotnikov, M. M. Kleiner
1 Introduction
The study of occupational regulations has a long and distinguished tradition in eco-nomics (Smith 1937). Some economists have viewed such regulations as rent-seekingbehavior and have empirically examined the economic effect of occupational licens-ing within that framework (Friedman and Kuznets 1945; Friedman 1962). In contrast,others have suggested that regulations provide incentives for workers to enhance theirhuman capital through greater investments in their work life by limiting low skilledsubstitutes (Shapiro 1986).
Occupational licensing has become an increasingly important factor in the regula-tion of services in the United States. The number of occupations that require licensesfrom government in order to work has grown since the 1970s, and the percentagelicensed has been increasing as well (Greene 1969; Kleiner 2006). The number ofstudies analyzing the labor market institution of occupational regulation, however,has not been growing proportionately.
One of the largest barriers standing in the way of analyzing occupational regulationhas been the absence of well-organized national data available for the examinationof the influence of attaining an occupational license on wages. Since governmentaloccupational regulations are largely at the state level and vary greatly, the purpose ofthis study is to examine the level and the influence of occupational regulations acrossstates using a representative sample of occupational licensing attainment of the U.S.population specifically collected for this study. Unlike previous surveys, we were ableto obtain a representative sample of the population at the state level which allowed usto estimate the cross-sectional effects of occupational licensing onwage determinationfor each state for the first time.
Initially, we show estimates of licensing attainment on a state by state basis and findthat there is considerable variation. Also, we find that licensing raised the earnings ofregulated workers in 16 states. Second, the estimates show that the average increasein earnings due to licensing was approximately 11% nationally in 2013. Finally, weshow that occupational licensing exacerbates relative income inequality across thewage distribution.
2 Background on occupational licensing
Occupational regulation in the United States generally takes three forms. The leastrestrictive form is registration, in which individuals file their names, addresses, andqualifications with a government agency before practicing their occupations. The reg-istration process may include posting a bond or filing a fee. In contrast, certificationpermits any person to perform the relevant tasks, but the government—or sometimesa private nonprofit agency—administers an examination and certifies those who haveachieved the level of skill and knowledge for certification. For example, travel agentsand car mechanics are generally certified but not licensed. The toughest form of regu-lation is licensure; this form of regulation is often referred to as “the right to practice.”
Occupational licensure is the legal process bywhichgovernments (mostlyU.S statesbut also local governments and the federal government) identify the legal qualifications
123

Analyzing occupational licensing among the states
required to work in a trade or profession, after which only regulated practitioners areallowed by law to receive pay for doing tasks in the occupation. This form of labormarket regulation has rapidly becomeone of themost significant factors affecting labormarkets in the United States (Kleiner and Krueger 2010, 2013). Over the past severaldecades, the share of U.S. workers holding an occupational license has grown sharply.Estimates from a recent White House report suggest that over 1100 occupations areregulated in at least one state, but fewer than 60 are regulated in all 50 states, showingsubstantial differences in which states chose to regulate occuptions (U.S. ExecutiveOffice of the President 2015). As of 2015, about 25% of the U.S. workforce hadattained an occupational license, with the vast majority doing so at the state level(U.S. Bureau of Labor Statistics 2016). In contrast, in 1950 only 5 percent of U.S.workers were licensed at the state level (Kleiner and Krueger 2013).
Occupational licensing is usually designed to function as a form of consumer pro-tection, ensuring high quality of service and protecting buyers from adverse health andsafety outcomes by regulating out incompetents through limiting providers to thosewho have attained licensure. However, by establishing minimum qualifications andnorms to practice a trade or profession, occupational licensing also may create entryrestrictions into these occupations and potential barriers to enter the occupation fromother political jurisdictions, thereby reducing the supply of regulated services. Thereduction in the supply of labor created by occupational licensing has been shown toincrease the price of these services and to generate possible monopoly rents for thosein the licensed occupation (Kleiner et al. 2016).1
3 Data
One of themajor issues facing researchers analyzing the labor market effects of licens-ing and certification at the state level has been the lack of data on wages and the labormarket characteristics of regulated workers. Although occupational associations, suchas the American Bar Association and the American Dental Association have startedcollecting wage and salary data as well as the number of new entrants and pass rates bystate as early as in 1980s, such information is no longer generally released to the publicor researchers. Moreover, state licensing boards either do not have data on regulation,or if they do, they cannot link it to information on wage or other characteristics ofthe workers. Consequently, economists or other social scientists interested in studyingoccupational licensing have to generate their own survey data. For example, KleinerandKrueger employedGallup andWestat to conduct smaller surveys to collect data thatwould allow them to estimate the effects of occupational licensing on wage determina-tion (Kleiner and Krueger 2010, 2013). Although these data sets were representativeat the national level, they were too small to be representative at the state level.
1 The potential rents generated by restricted entry into an occupation have long been recognized byeconomists. Adam Smith, in his 1776 work The Wealth of Nations (Smith 1776), notes that trades con-spired to reduce the availability of “skilled craftsmen” in order to raise wages. Friedman and Kuznets andFriedman recognized that members of an occupation worked in their own self-interest to restrict supply,increase demand, and maximize “profits” for members of their occupation (Friedman and Kuznets 1945;Friedman 1962). Empirical estimates for the price effects are summarized in Kleiner (2006, pp. 60–61).
123

E. Vorotnikov, M. M. Kleiner
Our analysis was able to obtain a representative sample of the population at the statelevel. Consequently, we provide an analysis of occupational licensing and certificationat the state level for the first time. In order to estimate the influence of occupationalregulation on wage determination, we use the results of a workforce survey conductedby Harris Poll Interactive, a subsidiary of the Nielsen Company. The survey askeddetailed questions on occupational regulations as well as questions on the labor marketstatus of individuals. The survey questions on occupational licensing were initiallydeveloped as part of the Princeton Data Improvement Initiative (PDII) conducted byWestat (see Kleiner and Krueger 2013). These questions probe the kind of governmentregulations required to perform a job, the process of becoming licensed, and the levelof education and tests necessary to become licensed. Results of the Harris Survey, aswell as separate validation results from related Westat and Gallup surveys, indicatethat occupational licensing can be reasonably well measured by labor force surveys.2
4 The survey instrument and design
In 2013, theHarris polling organization conducted an interactive state survey on behalfof the Institute for Justice (IJ) funded by the Templeton Foundation. The IJ providedHarris with a draft of a questionnaire that was patterned after the PDII. The IJ andHarris collaborated in finalizing the questions’ order and wording. Several questionsregarding the respondents’ employers, job activities, and demographics were takenfrom the CPS. Harris staff pretested the survey with dozens of volunteer respondentsfrom their regular representative sample of the U.S.
Harris conducted the survey in early andmid-2013. Individuals age 18 or older whowere in the labor force were eligible for the survey. A total of 9850 individuals wereinterviewed.We limit our analysis to thosewhowere employed at the time of the surveyor had a job during the previous 12months. The Harris Survey was able to collect arepresentative sample of the population for each state, and the sample was four timeslarger than the samples used by Kleiner and Krueger (2010, 2013) in their studies.
Harris developed survey weights to compensate for variation in selection probabil-ities, differential response rates, and possible under coverage of the sampling frame.The derivation of the sample weights focused primarily on matching the marginaldistributions of the CPS by sex, age, educational attainment, census region, urban-ization, race, Hispanic ethnicity, employment status, and class of employer (private,government, and so on).
We used a module to assess the accuracy of self-reported occupational licensingand certification. The key questions were as follows:
Question 11. Do you have a license or certification that is required by a federal,state or local government agency to do your job?
YES ...................................................................... 1NO ........................................................................ 2IN PROCESS/WORKING ON IT......................... 3
2 In the Table 11 of “Appendix 1”, we show the occupational distribution of individuals in the sample, andit is largely similar to other national surveys such as the American Community Survey.
123

Analyzing occupational licensing among the states
Question 11a.Would someone who does not have a license or certificate be legallyallowed to do your job?
YES ...................................................................... 1NO ........................................................................ 2
Question 12. Is everyone who does your job eventually required to have a licenseor certification by a federal, state or local government agency?
YES ...................................................................... 1NO ........................................................................ 2
Those who answered affirmatively to question 11 were asked additional questionsabout the requirements they needed to satisfy, such as achieving a high school orcollege degree, passing a test, demonstrating certain skills, or completing an internshipor apprenticeship. The objective was to obtain measures of licensing attainment ratherthan measures for individuals who may be covered by licensing laws, but are notlicensed (Gittleman and Kleiner 2016).
The Current Population Survey (CPS) started collecting information on occupa-tional licensing in 2015 (U.S. Bureau of Labor Statistics 2016). Unfortunately thereare some potential issues with accuracy of collected data due to the way the questionswere asked.
For example, theCPSdata does not allow researchers to distinguish between respon-dents who have earned licenses and respondents who have earned certifications. Bothcredentials signal a worker’s quality to potential employers in markets characterizedby asymmetric information. However, as mentioned earlier there is a fundamental dif-ference between these two credentials. By law, only licensed practitioners are allowedto provide licensed services for pay, while certified services could be provided by bothcertified and uncertified practitioners.
The definition used by the CPS assumes that licensing regulations may requirepractitioners to obtain only government-issued credentials, and that privately issuedcredentials may not serve as a legal basis for restricting the right to practice. Theassumption is likely invalid for many occupations. One additional disadvantage ofthis criterion is that the questions only asked respondents about the characteristics oftheir newest credential. Therefore, theCPS classificationwill suffer frommeasurementerror because some workers may have obtained both a license and a certification. Inaddition, some respondents may incorrectly answer that a private entity issued theircredentials when in fact it was a government agency, or vice versa. For all these reasonsthe use of either the Westat Survey or the Harris Survey should provide more preciseestimates of licensing attainment. We restrict the sample to respondents who providedvalid data on their occupational affiliation.
The results of the analysis are shown in Table 1 and Figs. 1 and 2. We find that28.43%of the respondents answered that theywere either licensedor certified.Approx-imately 6.75% were individuals who did not have a license, but could do the work,which is the definition of government certification. Another 1.79% stated that all whoworked would eventually be required to be certified or licensed, bringing the total thatare or eventually must be licensed or certified by government to 30.22%. This valueis lower than the 38% found by Kleiner and Krueger (2013) in the survey conductedby Westat in 2008 for workers who are (or eventually must be) licensed or certified.
123

E. Vorotnikov, M. M. Kleiner
Table 1 Regulated versus Non-regulated workers
Variable % SD(%)
Licensed Workers 21.68 41.21
Certified Workers 6.75 25.08
In Process of Obtaining License 0.39 6.26
In Process of Obtaining Certificate 1.40 11.77
Non-regulated Workers Who do not Plan to Become Regulated 69.78 45.93
Total 100.00
21.7%
6.8%
71.6%
Licensed WorkersCer�fied WorkersNon-regulated Workers
Fig. 1 Licensed, certified, and non-regulated workers
21.7%
6.8%
0.4%
1.4%69.9%
Licensed Workers
Cer�fied Workers
In Process of Obtaining License
In Process of Obtaining Cer�ficate
Non-regulated Workers Who donot Plan to Become Regulated
Fig. 2 Licensed, certified, in process of obtaining license, in process of obtaining certificate, and non-regulated workers who do not plan to become regulated
This difference may reflect the larger sample size of the Harris data, which has 9850relative to the 2449 observations in the Westat or 2037 observations in the Gallupsamples that were examined by Kleiner and Krueger (2010, 2013). Or it may reflectthe sample selection criteria or the method of data collection (phone survey versus anonline survey).
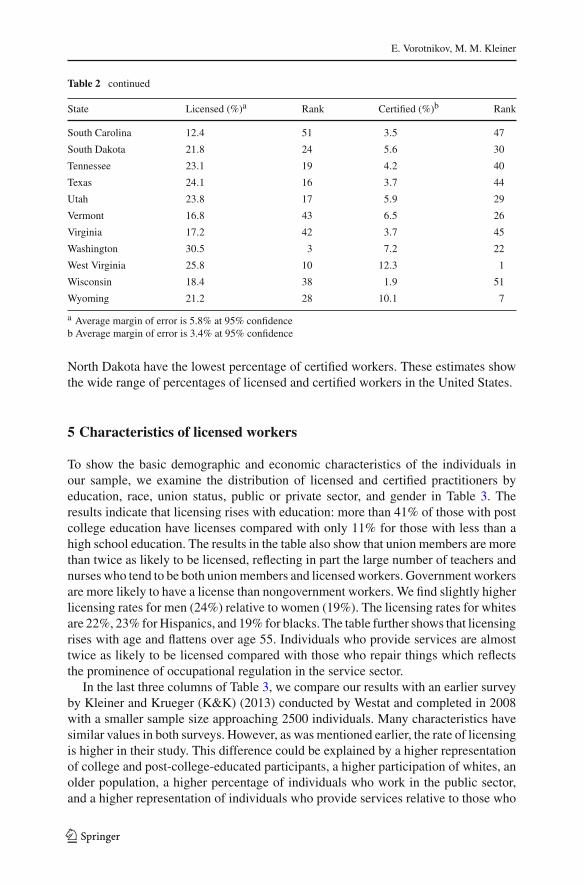
In Table 2 we show the percentage of the workforce that has attained a license orcertification and the rank order of the state relative to other states by the percentage thathas an occupational license. Iowa has the highest percentage of licensedworkers; morethan one-third of the workforce has obtained a license from some level of government.Conversely, South Carolina, Rhode Island, NewHampshire, Indiana, and Kansas havethe smallest percentage of licensed workers—about 14% in each case. West Virginiaand Rhode Island have the highest percentage of certified workers; about 12% of theworkforce has this lower level of governmental oversight. In contrast, Wisconsin and
123

Analyzing occupational licensing among the states
Table 2 State values of percentage licensed, percentage certified, and rank
State Licensed (%)a Rank Certified (%)b Rank
Alabama 20.9 29 6.9 24
Alaska 25.5 11 7.3 20
Arizona 22.2 22 8.7 10
Arkansas 20.2 36 5.3 35
California 20.7 30 6.1 27
Colorado 17.2 41 7.4 18
Connecticut 24.6 14 8.8 9
Delaware 15.3 45 3.5 46
District of Columbia 19.7 37 6.9 25
Florida 28.7 4 4.2 39
Georgia 15.7 44 5.9 28
Hawaii 26.6 6 11.3 4
Idaho 22.8 20 8.4 12
Illinois 24.7 13 5.0 37
Indiana 14.9 48 10.8 5
Iowa 33.2 1 5.1 36
Kansas 14.9 47 5.6 31
Kentucky 27.8 5 10.7 6
Louisiana 22.3 21 9.9 8
Maine 20.7 32 7.8 15
Maryland 17.2 40 4.8 38
Massachusetts 21.3 25 3.9 42
Michigan 20.6 34 3.3 49
Minnesota 15.0 46 3.4 48
Mississippi 23.1 18 7.2 21
Missouri 21.3 26 5.4 33
Montana 21.3 27 8.3 14
Nebraska 24.6 15 8.3 13
Nevada 30.7 2 5.4 34
New Hampshire 14.7 49 4.1 41
New Jersey 20.7 31 11.3 3
New Mexico 25.9 9 7.3 19
New York 20.7 33 5.5 32
North Carolina 22.0 23 8.4 11
North Dakota 26.6 7 2.6 50
Ohio 18.1 39 7.5 17
Oklahoma 25.0 12 7.2 23
Oregon 26.1 8 3.8 43
Pennsylvania 20.2 35 7.6 16
Rhode Island 14.5 50 11.8 2
123
E. Vorotnikov, M. M. Kleiner
Table 2 continued
State Licensed (%)a Rank Certified (%)b Rank
South Carolina 12.4 51 3.5 47
South Dakota 21.8 24 5.6 30
Tennessee 23.1 19 4.2 40
Texas 24.1 16 3.7 44
Utah 23.8 17 5.9 29
Vermont 16.8 43 6.5 26
Virginia 17.2 42 3.7 45
Washington 30.5 3 7.2 22
West Virginia 25.8 10 12.3 1
Wisconsin 18.4 38 1.9 51
Wyoming 21.2 28 10.1 7
a Average margin of error is 5.8% at 95% confidenceb Average margin of error is 3.4% at 95% confidence
North Dakota have the lowest percentage of certified workers. These estimates showthe wide range of percentages of licensed and certified workers in the United States.
5 Characteristics of licensed workers
To show the basic demographic and economic characteristics of the individuals inour sample, we examine the distribution of licensed and certified practitioners byeducation, race, union status, public or private sector, and gender in Table 3. Theresults indicate that licensing rises with education: more than 41% of those with postcollege education have licenses compared with only 11% for those with less than ahigh school education. The results in the table also show that union members are morethan twice as likely to be licensed, reflecting in part the large number of teachers andnurses who tend to be both unionmembers and licensedworkers. Government workersare more likely to have a license than nongovernment workers. We find slightly higherlicensing rates for men (24%) relative to women (19%). The licensing rates for whitesare 22%, 23% forHispanics, and 19% for blacks. The table further shows that licensingrises with age and flattens over age 55. Individuals who provide services are almosttwice as likely to be licensed compared with those who repair things which reflectsthe prominence of occupational regulation in the service sector.
In the last three columns of Table 3, we compare our results with an earlier surveyby Kleiner and Krueger (K&K) (2013) conducted by Westat and completed in 2008with a smaller sample size approaching 2500 individuals. Many characteristics havesimilar values in both surveys. However, as was mentioned earlier, the rate of licensingis higher in their study. This difference could be explained by a higher representationof college and post-college-educated participants, a higher participation of whites, anolder population, a higher percentage of individuals who work in the public sector,and a higher representation of individuals who provide services relative to those who
123

Analyzing occupational licensing among the states
Table3
Characteristicsof
licensed,
certified,and
Not
regulatedworkers
The
Harrisdata
K&Kdata
Variable
Licensed
SDCertifi
edSD
Not
regulated
SDTo
tal%
Obs.
%Obs.
Licensed
Certifi
edNot
regu
lated
Gender
Male
23.9%
42.67%
7.0%
25.45%
69.1%
46.21%
100
3946
4028
.4%
6.7%
64.6%
Female
19.4%
39.51%
6.5%
24.71%
74.1%
43.80%
100
5904
6028
.7%
5.0%
66.0%
Edu
cation
level
Lessthan
HS
11.2%
31.71%
10.5%
30.80%
78.2%
41.42%
100
134
114
.5%
4.0%
81.6%
HS
14.9%
35.59%
6.9%
25.42%
78.2%
41.31%
100
1097
1119
.9%
5.8%
74.0%
Somecollege
18.7%
38.99%
6.7%
24.96%
74.6%
43.52%
100
3150
3228
.1%
5.9%
65.6%
College
20.4%
40.33%
6.4%
24.40%
73.2%
44.29%
100
3351
3429
.2%
5.9%
64.6%
College
+41
.3%
49.24%
6.7%
24.95%
52.1%
49.97%
100
2118
2244
.1%
6.2%
49.5%
Earning
s
Average
yearly
earnings
$60
,581
53,524
47,710
44,173
44,288
41,387
–98
50–
––
–
Average
hourly
earnings
$33
.09
27.28
29.92
28.44
25.71
23.05
–98
50–
––
–
Race
White
21.8%
41.31%
5.9%
23.60%
72.3%
44.78%
100
7782
7929
.5%
5.8%
64.5%
Hispanic
23.2%
42.28%
10.7%
30.95%
66.0%
47.40%
100
548
629
.2%
5.6%
65.2%
Black
19.4%
39.54%
9.6%
29.45%
71.1%
45.38%
100
816
826
.3%
7.0%
66.3%
Other
21.1%
40.86%
7.1%
25.70%
71.8%
45.05%
100
704
723
.0%
5.1%
70.9%
Age ≤25
13.5%
34.19%
7.4%
26.21%
79.1%
40.68%
100
1024
1012
.2%
2.7%
84.0%
26–5
422
.4%
41.72%
6.8%
25.13%
70.8%
45.48%
100
6475
6630
.0%
6.2%
63.6%
>55
23.4%
42.38%
6.4%
24.43%
70.2%
45.76%
100
2351
2428
.8%
5.8%
65.1%
123

E. Vorotnikov, M. M. Kleiner
Table3
continued
The
Harrisdata
K&Kdata
Variable
Licensed
SDCertifi
edSD
Not
regulated
SDTo
tal%
Obs.
%Obs.
Licensed
Certifi
edNot
regulated
Union
status
Union
45.3%
49.81%
9.6%
29.42%
45.1%
49.78%
100
1103
1144
.7%
5.0%
49.9%
Non
-union
18.6%
38.94%
6.4%
24.45%
75.0%
43.32%
100
8747
8925
.7%
6.0%
68.1%
Privateor
public
Privatecompany
19.0%
39.20%
6.2%
24.10%
74.9%
43.39%
100
7950
8124
.8%
5.9%
69.0%
Publiccompany
34.2%
47.44%
9.3%
29.06%
56.5%
49.58%
100
1900
1944
.2%
5.3%
50.3%
Type
ofwork
Provideservices
22.8%
41.96%
6.5%
24.74%
70.7%
45.54%
100
8775
8931
.2%
5.9%
62.7%
Makethings
19.2%
39.46%
11.3%
31.71%
69.5%
46.12%
100
389
411
.4%
5.1%
83.1%
Repairthings
11.1%
31.48%
6.1%
24.03%
82.7%
37.83%
100
686
722
.4%
7.2%
69.0%
123

Analyzing occupational licensing among the states
Table 4 Requirements for becoming licensed
Variable The Harris data K&K data
Licensed workersfacing requirement
Certified workersfacing requirement
Licensed workersfacing requirement
% SD (%) % SD (%) % SD (%)
High school 75.1 43.3 66.6 47.2 31.2 46.4
College 47.7 50.0 28.5 45.2 42.8 49.5
Exam 88.9 31.4 85.9 34.9 85.0 35.8
Performance test 67.8 46.7 61.1 48.8 – –
Continuing Ed 67.8 46.7 52.9 50.0 69.8 45.9
Internship 46.5 49.9 35.3 47.8 33.6 47.3
License/certificate renewal test 34.5 47.6 33.9 47.4 – –
make things in the K&K survey, since all of these characteristics of the populationcontribute to a higher percentage of individuals who are licensed.
Table 4 shows the requirements for becoming licensed using both the Harris Surveyand the one developed byWestat and used in the K&K analysis (2013). There are somedifferences in the questions asked in the two surveys. In the Harris Survey, the questionwas, “Did you require at least a high school education in order to become licensed?”and the response was 75% of the survey participants required that level of educationor higher. In the K&K survey, the question was whether participants had a specificrequirement for a high school diploma, and the response was 31 percent. However,most of the other statistics for other requirements necessary for obtaining a licensewere similar across the two surveys.
To provide a more formal answer to the question of what kind of people tend tobecome licensed, we estimate two models, a linear probability model and a logisticmodel. Further, for the logistic model, we calculated the average marginal effectsto make the estimates easier to interpret.3 In these statistical models, the dependentvariable is a dummy variable that indicates whether a person is licensed. The set ofindependent variables includes individual characteristics such as gender, race, age,level of education attainment, union membership status and other observable factors.These estimates are shown in Table 5. Both approaches indicate that females are 3.6%less likely to be licensed than white males. Male Hispanics, African Americans, andothers are as likely to be licensed as white males. More highly educated workers,who also have more years of work experience, have a significantly higher probabilityof attaining an occupational license. Union members are 10 to 15% more likely tobe licensed than nonunionized practitioners. In addition, government employees andself-employed workers are 3 and 6% more likely to be licensed than employees ofnot-for-profit companies. In contrast, employees in for-profit companies are almost3% less likely to hold licenses than employees of not-for-profit organizations.
3 The logistic model estimates and corresponding average marginal effects are not shown since both thelinear probability and the logistic models produce substantively identical results.
123

E. Vorotnikov, M. M. Kleiner
Table 5 Influence of personaland economic characteristics onthe likelihood of being licensed
Variables Linear probability model
Coefficients SE
Constant 0.066 0.215
Female −0.036*** 0.009
Hispanic 0.012 0.020
Black −0.018 0.019
Other −0.027 0.022
Education 0.017*** 0.003
Age −0.005 0.004
Age2 0.000 0.000
Work experience 0.008*** 0.003
Work experience2 −0.0001* 0.000
Union member 0.151*** 0.020
Work for government 0.032* 0.017
Self employed 0.067*** 0.025
Work for for-profit −0.028* 0.016
Math skills 0.021** 0.010
Reading skills 0.035*** 0.011
Children 0.036*** 0.011
Divorced −0.002 0.015
Married 0.014 0.014
Log of real GDP −0.019 0.015
Occupation fixed effects Yes
State fixed effects Yes
R-squared 0.310
Observations 9827
Robust standard errors clusteredat the state level are reported*** P value < 0.01; ** P value< 0.05; * P value < 0.10;
6 Influence of licensing on earnings
In order to examine the quality of our estimates, we probe whether licensing preva-lence is exogenous with respect to other factors that might also affect incomes of theregulated workers. Therefore, we identify the presence of any statistical signals orpatterns in the distribution of licensing prevalence that might suggest the existence ofthese underlying factors.
First, as a check for presence of regional patterns in occupational licensing, wecalculated global Moran’s I statistic. Global Moran’s I test by using information onstates geographical location and their corresponding average percentage of licensedpopulation allowed us to check whether there were any clusters of states with statis-tically similar levels of licensed populations. Null hypothesis of the test was absenceof spatial clustering (levels of licensing prevalence were randomly distributed). Per-mutation procedure was used to estimate test’s pseudo significance level. Using 9,999permutations, the pseudo p-value was estimated to be equal 0.122 (P = 0.122). This
123
Analyzing occupational licensing among the states
p-value did not allow us to reject null hypothesis indicating absence of geographicalclustering (Oyana and Margai 2015).
Although licensing prevalence is not correlated with geography, prevalence mightbe correlated with other factors that could affect our results. Therefore, the next stepwould be to test whether change in the occupational mix affects the prevalence oflicensed professionals across states. We do not perform this type of analysis in ourstudy, but the U.S. Department of the Treasury’s Office of Economic Policy, the Coun-cil of Economic Advisers, and the Department of Labor (2015) conducted this typeof empirical analysis using our estimates of licensing prevalence and data from theSurvey of Income and Program Participation. They found that “variation in licens-ing prevalence appears not to be driven by differences in occupational mix acrossStates.”4
All of the previous checks for data quality issues show that none of the systematicpatterns or underlying factors that might affect the estimates were identified, whichsuggests that the estimatedmodels allow us tomake statistically valid inferences aboutthe effects of occupational regulations on regulated workers’ earnings.
Using the data collected by Harris, we estimated how occupational regulationsinfluence hourly earnings. The ordinary least squares results shown in Table 6 andTable 7 suggest that occupational licensing regulations raise mean log hourly earn-ings by approximately 10.3 to 11.9%.5 These estimates are lower than the 10 to 15%found by K&K (Kleiner and Krueger 2010, 2013). The estimates in Table 7 show thatlicensing has a larger influence on earnings than certification. The licensing estimatespresented in Tables 6 and 7 largely reflect themonopoly effect that occupational licens-ing likely creates relative to the signaling or human capital effects of certification.6
The estimates suggest that licensing is associated with approximately 11% higherearnings even after accounting for human capital, labor market characteristics, andtwo digit occupation controls.7 These results are similar to estimates presented byKleiner using the Census Public-Use Microdata Samples through 2000, and using theSurvey of Income and Program Participation (Kleiner 2006; Gittleman et al. 2017).Although the influence of other variables such as age, education, and unionization onhourly earnings is consistent with the economic and policy literature, the coefficientsof race variables are not statistically significant. Perhaps this is because of our abilityto better control for reading and math skills in our regression estimates (see Neal andJohnson 1996).
4 Additional details of the analysis can be found in “Occupational Licensing: A Framework for Policy-makers”.5 Tables 6, 7, and 9 report the unadjusted coefficients. Because the dependent variables were in logs, wemake the appropriate adjustments in the text when we discuss the magnitude of the economic impact of thedummy variables: 100 × (exp(β̂) − 1).6 Occupational licensing could raise wages if the right set of regulations were chosen to restrict supply andlimit the tasks of unlicensed workers. Moreover, licensed workers could enhance demand by signaling thatthey are providing a higher-quality service or greater human capital to consumers (Friedman 1962; Spence1973).7 We use the 2010 Standard Occupational Classification (SOC) system.
123

E. Vorotnikov, M. M. Kleiner
Table 6 Estimates of the influence of licensing on hourly earnings (log)
Variables (1) (2) (3) (4)
Coefficients SE Coefficients SE Coefficients SE Coefficients SE
Constant 3.017*** 0.018 −1.623*** 0.497 −1.461*** 0.307 −1.046*** 0.304
Licensed 0.247*** 0.024 0.089*** 0.019 0.092*** 0.019 0.098*** 0.023
Female −0.156*** 0.014 −0.155*** 0.014 −0.118*** 0.015
Hispanic 0.070** 0.031 0.058* 0.034 0.050 0.034
Black 0.011 0.036 0.015 0.033 0.011 0.033
Other 0.024 0.023 0.027 0.026 0.025 0.025
Education 0.066*** 0.006 0.065*** 0.006 0.055*** 0.006
Age 0.026*** 0.009 0.026*** 0.009 0.020** 0.009
Age2 −0.0003*** 0.000 −0.0004*** 0.000 −0.0003*** 0.000
Workexperience
0.017*** 0.005 0.017*** 0.005 0.015*** 0.005
Workexperience2
−0.0001 0.000 −0.0001 0.000 −0.0001 0.000
Unionmember
0.115*** 0.030 0.102*** 0.029 0.180*** 0.030
Work forgovern-ment
0.040 0.027 0.047* 0.026 0.047* 0.026
Selfemployed
0.197*** 0.038 0.196*** 0.038 0.192*** 0.038
Work forprofit
0.123*** 0.017 0.120*** 0.017 0.077*** 0.017
Math skills 0.112*** 0.020 0.113*** 0.019 0.064*** 0.017
Readingskills
0.211*** 0.017 0.211*** 0.017 0.156*** 0.018
Children 0.030 0.020 0.031 0.020 0.035* 0.019
Divorced −0.005 0.034 −0.005 0.034 −0.024 0.034
Married 0.082*** 0.025 0.085*** 0.025 0.057** 0.025
Log of realGDP
0.253*** 0.042 0.235*** 0.020 0.244*** 0.022
Occupationfixedeffects
No No No Yes
State fixedeffects
No No Yes Yes
R-squared 0.023 0.282 0.292 0.357
Observations 9850 9850 9850 9827
Robust standard errors clustered at the state level are reported*** P value < 0.01; ** P value < 0.05; * P value < 0.10
123

Analyzing occupational licensing among the states
Table 7 Estimates of the influence of licensing and certification on hourly earnings (log)
Variables (1) (2) (3) (4)
Coefficients SE Coefficients SE Coefficients SE Coefficients SE
Constant 3.006*** 0.017 −1.645*** 0.500 −1.401*** 0.315 −1.008*** 0.307
Licensed 0.258*** 0.024 0.098*** 0.020 0.102*** 0.019 0.112*** 0.023
Certified 0.123*** 0.034 0.086** 0.033 0.087** 0.032 0.092*** 0.031
Female −0.155*** 0.014 −0.155*** 0.014 −0.117*** 0.015
Hispanic 0.066** 0.030 0.053 0.033 0.046 0.033
Black 0.008 0.036 0.011 0.034 0.008 0.033
Other 0.023 0.023 0.027 0.025 0.025 0.024
Education 0.066*** 0.006 0.065*** 0.005 0.054*** 0.006
Age 0.026*** 0.009 0.026*** 0.009 0.020** 0.009
Age2 −0.0004*** 0.000 −0.0004*** 0.000 −0.0003*** 0.000
Workexperience
0.017*** 0.005 0.017*** 0.005 0.015*** 0.005
Workexperience2
−0.0001 0.000 −0.0001 0.000 −0.0001 0.000
Unionmember
0.111*** 0.029 0.098*** 0.028 0.176*** 0.030
Work forgovernment
0.038 0.027 0.045 0.027 0.043 0.026
Selfemployed
0.192*** 0.039 0.191*** 0.039 0.187*** 0.039
Work for profit 0.123*** 0.017 0.121*** 0.017 0.077*** 0.017
Math skills 0.110*** 0.020 0.112*** 0.019 0.062*** 0.017
Reading skills 0.209*** 0.017 0.210*** 0.017 0.154*** 0.018
Children 0.029 0.020 0.029 0.020 0.034* 0.019
Divorced −0.006 0.034 −0.005 0.034 −0.024 0.034
Married 0.081*** 0.025 0.084*** 0.025 0.056** 0.024
Log of realGDP
0.254*** 0.042 0.229*** 0.020 0.240*** 0.022
Occupationfixed effects
No No No Yes
State fixedeffects
No No Yes Yes
R-squared 0.026 0.283 0.293 0.358
Observations 9,850 9,850 9,850 9,827
Robust standard errors clustered at the state level are reported*** P value < 0.01; ** P value < 0.05; * P value < 0.10
7 Quantile regression results
The influence of licensing regulations on mean log hourly earnings is informative, butmay not reflect the relationship at other points in the hourly earnings distribution. In
123

E. Vorotnikov, M. M. Kleiner
Table8
Estim
ates
oftheinflu
ence
oflic
ensing
onearnings
(log
)by
Quantile
Variables
OLS
Q_2
0Q_3
0Q_4
0Q_5
0Q_6
0Q_7
0Q_8
0Q_9
0
A Con
stant
−1.328
**−1
.484
***
−1.633
***
−1.752
***
−1.965
***
−1.866
***
−1.599
−1.160
−0.231
Licensed
0.09
2***
0.03
6**
0.05
1***
0.05
5***
0.06
9***
0.08
0***
0.10
4***
0.15
7***
0.23
5***
Female
−0.155
***
−0.132
***
−0.126
***
−0.139
***
−0.161
***
−0.178
***
−0.186
***
−0.175
***
−0.183
***
Hispanic
0.058
−0.016
0.00
20.00
30.03
8*0.04
00.10
9***
0.11
8***
0.09
6***
Black
0.01
5−0
.002
−0.016
−0.005
0.00
6−0
.025
−0.002
0.04
20.08
0***
Other
0.027
−0.023
−0.002
0.04
3**
0.01
90.00
40.02
20.06
7**
0.12
6***
Edu
catio
n0.06
5***
0.06
6***
0.06
9***
0.07
1***
0.07
7***
0.07
8***
0.07
90.08
00.06
2
Age
0.02
6***
0.01
0*0.01
2**
0.01
3***
0.02
1***
0.01
9***
0.03
10.03
20.05
7
Age
2−0
.000
1***
−0.000
1***
−0.000
1***
−0.000
1***
−0.000
1***
−0.000
1***
−0.000
1***
−0.000
1***
−0.001
***
Workexperience
0.01
7***
0.02
7***
0.02
9***
0.03
1***
0.02
6***
0.02
6***
0.01
90.01
8−0
.004
Workexperience
2−0
.000
1−0
.000
1***
−0.000
1***
−0.000
1***
−0.000
1***
−0.000
1**
−0.000
1−0
.000
1***
0.00
01
Union
mem
ber
0.10
2***
0.10
8***
0.07
1***
0.07
9***
0.06
0***
0.07
2***
0.07
2***
0.12
7***
0.12
9***
Workforgovernment
0.04
7**
0.06
3***
0.06
1***
0.05
6***
0.03
3*0.05
7**
0.04
5***
0.03
0−0
.016
Selfem
ployed
0.19
6***
0.00
40.07
5***
0.10
1***
0.19
4***
0.26
5***
0.28
7***
0.36
6***
0.52
8***
Workin
for-profi
t0.12
0***
0.07
1***
0.07
8***
0.09
0***
0.09
2***
0.13
0***
0.15
10.17
1***
0.18
0
Mathskills
0.11
3***
0.10
5***
0.12
0***
0.12
9***
0.14
4***
0.14
2***
0.12
70.14
4***
0.06
7
Reading
skills
0.21
1***
0.18
7***
0.19
7***
0.21
4***
0.20
1***
0.21
4***
0.22
6***
0.19
70.18
3***
Children
0.03
1*0.03
2**
0.04
4***
0.03
3**
0.01
90.01
90.03
40.02
5**
−0.003
Divorced
−0.005
0.00
5−0
.003
0.01
10.04
5**
0.04
3*0.02
5−0
.004
−0.068
123
Analyzing occupational licensing among the states
Table8
continued
Variables
OLS
Q_2
0Q_3
0Q_4
0Q_5
0Q_6
0Q_7
0Q_8
0Q_9
0
Married
0.08
5***
0.11
1***
0.11
7***
0.12
4***
0.13
8***
0.12
0***
0.10
30.05
7−0
.001
Log
ofrealGDP
0.22
3***
0.23
0***
0.24
7***
0.25
5***
0.26
6***
0.26
7***
0.23
10.20
10.14
1
Statefix
edeffects
Yes
Yes
Yes
Yes
Yes
Yes
Yes
Yes
Yes
R-squ
ared
/pseud
oR-squ
ared
0.29
20.20
50.22
10.22
30.22
00.21
00.19
60.17
10.14
2
Variables
OLS
Q_2
0Q_3
0Q_4
0Q_5
0Q_6
0Q_7
0Q_8
0
B Con
stant
−0.447
−1.11
−0.546
−1.796
−3.316
**0.55
90.20
3−1
.067
Licensed
0.09
8***
0.07
9***
0.09
6***
0.09
0***
0.08
8***
0.08
4***
0.07
6***
0.09
5***
Female
−0.118
***
−0.081
***
−0.075
***
−0.106
***
−0.115
***
−0.120
***
−0.135
***
−0.147
***
Hispanic
0.05
00.01
20.00
10.01
00.00
10.03
5**
0.04
9***
0.10
8***
Black
0.01
1−0
.016
−0.036
***
−0.036
**−0
.015
−0.033
0.00
90.04
7***
Other
0.025
−0.012
−0.011
−0.016
−0.016
0.03
40.04
8*0.07
7***
Edu
catio
n0.05
5***
0.05
40.05
6***
0.05
9***
0.06
2***
0.06
9***
0.07
1***
0.06
5***
Age
0.02
0***
0.01
30.01
1***
0.01
6***
0.01
7***
0.02
1***
0.02
1***
0.02
5***
Age
2−0
.000
1***
−0.000
1***
−0.000
1***
−0.000
1***
−0.000
1***
−0.000
1***
−0.000
1***
−0.000
1***
Workexperience
0.01
5***
0.02
10.02
3***
0.02
2***
0.02
2***
0.01
9***
0.01
9***
0.01
4***
Workexperience
2−0
.000
1−0
.000
1***
−0.000
1***
−0.000
1**
−0.000
1**
−0.000
1−0
.000
1**
−0.000
1
Union
mem
ber
0.18
0***
0.16
6***
0.16
3***
0.16
2***
0.18
3***
0.15
0***
0.15
1***
0.16
6***
Workforgovernment
0.04
7**
0.04
3***
0.04
0***
0.03
3**
0.03
2**
0.02
20.03
1**
0.04
8***
Selfem
ployed
0.19
2***
−0.02
0.04
40.10
5***
0.16
5***
0.23
3***
0.29
0***
0.32
2***
Workin
for-profi
t0.07
7***
0.01
20.03
7***
0.03
7***
0.05
1***
0.06
9***
0.09
1***
0.10
8***
Mathskills
0.06
4***
0.05
50.05
8***
0.05
7***
0.08
1***
0.07
4***
0.08
3***
0.08
5***
123

E. Vorotnikov, M. M. Kleiner
Table8
continued
Variables
OLS
Q_2
0Q_3
0Q_4
0Q_5
0Q_6
0Q_7
0Q_8
0
Reading
skills
0.15
6***
0.13
6***
0.13
9***
0.14
2***
0.13
6***
0.13
5***
0.14
5***
0.16
8***
Children
0.03
5**
0.02
7***
0.01
30.01
6*0.02
3**
0.03
3***
0.02
9***
0.03
9***
Divorced
−0.024
−0.023
0.00
30.02
0.01
40.02
−0.018
−0.029
Married
0.05
7***
0.06
9***
0.09
2***
0.09
5***
0.08
5***
0.08
6***
0.05
9***
0.02
5**
Log
ofrealGDP
0.18
7***
0.23
10.18
7***
0.30
7***
0.45
1***
0.07
90.11
70.24
9
Occupationfix
edeffects
Yes
Yes
Yes
Yes
Yes
Yes
Yes
Yes
Statefix
edeffects
Yes
Yes
Yes
Yes
Yes
Yes
Yes
Yes
R-squ
ared/pseud
oR-squ
ared
0.35
70.26
30.27
50.27
60.27
00.25
60.23
70.20
9
***Pvalue
<0.01
;**Pvalue
<0.05
;*Pvalue
<0.10
;
123

Analyzing occupational licensing among the states
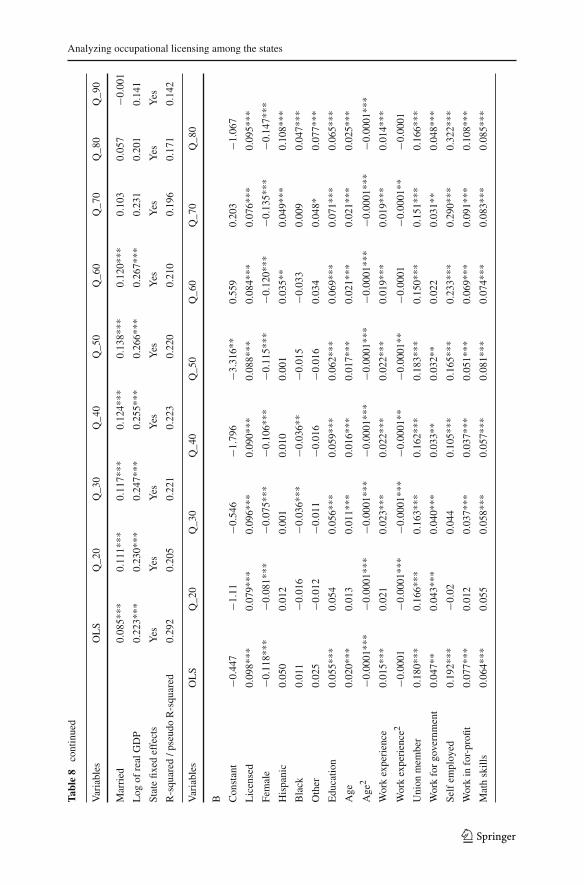
order to provide an additional perspective on the influence of occupational regulationson earnings, we estimated quantile regressions to measure the influence of licensingacross the wage distribution. Table 8A and B show how licensing influences earningsof regulated practitioners across different parts of the earnings distribution. The resultsin Table 8A are produced without controlling for two digit occupation fixed effects,and the estimates in Table 8B are specified with occupation controls. The results inTable 8A suggest that comparedwith the overall licensing coefficient in the conditionalmean model, which is 9.2%, the coefficient of the conditional median model is lower.This implies that the effect of licensing on the hourly earnings of regulated profes-sionals would not be as large for most of the working population. Table 8A shows thatindividuals in the lower part of the income distribution— manicurists, for example—are associated with a gain only 3.6 to 5.1% due to licensing, but those in the middleof the income distribution gain 7 to 8%. Further, those individuals in the top 30%of the income distribution gain 10 to 24%. However, once we control for occupationeffects, in panel Table 8B, licensing coefficients level out across the income distribu-tion and vary between 7.9% in its lowest part to 9.5 in the top. The results suggest thatlicensing exacerbates relative income inequality, since higher wage occupations tendto gain more from the regulation relative to lower wage ones. These results underlinethe importance of examining the licensing effect throughout the earnings distribution,and that occupational licensing may raise wage inequality.
The influence of educational attainment on hourly earnings does not change signif-icantly across the earnings distribution in Table 8A and B. The role of the other twoeducation proxy variables—reading skills and math skills—change by roughly 4% inTable 8A, increasing from 18.7% and 10.5% at lower quantiles to 22.6% and 14.4%at upper quantiles. In Table 8B signs and significance of the education proxy variablesare essentially the same, but the values of the coefficients diminish. This is expectedsince occupation fixed effects also indirectly control for reading skills and math skills.Union membership yields a higher return of 10.8% at the lower end of the hourly wagedistribution than at the median, where it is equal to 6% in Table 8A. This result corre-sponds to earlier findings of the influence of unionization (Freeman 1982;Chamberlain1994). After controlling for occupation fixed effects the union membership gradientincreases to on average 16% and levels out across the income distribution.
The yield from being a government employee gradually decreases from 6.3% atthe bottom quantiles to 4.5% at the upper quantiles. The measure of economic returnsfor being self-employed, increases from roughly 7% at the lower part of the earningsdistribution to 28.7% at the 70th quantile and to 53 percent at the 90th quantile. Indi-viduals who work in for-profit companies experience similar changes. Their hourlyearnings increase from 7% at the lower end of the distribution to 17% at the upperend. In Table 8B, signs and significance of the different types of employment vari-ables are essentially the same, but the values of the coefficients diminish. Again, thisis expected since occupation fixed effects also indirectly control for the influence ofthese characteristics.
123

E. Vorotnikov, M. M. Kleiner
Table 9 State-level estimates of the influence of licensing on hourly earnings (log)
State Licensing coefficient SE R-squared Observations
Alabama −0.105 0.129 0.339 173
Alaska 0.044 0.118 0.374 208
Arizona 0.039 0.109 0.299 186
Arkansas 0.226 0.221 0.185 157
California 0.152 0.196 0.298 197
Colorado 0.016 0.147 0.366 167
Connecticut 0.284*** 0.097 0.394 216
Delaware 0.248 0.161 0.277 180
District of Columbia 0.195 0.121 0.360 222
Florida 0.304* 0.179 0.319 187
Georgia 0.258* 0.149 0.293 171
Hawaii 0.208* 0.109 0.269 188
Idaho 0.100 0.110 0.255 189
Illinois 0.293** 0.126 0.377 206
Indiana 0.035 0.129 0.288 198
Iowa 0.355** 0.142 0.013 211
Kansas 0.233* 0.140 0.316 206
Kentucky −0.055 0.137 0.255 210
Louisiana −0.036 0.116 0.439 186
Maine 0.387*** 0.140 0.332 181
Maryland −0.043 0.148 0.387 205
Massachusetts 0.056 0.134 0.335 212
Michigan 0.264* 0.140 0.335 191
Minnesota −0.002 0.174 0.328 187
Mississippi 0.161 0.134 0.413 177
Missouri 0.196* 0.117 0.243 186
Montana 0.301** 0.117 0.290 200
Nebraska 0.102 0.160 0.244 201
Nevada 0.314*** 0.112 0.315 178
New Hampshire 0.115 0.111 0.321 209
New Jersey 0.103 0.099 0.339 198
New Mexico −0.025 0.105 0.328 181
New York −0.155 0.134 0.248 216
North Carolina −0.080 0.139 0.388 166
North Dakota 0.111 0.098 0.137 213
Ohio −0.030 0.110 0.418 207
Oklahoma −0.047 0.102 0.248 211
Oregon 0.152 0.141 0.329 202
Pennsylvania 0.310*** 0.114 0.338 211
Rhode Island 0.028 0.103 0.163 203
123
Analyzing occupational licensing among the states
Table 9 continued
State Licensing coefficient SE R-squared Observations
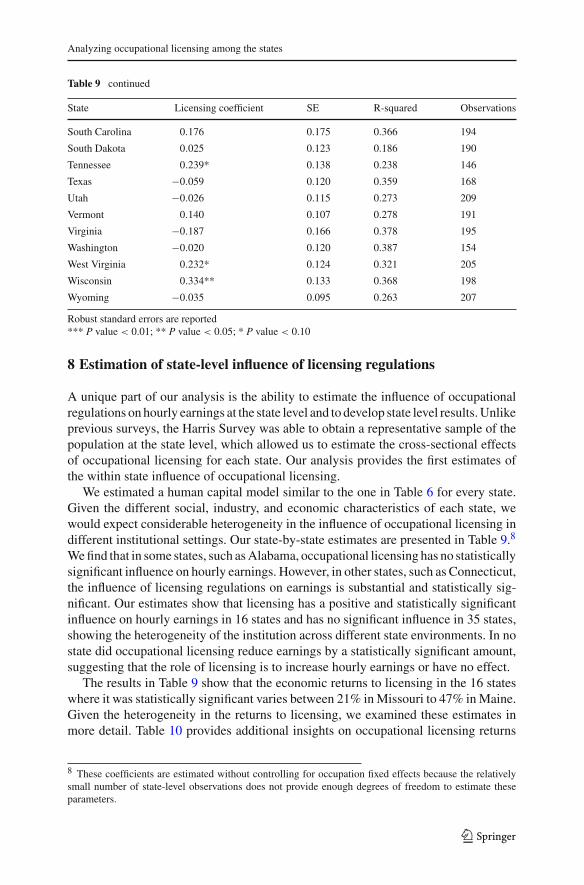
South Carolina 0.176 0.175 0.366 194
South Dakota 0.025 0.123 0.186 190
Tennessee 0.239* 0.138 0.238 146
Texas −0.059 0.120 0.359 168
Utah −0.026 0.115 0.273 209
Vermont 0.140 0.107 0.278 191
Virginia −0.187 0.166 0.378 195
Washington −0.020 0.120 0.387 154
West Virginia 0.232* 0.124 0.321 205
Wisconsin 0.334** 0.133 0.368 198
Wyoming −0.035 0.095 0.263 207
Robust standard errors are reported*** P value < 0.01; ** P value < 0.05; * P value < 0.10
8 Estimation of state-level influence of licensing regulations
A unique part of our analysis is the ability to estimate the influence of occupationalregulations on hourly earnings at the state level and to develop state level results.Unlikeprevious surveys, the Harris Survey was able to obtain a representative sample of thepopulation at the state level, which allowed us to estimate the cross-sectional effectsof occupational licensing for each state. Our analysis provides the first estimates ofthe within state influence of occupational licensing.
We estimated a human capital model similar to the one in Table 6 for every state.Given the different social, industry, and economic characteristics of each state, wewould expect considerable heterogeneity in the influence of occupational licensing indifferent institutional settings. Our state-by-state estimates are presented in Table 9.8
Wefind that in some states, such asAlabama, occupational licensing has no statisticallysignificant influence on hourly earnings. However, in other states, such as Connecticut,the influence of licensing regulations on earnings is substantial and statistically sig-nificant. Our estimates show that licensing has a positive and statistically significantinfluence on hourly earnings in 16 states and has no significant influence in 35 states,showing the heterogeneity of the institution across different state environments. In nostate did occupational licensing reduce earnings by a statistically significant amount,suggesting that the role of licensing is to increase hourly earnings or have no effect.
The results in Table 9 show that the economic returns to licensing in the 16 stateswhere it was statistically significant varies between 21% inMissouri to 47% inMaine.Given the heterogeneity in the returns to licensing, we examined these estimates inmore detail. Table 10 provides additional insights on occupational licensing returns
8 These coefficients are estimated without controlling for occupation fixed effects because the relativelysmall number of state-level observations does not provide enough degrees of freedom to estimate theseparameters.
123

E. Vorotnikov, M. M. Kleiner
Table 10 Effect of licensing regulations at different levels of state-level GDP per capita
GDP percapitarange
GDP percapita in2012$
State Return onlicensing%
Averagehourlyreturn %
Return onlicensing$
Averagehourlyreturn $
$35K–$40K $35,725 West Virginia 26.11 $6.12
$39,035 Montana 35.12 30.62 $7.50 $6.81
$40K–$45K $40,672 Maine 47.26 $9.58
$40,913 Florida 35.53 $8.92
$41,496 Michigan 30.21 $7.97
$43,280 Missouri 21.65 $4.65
$43,796 Tennessee 27.00 $6.19
$44,322 Georgia 29.43 31.85 $7.00 $7.39
$45K–$50K $46,210 Wisconsin 39.65 $9.06
$47,098 Pennsylvania 36.34 $9.03
$48,234 Nevada 36.89 $9.53
$48,282 Kansas 26.24 $6.50
$49,636 Iowa 42.62 36.35 $10.05 $8.83
$50K–$55K $52,246 Hawaii 23.12 $6.21
$54,255 Illinois 34.04 28.58 $8.66 $7.43
$60K–$65K $64,570 Connecticut 32.84 32.84 $9.88 $9.88
Because the dependent variables were in logs, we make the appropriate adjustments in the table to showthe magnitude of the economic impact of the dummy variables: 100 × (exp(β̂) − 1)
from our state-level regression models. In this table we group the 16 states based ontheir corresponding Gross Domestic Product (GDP) per capita and show their averagereturns to licensing in relative and real terms. The average real return to licensing, ofthe grouped state data, increases along with GDP per capita from $6.81 per hour to$9.88 per hour. At the same time, the average relative return on licensing of the stategrouped data increases from 30.6% in states with low GDP per capita to its peak of36.4% in states where GDP per capita ranges from $45,000 to $50,000 a year, and itdiminishes in states that have GDP per capita above this threshold to 32.8%.9 Thisinverse parabolic pattern suggests that licensing has increasing returns to scale in stateswith GDP per capita is below the $45,000–$50,000 annual threshold and decreasingreturns to scale above this threshold.
Next, we regressed states’ relative returns on licensing on their correspondinglog(GDP) and log (GDP)2 to check for the presence of statistically significant evi-dence of this parabolic curvature. Although, the estimated coefficients had correctsigns, these coefficients were not statistically significant. We did not find the inverseparabolic relationship when we extended our results to states where licensing coeffi-cients were not statistically significant.
9 The last group, with wages ranging from $60,000 to $65,000, has a higher than expected average effect;however, this group is represented by only one state which could be a reason for higher than expected effect.
123

Analyzing occupational licensing among the states
Beyond the issue of state heterogeneity, another possible reason for the large vari-ance among states is that the relatively small number of state-level observations hasresulted in insufficient statistical power to identify the influence of occupational licens-ing in some states. The number of observations in each state varies from 146 inTennessee to 222 in the District of Columbia, and it averages 193 per state. Neverthe-less, these estimates provide a first approximation of the role of occupational licensingwithin and across states, which future analysis can probe in greater detail.
The state- and national-level estimates can form the basis of structural simulationsof national- and state-level effects of occupational regulations on simulated losses injobs, loss in output (deadweight loss), and a misallocation of resources. In “Appendix2” structuralmodels are provided for illustrative purposes. The simulations suggest thatsuch a reduction in occupational regulation could translate into higher employmentand higher economic output assuming that there are no overall quality effects ofoccupational licensing (Kleiner 2000, 2006).
9 Conclusions
This study provides new evidence on the influence of occupational regulations on theU.S. labor market based on a new and updated national survey of the U.S. popula-tion. The estimates were developed based on a representative data set of individualscollected by the Harris Survey organization using questions from a survey initiallyconducted by Westat and the human capital questions that are regularly part of theCurrent Population Survey. Our sample size was about 4 times as large as the Wes-tat sample and was developed to reflect the demographic composition of each U.S.state. Consequently, we are able to develop estimates of the influence of occupationallicensing and certification on wage determination for each of the U.S. states.
Initially we estimated the influence of licensing on hourly earnings nationally. Wefound that occupational licensing increased wages on average by about 11% in 2013.The hourly earnings distribution across deciles and quartiles shows that higher incomeregulated occupations gain a larger wage return on licensing in percentage terms rel-ative to lower income licensed occupations. Further, we show for the first time thatoccupational licensing is heterogeneous across U.S. states. Occupational licensingcontinues to be an important issue for both jobs and resource allocation in the U.S.economy. We expect that government’s new efforts to collect more comprehensivedata will enhance economic knowledge about the role of these types of regulationsin the labor market as well as the costs and benefits of this growing labor marketinstitution.
Appendices
Appendix 1
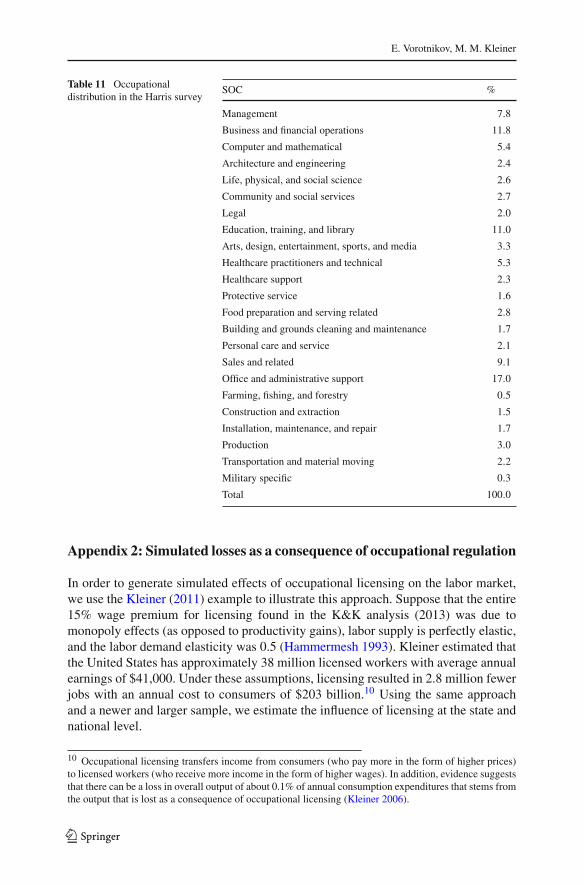
See Table 11.
123
E. Vorotnikov, M. M. Kleiner
Table 11 Occupationaldistribution in the Harris survey
SOC %
Management 7.8
Business and financial operations 11.8
Computer and mathematical 5.4
Architecture and engineering 2.4
Life, physical, and social science 2.6
Community and social services 2.7
Legal 2.0
Education, training, and library 11.0
Arts, design, entertainment, sports, and media 3.3
Healthcare practitioners and technical 5.3
Healthcare support 2.3
Protective service 1.6
Food preparation and serving related 2.8
Building and grounds cleaning and maintenance 1.7
Personal care and service 2.1
Sales and related 9.1
Office and administrative support 17.0
Farming, fishing, and forestry 0.5
Construction and extraction 1.5
Installation, maintenance, and repair 1.7
Production 3.0
Transportation and material moving 2.2
Military specific 0.3
Total 100.0
Appendix 2: Simulated losses as a consequence of occupational regulation
In order to generate simulated effects of occupational licensing on the labor market,we use the Kleiner (2011) example to illustrate this approach. Suppose that the entire15% wage premium for licensing found in the K&K analysis (2013) was due tomonopoly effects (as opposed to productivity gains), labor supply is perfectly elastic,and the labor demand elasticity was 0.5 (Hammermesh 1993). Kleiner estimated thatthe United States has approximately 38 million licensed workers with average annualearnings of $41,000. Under these assumptions, licensing resulted in 2.8 million fewerjobs with an annual cost to consumers of $203 billion.10 Using the same approachand a newer and larger sample, we estimate the influence of licensing at the state andnational level.
10 Occupational licensing transfers income from consumers (who pay more in the form of higher prices)to licensed workers (who receive more income in the form of higher wages). In addition, evidence suggeststhat there can be a loss in overall output of about 0.1% of annual consumption expenditures that stems fromthe output that is lost as a consequence of occupational licensing (Kleiner 2006).
123

Analyzing occupational licensing among the states
Table12
Employmentlosses,deadweightlosses,andmisallocatio
nof
resourcesdueto
occupatio
nallicensing
State
Adjusted
licensing
coefficient
Total
workers
employed
Average
annu
alearnings
oflicensedworkers
Num
berof
licensed
workers
Lossin
jobs
dueto
licensing
Deadw
eight
loss
(in$M
)Misallocatio
nof
resources
(in$M
)
UnitedStates
9.64
133,73
9,00
0$6
0,58
129
,021
,363
1,39
8,31
9$3
723
$158
,255
Con
necticut
32.84
1,63
9,00
0$7
4,61
940
3,96
066
,337
$612
$806
4
Florida
35.53
7,40
0,10
0$5
4,84
02,12
5,83
337
7,62
1$2
714
$33,27
5
Georgia
29.43
3,95
2,80
0$5
7,65
562
0,88
791
,376
$599
$873
9
Haw
aii
23.12
605,30
0$7
4,95
216
1,23
418
,640
$131
$240
1
Illin
ois
34.04
5,74
4,40
0$6
7,36
81,41
8,30
824
1,42
6$2
065
$26,33
3
Iowa
42.62
1,50
8,40
0$7
9,94
850
1,48
610
6,86
2$1
276
$13,25
7
Kansas
26.24
1,35
7,80
0$6
4,54
520
2,41
526
,555
$178
$289
4
Maine
47.26
597,60
0$5
8,87
712
3,61
029
,206
$276
$261
1
Michigan
30.21
4,02
4,20
0$5
0,05
483
0,63
912
5,48
0$7
29$1
0,37
5
Missouri
21.65
2,66
9,40
0$9
0,07
156
8,76
561
,576
$494
$961
2
Mon
tana
35.12
440,50
0$5
9,12
193
,786
16,469
$127
$156
8
Nevada
36.89
1,14
2,70
0$7
3,91
335
1,26
764
,789
$645
$764
2
Pennsylvania
36.34
5,72
9,70
0$7
0,67
61,15
7,78
421
0,38
4$1
982
$23,79
3
Tennessee
27.00
2,71
4,30
0$5
6,71
262
6,33
384
,548
$510
$806
1
WestV
irginia
26.11
765,30
0$4
6,95
019
7,73
925
,817
$125
$204
8
Wisconsin
39.65
2,78
4,60
0$5
9,23
551
1,77
810
1,47
1$8
53$9
461
Total
9,89
5,82
41,64
8,55
8$1
3,31
7$1
70,134
123
E. Vorotnikov, M. M. Kleiner
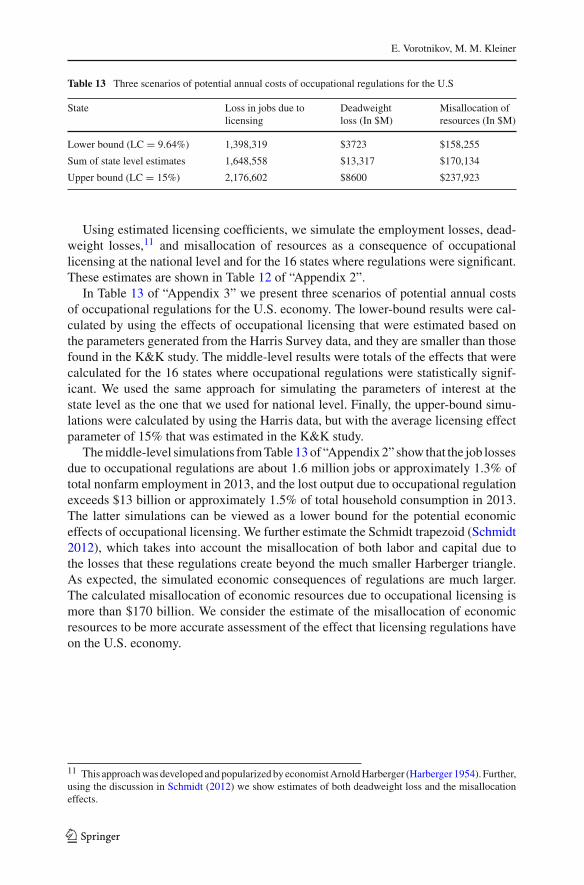
Table 13 Three scenarios of potential annual costs of occupational regulations for the U.S
State Loss in jobs due tolicensing
Deadweightloss (In $M)
Misallocation ofresources (In $M)
Lower bound (LC = 9.64%) 1,398,319 $3723 $158,255
Sum of state level estimates 1,648,558 $13,317 $170,134
Upper bound (LC = 15%) 2,176,602 $8600 $237,923
Using estimated licensing coefficients, we simulate the employment losses, dead-weight losses,11 and misallocation of resources as a consequence of occupationallicensing at the national level and for the 16 states where regulations were significant.These estimates are shown in Table 12 of “Appendix 2”.
In Table 13 of “Appendix 3” we present three scenarios of potential annual costsof occupational regulations for the U.S. economy. The lower-bound results were cal-culated by using the effects of occupational licensing that were estimated based onthe parameters generated from the Harris Survey data, and they are smaller than thosefound in the K&K study. The middle-level results were totals of the effects that werecalculated for the 16 states where occupational regulations were statistically signif-icant. We used the same approach for simulating the parameters of interest at thestate level as the one that we used for national level. Finally, the upper-bound simu-lations were calculated by using the Harris data, but with the average licensing effectparameter of 15% that was estimated in the K&K study.
Themiddle-level simulations fromTable 13of “Appendix2” show that the job lossesdue to occupational regulations are about 1.6 million jobs or approximately 1.3% oftotal nonfarm employment in 2013, and the lost output due to occupational regulationexceeds $13 billion or approximately 1.5% of total household consumption in 2013.The latter simulations can be viewed as a lower bound for the potential economiceffects of occupational licensing. We further estimate the Schmidt trapezoid (Schmidt2012), which takes into account the misallocation of both labor and capital due tothe losses that these regulations create beyond the much smaller Harberger triangle.As expected, the simulated economic consequences of regulations are much larger.The calculated misallocation of economic resources due to occupational licensing ismore than $170 billion. We consider the estimate of the misallocation of economicresources to be more accurate assessment of the effect that licensing regulations haveon the U.S. economy.
11 This approachwasdeveloped andpopularized by economistArnoldHarberger (Harberger 1954). Further,using the discussion in Schmidt (2012) we show estimates of both deadweight loss and the misallocationeffects.
123

Analyzing occupational licensing among the states
References
Chamberlain, G. (1994). Quantile regression, censoring, and the structure of wages. In C. A. Sims (Ed.),Advances in econometrics: Sixth world congress (Vol. 1, pp. 171–210). Cambridge: Cambridge Uni-versity Press.
Freeman, R. B. (1982). Union wage practices and wage dispersion within establishments. Industrial andLabor Relations Review, 36(1), 3–21.
Friedman, M. (1962). Capitalism and freedom. Chicago: University of Chicago Press.Friedman, M., & Kuznets, S. (1945). Income from independent professional practice. New York: National
Bureau of Economic Research.Gittleman, M., & Kleiner, M. M. (2016). Wage effects of unionization and occupational licensing coverage
in the United States. Industrial and Labor Relations Review, 69(1), 142–172.Gittleman, M., Klee, M. A., &Kleiner, M.M. (2017). Analyzing the labor market outcomes of occupational
licensing. Industrial Relations(forthcoming).Greene, K. (1969). Occupational licensing and the supply of nonprofessional manpower. Manpower
Research Monograph No. 11. Washington D.C: Manpower Administration (DOL).Hammermesh, D. (1993). Labor demand. Princeton, NJ: Princeton University Press.Harberger, A. C. (1954). Monopoly and resource allocation. American Economic Review Papers and Pro-
ceedings, 44(2), 77–87.Kleiner, M. M. (2000). Occupational licensing. Journal of Economic Perspectives, 14(4), 189–202.Kleiner, M. M. (2006). Licensing occupations: Ensuring quality or restricting competition?. Kalamazoo,
MI: W. E. Upjohn Institute for Employment Research.Kleiner, M. M. (2011). Occupational licensing: Protecting the public interest or protectionism? Policy
Paper No. 2011-009. Kalamazoo, MI: W.E. Upjohn Institute for Employment Research. http://dx.doi.org/10.17848/pol2015-009
Kleiner, M. M., & Krueger, A. (2013). Analyzing the extent and influence of occupational licensing on thelabor market. Journal of Labor Economics, 31(2), S173–S202.
Kleiner, M. M., & Krueger, A. B. (2010). The prevalence and effects of occupational licensing. BritishJournal of Industrial Relations, 48(4), 676–687.
Kleiner, M. M., Marier, A., Won, K. W., &Wing, C. (2016). Relaxing occupational licensing requirements:Analyzing wages and prices for a medical service. Journal of Law and Economics, 59, 261–291.
Neal, D. A., & Johnson, W. R. (1996). The role of premarket factors in black–white wage differences.Journal of Political Economy, 104(5), 869–895.
Oyana, T., &Margai, F. (2015). Spatial analysis: Statistics, visualization, and computational methods. BocaRaton: CRC Press.
Schmidt, J. A., Jr. (2012). New and larger costs of monopoly and tariffs. Economic Policy Paper 12-5.Federal Reserve Bank of Minneapolis.
Shapiro, C. (1986). Investment, moral hazard and occupational licensing. Review of Economic Studies,53(5), 843–862.
Smith, A. (1937). The wealth of nations. Modern library edition. New York: Random House. (Orig. pub.1776.).
Smith, A. (1776). The wealth of nations. University of Chicago Press. Facsimile of 1904 edition (February15, 1977).
Spence, M. (1973). Job market signaling. Quarterly Journal of Economics, 87(3), 355–374.U.S. Bureau of Labor Statistics. (2016). Data on certificates and licensing. http://www.bls.gov/cps/
certifications-and-licenses.htm#highlights.U.S. Department of the Treasury Office of Economic Policy, Council of Economic Advisers, and the
Department of Labor. (2015). Occupational licensing: A framework for policymakers. The WhiteHouse. https://www.whitehouse.gov/sites/default/files/docs/licensing_report_final_nonembargo.pdf.
123