ANALYTICAL REPORT NOVEMBER 2015 - Financial ... AND OBJECTIVES In February 2015, the Financial...
72
PAYMENT PROTECTION INSURANCE RESEARCH ANALYTICAL REPORT NOVEMBER 2015
Transcript of ANALYTICAL REPORT NOVEMBER 2015 - Financial ... AND OBJECTIVES In February 2015, the Financial...

PAYMENT PROTECTION INSURANCE RESEARCH
ANALYTICAL REPORT
NOVEMBER 2015

ABOUT COMRESComRes provides specialist research and insight into reputation, public policy and communications. It is
a founding member of the British Polling Council, and its staff are members of the UK Market Research
Society, committing it to the highest standards of research practice.
ComRes won the 2014 Market Research Society Award for Public Policy / Social Research for its
innovative research into online communications.
The consultancy also conducts regular public research for organisations including The Independent, ITV
News, the BBC, and other media outlets, as well as a wide range of public sector and corporate clients.
ComRes is a member of the British Polling Council and abides by its rules.
For further information about ComRes, this research or any other research requirements please contact
BACKGROUND AND OBJECTIVESIn February 2015, the Financial Conduct Authority (FCA) commissioned ComRes to conduct a large-scale
quantitative study into Payment Protection Insurance (PPI) from a consumer perspective, and more
specifically the trends in PPI complaints. In July 2015, the FCA decided to expand the scope of the
project and commissioned ComRes to double the interview sample, and explore consumers’ attitudes
towards the PPI-related Plevin case.
The key objectives of the study were:
To understand the market in terms of PPI holders, PPI complainants and potentially eligible
future PPI complainants;
To explore understanding and perceptions of PPI and the complaints process;
To discover prompts, barriers and motivations to making a PPI complaint;
To assess intended future behaviour regarding complaining about PPI;
To analyse the potential impact of the Plevin vs. Paragon Personal Finance case on complaining
behaviour regarding PPI;
To understand the appetite for insurance to cover repayments on borrowings in the wake of PPI.
This quantitative survey forms part of a wider programme aimed at assessing whether the current FCA
approach to PPI redress is continuing to meet the objectives of securing appropriate protection for
consumers and enhancing the integrity of the UK’s financial system.
The views expressed in this report are those of the authors and not necessarily those of the FCA, nor do
they reflect FCA policy or constitute guidance to firms.

Page 4
TABLE OF CONTENTS
Contents
PAYMENT PROTECTION INSURANCE RESEARCH ........................................ 1
ABOUT COMRES ..................................................................................... 2
BACKGROUND AND OBJECTIVES.............................................................. 3
METHODOLOGY ..................................................................................... 8
REPORTING CONVENTIONS ................................................................... 10
EXECUTIVE SUMMARY........................................................................... 11
1. KNOWLEDGE OF PPI AND RELATED ISSUES ......................................... 14
1.1 KNOWLEDGE AND UNDERSTANDING OF PPI ..................................... 15
1.2 AWARENESS OF ISSUES WITH PPI...................................................... 17
2. PERSONAL EXPERIENCE OF PPI ........................................................... 19
2.1 PERSONAL EXPOSURE TO PPI ........................................................... 20
2.2 CHECKING ABOUT PPI ..................................................................... 22
2.3 CLAIMING ON A PPI POLICY............................................................. 26
2.4 CONCERNS WITH PPI....................................................................... 28
3. COMPLAINING ABOUT PPI ................................................................. 30
3.1 COMPLAINTS ALREADY MADE ......................................................... 31
3.2 TIMING OF COMPLAINTS................................................................. 32
3.3 TRIGGERS FOR COMPLAINTS ........................................................... 34
3.4 CHANNELS FOR COMPLAINTS.......................................................... 35
3.5 EXPERIENCE OF COMPLAINTS PROCESS ............................................ 37
3.6 COMPLAINT RESOLUTION ............................................................... 38
4. COMPENSATION............................................................................... 39
4.1 EXPERIENCE OF COMPENSATION ..................................................... 40
4.2 PAST USE OF COMPENSATION ......................................................... 41
4.3 LIKELY USE OF POTENTIAL FUTURE COMPENSATION......................... 42
5. POTENTIAL FUTURE COMPLAINTS – DEFINITE PPI HOLDERS................. 43

Page 5
5.1 INTENTION OF COMPLAINING ......................................................... 44
5.2 BARRIERS TO COMPLAINING – PEOPLE NOT INTENDING TO COMPLAIN
........................................................................................................... 45
5.3 BARRIERS TO COMPLAINING – PEOPLE WHO INTEND TO COMPLAIN... 47
5.4 PROMPTS FOR COMPLAINTS............................................................ 48
5.5 TIMEFRAME OF INTENDED COMPLAINTS .......................................... 50
5.6 LIKELY CHANNELS FOR COMPLAINTS ............................................... 51
6. POTENTIAL FUTURE COMPLAINTS – POSSIBLE PPI HOLDERS................. 52
6.1 TIMEFRAME OF POTENTIAL COMPLAINTS ......................................... 53
6.2 CHANNELS FOR POTENTIAL COMPLAINTS ........................................ 54
7. THE IMPACT OF PLEVIN VS. PARAGON PERSONAL FINANCE................. 55
7.1 INTRODUCING THE CASE ................................................................ 56
7.2 PEOPLE ALREADY INTENDING TO COMPLAIN.................................... 58
7.3 PEOPLE NOT INTENDING TO COMPLAIN OR NOT KNOWING IF THEY
INTEND TO COMPLAIN ......................................................................... 59
7.3 REASONS FOR NOT INTENDING TO COMPLAIN AFTER HEARING NEW
INFORMATION ..................................................................................... 63
8. APPETITE FOR REPAYMENT INSURANCE AFTER PPI .............................. 64
8.1 REPAYMENT INSURANCE NOW THAT PPI IS NO LONGER BEING SOLD . 65
8.2 CONSIDERATION OF REPAYMENT INSURANCE .................................. 67
8.3 BARRIERS TO PURCHASE OF INSURANCE COVER ............................... 69
FURTHER INFORMATION....................................................................... 71

Page 6
TABLE OF FIGURESFigure 1: Multi-phase project ..................................................................................... 8
Figure 2: Key subgroups............................................................................................. 8
Figure 3: Knowledge of PPI ....................................................................................... 15
Figure 4: Understanding of PPI.................................................................................. 16
Figure 5: Becoming aware of issues with PPI.............................................................. 17
Figure 6: Sources of knowledge of issues with PPI ..................................................... 18
Figure 7: Use of PPI and other products .................................................................... 20
Figure 8: Association of PPI with specific credit products........................................... 21
Figure 9: Sources of knowledge about PPI ................................................................. 22
Figure 10: Reasons for not checking to date ............................................................. 23
Figure 11: Reasons for checking about PPI ................................................................ 24
Figure 12: Timeframe for checking ........................................................................... 24
Figure 13: Claiming on PPI........................................................................................ 26
Figure 14: Views of PPI (1/2)..................................................................................... 28
Figure 15: Views of PPI (2/2)..................................................................................... 29
Figure 16: Complaining about PPI ............................................................................. 31
Figure 17: Acquiring PPI ........................................................................................... 32
Figure 18: Awareness vs. complaining ...................................................................... 33
Figure 19: Triggers for complaining.......................................................................... 34
Figure 20: Methods of raising complaints on PPI ....................................................... 35
Figure 21: Complaint resolution................................................................................ 38
Figure 22: Compensation received ............................................................................ 40
Figure 23: Past use of compensation......................................................................... 41
Figure 24: Likely use of potential future compensation ............................................. 42
Figure 25: Reasons for not complaining .................................................................... 45
Figure 26: Barriers to complaining ............................................................................ 47
Figure 27: Reported effectiveness of prompts to complain ........................................ 49
Figure 28: Timeframe of intended complaints ........................................................... 50
Figure 29: Expected channel of raising complaints .................................................... 51
Figure 30: Timeframe of hypothetical complaints...................................................... 53

Page 7
Figure 31: Expected channel of raising complaints on PPI.......................................... 54
Figure 32: Impact of Plevin – summary...................................................................... 57
Figure 33: Impact of Plevin - intention to complain (1/2) .......................................... 58
Figure 34: Impact of Plevin - intention to complain (2/2) .......................................... 60
Figure 35: Impact of Plevin - timeframe of hypothetical complaints........................... 61
Figure 36: Impact of Plevin - expected channels of raising complaints on PPI ............ 62
Figure 37: Impact of Plevin - barriers to complaining ................................................ 63
Figure 38: Repayment situations if unable to work .................................................... 65
Figure 39: Consideration of repayment insurance ..................................................... 67
Figure 40: Insurance products purchased.................................................................. 68
Figure 41: Reasons for not purchasing other insurance ............................................. 70

Page 8
METHODOLOGYComRes conducted this research through a multi-phase online study of 20,001 UK adults aged 18 and
over, as described in Figure 1.
Figure 1: Multi-phase project
PART I PART II
The fieldwork was conducted in six distinct phases, with breaks between each to analyse the data and
assess potential areas for further exploration. Key subgroups from the research are shown in Figure 2.
Figure 2: Key subgroups
Phase 1
pilot
Survey of
1,000
adults
6-9/3/15
Phase 1
Survey of
3,000
adults
12-22/3/15
Phase 2
Survey of
4,000
adults
15-24/4/15
Phase 3
Survey of
2,000
adults
1-12/5/15
Phase 4
pilot
Survey of
1,015
adults
13-17/8/15
Phase 4
Survey of
8,986
adults
24/8-
7/9/15

Page 9
A complete methodology can be found in the separate technical report on this study, which includes
detailed information regarding questionnaire design, weighting, and statistical reliability. The final
questionnaires used in each phase of the research are also included in the technical report.

Page 10
REPORTING CONVENTIONSWEIGHTING
Throughout this report, all of the figures that are reported are of weighted results. For this study,
sample data were weighted to the profile of all UK adults aged 18+. Data were weighted by gender, age,
socio-economic grade and region. Further information on the weighting applied during this study is
provided in the separate Technical Report.
SUBGROUP ANALYSIS
Differences between subgroups are only reported where they are statistically significant at the 95% level.
NETS
Throughout this report, we make use of nets to aggregate certain sets of figures – our conventions for
doing so are outlined below:
Where the report refers to “x% agree with”, this is a NET measure of those who ‘strongly agree’ or
‘tend to agree’ [the same logic applies to “disagree”].
Where it refers to “x% find y easy”, this is a NET measure of those who answer ‘very easy’ or
‘fairly easy’ [the same logic applies to “difficult”].
Where it refers to “x% are likely to”, this is a NET measure of those who answer ‘very likely or
‘fairly likely’ [the same logic applies to “unlikely”].
o Alternatively, “most likely” with reference to timeframes may refer to those who select 8-
10 on a scale of 0-10, where 0 = ‘not likely at all’ and 10 = ‘certain’.
Where it refers to “x% were satisfied”, this is a NET measure of those who answer ‘very satisfied
or ‘fairly satisfied [the same logic applies to “dissatisfied”].
BASES
A table of all bases is available in the separate Technical Report.
Page 11
EXECUTIVE SUMMARY
Understanding and perceptions of PPI
Three quarters of the adult population aged 18 and over (74%) have heard of PPI. Of those who have
heard of PPI, most (77%) are aware of issues and or problems with the product.
Understanding is not as widespread, however – only two in five of those who have heard of PPI (42%) say
that they have a good understanding of the product. A similar proportion of those who have heard of PPI
(46%) say that they have some understanding of it, with just one in eight (12%) saying that they have no
understanding of what PPI is.
PPI holders
More than a fifth of adults (22%) have or have had PPI, although only one third of those who know that
they have or have had PPI (36%) say that they have known this all along.
One in nine adults (11%) are unsure if they have had PPI – broken down into 8% of the population who
are not 100% sure if they have had PPI and 3% who really don’t know.
Among those who are unsure if they have had PPI, around half (49%) say that they are unlikely to check
whether they have had it. Fewer than two in five (37%) say that they are likely to check, with the prospect
of compensation being the main driver for checking – mentioned by one in two of those who intend to
check say that compensation is the key motivating factor in doing so.
PPI complainants and perceptions of the complaints process
Approximately half of those who have or have had PPI (47%) have made a complaint about their policy,
or in the case of those with multiple policies, about at least one of their PPI policies. In contrast, 50%
have not made a complaint about any of their policies. A further 4% say that they do not know whether
they have complained.
Two thirds of complainants (64%) have made a complaint directly via the provider of the PPI product,
while three in ten (31%) have made a complaint via a Claims Management Company (CMC). The process
of making a complaint is generally considered easy by those who have been through it – three in five of
these complainants (59%) say that the process was easy. Nine in ten complainants whose complaint was
resolved (91%) have received compensation, and the vast majority of those who have received
compensation (85%) report being satisfied with the amount of compensation received.
Prompts, barriers and motivations to making a complaint
Nearly half of those who have, have had or may have had PPI (46%) express concerns about the way that
PPI was sold to them. Similarly, 44% refer to concerns about the cost of PPI.
Among those people who have complained about at least one PPI policy, the triggers for complaining
were media news stories explaining how to complain (cited as the trigger for 27% of complaints), letters
from the provider explaining how to complain (20%), media advertisements explaining how to complain
(19%) and cold calls from CMCs explaining how to complain (18%).
Among those who do not intend to complain or complain again, the main reason for not complaining is
being happy and having no concerns about the policy that was sold to them (cited by 35% of those who
do not intend to complain in the future and still have at least one policy left to complain about). The
other commonly given reasons include thinking that the amount of compensation received would not be
worth the time and effort it would take to achieve it (cited by 15%) and not being sure whether they
should be concerned (11%).

Page 12
Among those who intend to complain in the future about at least one policy, the main reasons given for
not having complained already are not having the time or energy (cited by 40%), having needed to check
whether they have or have had PPI (30%) and not being sure how to complain (21%).
When asked about the prompts that could make them complain for the first time, again or sooner than
originally envisaged, two thirds of those people who have, have had or may have had PPI (64%) say that a
letter from their provider explaining how to complain would make them more likely to complain.
Similarly, more than half (54%) say that communications from the government explaining how to
complain would make them more likely to complain. Only one in five (20%) say that a cold call from a
CMC would make them more likely to complain.
Future complaints
Among those who have or have had PPI, only one in eight (12%) intend to complain in the future,
whether for the first time or having already complained about a different policy. Around three quarters
(72%) do not intend to complain in the future, while 16% do not know if they will complain. More than
two in five of those intending to complain (44%) are most likely to do so in the next six months.
For those who are not 100% sure whether they have PPI or “really don’t know”, we introduceda
hypothetical scenario where we suggested that these people discovered that they definitely have or have
had a PPI policy. In this scenario, one quarter of people uncertain whether they have PPI (26%) are most
likely to complain within the next six months.
The impact of Plevin vs. Paragon Personal Finance
We gave those people who have or have had a PPI policy information about the recent Plevin vs. Paragon
Personal Finance case and its potential implications for them. The effect of this information is outlined
below:
For those who were already intending to complain about a PPI policy, two in five (41%) say that
they now intend to complain sooner than they did before, citing increased awareness (28%of
those now intending to complain sooner) and expectation of compensation (11%) as the key
reasons for their changed position. Around half (47%) say that they still intend to complain at the
same time as they did previously, and 13% say that they now intend to complain later than
before.
For those who were not intending to complain, only 13% say that they now intend to complain
about one of their PPI policies. The majority – three in five (59%) – say that they still do not intend
to complain.
For those who previously did not know whether they intended to complain, three in ten (31%)
change their mind and say that they now intend to complain. Three in five (57%) say that they
still do not know whether they intend to complain.
Information about Plevin therefore does have a noticeable impact on likelihood to complain – around
one in five of those previously either not intending to complain or not knowing whether they intended to
complain (17%) now intend to complain after hearing information about Plevin.
Appetite for repayment insurance after PPI
To explore the consumer appetite for repayment insurance after PPI, we introduced a hypothetical
scenario where those in work with at least one of three credit products were asked to think about what

Page 13
would happen if they became unable to work for longer than a month due to accident, sickness or
unemployment. One in five (19%) say that, in this scenario, they would probably not be able to pay some
or all of their repayments. Only one in ten (10%) say that they have insurance to cover all of their
repayments.
Among those working people with credit products who do not have insurance to cover all of their
repayments, a quarter (26%) say that they have considered taking out insurance that protects their
repayments or short-term income but have decided against it. The main reasons for this are cost and a
lack of trust - a quarter of people who have not purchased insurance cover for any of their borrowings
(23%) say that they decided not to buy these products because they were too expensive, with a further
one in five (21%) saying that they do not trust the providers.
Key demographic subgroups
Less financially sophisticated individuals are a key audience in the context of PPI: they are much less
likely than the more financially sophisticated to report having a good understanding of PPI (22% vs. 52%)
and to have known all along that they have held PPI (32% vs. 39%), while being much more likely to be
unaware of what their PPI policy entitles them to (60% vs. 43%).
Lower social grades are important in terms of the prompt for and channel of their complaints – those in
social grades DE and C2 are more likely than those in social grades AB and C1 to say that they were
prompted to complain by a cold call from a Claims Management Company (23% of DE and 20% of C2 vs.
15% of AB and C1) and to have complained through a CMC (37% of DE and 35% of C2 vs. 26% of AB and
28% of C1).
1. KNOWLEDGE OF PPI ANDRELATED ISSUES
Page 15
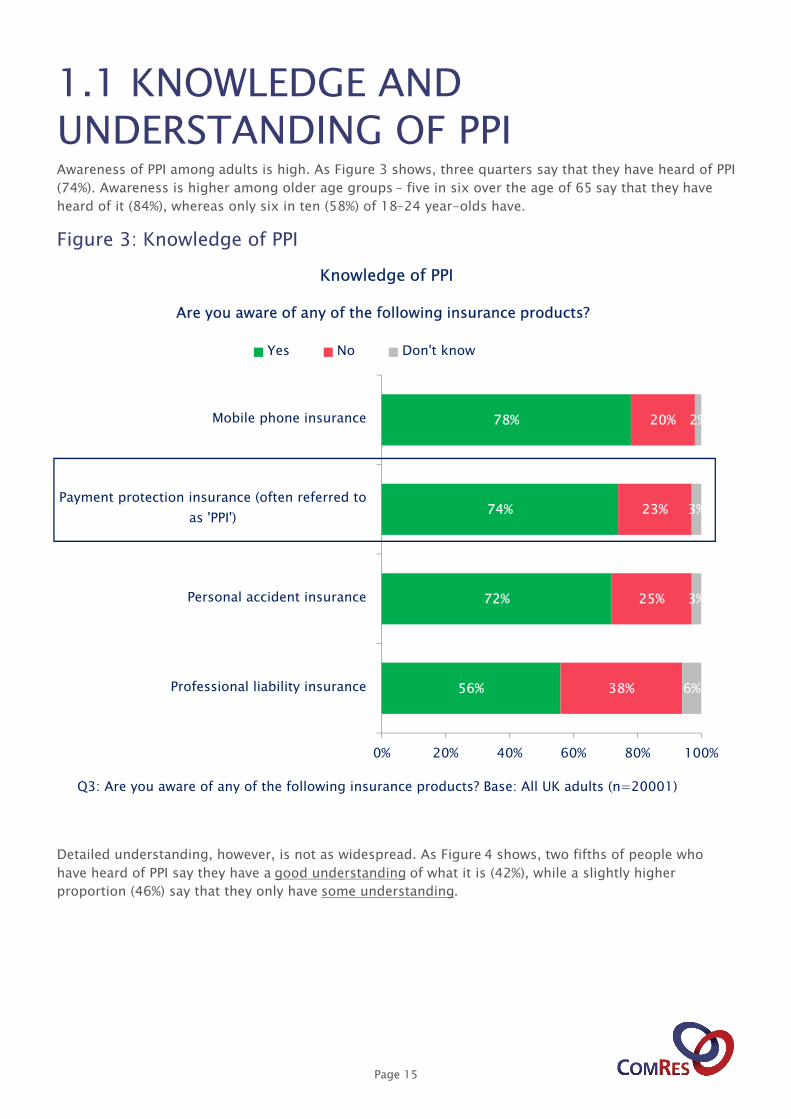
1.1 KNOWLEDGE AND UNDERSTANDING OF PPIAwareness of PPI among adults is high. As Figure 3 shows, three quarters say that they have heard of PPI
(74%). Awareness is higher among older age groups – five in six over the age of 65 say that they have
heard of it (84%), whereas only six in ten (58%) of 18-24 year-olds have.
Figure 3: Knowledge of PPI
Detailed understanding, however, is not as widespread. As Figure 4 shows, two fifths of people who
have heard of PPI say they have a good understanding of what it is (42%), while a slightly higher
proportion (46%) say that they only have some understanding.
56%
72%
74%
78%
38%
25%
23%
20%
6%
3%
3%
2%
0% 20% 40% 60% 80% 100%
Professional liability insurance
Personal accident insurance
Payment protection insurance (often referred to
as 'PPI')
Mobile phone insurance
Knowledge of PPI
Yes No Don't know
Are you aware of any of the following insurance products?
Q3: Are you aware of any of the following insurance products? Base: All UK adults (n=20001)

Page 16
Figure 4: Understanding of PPI
Consistent with the findings relating to awareness of PPI, of those aware of PPI, understanding is higher
among older age groups. Almost half of those aged 65+ (47%) and half of those aged 55-64 (50%) say
that they have a good understanding of PPI, compared to one in five 18–24 year olds (21%).
Reported understanding is particularly high among those with a high combined annual household
income. More than half of those in households earning more than £60,000 per year (55%) have a good
understanding of PPI, compared to just over a third of those in households earning less than £20,000
(36%).
The more financially sophisticated also tend to say that they have a good understanding of PPI, with half
(52%) of them saying so, compared to only one in five of those who are less financially sophisticated
(22%).1
1 More financially sophisticated and less financially sophisticated individuals were categorised using a financial
sophistication indication question. Further information on how this was derived can be found in the separate technical
report on this study, in Appendix C.
42% 46% 12%
0% 20% 40% 60% 80% 100%
Understanding of PPI
I have a good understanding of what PPI is
I have some understanding of what PPI is
I have heard of PPI but do not know what it really is
Q4: Which of the statements below best describes your understanding of payment protection
insurance (PPI)? Base: All who are aware of PPI (n=14932)
Page 17
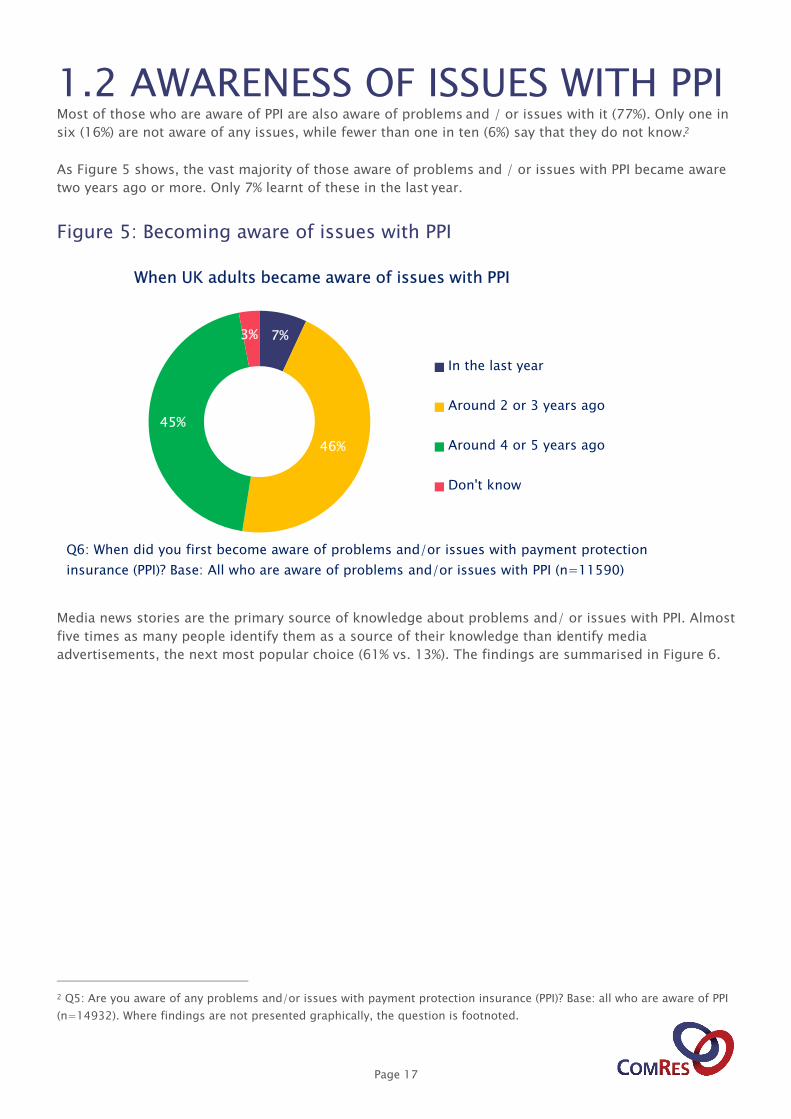
1.2 AWARENESS OF ISSUES WITH PPIMost of those who are aware of PPI are also aware of problems and / or issues with it (77%). Only one in
six (16%) are not aware of any issues, while fewer than one in ten (6%) say that they do not know.2
As Figure 5 shows, the vast majority of those aware of problems and / or issues with PPI became aware
two years ago or more. Only 7% learnt of these in the last year.
Figure 5: Becoming aware of issues with PPI
Media news stories are the primary source of knowledge about problems and/ or issues with PPI. Almost
five times as many people identify them as a source of their knowledge than identify media
advertisements, the next most popular choice (61% vs. 13%). The findings are summarised in Figure 6.
2 Q5: Are you aware of any problems and/or issues with payment protection insurance (PPI)? Base: all who are aware of PPI
(n=14932). Where findings are not presented graphically, the question is footnoted.
7%
46%
45%
3%
When UK adults became aware of issues with PPI
In the last year
Around 2 or 3 years ago
Around 4 or 5 years ago
Don't know
Q6: When did you first become aware of problems and/or issues with payment protection
insurance (PPI)? Base: All who are aware of problems and/or issues with PPI (n=11590)

Page 18
Figure 6: Sources of knowledge of issues with PPI
Q7: How did you first become aware of problems and/or issues with payment protection insurance (PPI)? Base: All who are aware of problems and/or issues with PPI (n=11590)

2. PERSONAL EXPERIENCE OF PPI

Page 20
2.1 PERSONAL EXPOSURE TO PPIAs Figure 7 shows, more than one in five UK adults say that they have had payment protection insurance
(22%).3 This is more than the proportion with personal accident (20%) or professional liability insurance
(14%), but less than the proportion who have had mobile phone insurance (32%).
Figure 7: Use of PPI and other products
The mean number of PPI policies that people with PPI had or have is 2, and almost half of people with
PPI (47%) have or have had more than one policy.4
Exposure to PPI is higher among middle-aged groups. Two thirds (28%) of 35-54 year olds say they had
or have had PPI, compared to 20% of 65+ year olds, for example.
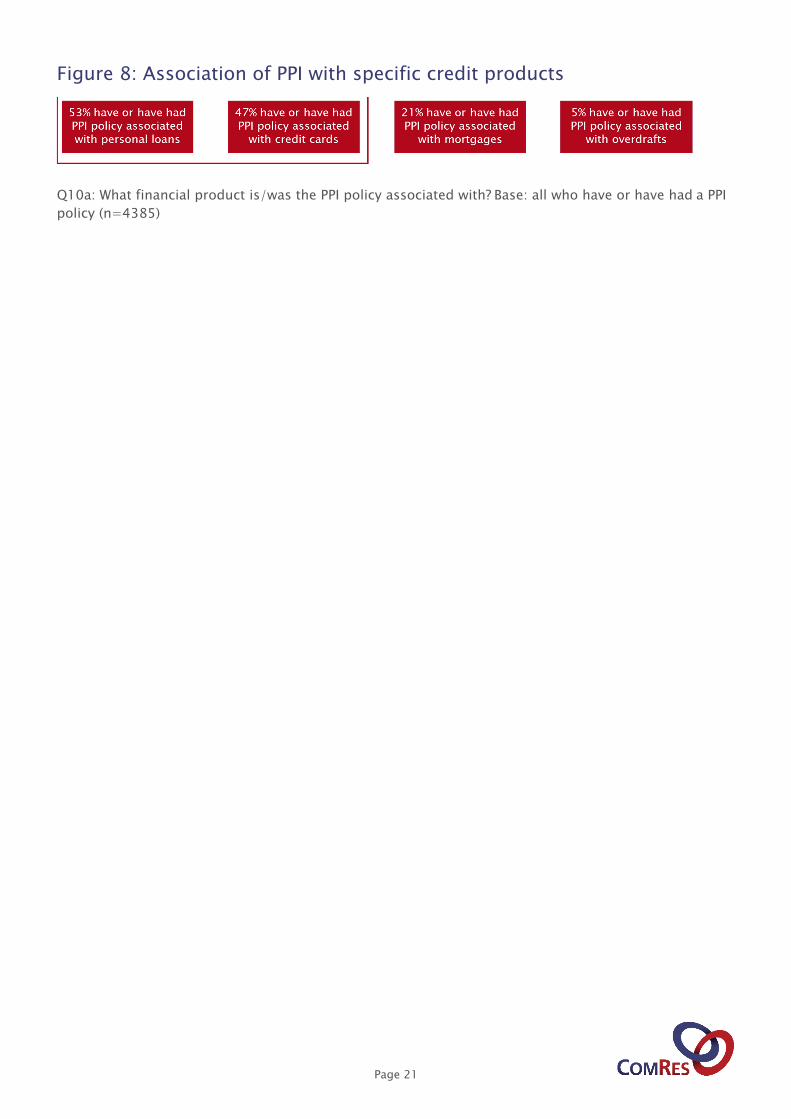
As shown in Figure 8, around half of all people who have or have had PPI (53%) held a policy associated
with a personal loan. A similar proportion (47%) hold or have held a policy associated with a credit card.
One in five PPI holders (21%) have or have had PPI for a mortgage and 5% for an overdraft.
One in seven people who have or have had PPI have held a policy where they do not know what credit
product this is associated with (15%).
3 In this section we are reporting policies that respondents are aware of having now or in the past based on recall. It is
possible that respondents have or have had additional policies they do not remember or were never aware of.
4 Q10: How many Payment Protection Insurance (PPI) policies have you had? Base: all who have or have had PPI (n=4385)
Q9: Have you ever had any of the following financial products? Base: All UK adults (n=20001)
Page 21
Figure 8: Association of PPI with specific credit products
Q10a: What financial product is/was the PPI policy associated with? Base: all who have or have had a PPI
policy (n=4385)
Page 22
2.2 CHECKING ABOUT PPIPeople who know that they have or have had PPI
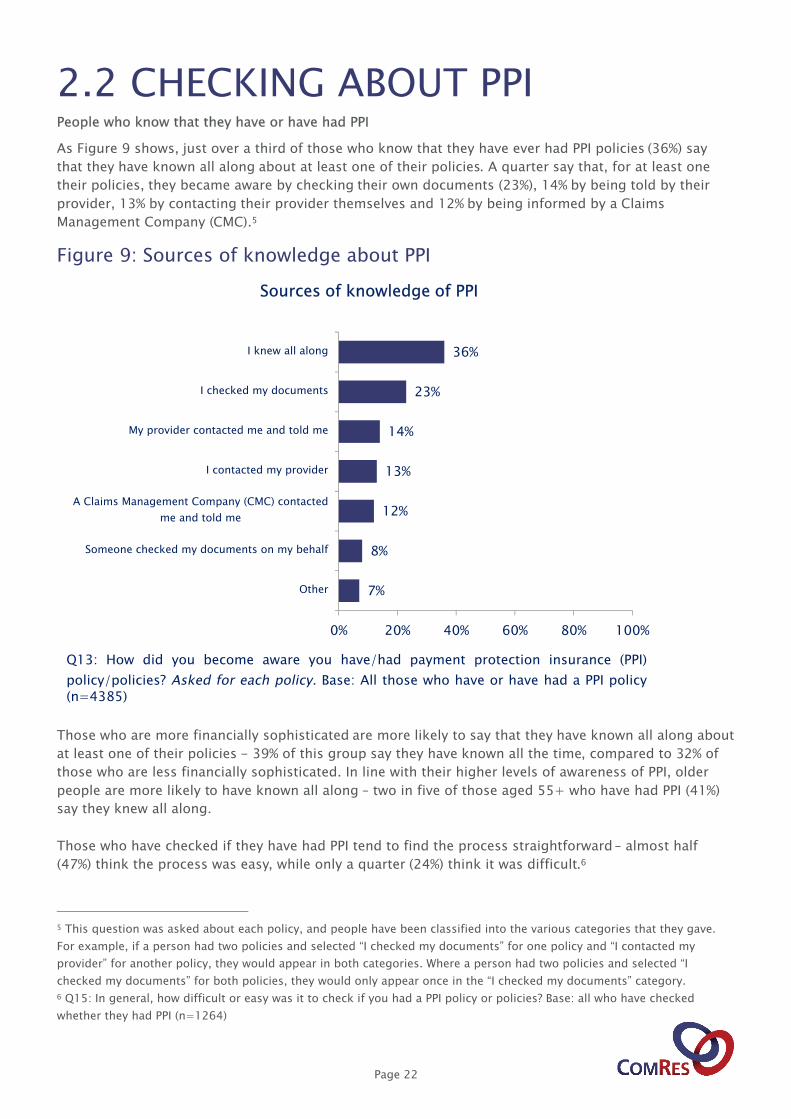
As Figure 9 shows, just over a third of those who know that they have ever had PPI policies (36%) say
that they have known all along about at least one of their policies. A quarter say that, for at least one
their policies, they became aware by checking their own documents (23%), 14% by being told by their
provider, 13% by contacting their provider themselves and 12% by being informed by a Claims
Management Company (CMC).5
Figure 9: Sources of knowledge about PPI
Those who are more financially sophisticated are more likely to say that they have known all along about
at least one of their policies - 39% of this group say they have known all the time, compared to 32% of
those who are less financially sophisticated. In line with their higher levels of awareness of PPI, older
people are more likely to have known all along – two in five of those aged 55+ who have had PPI (41%)
say they knew all along.
Those who have checked if they have had PPI tend to find the process straightforward – almost half
(47%) think the process was easy, while only a quarter (24%) think it was difficult.6
5 This question was asked about each policy, and people have been classified into the various categories that they gave.
For example, if a person had two policies and selected “I checked my documents” for one policy and “I contacted my
provider” for another policy, they would appear in both categories. Where a person had two policies and selected “I
checked my documents” for both policies, they would only appear once in the “I checked my documents” category.
6 Q15: In general, how difficult or easy was it to check if you had a PPI policy or policies? Base: all who have checked
whether they had PPI (n=1264)
7%
8%
12%
13%
14%
23%
36%
0% 20% 40% 60% 80% 100%
Other
Someone checked my documents on my behalf
A Claims Management Company (CMC) contacted
me and told me
I contacted my provider
My provider contacted me and told me
I checked my documents
I knew all along
Sources of knowledge of PPI
Q13: How did you become aware you have/had payment protection insurance (PPI)
policy/policies? Asked for each policy. Base: All those who have or have had a PPI policy (n=4385)

Page 23
People who are unsure whether they have or have had PPI
One in ten adults (11%) are unsure if they have ever had PPI – this is broken down into 8% who say that
they are not 100% sure and 3% who say that they really don’t know (see Figure 7).
As Figure 10 shows, a third (35%) of those who are unsure whether they have ever had PPI say the reason
that they have not checked so far is that they are not sure whether it would be worth it, and three in ten
say that they do not know how to check (29%) or that they can’t locate their documents (28%).
Figure 10: Reasons for not checking to date
Among those who are unsure whether they have ever had PPI, almost two in five (37%) say they are likely
to check whether they have ever had PPI. However, half of this audience (49%) say they are unlikely to
check.7 Among those likely to check, the prospect of compensation is indicated as the primary driver for
checking, as Figure 11 shows; concerns about the (possible) policy also play a major role.
7 Q16: How likely, if at all, would you say that you are to check whether you have ever had a payment protection insurance
(PPI) policy? Base: all who are not 100% sure or really don’t know whether they have had PPI (n=2117)
12%
15%
15%
28%
29%
35%
0% 20% 40% 60% 80% 100%
Other
Haven't had time
I can't be bothered to check
Can't locate documents
I don't know how to check
I am not sure that it would be worth it
Reasons for not checking to date
Q20: What would you say is the reason that you have not checked so far whether or not you
have ever had a payment protection insurance (PPI) policy? Multiple answers possible Base: All
who are not 100% sure or really don’t know whether they have or have had a PPI policy
(n=2117)

Page 24
Figure 11: Reasons for checking about PPI
As Figure 12 shows, those who say they are likely to check whether they have ever had PPI are more
likely to check either in the very near future or in the very distant future. More than a third (38%) are
most likely to check in the next six months, whereas a similar proportion (36%) are most likely to check
in more than three years. Given the time gap involved, this set of figures may give a better indication of
overall propensity to check than the timing of checking - it appears relatively unlikely that those who
say that they are most likely to check in more than three years’ time will ever check whether they have
indeed held a PPI policy.
Figure 12: Timeframe for checking
We asked people to rate how likely they would be to check in each of a series of timeframes, on a 0-10 scale. We
then calculated the timeframe in which these people are most likely to check – allocating them to one of the time
slots based on the slot for which they select the highest score. Where people select the same score for two or more
time slots, we allocated people to the latest time slot (i.e. if a person selected 2 for “in 0-6 months”, 3 for “in 7-12
months”, 6 for “in 1-3 years” and 6 for “in more than three years”, they would be allocated to “in more than three
years”).
3%
12%
24%
26%
29%
50%
0% 20% 40% 60% 80% 100%
Other
CMC advised me to
For own records
Better understand if I should be concerned
Concerned about whether my PPI was mis-sold to me
Might be eligible for compensation
Why check whether you have PPI?
Q17: Why do you plan to check whether you have ever had a PPI policy? Multiple answers
possible. Base: All who are unsure if they have or have had PPI and are likely to check if
they have had it (n=780)

Page 25
11%
36%
5%
10%
38%
0% 20% 40% 60% 80% 100%
Don't know
In more than…
In 1-3 years
In 7-12 months
In 0-6 months
Timeframe for checking
Showing time period in which people are most likely to check
Q19a: How likely, if at all, would you say that you are to check, within the following time
periods, whether you have ever had a payment protection insurance (PPI) policy? Please
indicate how likely on a scale of 0 to 10 where 0 = not likely at all and 10 = certain. Base: All
who are unsure if they have or have had PPI and are likely to check if they have had it (n=735)

Page 26
2.3 CLAIMING ON A PPI POLICYIn the context of this report, “claiming” refers to the act of claiming on a policy in the same way that a
policyholder might claim on any insurance policy – for example, a PPI holder might have claimed against
their policy if they were made redundant, to cover the repayments on their loan until they could find a
new job. In contrast, “complaining” will be used to refer to people complaining about their policy being
mis-sold to them.
Most people who have or have had a PPI policy have not made a claim on it/ them. As Figure 13 shows,
two in five (39%) say they have claimed on a policy, while three in five (58%) say they have not. People
who first became aware of issues with PPI in the last year are more likely than those who became aware
two years ago or more to have made a claim on their policy (65% of those who became aware within the
last year vs. 37% around 2 or 3 years ago and 39% around 4 or 5 years ago or more).
Those with a PPI attached to an overdraft are most likely to have made a claim on at least one of their
policies (although the policy that they complained about may not have been related to their overdraft),
with more than half (55%) saying so. This compares to slightly more than two in five of those with at
least one PPI attached to a mortgage (42%), a credit card (42%) or a personal loan (45%).
Those who became aware that they had a PPI policy after contacting their provider are most likely to
have made a claim, with three in five (60%) saying they did so – compared to only a third of those who
say they knew all along that they had a PPI policy (32%).
Figure 13: Claiming on PPI
Of those who have made a claim, a quarter (23%) say that their insurer has not paid out on their policy /
at least one of their policies. In contrast, three quarters (76%) say their insurer has paid out on their
39%
58%
3%
Have made a claim on their PPI(NB: This question is about a claim on the policy as opposed to complaining about how the
policy was mis-sold)
Yes
No
Don't know
Q11: Have you ever made a claim on any of your PPI policy/policies, because you became ill, had an accident or became unemployed and needed the policy to cover your loan or other debt repayments? Base: All who have or have had PPI (n=4385)

Page 27
policy / at least one of their policies. 7% indicate that at least one claim is ongoing. 3% say that they do
not know.8
As highlighted in Figure 14, one in six of those who have, have had or may have had PPI (16%) say that
they thought the PPI covered them, but when they claimed their claim was rejected.
8 Q12: As a result of your claim on any of your payment protection insurance (PPI) policy/policies, did the insurer pay out
on your claim and cover your repayments while you were ill or unemployed etc.? Base: All UK adults who have claimed on a
PPI policy (n=1679)

Page 28
2.4 CONCERNS WITH PPIConcerns about PPI are widespread among adults, as indicated by levels of agreement with a series of
statements that we tested relating to PPI.
As Figure 14 shows, nearly half of people who have, have had or may have had a PPI policy (46%) are
concerned about the way it was sold to them. Those who are more financially sophisticated (50%) are
more likely than those who are less financially sophisticated (45%) to agree that they are concerned
about the way the PPI was sold to them. Moreover, concerns are most prevalent for those who have or
have had a PPI policy associated with an overdraft (69%), although it is important to stress that these
concerns are not necessarily about any PPI policy/ies associated with an overdraft. Two thirds of people
who have or have had a PPI policy associated with a personal loan or a credit card (64% ) have these
concerns, as do half of those who have or have had a PPI associated with a mortgage (54%).
Similarly, more than two in five people who have, have had or may have had a PPI policy (44%) have
concerns about its cost. Those from a higher social grade are more likely than those from a lower social
grade to say that have concerns about the cost of PPI. For instance, half of those from social grade AB
(48%) are concerned, compared to two in five from social grade DE (41%). This difference is also found
with regard to levels of combined annual household income – for example, 55% of those with an annual
household income of £80,001 - £100,000 have concerns about the cost of PPI, compared to 42% of
those with an annual household income of less than £20,000.
Central to many concerns about PPI is a lack of understanding. As Figure 14 shows, one quarter (25%)
say that they were not aware until recently that they in fact have or have had PPI – this proportion rises
to half (50%) among those whose PPI is/was associated with an overdraft.
Figure 14: Views of PPI (1/2)
7%
9%
16%
21%
9%
16%
28%
25%
48%
34%
39%
37%
12%
17%
9%
9%
24%
24%
8%
9%
0% 20% 40% 60% 80% 100%
I thought the PPI covered me but when I
claimed it was rejected
I was not aware, until recently, that I had
a PPI policy
I have/had concerns about the cost of PPI
I have/had concerns about the way the
PPI policy was sold to me
Views of PPI
Strongly agree Tend to agree
Neither agree nor disagree Tend to disagree
Strongly disagree
Q22a: To what extent do you agree or disagree with the following statements? Base: All who have, have had or may have had a PPI policy (n=6502)

Page 29
As Figure 15 shows, more than two in five (44%) of those who have, have had or may have had PPI report
being unaware of what their policy entitles them to – a figure that rises to 60% among those less
financially sophisticated. Again, the proportion of those unaware of what their policy entitles them to is
particularly high among those whose PPI is/was associated with an overdraft (64%) but is lower among
those whose PPI is/was associated with a mortgage (40%).
Similarly, two in five (43%) say that they do not understand the terms and conditions of their policy. This
figure rises to three in five (60%) among those less financially sophisticated, and a similar proportion of
those whose PPI is/was associated with an overdraft (61%) but is lower among those whose PPI is/was
associated with a mortgage (42%).
As already highlighted in Section 2.3, one in six (16%) of those who have, have had or may have had PPI
say that they thought the PPI covered them, but their claim was rejected.
Among those who have, have had or may have had a policy, only a quarter (25%) have no concerns about
their PPI policy (see Figure 15). Those who are more financially sophisticated are also more likely not to
have concerns about their PPI policy, with a third (31%) saying so, compared to a quarter (24%) of those
less financially sophisticated. Two in five of those who have, have had or may have had a PPI policy (39%)
are neither concerned nor unconcerned – potentially suggesting a lack of knowledge.
Figure 15: Views of PPI (2/2)
9%
14%
14%
16%
30%
29%
39%
35%
36%
21%
13%
12%
14%
8%
8%
0% 20% 40% 60% 80% 100%
I have no concerns about the PPI policy
I do/did not know what the PPI policy
entitles me to
I do/did not understand the terms and
conditions associated with the PPI policy
Views of PPI
Strongly agree Tend to agree
Neither agree nor disagree Tend to disagree
Strongly disagree
Q22b: To what extent do you agree or disagree with the following statements? Base: All who have, have had or may have had a PPI policy (n=6502)

3. COMPLAINING ABOUT PPI

Page 31
3.1 COMPLAINTS ALREADY MADEApproximately half of PPI holders (47%) say that they have made a complaint about at least one of their
PPI policies, as Figure 16 shows. A similar proportion (50%) say that they have not made a complaint
about any of their PPI policies. 39% of PPI holders have complained about all of the policies that they can
recall.
Figure 16: Complaining about PPI
Complaints have been least common among those who knew all along that they held a PPI policy – just
one third of these people have complained about one or more policies (33%), compared to:
Almost three quarters of PPI holders who became aware that they had PPI through directly
contacting their provider (72%);
Almost two thirds of those who found out that they held PPI by checking their documents (63%);
Three in five of those who were informed that they had PPI by a CMC (59%).
47%
50%
4%
Have made a complaint about at least one PPI
Yes
No
Don't know
Q23a: Have you complained about the payment protection insurance (PPI) policy which you had? Base: All who have or have had a PPI policy (n=4385)

Page 32
3.2 TIMING OF COMPLAINTSFor many people there is a considerable time lag between when they acquired PPI and when they actually
became aware that they held a PPI policy.
We asked about each PPI policy that people held – as shown in Figure 17, two in five people who have or
have had PPI (39%) say that they acquired a PPI policy before 2000.
Figure 17: Acquiring PPI
We then asked PPI holders who had complained about at least one of their PPI policies about when they
became aware that they held each PPI policy and about the timing of each of their individual complaints
– as outlined in Figure 18.
One in six became aware that they held a PPI policy in 2014 (17%), one in five became aware in 2013
(19%), and one in seven (15%) in 2012.
Half of all complaints about PPI were made in 2013 or 2014 (50%). This is consistent with initial findings
that 46% of people aware of problems and/ or issues with PPI found out about them two or three years
ago (see Figure 5).
Indeed, the figures on the timing of complaints align relatively closely with when PPI holders first
became aware that they held a PPI policy (which was asked to a smaller subsection of PPI holders).9 Two
thirds of complaints (66%) were made in the same year as the holder became aware that they held a PPI
policy, and the average length of time between becoming aware of holding a PPI policy and complaining
about it is 1.13 years, across all complaints.
9 For phases 2, 3 and 4 of the research, we included an additional question (Q23b) for those who have complained about a
PPI policy, asking them about when they became aware that they held each policy. Further detail about this can be found in
the Questionnaire Design section in the technical report.
22%
39%
28%
28%
12%
0% 20% 40% 60% 80% 100%
Can't remember
Before 2000
2000-2004
2005-2010
Since 2010
Period when acquired PPI
Q10b: When did you get this financial product? Base: All UK adults who have or have had a PPI policy (n=4385)

Page 33
Figure 18: Awareness vs. complaining
30%
3%
5%
10%
9%
15%
19%
17%
6%
0% 20% 40% 60% 80% 100%
2007 or earlier
2008
2009
2010
2011
2012
2013
2014
2015
Year when became aware of
having PPI
Q23b: When did you become aware that
you held this policy? Base: All who have
complained about at least one PPI policy [Phases 2/3/4] (n=1651)
9%
8%
2%
4%
9%
10%
18%
25%
25%
9%
0% 20% 40% 60% 80% 100%
Don't know
2007 or earlier
2008
2009
2010
2011
2012
2013
2014
2015
Year when complaint made
Q24a: When did you complain about the
payment protection insurance (PPI) policy
which you had? Base: All who have
complained about at least one PPI policy[All phases] (n=2068)
Page 34
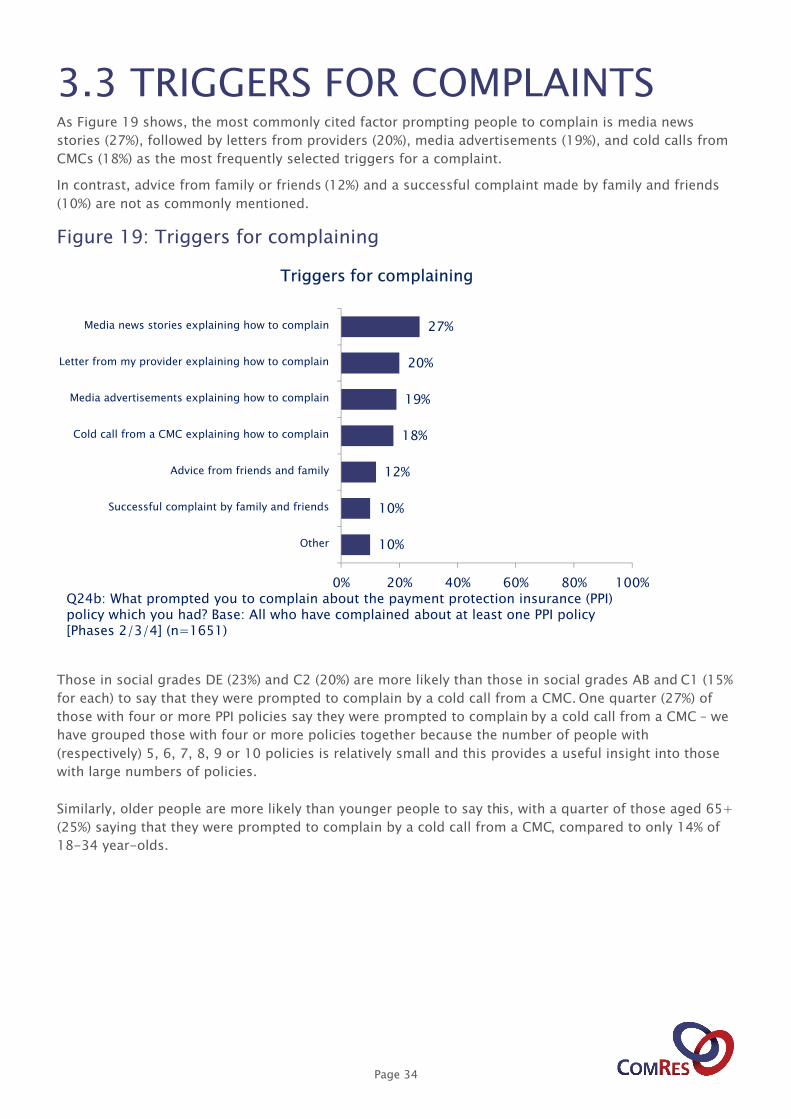
3.3 TRIGGERS FOR COMPLAINTSAs Figure 19 shows, the most commonly cited factor prompting people to complain is media news
stories (27%), followed by letters from providers (20%), media advertisements (19%), and cold calls from
CMCs (18%) as the most frequently selected triggers for a complaint.
In contrast, advice from family or friends (12%) and a successful complaint made by family and friends
(10%) are not as commonly mentioned.
Figure 19: Triggers for complaining
Those in social grades DE (23%) and C2 (20%) are more likely than those in social grades AB and C1 (15%
for each) to say that they were prompted to complain by a cold call from a CMC. One quarter (27%) of
those with four or more PPI policies say they were prompted to complain by a cold call from a CMC – we
have grouped those with four or more policies together because the number of people with
(respectively) 5, 6, 7, 8, 9 or 10 policies is relatively small and this provides a useful insight into those
with large numbers of policies.
Similarly, older people are more likely than younger people to say this, with a quarter of those aged 65+
(25%) saying that they were prompted to complain by a cold call from a CMC, compared to only 14% of
18-34 year-olds.
10%
10%
12%
18%
19%
20%
27%
0% 20% 40% 60% 80% 100%
Other
Successful complaint by family and friends
Advice from friends and family
Cold call from a CMC explaining how to complain
Media advertisements explaining how to complain
Letter from my provider explaining how to complain
Media news stories explaining how to complain
Triggers for complaining
Q24b: What prompted you to complain about the payment protection insurance (PPI) policy which you had? Base: All who have complained about at least one PPI policy [Phases 2/3/4] (n=1651)

Page 35
3.4 CHANNELS FOR COMPLAINTSAs Figure 20 illustrates, two thirds of individual complaints are made directly via the provider of the PPI
(64%) and one third are made via CMCs (31%).
PPI holders from lower social grades are more likely than all PPI holders to complain through a CMC -
37% of those in social grades DE say that they complained through a CMC, compared to 28% of those in
social grade C1 and 26% of those in social grade AB.
Only small minorities of complaints were made through a financial advisor (7%) or a lawyer (4%).
Figure 20: Methods of raising complaints on PPI
Perhaps linked to the perceived complexity of their financial circumstances, those with 4 or more
policies are more likely than average to have complained about at least one of their policies via a CMC –
44% of these people complained through this route, vs. 31% for all PPI complainants.
There is a high degree of ‘continuity’ between the trigger for complaining and the subsequent method
of complaining. Of those people who have been triggered into complaining by a cold call from a CMC,
84% went on to raise a complaint via a CMC. Of those who have been triggered into complaining by a
letter from their provider, 80% went on to raise a complaint via their provider.
4%
4%
7%
31%
64%
0% 20% 40% 60% 80% 100%
via a lawyer
Other
via a financial advisor
via a Claims Management Company
(CMC)
directly to the provider of the PPI
Methods of raising complaints on PPI
I complained…
Q25: How did you go about complaining about the payment protection insurance
(PPI) policy which you had Base: All who have complained about at least one PPIpolicy (n=2068)

Page 36
One quarter of those who complained referred their complaint to the Financial Ombudsman (25%).10
Younger people are significantly more likely than older people to have referred their most recent
complaint to the Financial Ombudsman, with almost half of 18-34 year-olds (45%) saying this,
compared to only one in seven of those aged 65+ (15%).
10 Q27: With regard to your most recent payment protection insurance (PPI) policy complaint, did you refer your complaint
to the Financial Ombudsman? Base: All who have complained about at least one PPI policy (n=2068)

Page 37
3.5 EXPERIENCE OF COMPLAINTS PROCESSThree in five PPI holders who have made a complaint (59%) say that they found the process of
complaining about their most recent PPI policy easy.11
A quarter (24%) report finding it very easy – while one in five (22%) report the process to be either
very or fairly difficult. The process of complaining seems to elicit fairly consistent responses
across multiple complaints, as three quarters of PPI holders who made more than one complaint
(73%) reportedly find previous experience(s) not to be different from their most recent
experience.12
Indeed, we asked PPI complainants about improvements to the complaints process – inquiring in the
form of an open-ended question about the one change that these people would make to the process if
given the opportunity. 13
Three in ten of those who had complained about PPI (28%) expressed their satisfaction with the
complaints process and said that no improvements could be made:
“It was very straightforward.”
Where those who had complained did suggest improvements, these were relatively diverse. The most
commonly given improvements tend to relate to making the complaints process faster (mentioned by
12% of PPI complainants):
“The process should be quicker and easier to claim for.”
A further 8% suggested that the process could be made easier, and 8% suggested that there should be
an automatic refund (rather than needing to go through the process of making a complaint):
“Providers should have a template for sending the complaint.”
7% suggested that there could be more information explaining how to complain, and 7% said that the
process could be improved by the removal of third party intermediaries such as CMCs:
“I would claim directly rather than through a CMC and save myself 25%.”
11 Q33a: With regard to your most recent payment protection insurance (PPI) policy, how difficult or easy did you find the
process of complaining about PPI? Base: All who have complained about at least one PPI policy (n=2068)
12 Q33b: Thinking about your other PPI complaints, did these experiences differ from your most recent PPI complaint? If
yes, please specify how the experience of your other complaints was different. Base: All who have complained about more
than one PPI policy [phase 4] (n=427)
13 Q34: If you could make one change to the process of complaining about your payment protection insurance (PPI) policy
what would it be? Base: All who have complained about at least one PPI policy (n=2068)
Page 38
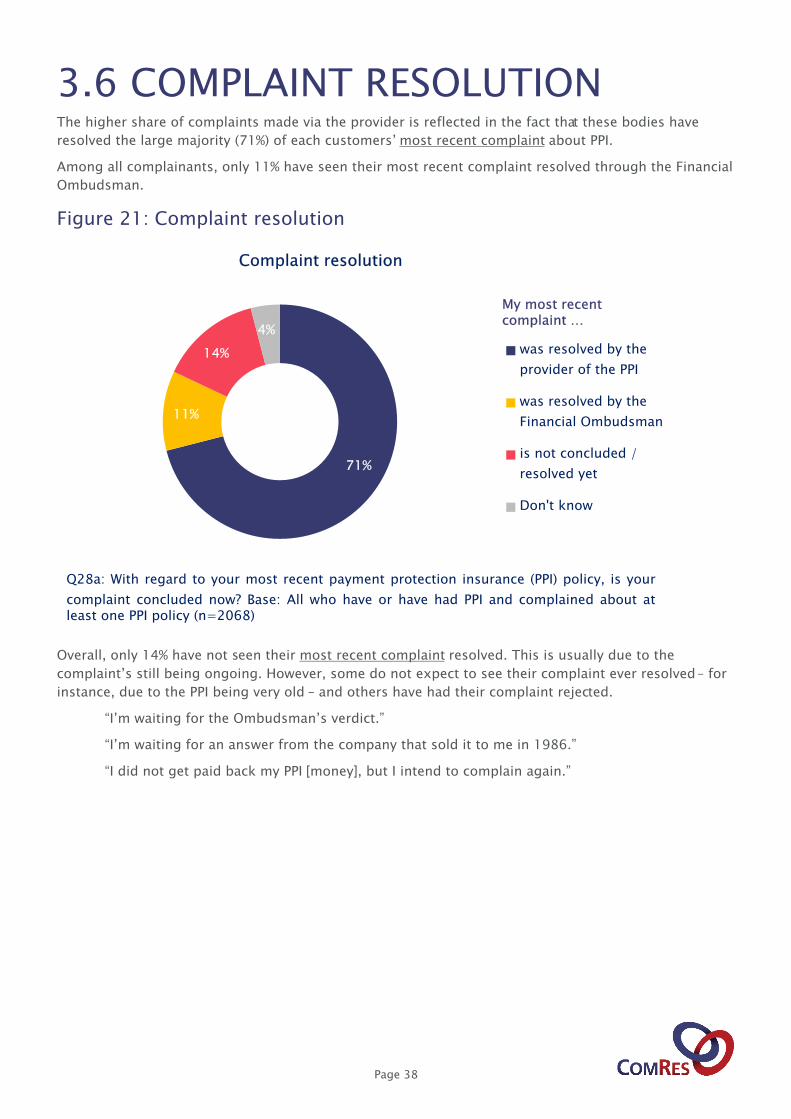
3.6 COMPLAINT RESOLUTIONThe higher share of complaints made via the provider is reflected in the fact that these bodies have
resolved the large majority (71%) of each customers’ most recent complaint about PPI.
Among all complainants, only 11% have seen their most recent complaint resolved through the Financial
Ombudsman.
Figure 21: Complaint resolution
Overall, only 14% have not seen their most recent complaint resolved. This is usually due to the
complaint’s still being ongoing. However, some do not expect to see their complaint ever resolved – for
instance, due to the PPI being very old – and others have had their complaint rejected.
“I’m waiting for the Ombudsman’s verdict.”
“I’m waiting for an answer from the company that sold it to me in 1986.”
“I did not get paid back my PPI [money], but I intend to complain again.”
71%
11%
14%
4%
Complaint resolution
was resolved by the
provider of the PPI
was resolved by the
Financial Ombudsman
is not concluded /
resolved yet
Don't know
My most recent complaint …
Q28a: With regard to your most recent payment protection insurance (PPI) policy, is your
complaint concluded now? Base: All who have or have had PPI and complained about at least one PPI policy (n=2068)
4. COMPENSATION

Page 40
4.1 EXPERIENCE OF COMPENSATIONAmong those PPI complainants whose claim was resolved, nine in ten (91%) did receive compensation –
almost two thirds (63%) £2,000 or less.
Of those who complained but did not receive compensation, 70% complained directly to their provider
and 26% complained via a CMC.
Figure 22: Compensation received
Among those who have received compensation, the majority (85%) are satisfied, with two in five (41%)
very satisfied.14 Just 14% say that they are dissatisfied with the compensation received, including only 5%
who say that they are very dissatisfied. Those who complained via their provider (87%) are more likely to
be satisfied than those who complained via a CMC (81%).
14 Q30: Taking everything into consideration, to what extent would you say that you are satisfied or dissatisfied with this
sum of compensation? Base: All who have complained about at least one PPI policy and received PPI compensation
(n=1554)
9%
4%
7%
17%
21%
19%
24%
0% 20% 40% 60% 80% 100%
I did not receive compensation
£10001 or more
£5001 - £10000
£2001 - £5000
£1001 - £2000
£501 - £1000
£500 or less
Compensation received
Q29: With regard to your most recent payment protection insurance (PPI) policy, how much
compensation, if any, did you receive as a result of your complaint? Base: All who have had their most recent PPI complaint resolved (n=1708)

Page 41
4.2 PAST USE OF COMPENSATIONAs Figure 23 illustrates, almost half of people who received compensation from their most recent
complaint used this sum for saving and/ or investing (43%) and more than a third used it for paying
down one or more kinds of debt (37%), while a third (32%) spent it. It is worth stressing that the total
categories given in the figure below have been added as an analytical tool after fieldwork – this
categorisation was not presented to respondents completing the survey, and individuals may also fall
into multiple categories. Similarly, the total figures are not reflective of monetary values – we do not
have information on the amount of money that each respondent saved or the amount that they spent,
for example. A person may have saved £5 in a bank account and spent £300 on a large purchase, and
would be classified in both categories.15
Figure 23: Past use of compensation
15 The questions on compensation were only asked in phases 1-3 of the research, being removed for phase 4 to ensure
that there was sufficient space to ask questions about Plevin vs. Paragon Personal Finance without encountering
respondent fatigue. Further information on this is available in the separate technical report on this study.
Q31: Thinking of the compensation you got as one-off unexpected additional income, can you
recall how you used it? Multiple answers possible Base: All those who have complained about at least one PPI policy and received compensation (n=791)
35%
10%
0%
20%
40%
60%
80%
100%
TOTAL: Saved/Invested
(43%)
Saved it in my bank
account
Saved/invested in
dedicated
account/investment
plan
18% 16%
TOTAL: Spent (32%)
Spent it on
everyday
expenses
Spent it on a
large purchase
16%
8%4% 3%
14%
TOTAL: Paid Down Debt (37%)
Used it to pay down credit card
debt
Used it to pay down/clear
overdraft
Used it to pay down mortgage
Used it to pay down student
loan debt
Used it to pay down other debts
Past use of compensation

Page 42
4.3 LIKELY USE OF POTENTIAL FUTURE COMPENSATIONWhen asking all those who have, have had or may have had PPI how they would use future compensation
money responses are broadly similar to the ways in which complainants who received compensation
reported using it:
PPI holders are more likely to say that they would save the money (46%, compared to 43% who
did save and / or invest the money that they received from compensation [see Figure 23]) than
spend it or use it to pay down debt;
More than two in five of those aged 25-34 (43%) and those aged 35-44 (42%) would use
compensation to pay down various debts.
Figure 24: Likely use of potential future compensation
Q46: If you do complain and receive compensation as one-off additional income, how do you
think you would use it? Multiple answers possible Base: All who have, have had or may have had a PPI policy (n=3137)
38%
12%
0%
20%
40%
60%
80%
100%
TOTAL: Save/Invest
(46%)
Save it in my bank
account
Save/invest in
dedicated
account/investme
nt plan
14% 14%
TOTAL: Spend (26%)
Spend it on
everyday expenses
Spend it on a large
purchase
15%
7% 8%2%
14%
TOTAL: Pay Down Debt (34%)
Use it to pay down credit
card debtUse it to pay down/clear
overdraftUse it to pay down
mortgageUse it to pay down student
loan debtUse it to pay down other
debts
Likely use of potential future compensation

5. POTENTIAL FUTURE COMPLAINTS – DEFINITE PPI HOLDERS

Page 44
5.1 INTENTION OF COMPLAININGAmong all who have or have had PPI, only one in eight (12%) intend to complain or complain again,
compared to three quarters (72%) who do not intend to do so and 16% who do not know if they will
complain.16
Approximately two thirds of those intending to complain (63%) have already complained about their
policy / at least one of their policies. Around one third (35%) have never complained before and intend
to complain for the first time. 2% do not know if they have complained before.
Those who have become aware of issues with PPI within the last year seem more intent on making a
complaint or complaining again than those who learned about problems 2-3 years ago and 4-5 years
ago (34% vs. 13% and 7% respectively).
16 Q35: Do you intend to complain (or make another complaint) about any of the payment protection insurance (PPI)
policies you have? Base: All who have or have had a PPI policy (n=4385)
Page 45
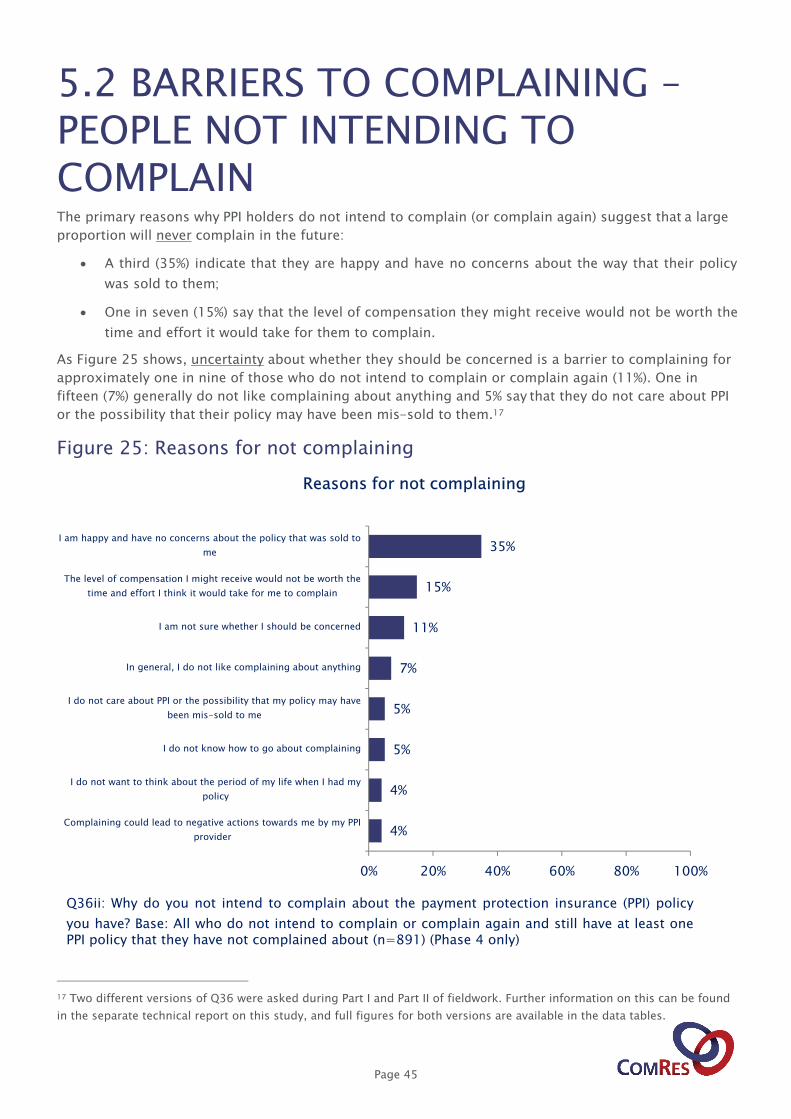
5.2 BARRIERS TO COMPLAINING –PEOPLE NOT INTENDING TO COMPLAINThe primary reasons why PPI holders do not intend to complain (or complain again) suggest that a large
proportion will never complain in the future:
A third (35%) indicate that they are happy and have no concerns about the way that their policy
was sold to them;
One in seven (15%) say that the level of compensation they might receive would not be worth the
time and effort it would take for them to complain.
As Figure 25 shows, uncertainty about whether they should be concerned is a barrier to complaining for
approximately one in nine of those who do not intend to complain or complain again (11%). One in
fifteen (7%) generally do not like complaining about anything and 5% say that they do not care about PPI
or the possibility that their policy may have been mis-sold to them.17
Figure 25: Reasons for not complaining
17 Two different versions of Q36 were asked during Part I and Part II of fieldwork. Further information on this can be found
in the separate technical report on this study, and full figures for both versions are available in the data tables.
4%
4%
5%
5%
7%
11%
15%
35%
0% 20% 40% 60% 80% 100%
Complaining could lead to negative actions towards me by my PPI
provider
I do not want to think about the period of my life when I had my
policy
I do not know how to go about complaining
I do not care about PPI or the possibility that my policy may have
been mis-sold to me
In general, I do not like complaining about anything
I am not sure whether I should be concerned
The level of compensation I might receive would not be worth the
time and effort I think it would take for me to complain
I am happy and have no concerns about the policy that was sold to
me
Reasons for not complaining
Q36ii: Why do you not intend to complain about the payment protection insurance (PPI) policy
you have? Base: All who do not intend to complain or complain again and still have at least one PPI policy that they have not complained about (n=891) (Phase 4 only)

Page 46
Moreover, perceived difficulty of the complaining process does not seem to be a major concern to PPI
holders in terms of intentions to complain, for both those who have or have had a PPI policy and those
who are unsure whether they have or have had PPI. More than a third of those who have, have had or
may have had a PPI policy (35%) believe that it would be easy to complain, and fewer than one in ten (9%)
believe it would be very difficult.
However, those who have not yet complained about any of their policies are more likely than those who
have done so to anticipate that the complaining process would be difficult – one in three of those who
have, have had or may have had PPI policy but have not yet complained (33%) think that the process
would be difficult, compared to one quarter of those who have already complained (25%) about at least
one of their policies.18
18 Q43: How difficult or easy do you think the process of complaining about a PPI policy might be? Base: All who have, have
had or may have had a PPI policy (n=6502)

Page 47
5.3 BARRIERS TO COMPLAINING –PEOPLE WHO INTEND TO COMPLAINAmong PPI holders who intend to complain or complain again, the main reason why they have not
complained already is a lack of time and energy, selected by two in five (40%) – this highlights the
challenge of inertia in relation to personal financial issues and triggering action. One in five (21%) cite a
lack of knowledge about how to make a complaint.
Figure 26: Barriers to complaining
This is very different from the responses of those PPI holders who do not intend to complain (see Figure
25), where a perception that the level of possible compensation they might receive would not be worth
the time and effort required to complain was cited by just 15% and a lack of knowledge about
complaining by just 5%.
1%
1%
1%
21%
30%
40%
0% 20% 40% 60% 80% 100%
Long time ago
Told I don't qualify
Already checked
I am not sure how to
I had to check if I ever had PPI
I have not had the time/energy
Barriers to complaining
- showing top six
Q41: What has prevented you from complaining already? Base: All who intend to complain or complain again about at least one PPI policy (n=508)

Page 48
5.4 PROMPTS FOR COMPLAINTSWhen prompted on which methods would make them more likely to complain again, for the first time or
to complain sooner than originally planned, people who have, have had or may have had PPI appear
three times more responsive to letters from providers explaining how to complain (64% reportedly would
be more likely to complain following receipt of this letter) than to cold calls from CMCs (20% reportedly
would be more likely to complain after being prompted in this manner). This again highlights the
propensity of people to make complaints through providers rather than CMCs, already observed in those
people who did make a complaint (see Figure 20).
As Figure 27 shows, more than half of those who have, have had or may have had PPI (54%) say that
communications from the government explaining how to complain would make them more likely to
complain.
Although there is no clear pattern for those 11% who say it is likely that something ‘other’ would have
prompted them to complain, many of these people say that more information would have prompted
them to do so, for instance, from an online consumer advice website.19
19 Different options were used for Q44 in different phases of the fieldwork, which explains the variable base sizes in Figure
27. Further information is included in the technical report, in section 2 on Questionnaire Design.

Page 49
Figure 27: Reported effectiveness of prompts to complain
3%
6%
7%
13%
14%
15%
16%
18%
19%
30%
8%
14%
23%
33%
34%
36%
27%
36%
36%
34%
28%
24%
31%
24%
26%
24%
27%
23%
21%
16%
14%
44%
26%
17%
14%
13%
16%
11%
11%
10%
47%
12%
13%
12%
12%
12%
15%
12%
13%
10%
0% 20% 40% 60% 80% 100%
Other
Cold call from a Claims Management Company…
Media advertisments from CMCs
Media advertisements explaining how to complain
Media news stories explaining how to complain
Advice from friends and family
A deadline on complaining
Communications from the government…
Successful complaint by family and friends
Letter from my provider explaining how to…
Reported effectiveness of prompts to complain
Very likely Fairly likely Not very likely
Not at all likely Don't know
Q44: How likely, if at all, would you say the following scenarios would be to prompt you to
complain, or, if you are already intending to complain, to do so sooner? Base: All those who have, have had or may have had a PPI policy (n=3137-6502)

Page 50
5.5 TIMEFRAME OF INTENDED COMPLAINTSThose who intend to complain reportedly plan to do so in the near future: on a scale from zero (not
likely at all) to ten (certain), more than two in five (44%) are most likely to complain in the next six
months.
A third (34%) of those intending to complain are most likely to complain in more than three years. As
with the perceived likelihood of checking whether they have had PPI at all (see Checking about PPI20),
this time gap suggests that it is relatively unlikely that these people will complain at all.
Figure 28: Timeframe of intended complaints
Using responses on a 0-10 scale for each option, we identified the time period in which people say they are most
likely to complain. Where people select the same score out of 10 for two or more time slots, we allocated people to
the latest time slot (i.e. if a person selected 2 for “in 0-6 months”, 3 for “in 7-12 months”, 6 for “in 1-3 years” and 6
for “in more than three years”, they would be allocated to “in more than three years”.
20 Section 2.2.
7%
34%
5%
10%
44%
0% 20% 40% 60% 80% 100%
Don't know
In more than 3 years
In 1-3 years
In 7-12 months
In 0-6 months
Timeframe of intended complaints
Showing time period in which people are most likely to complain
Q38: How likely, if at all, would you say that you are to complain within the following
time periods? Base: All who intend to complain or complain again about at least one PPI
policy [Excluding pilot for phase 4] (n=474)

Page 51
5.6 LIKELY CHANNELS FOR COMPLAINTSThose who intend to complain state that they expect to do so through methods broadly similar to those
who have already complained. As Figure 29 shows, approximately half (49%) intend to complain directly
to the provider. A quarter (26%) expects to complain through a CMC, followed at a distance by financial
advisors (12%) and lawyers (8%).
Figure 29: Expected channel of raising complaints
49%
26%
12%
8% 2%
Expected channels of raising complaints on PPI
directly to the provider of the
PPI
via a Claims Management
Company (CMC)
via a financial advisor
via a lawyer
Other
I intend to complain…
Q39: How are you intending to complain? Base: All who intend to complain/ complain again about at least one PPI policy (n=508)

6. POTENTIAL FUTURE COMPLAINTS – POSSIBLE PPI HOLDERS

Page 53
6.1 TIMEFRAME OF POTENTIAL COMPLAINTSFor those who are not 100% sure whether they have had PPI or “really don’t know”, we introduced a
hypothetical scenario in phases two, three and four of the research where we suggested that they had
discovered that they definitely held a PPI policy.21
Firstly, we then asked them to rate how likely they would be to complain in this situation, on a scale
from 0-10. We then calculated the timeframe in which these people are most likely to complain –
allocating them to one of the time slots based on the slot for which they select the highest score. Where
people select the same score out of 10 for two or more time slots, we allocated people to the latest time
slot (i.e. if a person selected 2 for “in 0-6 months”, 3 for “in 7-12 months”, 6 for “in 1-3 years” and 6 for
“in more than three years”, they would be allocated to “in more than three years”.
Using this analysis, a quarter (26%) are most likely to complain in the next six months, whereas a third
(35%) are most likely to complain in more than 3 years. Another quarter (26%) say they do not know
when they would complain.22 As with Figure 28, it seems unlikely that the two latter groups would
indeed complain at all.
Figure 30: Timeframe of hypothetical complaints
For Figure 30, we identified the time period in which people say they are most likely to complain using responses on
a 0-10 scale for each option. In cases where equal scores were provided for each period we assigned the value to
the option that is more distant in time to provide a more conservative evaluation.
21 For phases two and three of the research, we introduced an additional set of questions for those who were not sure
whether they had held a PPI policy – either saying that they “really don’t know” or are “not 100% sure”. Further detail on this
can be found in the Questionnaire Design section in the technical report.
22 The high proportion of “don’t know” responses reflects a common trend when asking hypothetical questions, as
respondents can find it difficult to place themselves in the situation posed.
26%
35%
5%
8%
26%
0% 20% 40% 60% 80% 100%
Don't know
In more than 3 years
In 1-3 years
In 7-12 months
In 0-6 months
Timeframe of hypothetical complaints
Showing time period in which people are most likely to complain
Q23c: Imagine that you checked whether you had payment protection insurance (PPI) and
discovered that you had one or more PPI policies. How likely, if at all, would you say that
you would be to complain within the following time periods? Base: All who are not 100%
sure or really don't know if they have had a PPI policy [Phases 2/3] (n=594)
Page 54
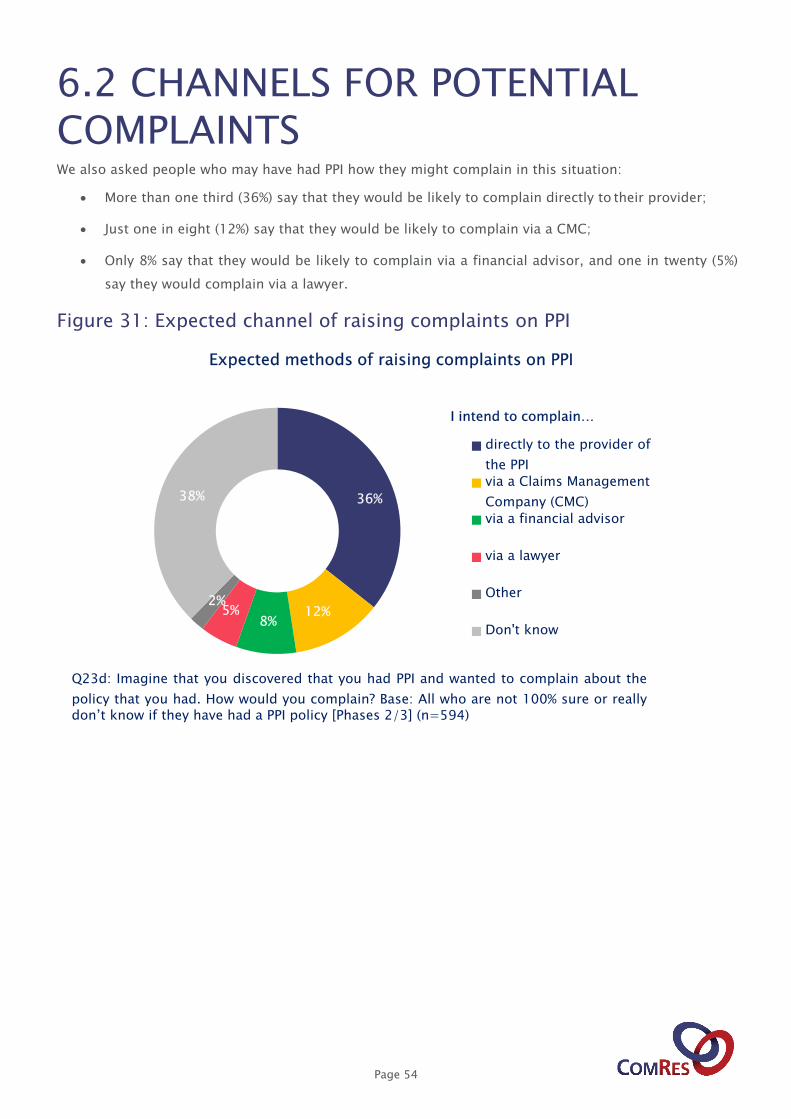
6.2 CHANNELS FOR POTENTIAL COMPLAINTSWe also asked people who may have had PPI how they might complain in this situation:
More than one third (36%) say that they would be likely to complain directly to their provider;
Just one in eight (12%) say that they would be likely to complain via a CMC;
Only 8% say that they would be likely to complain via a financial advisor, and one in twenty (5%)
say they would complain via a lawyer.
Figure 31: Expected channel of raising complaints on PPI
36%
12%8%
5%2%
38%
Expected methods of raising complaints on PPI
directly to the provider of
the PPI
via a Claims Management
Company (CMC)
via a financial advisor
via a lawyer
Other
Don't know
I intend to complain…
Q23d: Imagine that you discovered that you had PPI and wanted to complain about the
policy that you had. How would you complain? Base: All who are not 100% sure or really don’t know if they have had a PPI policy [Phases 2/3] (n=594)
7. THE IMPACT OF PLEVIN VS. PARAGON PERSONAL FINANCE
Page 56
7.1 INTRODUCING THE CASEIn wave 4 of the research, we wanted to understand whether information regarding the outcome of the
Plevin vs. Paragon Personal Finance case had an impact on complaining behaviour around PPI. To do
this, we first presented all people who have or have had PPI (n=2106) with information about the
outcome of the case and its potential implications for their own situation – this information is included
below:
Recently a Court ruled that the sale of a PPI policy to a customer was unfair as they were not told
that nearly 75% of the price would be kept as commission rather than paying for the insurance.
As a result, the customer was given some of their money back.
The PPI you bought may have included a high level of commission that was not revealed to you.
So it is possible that if you complain now, you may also get back some or all of what you paid for
your PPI because of undisclosed high commission.
To fully understand the impact of Plevin, it is important to understand the potential starting points of
those on whom the case’s impact was tested. Based on their responses to Q35 (see Intention of
Complaining23), there are three possible starting points:
1. People already intending to complain – those who have or have had PPI who had already stated,
before information about the Plevin case was introduced, that they intended to complain about
PPI. Information about Plevin could therefore :
a. Make them complain sooner
b. Have no impact on the timing of their complaint
c. Make them complain later
2. People not intending to complain – those who have or have had PPI who previously stated, before
information about the Plevin case was introduced, that they did not intend to complain about PPI.
Information about Plevin could therefore:
a. Change their mind and make them now intend to complain
b. Not change their mind, leaving them still not intending to complain
c. Confuse their thinking and leave them not knowing if they intend to complain
3. People not knowing whether they intend to complain – those who have or have had PPI who
previously stated, before information about the Plevin case was introduced, that they did not
know whether they intended to complain about PPI. Information about Plevin could therefore:
a. Change their mind and make them now intend to complain
b. Change their mind and make them now not intend to complain
c. Not change their mind, leaving them still not knowing whether they intend to complain
The impact of information about Plevin upon each of these groups will be assessed in the following
sections – it is summarised in Figure 32.
23 See section 5.1

Page 57
Figure 32: Impact of Plevin – summary
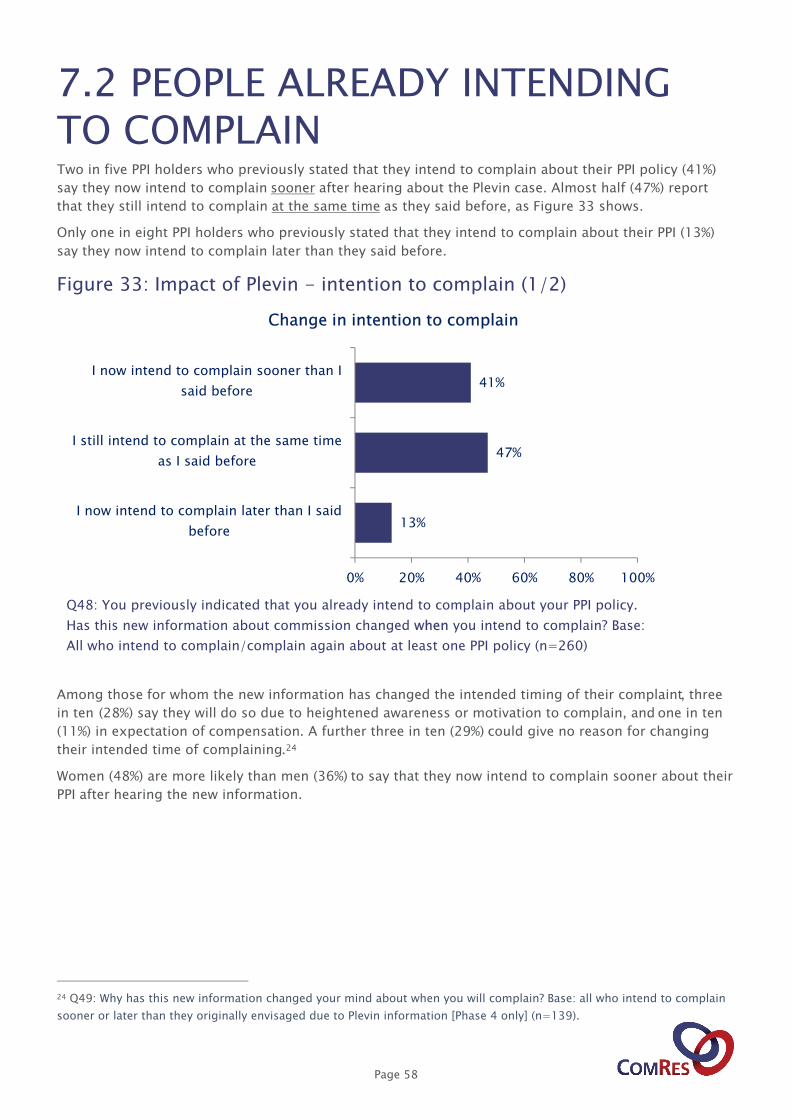
Page 58
7.2 PEOPLE ALREADY INTENDING TO COMPLAINTwo in five PPI holders who previously stated that they intend to complain about their PPI policy (41%)
say they now intend to complain sooner after hearing about the Plevin case. Almost half (47%) report
that they still intend to complain at the same time as they said before, as Figure 33 shows.
Only one in eight PPI holders who previously stated that they intend to complain about their PPI (13%)
say they now intend to complain later than they said before.
Figure 33: Impact of Plevin - intention to complain (1/2)
Among those for whom the new information has changed the intended timing of their complaint, three
in ten (28%) say they will do so due to heightened awareness or motivation to complain, and one in ten
(11%) in expectation of compensation. A further three in ten (29%) could give no reason for changing
their intended time of complaining.24
Women (48%) are more likely than men (36%) to say that they now intend to complain sooner about their
PPI after hearing the new information.
24 Q49: Why has this new information changed your mind about when you will complain? Base: all who intend to complain
sooner or later than they originally envisaged due to Plevin information [Phase 4 only] (n=139).
13%
47%
41%
0% 20% 40% 60% 80% 100%
I now intend to complain later than I said
before
I still intend to complain at the same time
as I said before
I now intend to complain sooner than I
said before
Change in intention to complain
Q48: You previously indicated that you already intend to complain about your PPI policy.
Has this new information about commission changed when you intend to complain? Base:
All who intend to complain/complain again about at least one PPI policy (n=260)

Page 59
7.3 PEOPLE NOT INTENDING TO COMPLAIN OR NOT KNOWING IF THEY INTEND TO COMPLAINFigure 34 summarises the overall impact of the Plevin case for those who previously had not intended to
complain or had not known if they would.
People previously not intending to complain
Three in five PPI holders who previously stated that they do not intend to complain about their PPI (59%)
still do not intend to complain after hearing about the Plevin case. Only for one in eight (13%) has the
new information changed their mind as they say they now intend to complain. A quarter of PPI holders
who previously stated that they do not intend to complain about their PPI (27%) now say they do not
know whether they now intend to complain after hearing the Plevin information.
Among those who did not intend to complain before hearing the new information about Plevin but do
intend to complain now, a quarter (24%) say they will do so due to perceptions of greater compensation,
while another quarter (23%) cite greater awareness and motivation.25 For one in five (20%) it is the
realisation of the high commission percentage that changed their mind.
Younger people among those who had not intended to complain are significantly more likely than older
people to say that they now intend to complain after hearing the new information. Whereas a quarter of
those aged 25-34 (24%) report having changed their mind to intending to complain, only 6% of those
aged 65 and older report the same.
People previously unsure if they intended to complain
After hearing about the Plevin case, more than half (57%) still do not know whether they now intend to
complain. One in three PPI holders who previously stated that they do not know whether they intend to
complain about their PPI (31%) now say they do intend to complain after hearing about the Plevin case.
Among those who previously did not know whether they intended to complain but do intend to complain
now, a quarter (23%) say they will do so in the expectation of money, while one in five (21%) cite greater
awareness and motivation.26
25 Q51a: You have indicated that you now intend to complain about your PPI policy. Why has this new information changed
your mind about whether you will complain? Base: all who changed their mind from not intending to complain to
complaining after Plevin information [Phase 4 only] (n=201).
26 Q53c: You have indicated that you now intend to complain about your PPI policy. Why has this new information changed
your mind about whether you will complain? Base: all who have changed their mind from not knowing whether they
intended to complain to now intending to complain after Plevin information [Phase 4 only] (n=118)

Page 60
Figure 34: Impact of Plevin - intention to complain (2/2)
Timeframe of complaints
More than half of those who changed their mind after hearing about the Plevin case from not intending
to complain to intending to complain (55%) are most likely to complain in the next six months. Just
under three in ten (28%) are most likely to complain in more than 3 years.
Almost three in five of those who changed their mind after hearing the Plevin information from not
knowing whether they intended to complain to intending to complain (58%) are most likely to complain
in the next six months.
57%
3%
31%
27%
59%
13%
0% 20% 40% 60% 80% 100%
Don't Know
No
Yes
Impact of Plevin case on intention to complain
Those previously not intending to complain
Those previously unsure if they intended to complain
Q50. You previously indicated that you do not intend to complain about your PPI policy. In
light of this information, do you now intend to complain? Base: All who do not intend to
complain/complain again about at least one PPI policy (n=1563); Q53b: You previously
indicated that you do not know whether you intend to complain about your PPI policy. In
light of this new information, do you now intend to complain? Base: All who do not know if
they intended to complain about at least one PPI policy [Phase 4 only] (n=383)

Page 61
Figure 35: Impact of Plevin - timeframe of hypothetical complaints
Channel of complaints
Three in five of those who changed their mind after hearing the Plevin information from not intending to
complain to intending to complain (59%) say they would do so directly to the provider of the PPI. One in
seven (15%) say they would do so via a CMC.
Roughly half of those who changed their mind after hearing the Plevin information from not knowing
whether they intended to complain to intending to complain (53%) say they would do so directly to the
provider of the PPI. One in five (19%) say they would do so via a CMC. However, a quarter (24%) say they
do not know how they would raise their complaint.
12%
12%
5%
12%
58%
6%
28%
4%
7%
55%
0% 20% 40% 60% 80% 100%
Don't Know
In more than 3 years
In 1-3 years
In 7-12 months
In 0-6 months
Those changing their mind from not complaining to complaining
Those changing their mind from not knowing if they would complain to complaining
Q51b. You have indicated that now, in the light of the new information, you do intend to
complain about your payment protection insurance (PPI) policy. When do you think you
are likely to complain? Please indicate how likely on a scale of 0 to 10 where 0 = not
likely at all and 10 = certain. Base: All who changed their mind from not complaining to
complaining after Plevin information (n=178); Q53d: You have indicated that now, in the
light of the new information, you do intend to complain about your payment protection
insurance (PPI) policy. When do you think you are likely to complain? Please indicate how
likely on a scale of 0 to 10 where 0 = not likely at all and 10 = certain. Base: All who
changed their mind from not knowing whether to complain to complaining after Plevin information (n=118)

Page 62
Figure 36: Impact of Plevin - expected channels of raising complaints on
PPI
12%
3%
4%
6%
15%
59%
24%
1%
1%
2%
19%
53%
Don't know
Other
Via a lawyer
Via a financial advisor
Via a Claims Management Company
(CMC)
Directly to the provider of the PPI
0% 20% 40% 60% 80% 100%
Expected channels of raising complaints on PPI
Previously did not know if intended to complain
Previously did not intend to complain
Q52: How are you intending to complain? Base: All who changed their mind from not
complaining to complaining after Plevin information (n=201). Q53e: How are you
intending to complain? Base: All respondents who changed their mind from not knowing whether to complain to complaining after Plevin information (n=118)
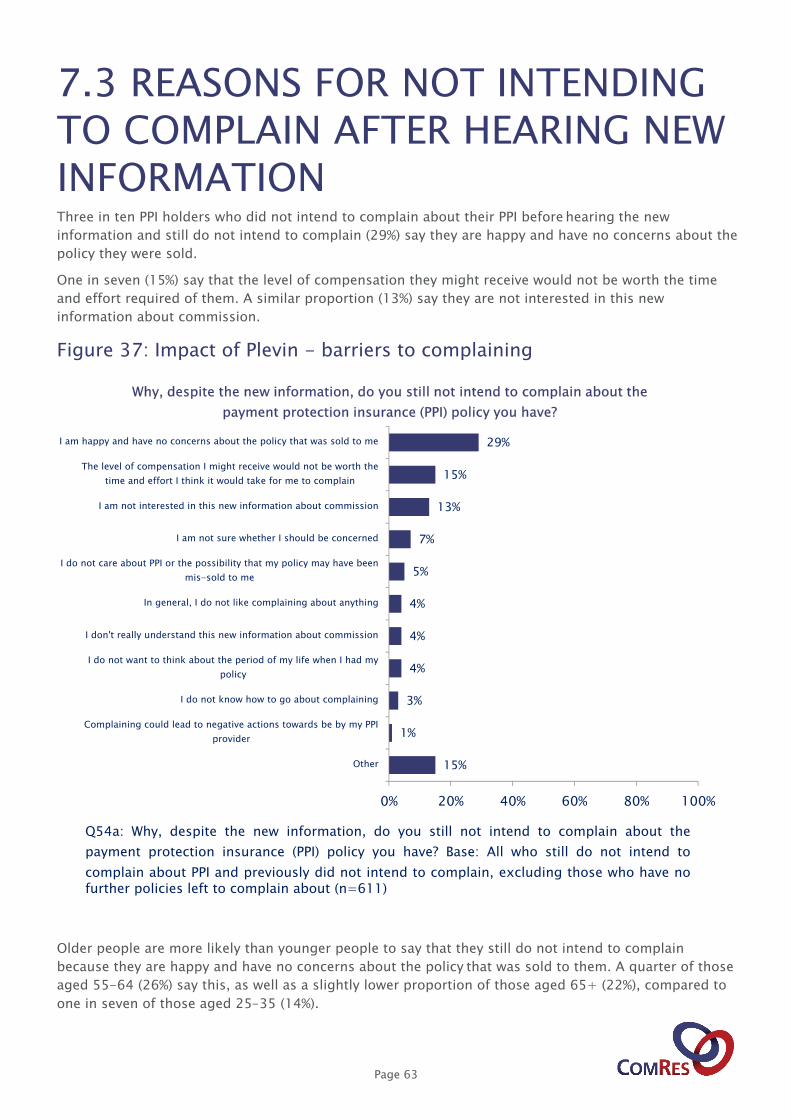
Page 63
7.3 REASONS FOR NOT INTENDINGTO COMPLAIN AFTER HEARING NEW INFORMATIONThree in ten PPI holders who did not intend to complain about their PPI before hearing the new
information and still do not intend to complain (29%) say they are happy and have no concerns about the
policy they were sold.
One in seven (15%) say that the level of compensation they might receive would not be worth the time
and effort required of them. A similar proportion (13%) say they are not interested in this new
information about commission.
Figure 37: Impact of Plevin - barriers to complaining
Older people are more likely than younger people to say that they still do not intend to complain
because they are happy and have no concerns about the policy that was sold to them. A quarter of those
aged 55-64 (26%) say this, as well as a slightly lower proportion of those aged 65+ (22%), compared to
one in seven of those aged 25-35 (14%).
15%
1%
3%
4%
4%
4%
5%
7%
13%
15%
29%
0% 20% 40% 60% 80% 100%
Other
Complaining could lead to negative actions towards be by my PPI
provider
I do not know how to go about complaining
I do not want to think about the period of my life when I had my
policy
I don't really understand this new information about commission
In general, I do not like complaining about anything
I do not care about PPI or the possibility that my policy may have been
mis-sold to me
I am not sure whether I should be concerned
I am not interested in this new information about commission
The level of compensation I might receive would not be worth the
time and effort I think it would take for me to complain
I am happy and have no concerns about the policy that was sold to me
Why, despite the new information, do you still not intend to complain about the
payment protection insurance (PPI) policy you have?
Q54a: Why, despite the new information, do you still not intend to complain about the
payment protection insurance (PPI) policy you have? Base: All who still do not intend to
complain about PPI and previously did not intend to complain, excluding those who have no further policies left to complain about (n=611)

8. APPETITE FOR REPAYMENT INSURANCE AFTER PPI
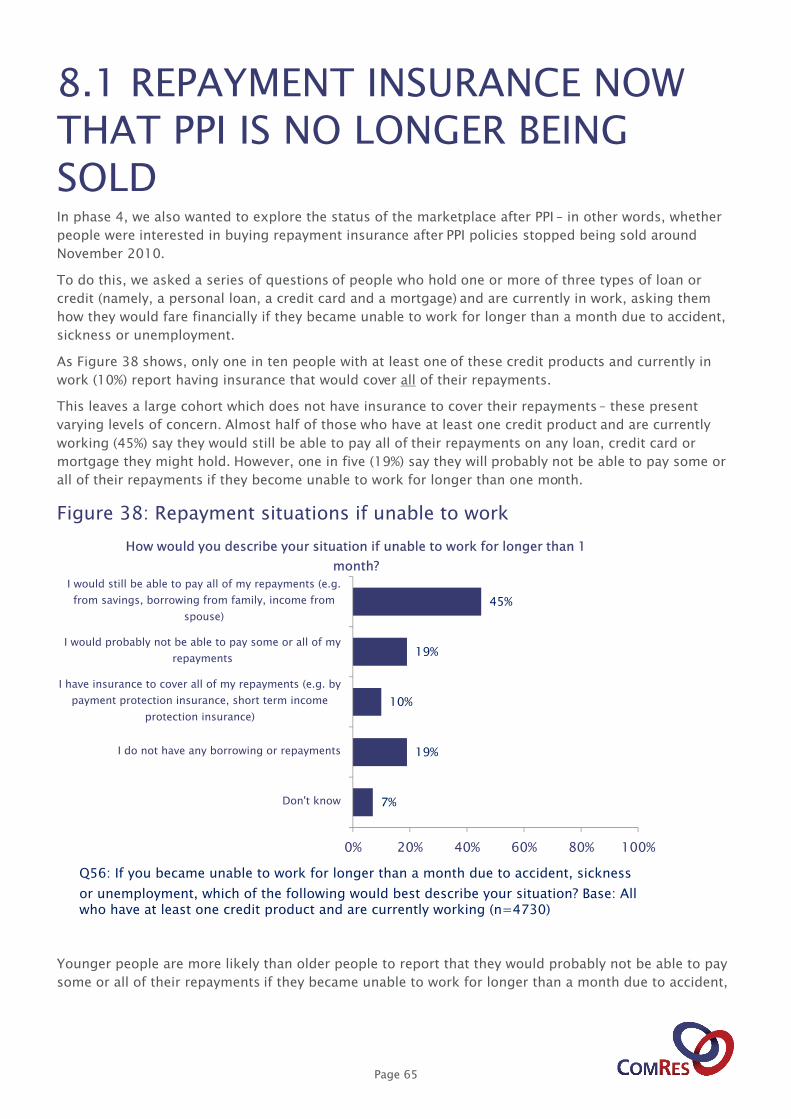
Page 65
8.1 REPAYMENT INSURANCE NOW THAT PPI IS NO LONGER BEING SOLDIn phase 4, we also wanted to explore the status of the marketplace after PPI – in other words, whether
people were interested in buying repayment insurance after PPI policies stopped being sold around
November 2010.
To do this, we asked a series of questions of people who hold one or more of three types of loan or
credit (namely, a personal loan, a credit card and a mortgage) and are currently in work, asking them
how they would fare financially if they became unable to work for longer than a month due to accident,
sickness or unemployment.
As Figure 38 shows, only one in ten people with at least one of these credit products and currently in
work (10%) report having insurance that would cover all of their repayments.
This leaves a large cohort which does not have insurance to cover their repayments – these present
varying levels of concern. Almost half of those who have at least one credit product and are currently
working (45%) say they would still be able to pay all of their repayments on any loan, credit card or
mortgage they might hold. However, one in five (19%) say they will probably not be able to pay some or
all of their repayments if they become unable to work for longer than one month.
Figure 38: Repayment situations if unable to work
Younger people are more likely than older people to report that they would probably not be able to pay
some or all of their repayments if they became unable to work for longer than a month due to accident,
7%
19%
10%
19%
45%
0% 20% 40% 60% 80% 100%
Don't know
I do not have any borrowing or repayments
I have insurance to cover all of my repayments (e.g. by
payment protection insurance, short term income
protection insurance)
I would probably not be able to pay some or all of my
repayments
I would still be able to pay all of my repayments (e.g.
from savings, borrowing from family, income from
spouse)
How would you describe your situation if unable to work for longer than 1
month?
Q56: If you became unable to work for longer than a month due to accident, sickness
or unemployment, which of the following would best describe your situation? Base: All who have at least one credit product and are currently working (n=4730)

Page 66
sickness or unemployment – three in ten 18-24 year-olds (29%) say this, compared to fewer than one in
ten of those aged 65+ (8%).
Similarly, women (22%) are more likely than men (16%) to say that they would probably not be able to
pay some or all of their repayments.

Page 67
8.2 CONSIDERATION OF REPAYMENT INSURANCEFor those who do not do not have insurance products to cover repayments on all of their borrowings
(and therefore could be vulnerable if they suffered a loss of short-term income), we then explored the
extent to which they had considered taking out repayment insurance.
As Figure 39 shows, half of those who do not have insurance which covers all of their borrowings or
repayments (52%) report not having considered taking out insurance that protects their short-term
income if they became unable to work for longer than a month through accident, sickness or
unemployment.
In contrast, one in twelve (8%) say they have already purchased this type of insurance for some (but not
all) of their borrowings.
A similar proportion (7%) report having considered buying this type of insurance and are still interested
in it.
A quarter of those who do not have insurance for all of their credit products (26%) have considered
buying this type of insurance but decided against it.
Figure 39: Consideration of repayment insurance
Figure 40 shows the breakdown for those who report having purchased short-term income protection
insurance for some but not all of their borrowings (i.e. the 8% from Figure 39 above). One quarter of
these people (26%) say that they have PPI for one or more credit products. A similar proportion say
either that they have other repayment insurance that is not PPI (27%) or that they have short-term
income protection insurance (28%).
8% 7%
26%
52%
7%
0%
20%
40%
60%
80%
100%
Yes, I already
purchased this
type of insurance
Yes, I have
considered and am
interested in
buying this type of
insurance
Yes, I have
considered this
type of insurance
but decided
against it
No I have not
considered taking
out this type of
insurance
Don't know
Consideration of repayment insurance
Q57: Have you considered taking out insurance that protects your repayments, or insurance that
protects your short term income, if you become unable to work for longer than a month through
accident, sickness or unemployment? Base: All who have at least one credit product, are working, have borrowings and do not have insurance to cover repayments on all of them (n=3342)

Page 68
Figure 40: Insurance products purchased
17%
9%
26%
27%
28%
0% 20% 40% 60% 80% 100%
Don't know
Other
I have Payment Protection Insurance (PPI) for
one or more credit products
I have other repayment insurance (that is not
PPI) for one or more credit products
I have short-term income protection
insurance for one or more credit products
Insurance products purchased
Q58: Which type of insurance product did you purchase? Examples of credit products
include loans, mortgages and credit cards. Base: All who have at least one credit
product, are working, have purchased insurance cover for inability to work for some but
not all borrowings (n=248)

Page 69
8.3 BARRIERS TO PURCHASE OF INSURANCE COVERAs Figure 41 shows, among those who have already purchased insurance cover for some but not all of
their credit products, more than a third (36%) report not having bought this for all of their products
because they do not need these types of insurance for their other products. A similar proportion (35%)
of those who have not yet purchased any insurance cover (35%) also say that this is because they do not
need these types of insurance.
Among both of the above groups - those who have purchased insurance for some but not all of their
policies and those who have not yet purchased any insurance - a quarter of each group (23% for each)
have come across these types of insurance products but decided not to buy them as they deemed them
too expensive.
One in seven of those who have already purchased insurance cover for some but not all of their
borrowings (15%) say that they have not reached a decision yet on whether to purchase this insurance
for their outstanding products. The same proportion of those who have not yet purchased cover (15%)
also say this.
One in five of those who have not purchased this insurance cover for any of their borrowings (21%)
report not having bought such insurance because they do not trust the providers of these types of
insurance. In contrast, 14% of those who have purchased insurance cover for some but not all of their
borrowings say that they have not bought insurance for their other products because they do not trust
the providers.

Page 70
Figure 41: Reasons for not purchasing other insurance
9%
5%
2%
2%
8%
21%
15%
23%
35%
13%
3%
4%
7%
7%
14%
15%
23%
36%
0% 20% 40% 60% 80% 100%
Don't know
Other
I've been refused these types of insurance
I couldn't find these types of insurance
I don't understand these types of insurance
I don't trust the providers of these types of insurance
I haven't reached a decision yet on whether to
purchase these types of insurance
I found these types of insurance but they were too
expensive
I don't need these types of insurance
Reasons for not purchasing other insurance
All who have purchased insurance cover for inability to work on some but not all
credit products
All who have not purchased insurance cover for inability to work for any products
Q59: Thinking about the financial products that you don't have insurance for, which of the following
best describes why you have not purchased this type of insurance for your other loan, credit card or
mortgage? Base: All who have purchased insurance cover for inability to work for some but not all
borrowings (n=248); Q60: Which of the following best describes why you have not purchased or not
considered purchasing this type of insurance product? Base: All who have not purchased insurance to
cover inability to work for any borrowings (n=3067)

FURTHER INFORMATIONFor more information please contact:
Nick Allen
Associate Director
0207 871 8650
Tom Clarkson
Research Team Leader
0207 871 8659
Moritz Reinsch
Consultant
0207 871 8637