Analysis of World Cup Finals. Outline Project Understanding – World Cup History Data Understanding...
43
Analysis of World Cup Finals
-
Upload
coleman-foote -
Category
Documents
-
view
216 -
download
1
Transcript of Analysis of World Cup Finals. Outline Project Understanding – World Cup History Data Understanding...

Analysis of World Cup Finals

Outline• Project Understanding
– World Cup History• Data Understanding
– How to collect the data• Data Manipulation
– Data Cleaning – Feature Selection– Missing Values Handling– Discretization and Normalization
• Data Visualization• Modelling
– Classification of matches– Regression of matches’ scores
• Association Rule Learning• Conclusion
Project Understanding
• Domain is football.• Peak of Football Competitions• Held by FIFA• Why is World Cup Finals so important?– Viewer’s Perspective– Player’s Perspective
• Nationalism

World Cup History

World Cup History
• Most Successful countries

Project Understanding
• Purpose of The Project– Try to estimate match results based on previous
world cup finals’ mathces – Try to estimate match scores based on previous
world cup finals’ matches’ scores– Try to find meanningfull rules– Figure out which attributes are more important on
winning a match.
Data Understanding
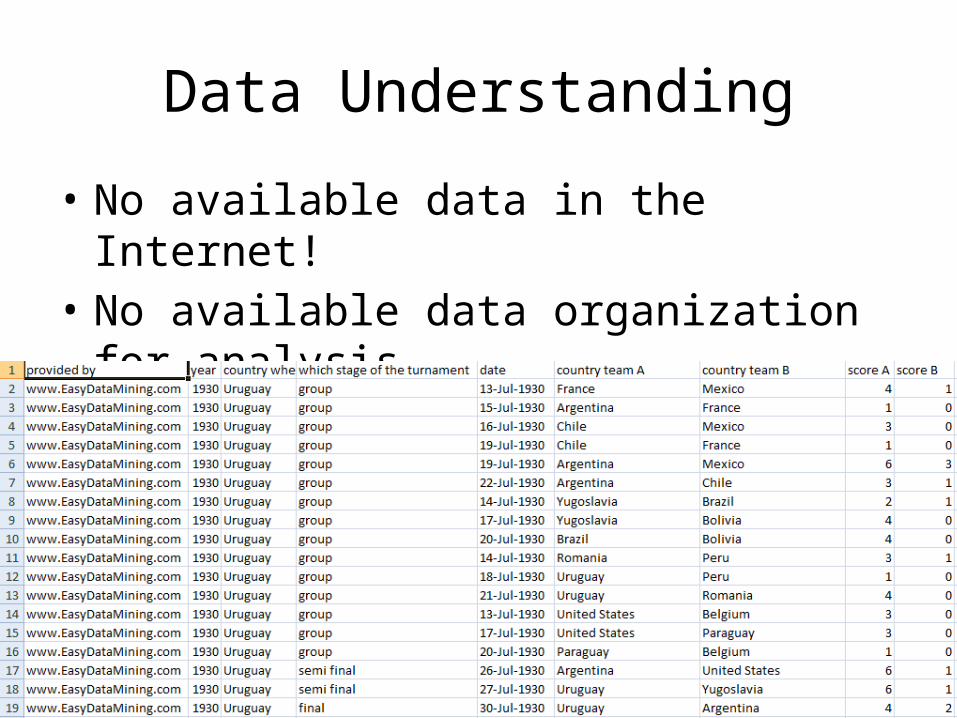
• No available data in the Internet!• No available data organization for analysis.• The very best data I could found
Data Understanding
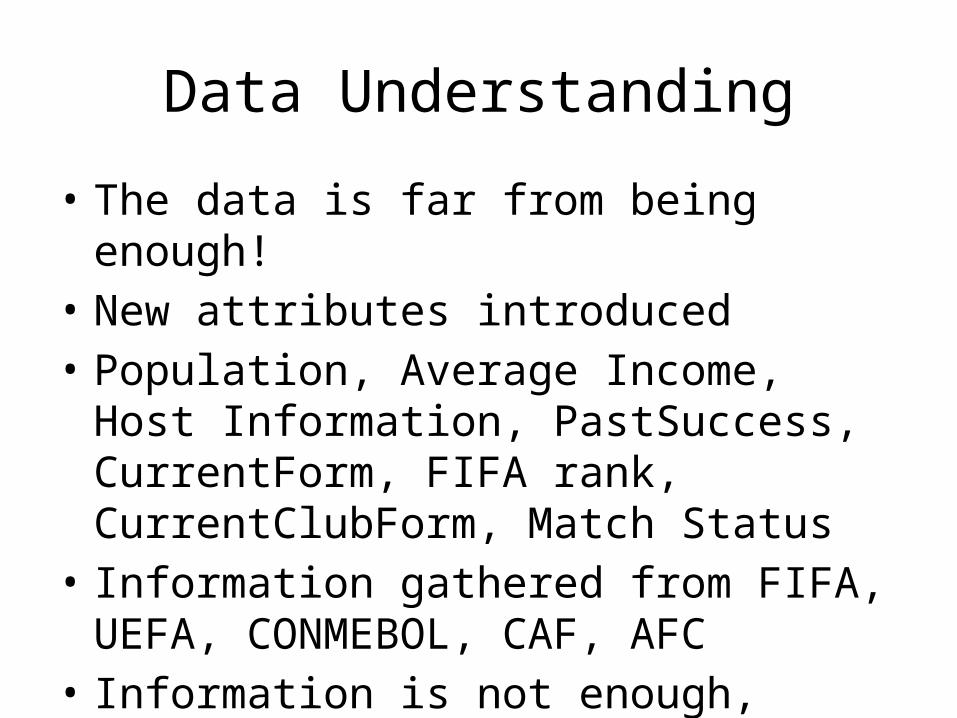
• The data is far from being enough!• New attributes introduced• Population, Average Income, Host
Information, PastSuccess, CurrentForm, FIFA rank, CurrentClubForm, Match Status
• Information gathered from FIFA, UEFA, CONMEBOL, CAF, AFC
• Information is not enough, needs revision

Population
• Larger population may indicate better national team performance
• Larger means larger talent pool to choose from

Average Income
• How does average income affects national team performance?
• Football is the poor’s sport or riche’s ?
Host
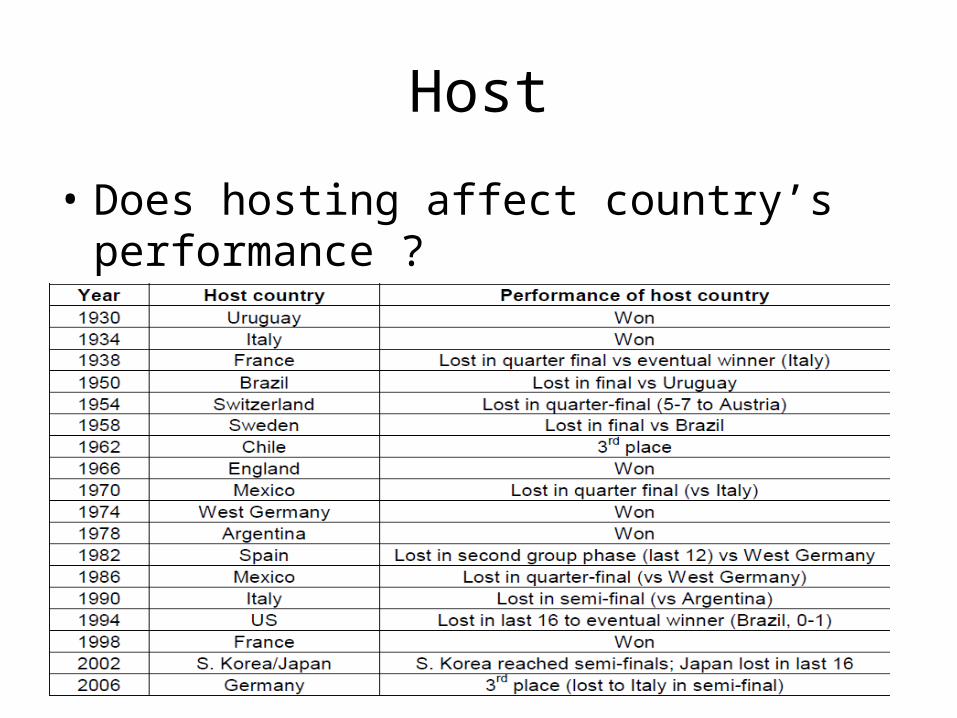
• Does hosting affect country’s performance ?• In fact, it does

Past Success
• Reflects the world cup achievements of a country until specified year.
• It brings “BIG TEAM” identity.• Points Calculation Table
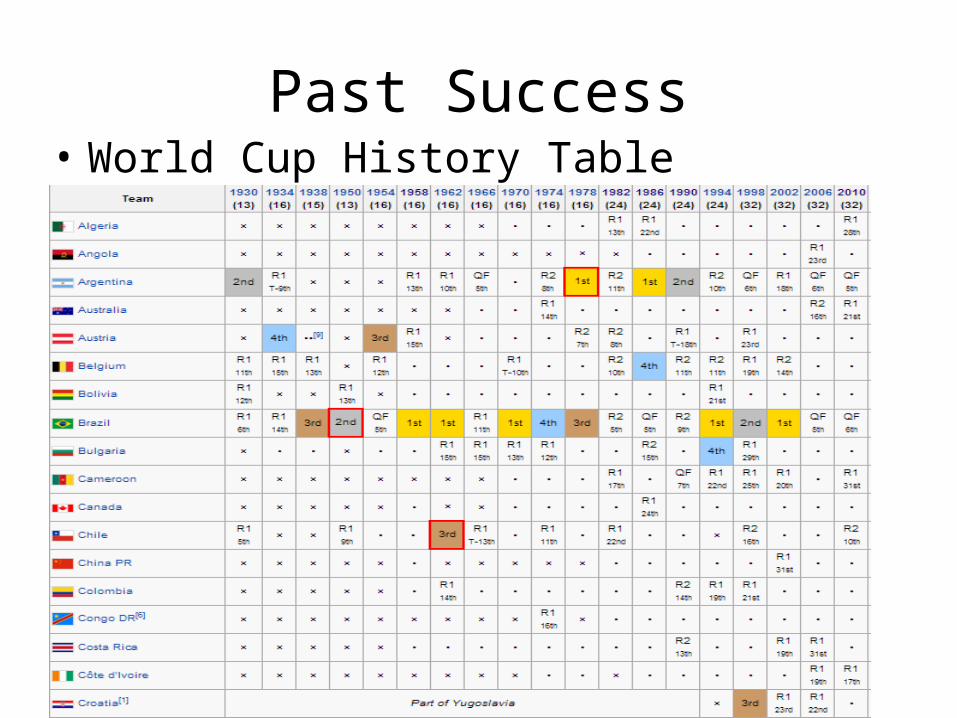
Past Success• World Cup History Table
Current Form
• Reflects the achivement in last world cup final and the other biggest associated competition’s achivement ( e.g. European Cup, Copa America, Africans Cup, Asian Cup)
• Points calculated similar to past success, but each competition has different weights
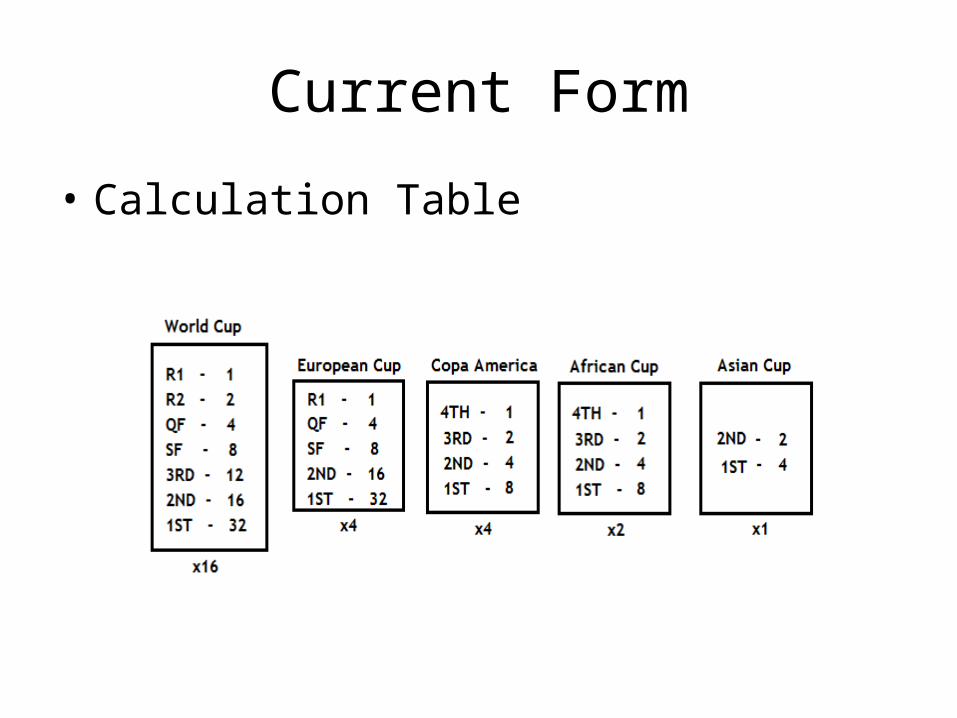
Current Form
• Calculation Table

Current Form• European Cup Table

Club Form
• Reflects the form of the clubs in a particular country
• Top 25 clubs according to FIFA found• Then for each club, points assigned to
corresponding country• Based on Champions League, Copa
Libertadores, UEFA Cup, League Success
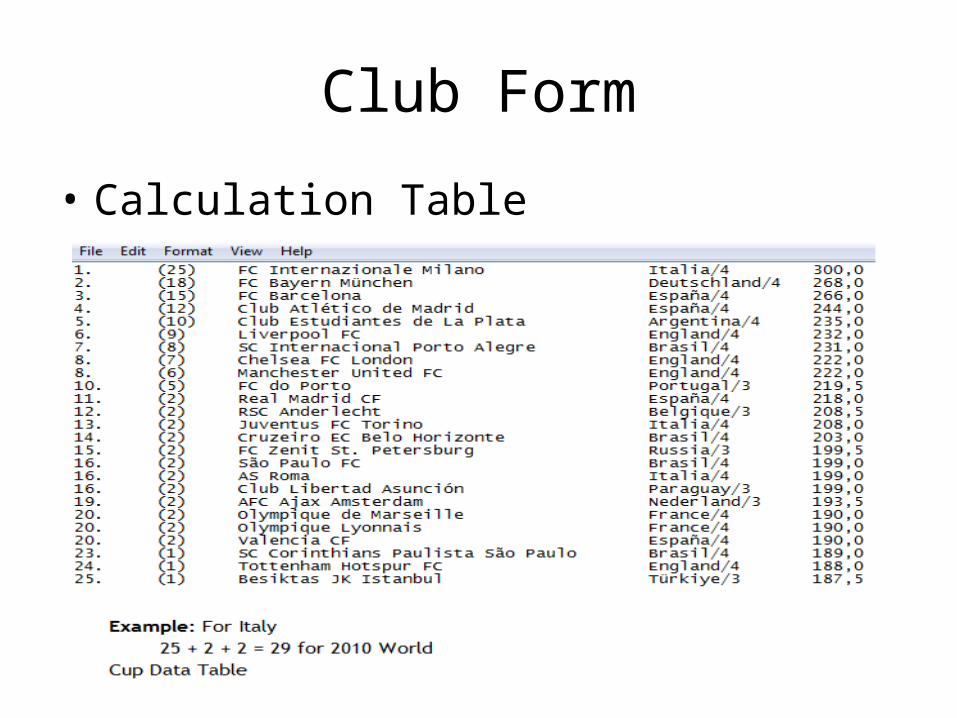
Club Form
• Calculation Table
FIFA Rank
• Reflects the success of each country in last five years along with its club success, league success, international success in all friendly and official qualification and finals matches
• Lowest rank means most successful country
Data Manipulation- Cleaning
• USA vs United States• No longer existing countries– Soviet Union– Yugoslavia
• Missing Values– Before 1991, FIFA Ranks and Club Forms Missing– Thus, data after 1994 World Cup Final is used

Feature Selection
• # attributes are low• No algorithm used• Selection done using expert knowledge and
some statistical tools

Population vs Success
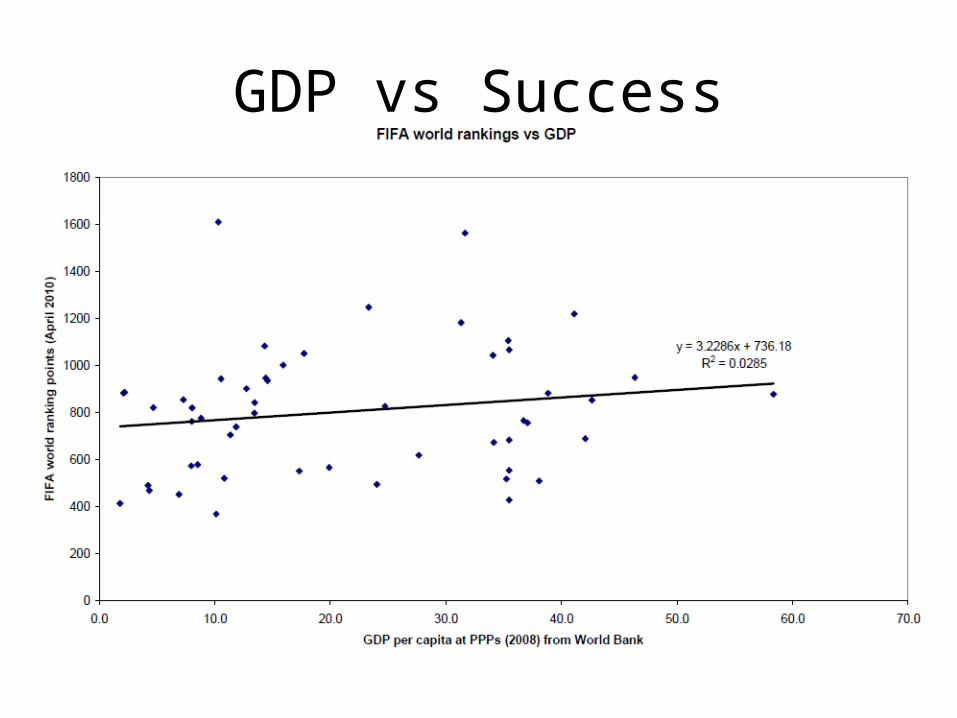
GDP vs Success

Feature Selection
• Remove population and GDP• 13 attributes left
Missing Values Handling
• Two different tables• One with no missing value handling operation– Simply remove rows with missing values
• The other with using average for missing values
Discretization - Normalization
• Discretization is done for decision tree and bayesian classifiers
• Normalization is done for SVM, Neural Network and k-NN classifiers

Data Visualization
• Correlation Matrix

Data Visualization
• Box Plot

Data Visualization
• Scatter Plot: Host vs Result
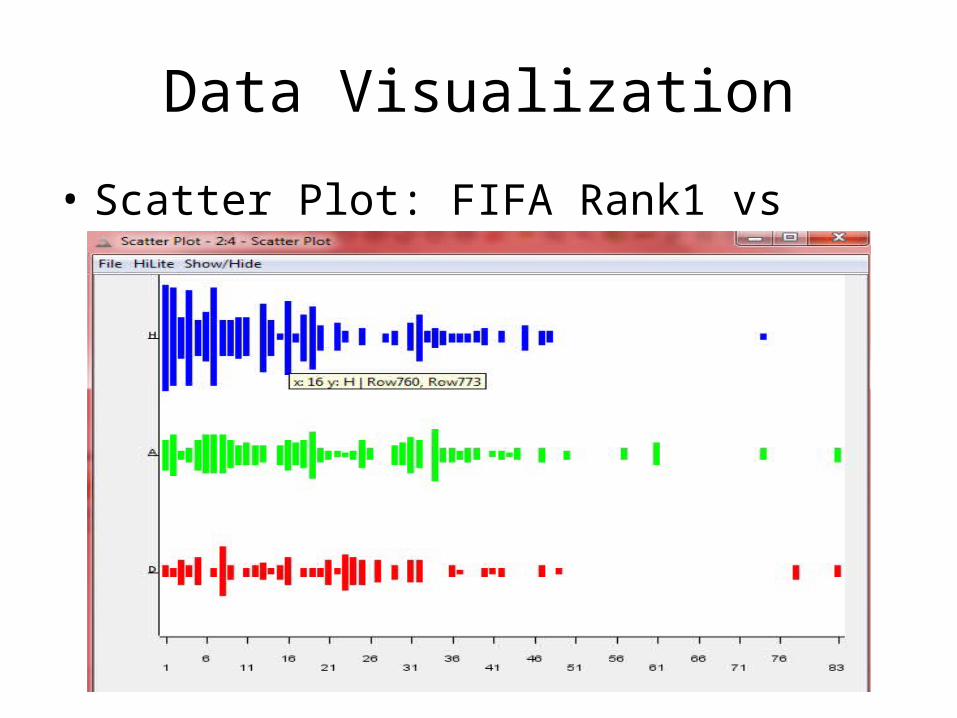
Data Visualization
• Scatter Plot: FIFA Rank1 vs Result

Modelling
• For modelling each classiffier is tested with following different parameters– 5 Fold Cross Validation– 10 Fold Cross Validation– Random Sampling– Stratified Sampling
• Also discretization and normalization are done before classification

KNIME - Modelling
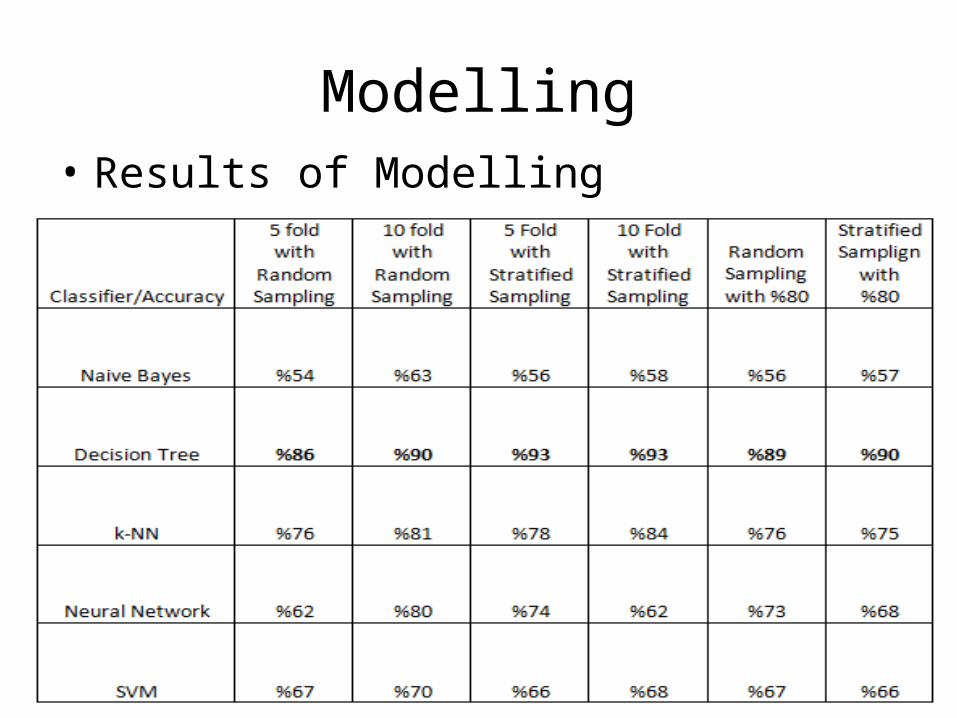
Modelling• Results of Modelling

Modelling
• Decision Tree gives best result!• K-NN gives second best, while others have
poor classification• Stratified Sampling is generally better than
random sampling• 10 fold is generally better than 5 fold
Decision Tree

Decision Tree
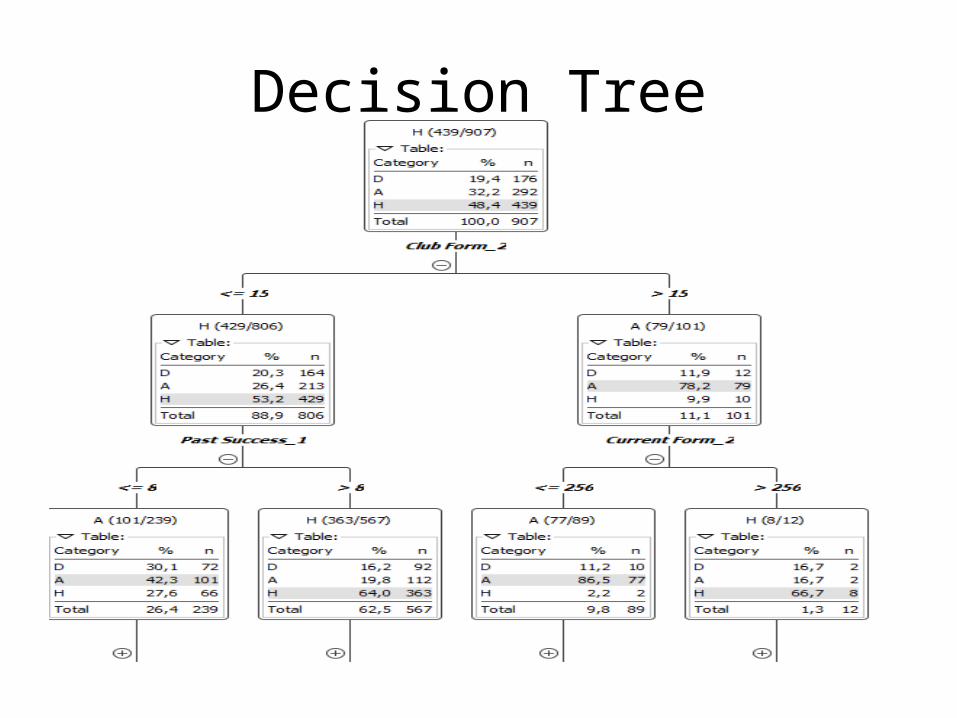
• Tree model indicates the order of attribute importance as follows:1- Club Form2- Current Form3- Past Success4- Host Information

Regression Tree
• For Regression, regression tree is used in WEKA– The mean absolute error for score1 is 0.43– The mean absolute error for score2 is 0.38
• The errors are high as expected.
Association Rules
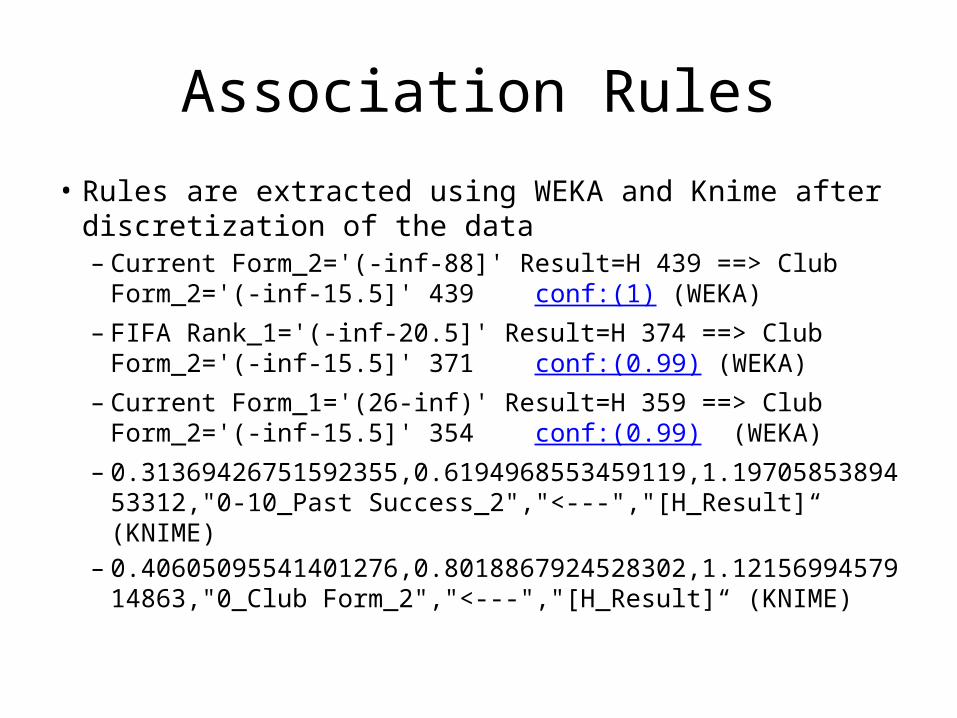
• Rules are extracted using WEKA and Knime after discretization of the data– Current Form_2='(-inf-88]' Result=H 439 ==> Club Form_2='(-
inf-15.5]' 439 conf:(1) (WEKA)– FIFA Rank_1='(-inf-20.5]' Result=H 374 ==> Club Form_2='(-inf-
15.5]' 371 conf:(0.99) (WEKA)– Current Form_1='(26-inf)' Result=H 359 ==> Club Form_2='(-
inf-15.5]' 354 conf:(0.99) (WEKA)– 0.31369426751592355,0.6194968553459119,1.19705853894
53312,"0-10_Past Success_2","<---","[H_Result]“ (KNIME)– 0.40605095541401276,0.8018867924528302,1.12156994579
14863,"0_Club Form_2","<---","[H_Result]“ (KNIME)
Conclusion
• It is hard to collect data manually!• The attributes I come up with are better than
FIFA rank, so be careful FIFA• To sum up, club form is the most important
factor for a country to be successful in World Cup Finals
• After that, current form, past success and host information come
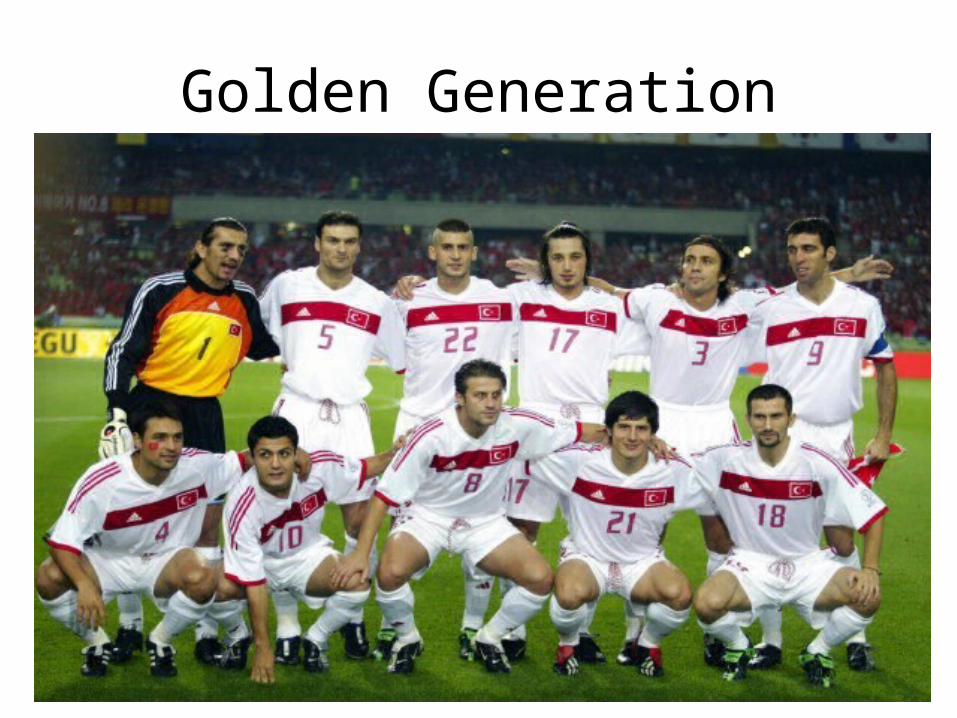
Golden Generation

Golden Generation
Future Work
• The more number of players from a same club in a particular country, the more likely that country will be successful in World Cup Finals
• Another data analysis would be on that issue

THANK YOU FOR LISTENING.
ANY QUESTIONS?