Analysis of Tryptic Digests of a Monoclonal Antibody and ... · Analysis of Tryptic Digests of a...
6
Analysis of Tryptic Digests of a Monoclonal Antibody and an Antibody-Drug Conjugate with the Agilent 1290 Infinity II LC Application Note Authors Gerd Vanhoenacker, Mieke Steenbeke, Isabel Vandenheede, Pat Sandra, and Koen Sandra Research Institute for Chromatography President Kennedypark 26 B-8500 Kortrijk Belgium Udo Huber and Sonja Schneider Agilent Technologies, Inc. Waldbronn, Germany Biopharmaceuticals and Biosimilars Abstract An Agilent 1290 Infinity II LC in combination with an Agilent AdvanceBio Peptide Map column was used to analyze tryptic digests of the monoclonal antibody (mAb) trastuzumab, or trade name Herceptin, and the antibody-drug conjugate (ADC) ado-trastuzumab emtansine, or trade name Kadcyla. The use of the highly efficient Agilent V380 Jet Weaver mobile phase mixer reduced the baseline noise caused by the trifluoroacetic acid (TFA) modifier significantly, enabling detection of low abundant peptides by UV at 214 nm. By modifying the gradient steepness, peak capacities of approximately 300, 450, and 900 could be obtained for total analysis times of 25, 45, and 205 minutes, respectively.
Transcript of Analysis of Tryptic Digests of a Monoclonal Antibody and ... · Analysis of Tryptic Digests of a...

Analysis of Tryptic Digests of a Monoclonal Antibody and an Antibody-Drug Conjugate with the Agilent 1290 Infinity II LC
Application Note
AuthorsGerd Vanhoenacker, Mieke Steenbeke, Isabel Vandenheede, Pat Sandra, and Koen Sandra Research Institute for Chromatography President Kennedypark 26 B-8500 Kortrijk Belgium
Udo Huber and Sonja Schneider Agilent Technologies, Inc. Waldbronn, Germany
Biopharmaceuticals and Biosimilars
AbstractAn Agilent 1290 Infinity II LC in combination with an Agilent AdvanceBio Peptide Map column was used to analyze tryptic digests of the monoclonal antibody (mAb) trastuzumab, or trade name Herceptin, and the antibody-drug conjugate (ADC) ado-trastuzumab emtansine, or trade name Kadcyla. The use of the highly efficient Agilent V380 Jet Weaver mobile phase mixer reduced the baseline noise caused by the trifluoroacetic acid (TFA) modifier significantly, enabling detection of low abundant peptides by UV at 214 nm. By modifying the gradient steepness, peak capacities of approximately 300, 450, and 900 could be obtained for total analysis times of 25, 45, and 205 minutes, respectively.

2
Various mobile phase mixers were compared:
• Agilent Jet Weaver mixer, both 35 and 100 µL configurations were tested (G4220-60006)
• Agilent High-Performance Jet Weaver mixer, 380 µL (G4220-60012)
Samples and sample preparationTrastuzumab (Herceptin) and ado-trastuzumab emtansine (Kadcyla) were obtained from Roche (Basel, Switzerland).
A 100 µg amount of protein, diluted in 0.05 % Rapigest/100 mM Tris-HCl, pH 8, was reduced at 60 °C for 30 minutes by the addition of 5 mM dithiothreitol, and alkylated at 37 °C for 1 hour by adding 10 mM iodoacetamide. Trypsin was subsequently added at an enzyme-to-substrate ratio of 1:25 (w:w). Digestion proceeded for 16 hours at 37 °C. The final concentration was 0.5 µg/µL.
ExperimentalInstrumentationAn Agilent 1290 Infinity II LC was used, comprising:
• Agilent 1290 Infinity II High Speed Pump (G7120A)
• Agilent 1290 Infinity II Multisampler (G7167B)
• Agilent 1290 Infinity II Multicolumn Thermostat (G7116B)
• Agilent 1290 Infinity II Diode Array Detector (G7117B) equipped with a 10-mm flow cell
IntroductionMonoclonal antibodies (mAbs) have emerged as important therapeutics for the treatment of cancer and autoimmune diseases, among others1,2. The successes of mAbs have triggered the development of various next-generation formats including antibody-drug conjugates (ADCs), which combine a specific mAb and a cytotoxic drug by a stable linker1,2. The promise of ADCs is that highly toxic drugs can selectively be delivered to tumor cells, thereby substantially lowering side effects typically experienced with classical chemotherapy. Peptide mapping is an important methodology in the analysis and characterization of these molecules. Hundreds of peptides with varying physicochemical properties present in a wide dynamic concentration range exist in mAb and ADC tryptic digests, demanding the best in terms of separating power. This Application Note describes how an Agilent 1290 Infinity II LC in combination with an Agilent AdvanceBio Peptide Map column is successfully applied to tackle these challenging separations.
Method parametersParameter ValueColumn Agilent AdvanceBio Peptide Map column, 2.1 × 250 mm, 2.7 µm (p/n 651750-902)Mobile phase A) 0.05 % TFA in water/acetonitrile 99:1 (v:v)
B) 0.045 % TFA in acetonitrileFlow rate 0.35 mL/minGradient 0 to 60 %B in various gradient slopes (see peak capacity)
60 to 90 %B in 0.5 minutes and hold for 4.5 minutes 7 minutes post time at 0 %B
Example for 40 minutes gradient: 0 to 40 minutes – 0 to 60 %B40 to 40.5 minutes – 60 to 90 %B 40.5 to 45 minutes – 90 %B
Temperature 60 °CInjection 5 µL
Needle wash flush port, 5 seconds, 0.05 % TFA in water/acetonitrile 20:80 (v:v)Detection Signal 214/4 nm, Reference 360/60 nm
Signal 252/4 nm, Reference 360/60 nm (for ADC) >0.025 minutes (0.5 seconds response time) (10 Hz)

3
Results and DiscussionAgilent AdvanceBio Peptide Map columnThe Agilent AdvanceBio Peptide Map column is packed with 2.7 µm superficially porous C18 particles with 120Å pore size. It is a state-of-the-art column for peptide mapping, enabling high-resolution separations in short analysis times. Figure 1 shows the results for a fast analysis (25 minutes total analysis time) of a tryptic digest of Herceptin.
Agilent Jet Weaver mixersFor comprehensive peptide mapping, the system should be able to detect high as well as low abundant peptides. Peptide mapping is generally carried out with UV detection at 214 nm and a water/acetonitrile mobile phase containing trifluoroacetic acid (TFA) because of its beneficial effects on peptide retention and peak shape. It is known that these conditions contribute to increased baseline noise due to the UV absorption of the TFA modifier3. The noise will depend on column dimensions and flow, gradient slope, and system gradient formation.
When mobile phase mixing is inadequate, small variations present in the mobile phase composition may persist after passage through the column, and reach the detector. In the case of TFA, which has significant UV absorbance at low wavelengths (for example, 214 nm), small fluctuations in TFA concentration and water/acetonitrile ratio will be visible with UV or DAD. Excessive noise can be tackled by increasing the mobile phase mixing performance to stabilize solvent composition as much as possible.
The impact of mixing has been tested with the selected column and samples by comparison of three state-of-the-art Jet Weaver mobile phase mixers.
• Agilent V35 Jet Weaver: internal volume of 35 µL, most commonly used because of the small impact on delay volume
Figure 1. Analysis of a Herceptin tryptic digest, 20-minute gradient, UV detection at 214 nm.
min2 4 6 8 10 12 14 16 18
mAU
0
50
100
150
200
250
Figure 2. Analysis of a blank solution with an Agilent V35 (green), Agilent V100 (red), and Agilent V380 (blue) Jet Weaver mixer, 40-minute gradient, UV detection at 214 nm.
min5 10 15 20 25 30 35 40
mAU
20
25
30
35
40
45
50
55
60
Agilent V35 Jet Weaver
Agilent V100 Jet Weaver
Agilent V380 Jet Weaver
• Agilent V100 Jet Weaver: internal volume of 100 µL, used for applications that require higher mixing performance and low delay volume
• Agilent V380 High-Performance Jet Weaver: internal volume of 380 µL, used for applications that need best mixing
Figure 2 shows the results of a blank (mobile phase A) injection with a 40-minute gradient carried out with the various Jet Weaver mixers. It is clear
that despite the excellent behavior of the V35 Jet Weaver for most analyses, its performance for the detection of low-level compounds under these particular conditions is poor. Increasing the mixing volume to 100 µL significantly improves baseline stability, and by installing the 380 µL mixer, the noise caused by TFA is nearly eliminated. It is striking how the small system peaks present in the blank analysis (retention time 23 to 27 minutes) are not detectable with the V35 Jet Weaver whereas they are easily visible with the V380 mixer. Therefore, the V380 High-Performance Jet Weaver was selected for further analyses.
4
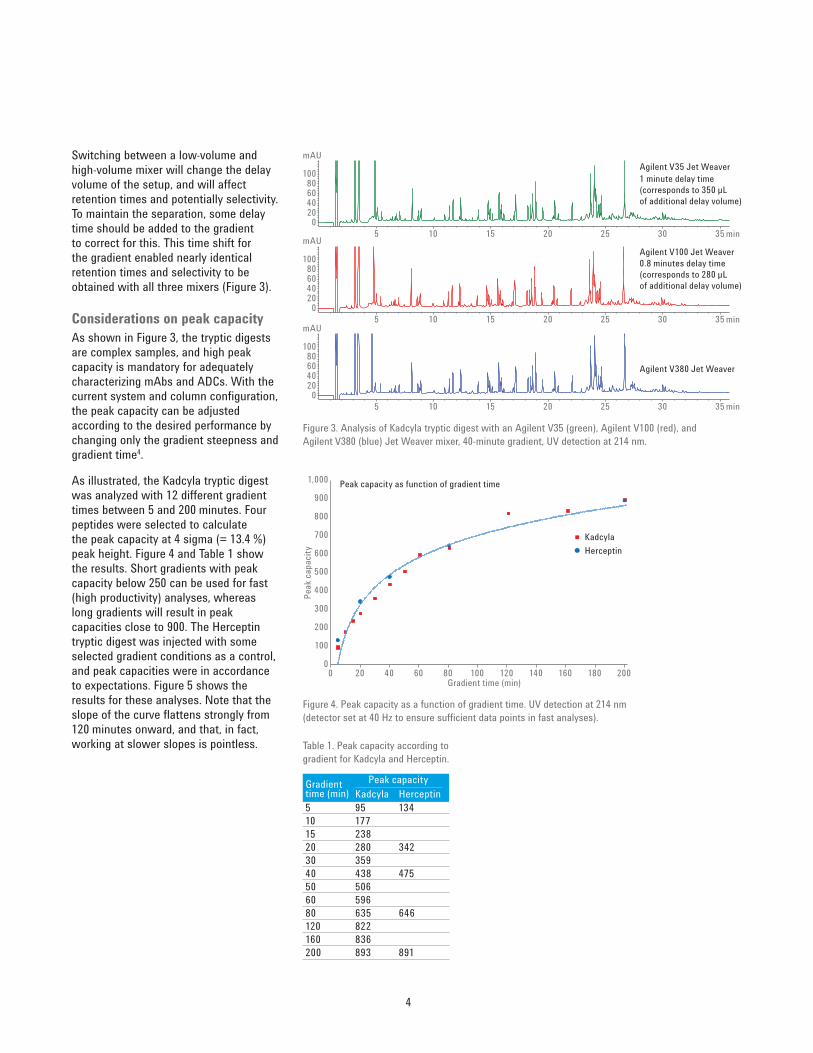
Switching between a low-volume and high-volume mixer will change the delay volume of the setup, and will affect retention times and potentially selectivity. To maintain the separation, some delay time should be added to the gradient to correct for this. This time shift for the gradient enabled nearly identical retention times and selectivity to be obtained with all three mixers (Figure 3).
Considerations on peak capacityAs shown in Figure 3, the tryptic digests are complex samples, and high peak capacity is mandatory for adequately characterizing mAbs and ADCs. With the current system and column configuration, the peak capacity can be adjusted according to the desired performance by changing only the gradient steepness and gradient time4.
As illustrated, the Kadcyla tryptic digest was analyzed with 12 different gradient times between 5 and 200 minutes. Four peptides were selected to calculate the peak capacity at 4 sigma (= 13.4 %) peak height. Figure 4 and Table 1 show the results. Short gradients with peak capacity below 250 can be used for fast (high productivity) analyses, whereas long gradients will result in peak capacities close to 900. The Herceptin tryptic digest was injected with some selected gradient conditions as a control, and peak capacities were in accordance to expectations. Figure 5 shows the results for these analyses. Note that the slope of the curve flattens strongly from 120 minutes onward, and that, in fact, working at slower slopes is pointless.
Figure 3. Analysis of Kadcyla tryptic digest with an Agilent V35 (green), Agilent V100 (red), and Agilent V380 (blue) Jet Weaver mixer, 40-minute gradient, UV detection at 214 nm.
mAU
020406080
100
mAU
020406080
100
Agilent V380 Jet Weaver
Agilent V100 Jet Weaver0.8 minutes delay time (corresponds to 280 µL of additional delay volume)
min5 10 15 20 25 30 35
min5 10 15 20 25 30 35
min5 10 15 20 25 30 35
mAU
020406080
100Agilent V35 Jet Weaver1 minute delay time (corresponds to 350 µL of additional delay volume)
Figure 4. Peak capacity as a function of gradient time. UV detection at 214 nm (detector set at 40 Hz to ensure sufficient data points in fast analyses).
0
100
200
300
400
500
600
700
800
900
1,000
0 20 40 60 80 100 120 140 160 180 200Gradient time (min)
Peak capacity as function of gradient time
Peak
cap
acity
KadcylaHerceptin
Table 1. Peak capacity according to gradient for Kadcyla and Herceptin.
Gradient time (min) Kadcyla Herceptin5 95 13410 17715 23820 280 34230 35940 438 47550 50660 59680 635 646120 822160 836200 893 891
Peak capacity

5
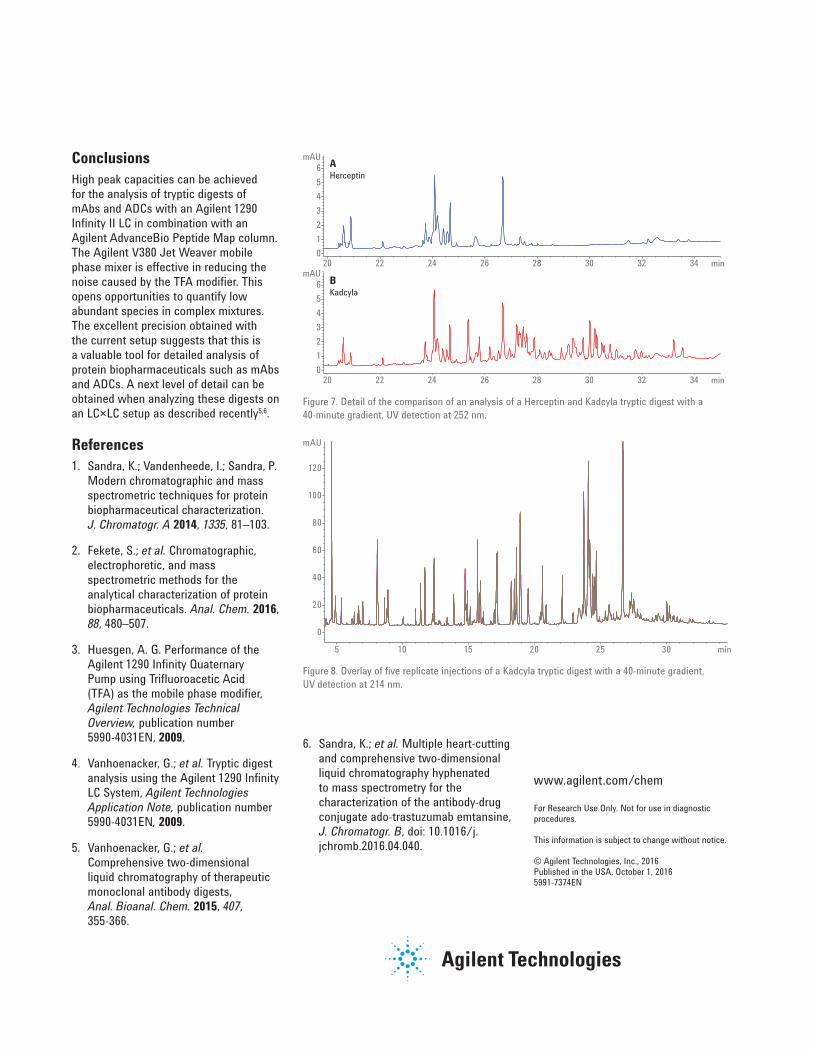
Further comments on the analysis of the Herceptin and Kadcyla digestsA 40-minute gradient resulted in a peak capacity of approximately 450, and these conditions, a good compromise between analysis time and separation performance, were used to highlight the difference between the mAb and the ADC. The protein sequence of Kadcyla is identical to Herceptin; the difference is in the conjugation of the cytotoxic agent emtansine to lysine residues. Figure 6 shows an overlay of both samples, with detection at 214 nm and 252 nm. Overall, the chromatograms are similar except for the cluster of peaks eluting late in the gradient (between 25 and 35 minutes). These are peptide-drug conjugates all containing emtansine. The complexity stems from the fact that a high number of lysine residues are available for conjugation. Figure 7 shows a detail of the chromatograms recorded at 252 nm. The addition of the drug to the peptide increases hydrophobicity and, therefore, retention. Since this cytotoxic agent has a UV absorbance at 252 nm, the conjugates are better observed with the detector set at this wavelength. The repeatability of the developed method was evaluated by five replicate injections of the Kadcyla tryptic digest. The overlay in Figure 8 shows that the injection and retention time precision are excellent.
min10 20 30 40 50 60 70
min10 20 30 40 50 60 70
min10 20 30 40 50 60 70
min10 20 30 40 50 60 70
mAU
050
100150
mAU
050
100150
mAU
050
100150
mAU
050
100150
Figure 5. Analysis of a Herceptin tryptic digest with a 20, 40, 80, and 120-minute gradient, UV detection at 214 nm. Note, for comparison, that the y-scale was increased with the ∆-gradient factor.
Figure 6. Comparison of analysis of a Herceptin (blue) and Kadcyla (red) tryptic digest with a 40-minute gradient, UV detection 214 nm and 252 nm.
min0 5 10 15 20 25 30
min0 5 10 15 20 25 30
mAU
0
50
100
150
200
A
B
214 nmHerceptinKadcyla
mAU
0
2
4
6
8
10
12
252 nmHerceptinKadcyla
www.agilent.com/chem
For Research Use Only. Not for use in diagnostic procedures.
This information is subject to change without notice.
© Agilent Technologies, Inc., 2016 Published in the USA, October 1, 2016 5991-7374EN
min20 22 24 26 28 30 32 34
min20 22 24 26 28 30 32 34
mAU
0123456
mAU
0123456
Herceptin
Kadcyla
A
B
Figure 7. Detail of the comparison of an analysis of a Herceptin and Kadcyla tryptic digest with a 40-minute gradient, UV detection at 252 nm.
min5 10 15 20 25 30
mAU
0
20
40
60
80
100
120
Figure 8. Overlay of five replicate injections of a Kadcyla tryptic digest with a 40-minute gradient, UV detection at 214 nm.
ConclusionsHigh peak capacities can be achieved for the analysis of tryptic digests of mAbs and ADCs with an Agilent 1290 Infinity II LC in combination with an Agilent AdvanceBio Peptide Map column. The Agilent V380 Jet Weaver mobile phase mixer is effective in reducing the noise caused by the TFA modifier. This opens opportunities to quantify low abundant species in complex mixtures. The excellent precision obtained with the current setup suggests that this is a valuable tool for detailed analysis of protein biopharmaceuticals such as mAbs and ADCs. A next level of detail can be obtained when analyzing these digests on an LC×LC setup as described recently5,6.
References1. Sandra, K.; Vandenheede, I.; Sandra, P.
Modern chromatographic and mass spectrometric techniques for protein biopharmaceutical characterization. J. Chromatogr. A 2014, 1335, 81–103.
2. Fekete, S.; et al. Chromatographic, electrophoretic, and mass spectrometric methods for the analytical characterization of protein biopharmaceuticals. Anal. Chem. 2016, 88, 480–507.
3. Huesgen, A. G. Performance of the Agilent 1290 Infinity Quaternary Pump using Trifluoroacetic Acid (TFA) as the mobile phase modifier, Agilent Technologies Technical Overview, publication number 5990-4031EN, 2009.
4. Vanhoenacker, G.; et al. Tryptic digest analysis using the Agilent 1290 Infinity LC System, Agilent Technologies Application Note, publication number 5990-4031EN, 2009.
5. Vanhoenacker, G.; et al. Comprehensive two-dimensional liquid chromatography of therapeutic monoclonal antibody digests, Anal. Bioanal. Chem. 2015, 407, 355-366.
6. Sandra, K.; et al. Multiple heart-cutting and comprehensive two-dimensional liquid chromatography hyphenated to mass spectrometry for the characterization of the antibody-drug conjugate ado-trastuzumab emtansine, J. Chromatogr. B, doi: 10.1016/j.jchromb.2016.04.040.