ANALYSIS OF THE TEXAS RETAIL AND …afcerc.tamu.edu/publications/Publication-PDFs/MRC...
43
ANALYSIS OF THE TEXAS RETAIL AND PROCESSOR 11ARKETS FOR PRODUCTS. A Report to the Texas Turkey Federation November, 1969 From the Texas Agricultural 1!arket Research and Development Center Department of Agricultural Economics and Sociology Texas A&M University Texas Agricultural Texas Agricultural Extension Service Experiment Station i
Transcript of ANALYSIS OF THE TEXAS RETAIL AND …afcerc.tamu.edu/publications/Publication-PDFs/MRC...
ANALYSIS OF THE TEXAS RETAIL AND PROCESSOR 11ARKETS FOR TUR~EY PRODUCTS
A Report to the Texas Turkey Federation
November 1969
From the Texas Agricultural 1arket Research and Development Center
Department of Agricultural Economics and Sociology Texas AampM University
Texas Agricultural Texas Agricultural Extension Service Experiment Station
i
THE TEXAS AGRICULTURAL MARYillT RESEARCH AND DEVELOPMENT CENTER
The purpose of the Center is to be of service to agricultural proshy
ducers groups and organizations as well as processing and marketing
firms in the solution of present and emerging marketing problems Emshy
phasis is given to research and educational activities designed to imshy
prove and expand the markets for Texas food and fiber products
The Center operates as a combined education and research service
of the
TEXAS AGRICULTURAL EXTENSION SERVICE
and
TEXAS AGRICULTURAL EXPERIHENT STATION
Hembero of the Texas Agricultural ~Iarkct Research and Development Center
STAFF ASSOCIATE STAFF Robert E Branson PhD Edward Uvacek PhD
Coordinator Livestock William E Black PhD John Seibert
Associate Coordinator Grains Chan C Connolly PhD Johnny Feagan John P Nichols PhD Organization Thomas L Sporleder PhD Charles Baker Randall Stelly PhD Cotton and Foreign Trade H R Roberts
Research Associate
ACKNO~~EDG~lliNT
The authors wish to express their appreciation to Dr
David B Mellor of the Poultry Science Department Texas
Aamp~1 University for his many contributions to the content of
this report Also the authors express appreciation to H R
Roberts W T Falls and W R Wilson all of the Department
of Agricultural Economics and Sociology Texas AampM University
for their assistance with the field work during the course of this
study
This research was conducted with the assistance of a grant
from the Texas Turkey Federation Without the help of various
rederation members this study would not have been possible
Mr David Ozment former ~xecutive secretary of the Federation
materially aided in the planning and comDletion of this study
ii
TABLE OF CONTENTS
Page
I INTRODUCTION 1middot II THE RESEARCH DESIGN middot bull bull 5
III RESULTS OF THE RETAIL OUTLET SURVEY 8
middot Commercial Eating Establishments 8
Supermarkets middot 13
All Retail Outlets bull bull 15
~1iscellaneous Survey Results middot bull bull bull bull 15
IV RES ULTS OF THE PROCESSOR SURVEY middot bull 16
Texas Processors middot bull bull bull bull bull bull 16
Texas Processing VS U S Processing bull bull 20
V SUNNARY CONCLUSIONS t A~D IMPLICATIONS bull 24
middotRetail Phase 24
Processor Phase bull 26middot middot VI APPENDICES 28middot
Appendix A bull bull bullbullbull 29middot middot Appendix B bull bull 38bull bull middot
iii
Table Number
1
2
3
4
5
6
7
8
9
10
11
12
TABLES
PRODUCTION OF TURKEYS IN TEXAS SELECTED YEARS 1945-68
SA~LE DESIGN FOR TURKEY RETAIL HAPKET SURVEY IN TEXAS
MEAN AVERAGE NUHBER OF POUNDS OF TURKEY SERVED PER ESTABLISHHENT 1968 TEXAS BY CITY SIZE BASED ON SAMPLE SURVEY
TOTAL NUMBER OF EATING ESTABLISHMENTS BY CITY SIZE IN TEXAS BY TYPE A~D PERCENT THAT SERVE TURKEY 1968
APPROXP-fATE NUMBER OF POUNDS 01 TUPJCEY SERVED THROUGH ALL EATING ESTABLISHMENTS IN TEXAS 1968
PERCENT OF EACH MAJOR TYPE OF TURT(EY PURCHASED BY CQIHERCIAL EATING ESTABLISH~1ENTS IN TEXAS 1968
TYPE OF TURKEY PURCHASED BY FOOD SUPERMARKETS TEXAS t 1968
GEOGRAPHIC DESTINATION OF TURKEY PROCESSED IN TEXAS BY TYPE 1968
FIRST RECEIVERS OF TURKEY PROCESSED IN TEXAS BY TYPE 1968
COHPOSITION OF TURKEY PROCESSOR OUTPUT TEXAS 1968
UNITED STATES TURKEY UTILIZATION ABSOLUTE AND AS PERCENTAGE OF TOTAL CERTIFIED READY-To-COOK WEIGHT 1963-1968
mUTED STATES TURKEY UTILIZATION t ABSOLurE AND AS PERCENTAGE OF TOTAL CERTIFIED READY-To-COOK WEIGHT J~~UARY TO JUNE 1~63-1969
iv
Page Number
2
6
9
10
11
12
14
17
18
19
21
22
ANALYSIS OF THE TEXAS RETAIL AND PROCESSOR MARKETS FOR TURKEY PRODUCTS
1Thomas L Sporleder and Robert E Branson
I INTRODUCTION
Texas has been a major turkey production area for many years Its
relative rank nationally however has undergone change As of 1945
and 1950 Texas was the second largest producer with a total of 46 and
44 million birds respectively In 1951 output declined to 32 million
birds and the states national rank dropped to fifth Since that time
it has remained near the same rank compared to other states although
production has expanded to the 5 to 8 million bird range Table 1 Thus
in recent years market outlets for expanded production have had to be
found
Compounding the above market expansion problem has been recent
shifts in the market for turkey products Consumers have become increasshy
ingly interested in convenience food products--and turkey is no exception
As will be cited later in more detail the market for turkey parts and
for further processed turkey products has grawn steadily and appreciably
in the United States over the last five years
Awareness of the foregoing situation motivated the Texas Turkey
Federation to request an analysis of the market for turkey products of
all types in Texas This was viewed as a first step in analyzing the
1 Assistant Professor and Professor respectively Department of Agricultural Economics and Texas Agricultural Harket Research and Del1elopment Center
2
TABLE 1
PRODUCTI ON OF TURKEYS IN TEXAS SELECTED YEARS 1945-68
Year Number of Texas Rank Among Birds U S States
1945
1950
1951
1952
1953
1954
1955
1960
1961
1962
1963
1964
1965
1966
1967
1968
Thousands
4602
4423
3187
3677
3383
3006
3018
3929
4784
4074
4577
4858
5272
6397
8071
7205
2
2
5
4
5
5
5
7
7
5
6
6
6
6
5
Not Available
Source U S Department of Agriculture Agricultural Statistics Washington DC 1968
3
existing marketing problems as well as onportunities that confront the
industry Afterwards additional steps could be taken to improve marshy
ket knowledge in or out-of-state to assist in formulating an effective
marketing strategy for Texas turkeys
Interest in market information was further strengthened by the fact
that Texas producers make a sizable financial contribution toward national
turkey promotion programs It was felt advisable to assess the relative
need for local versus out-of-state market promotion endeavors and the
direction either or both should take
The Texas Turkey Federation sought the assistance of the Texas
Agricultural Experiment Station in obtaining the above noted Texas marshy
ket analysis The Texas Agricultural Market Research and Development
Center at Texas AamplJ University meanwhile was established and the
research project was assigned to it for design and completion This is
the final report of the research
Texas has the prospect of remaining a major turkey producing area
in the future according to at least two analyses of interregional aspects
of turkey production and marketing One analysis by ampwden Carter and
Dean at the University of California was made in 1965 Three analytical
models were applied tvi th the result that Texas continued to be a major
1supplier of turkeys Bawden made a further extension of the above study
at the University of Wisconsin with Texas still indicated as a major
producer 2
1 D Lee Bawden H O Carter and G W Dean Interregional Competition in the United States Turkey Industry Hi1gardia-Journa1 of Agricultural Science Vol 37 No 13 University of California June 1966
2 D Lee Bawden The Cost of Producing Turkeys A Comparison Among States Bulletin 558 University of Wisconsin June 1968
4
Although interregional competition models have become quite sophisshy
ticated in design and computers make their use more feasible than before
some limitations due to design simplification remain Nonetheless the
broad indications generally are valid so long as the production and transshy
portation costs used reasonably reflect existing conditions
5
II TIm PESEARCH DESlGN
Design of research to measure and analyze a product market for an
area as large as Texas is a formidable task This is especially so if it
is to be accomplished at a reasonable cost Several alternatives were
considered with final adoption of a plan to intervieH a state-vide samnle
of retail food supermarkets and food chains in order to measure the relashy
tive importance of various turkey product retail sales A further phase
included intervie1ving of the food buyer or manager of a statetvide sample
of restaurants and cafeterias as well as food service operations of hotels
and motels A third phase waS a survey of wholesale brokers and
distributors
Following the above a complete survey was made of all turkey proshy
cessing facilities located in Texas with the exception of a few minor
specialized operations A total of twenty-one tvere included
For the retail food outlet survey all major metropolitan areas were
included plus a nrobability sample of the remaining cities As noted in
Table 2 this resulted in a total of 31 cities being selected for survey
interviews A total of 878 retail establishments were represented in the
completed survey
It is not possible within the framework of this repo~t7 to go into
a further analysis of the statewide retail food handlers sampling design
Examination of the sample 1n terms of two major classifications--the number
of establishments in the four major cities of Dallas Ft lJorth Houston
and San Antonio versus the remainder of the state reveals a near optimum
balance in the sampleJ
6
TABLE 2
SAMPLE DESIGN FOR TURKEY RETAIL HARKET SURVEY IN TEXAS
Number Included in SampleType Cities Es tab lishments
Co leted
Restaurants
Cafeterias
Hotels and motels
31
18
31
100
35
99
102
22
84
Independent supermarkets
Chain supermarkets
TOTAL
31
99 90
580
878
All major chain supermarkets were included in the sample Informashytion ~las supplied by all central offices except in a few relatively minor cases
7
All interviews were conducted on a personal basis by staff members
of the Texas Agricultural Harket Research and Development Center and two
market research graduate students working with the Center The research
questionnaires used were designed and field tested prior to their final
adoption by the Centers staff Intervieing of retail establishments
occurred in the fall and winter of 1968-69 The turkey processors and
wholesale distributors were surveyed during the spring and early summer
of 1969
~~o deviations were made from the original research design Rather
early in the survey of wholesale distributors it became evident that the
amount of cross selling among firms that were general wholesalers and those
that were brand renresentatives nroduced a set of figures that were not
suited for the intended purpose Therefore the distributor ohase was
drop~ed from consideration
The second deviation represented an addition to the sampling procedure
In order to establish a satisfactory base from ~hich to expand the retail
survey data to a state figure a statewide telephone survey was instituted
The purpose was to determine the proportion of restaurants hotels and
motels that serve turkey To be eligible for the earlier detailed survey
of turkey product use an eating establishment had to serve turkey Thereshy
fore a count of non-serving establishments was derived from a separate
survey to fulfill that need
8
III RESULTS OF THE P~TAIL OUTLET SURVEY
Commercial Eating Establishments
A portion of the study was a survey of commercial eating establishshy
ments in Texas The basic objective was to expand the results of the
survey to a state consumption total sold through eating establishments
Restaurants hotels and motels with restaurants and cafeterias were
defined as the universe for commercial eating establishments
The sample survey included 102 restaurants 84 hotels or motels
with restaurants and 22 cafeterias for a total of 208 eating establishments
Table 3 shows the results of the survey in terms of the mean average
number of pounds served per establishment for 1968 The results are disshy
aggregated in this table on the basis of city size
In order to expand the results of the sample survey to an approxishy
mation of total state consumption through all commercial eating establishshy
ments the total number in Texas of each type establishment is multiplied
by the approximate percentage of each type that serve turkey This in
turn is multiplied by the mean average number of pounds served per estabshy
lishment with the result being an approximation of the total state conshy
sumption of turkey through all commercial eating establishments
Table 4 shows the total number of each type of commereial eating
establishment in the state and the approximate percentage of the total
that serve turkey
The information contained in Tables 3 and 4 was utilized to approxishy
mate the total number of pounds of turkey served through all eating
establishments in 1968 This estimate is presented in Table 5
9
TABLE 3
BEAN AVERAGE NUHBER OF POUNDS OF TURKEY SERVED PER ESTABLISHHENT 1968 TEXAS BY CITY SIZE BASED ON SAHPLE SURVEY
Type of Commercial City Size ~ajor City All ether Cities
---Pounds--shy
Restaurantsa
4726 1637
aHotel or Hotel uith Restaurant 5463 2082
Cafeterias 7304 6832
It Hajor city is defined as Dallas Pt Horth San Antonio and Houston
a Throughout this study restaurants were defined as retail establishments selling prepared foods and drinks for consumption on premises or for immedi~te consumption This definition conforms to the US Bureau of Census definition
Source Sample Survey
10
TABLE 4
TOTAL mIMBER OF EATING EATABLISHHENTS BY CITY SIZE IN TEXAS BY TYPE AND
PERCENT THAT SERVE TURKEY 1968
Type of Commercial (1) (2) (3) Eating Establishments Total Number of Percent of the Total Number By City Size Establishments
in Texas Total that Serve
Turkey of Establishshyments that Serve
Turkey (Column 1 times column 2)
Hajor Cit-ta
Restaurants 2167 420 910
Hotels or 1ote1sb
with Res taurants 338 890 301
Cafeterias 295 100 295
All Other Cities
Restaurants 5080 300 1524
Hotels or Motelsb
with Restaurants 927 870 807
Cafeterias 405 100 405
a Hajor city is defined as Dallas Ft Worth San Antonio and Houston
b Estimate of total number of hotels and motels with restaurants for 1968 in Texas derived from 1963 U S Bureau of Cecsus data and inshyformation from the Austin office of the Texas Hotel and i10te1 Association
Source Sample survey and estimates from U S Bureau of the Census Census of Business 1967 Retail Trade Texas BC67-RA45 U S Government Printing Office Washington DC 1969 p 45-1
11
TABLE 5
APPROXIMATE NUMBER OF POUNDS OF TURKEY SERVED THROUGH ALL
EATING ESTABLISHMENTS IN TEXAS 1968
14ean Average I Total NumberNumber ofType of Commercial Es tab lishmentsEating Establishment NUM~ er of P ouJ )f Pounds
ServedServed perin Texas that Serve Turkey Es tab lishmen t
1ajor City
4726Restaurant 910 4300660
Hotel or Hotel 5463301 1644363 with Restaurant
Cafeteria 7304295 2154680
All Other Cities
Restaurant 16371524 2494788
Hotel or Motel 2082807 1680174 with Restaurant
6832Cafeteria 405 2766960
STATE TOTAL 4242 15041625XXX
Source Tables 3 and 4
12
Of course the estimate of total state consumption in Table 5 is
not considered to be completely accurate but it does give an approximashy
tion that somewhere between 15 and 16 million pounds of turkey were served
through commercial eating establishments in Texas during 1968
Other interesting statistics from the sample survey concern the
percent of total turkey sales through commercial eating establishments
Llat was believed from Texas and the type of turkey purchased by these
establishments Based on the survey data 744 percent of total turkey
purchased by commercial eating establishments in Texas during 1968 was
believed to be Texas turkey Conversely 256 percent was believed to
be from outside the state
Table 6 shows the percent of each major type of turkey purchased
by commercial eating establishments during 1968 Note that 207 percent
of all purchases were other than whole birds
TABLE 6
PERCENT OF EACH t1AJOR TYPE OF TURKEY PURCHASED BY C011MERCIAL EATING ESTABLISHMENTS IN TEXAS 1968
Type of Turkey Percent of Purchases
Whole 793 Parts 93 Further Processed 114
One of the results of the survey that is of prime interest in the
consideration of promotional programs is that about 12 percent of all c~
mercial eating establishments except cafeterias in Texas serve turkey at
Thanksgiving and Christmas only This indicates that additional promotional
13
effort directed toward restaurants and hotels or motels vi th restaurants
could induce expansion of turkey sales through this type of retail outlet
Supermarkets
Another portion of the study was a survey of both independent and
chain supermarkets in Texas The basic objective of this survey was to
determine the percent of turkey purchases by these retail outlets that
were from Texas and also to indicate the proportion of ~urchases by
supermarkets that were whole birds as opposed to parts or further processed
The sample survey consi3ted of a total of 670 supermarkets in Texas
of which 90 were independent supermarkets and 580 chain supermarkets
The small ind~e1dent grocery stores--the so-called ~om and Pop stores-shy
and drive-ins were not included in the independent store group These
stores nationally sell between 20 and 30 percent of all food Many do
not have meat departments at all Therefore their share of the turkey
retail sales is likely less than 10 percent Sampling of these small
retail outlets was consequently ignored
Based on the sample survey data 777 percent of the total turkey
purchased by independent and chain supermarkets in Texas during 1968 was
believed to be Texas turkey The remaining 223 percent was believed to
be from outside the state
The percentage of each major type of turkey purchased by both chain
and independent supermarkets during 1968 is presented in Table 7 Note
that 128 percent of all purchases were~either parts or further processed
As previously mentioned 690 independent and chain supermarkets
were included in the sample survey There are approximately 1150 independent
14
TABLE 7
TYPE OF TURKEY PURCHASED BY FOOD SUPER1ARKETS ~ TEXAS ~ 1968
Type of Turkey Percent ojf Total Purchases
Whole 881
Parts 57
Roasts and Rolls 28
Sliced 10
Frozen Food Specialty 02
TV Dinners and Pot Pies 20
Canned 01
Other 01
Source Sample Survey
15
and chain supermarkets in Texas not including drive-ins and small grocery
stores 1 Using the sample survey information approximately 17500 pounds
of turkey were sold per supermarket in Texas during 1968 Multiplying
this average times the total number of supermarkets yields a state total
for all supermarkets of approximately 20125000 pounds This estimate as
the one for commercial eating establishments should not be considered
completely accurate
All Retail Outlets
Combining the results of the expansion to state totals for commershy
cial eating establishments and independent and chain supermarkets an
approximate total of between 35 and 37 million pounds of turkey middotmiddot~Cre sold
through these outlets in 1968 This total of course does not include
turkey consumed in various institutions (such as hospitals or school
lunch programs) or in-plant cafeterias
Miscellaneous Survey Results
Other results of the survey are reported in the Appendix of this
report These results are primarily concerned with the attitudes of
the managers and meat buyers in the retail establishments surveyed
1 1968 Director of Sury~rmcrets an Crocory Chains Business Guides Inc i7ew York Nep York
16
IV RESULTS OF THE PROCESSOR SURVEY
Texas Processors
A total of 21 Texas processors were surveyed during 1969 in order
to determine 1) where turkeys processed in Texas were being shipped 2) the
composition of the output of Texas processing plants and 3) whether or
not they were being shipped to ~holesalers retail out lets or further
processors
Approximately 58 percent of all turkey processed in Texas was shipped
outside Texas Table 8 This is a weighted mean average percentage
based upon results of the survey of processors
The percent of turkey processed in Texas that was shipped to various
types of first receivers is noted in Table 9 Whereas about 80 percent
of the individually wrapped bulk turkey is going to retail outletsvirshy
tually all of the bulk pack whole turkey is moving to further processors
Approximately 52 percent of the parts and 16 percent of the further proshy
cessed is sold directly to retail outlets It is important to note that
316 percent of all turkey processed in Texas is going to further proshy
cessors while 561 percent is gOing directly to a retailer
The composition of output of all turkey processing plants in Texas
is reported in Table 10 Nearly 15 percent of all output is further
processed turkey products This 15 percent includes smoked whole turkeys
Of the total further processed output reported from the survey approximately
25 percent was smoked whole turkey which was nearly 4 percent of total
output of all processors
Information W8S also obtained from the survey concerning the source
of processors raw product procurement During 1968 994 percent of
Texas processormiddots supply came from Texas
c
17
TABLE 8
GEOGRAPHIC DESTINATION OF TURKEY PROCESSED IN TEXAS t BY TYPE 1968
Shi22ed To Tyne of Turkey Texas Outside Texas
Whole Turkey 475a 525 Individually Wrapped 494 506 Bulk Pack 426 574
Parts 349 651
bFurther Processed 141 859
All Turkeyc 446 554
a Percentages cross total to 100 percent
b Includes smoked turkey
Weighted mean average of Ylho1e parts t and further processed
Source Processor Survey
18
c
TABLE 9
P8i 1ECEI~rtRS OF TUU(Y PROCESSED IN TEXAS BY TYPE 1965 a
T2e of TurkeI Broker or Wholesaler
ShiEEed To Retail Further Outlet Processed bother
---Percent--shy
Whole Turkey Total Individually Wrapped Bulk Pack
85 119 02
567 803 04
337 61
993
11 17 01
100 100 100
Parts 65 523 201 211 100
Further Processedc 01 164 00 835 100
All Turkeyd 81 561 316 42 100
a Percentages in this table do not include one processor in Texas who declined to provide information
b Mostly exports from the United States and sales to institutions
Includes smoked turkey
d Weighted mean average of whole parts and further processed9
Source Processor Survey
19
TABLE 10
COMPOSITION OF TURKEY PROCESSOR OUTPUT TEXAS 1968
Ype of Turkey
Whole
Parts
All Further Processed Smoked Whole Other Further Processed
Percent of Total Outputa
782
70
148 37
111
a All percentages are based upon reports of several firms and thereshyfore do not reflect the operations of anyone firm
Source Processor Survey
20
Texas Processing VB U S Processing
The results of the survey of Texas processors can easily be compared
with the national situation The output of turkey bv all federally inshy
spected turkey processing plants is reported by the U S Department of
Agriculture by months and annually These data reveal some significant
information
Total turkey output in the Unicd States increased by about 25 pershy
cent between 1963 and 1968 Table 11 The largest percentage growth
in the total turkey market has occurred in turkey parts and next is
further processed turkey products The share of the total market accounted
for by turkey parts and further processed items has advanced during recent
years In 1963 parts and further processed composed 206 percent of
the total certified while in 1968 they composed 356 percent of the
total certified
Since annual data include the Thanksgiving and Christmas season a
more complete picture of the increasing importance of parts and further
processed over the last fetv years may be gained from data for the first
6 months of each year Table 12 For the January-June period of 1963
parts and further processed items composed 640 percent of the total
turkey certified For the same period of 1968 they composed 914 pershy
cent of the total certified Notice also that the general trend of
whole birds as a percent of total certified has been dOvmward since 1963
The upward trend in parts and further processed turkey items for
the United States in recent years is clearly evident from Tables 11 and
12 The data in these tables also suggest that for other than the holi shy
day season the parts and further proces3ed segment of the total market
is here the greatest grOtth is occurring
--- ----Year
1963
1964
1965
1966
1967
1968
Increase 1963-1968
I Cut-up As Tfuole asFurther Processed
Percentage Of Percentage Of TotalFurther As Percentage Of Processed ()Whole Total Certified CertifiedCut-up Total Certified Total Certi fied
1000 11 bull
48578
6024i
97245
121337
114540
135077
1781
TABLE 11
UNITED STATES TUFKEY UTILIZATION ABSOLUTE AND M PERCENTAGE OF TOTAL CERTIFIED READY-TO-COOK WEIGHT 1963-1968
Percent 1000 Percent 1000 Percent 1bs 1bs
42 190694 164 924500 794
48 211009 168 981900 784
73 252935 190 979900 737
82 334732 226 1021800 692
69 318146 191 1232300 740
93 382754 263 937767 644
1007 14
1000 1bs
1163800 100
1253200 100
1330100 100
1477 900 100
1665000 11)0
1455598 100
251
Source United States Department of Agriculture Selected Series for Poultry and Eggs Economic Research Service 1gt1ashington D C 1969
11 I-
IYear
1963
1964
1965
1966
1967
1968
1969
I ncreas E
1963-1968
I 1000
Ibs
18098
19638
27652
34302
b r lM~
52112
69433
1879
TABLE 12
UNITED STATES TURKEY UTILIZATION ABSOLUT~ AND AS PERCENTAGE OF TOTAL CERTIFIED READY-TO-COOK WEIGHT JANJARY TO JUNE 1963-1969
Cut-up As Percen~ f
Cut-up [ota1 C~rtiLell~otgt~p~~l Total Cert1hed
Percent 1000 Percent 1100 Percent 1bs 1bs
124 75513 516 52671 360
122 90899 565 50327 313
176 102968 657 26075 167
166 143788 697 28161 137
171 151449 560 72 847 269
223 161324 691 19872 86
298 206196 886 -42888a a
1136 623
I Further Processed ~ Further As percent~g~ Of
-1ho1e
fuo1e As Pcrc~l1ta- Of
rota1 C~rLfl1
Total Certified () --shy
1000 1bs
146282 100
160864 100
15 695 100
206251 100
270404 100
233308 100
232741 118 4
595
a 1[bo1e birds from storage N N
United States Department of Agriculture Poultry Statistical Reporting Service Crop Reporting BoardSource POU 2-1 Washington DC 1963 to 1969 issues
23
Consumers today are consistently demanding more convenient forms of
agricultural products Parts and especially further processed items
other than smoked whole birds are the forms that meet this demand
Comparing Tables 10 and 11 shows that Texas processing output is
substantially different from the national output For 1968 Texas outshy
put of whole birds averaged 78 percent of the total Texas output while
tne national average output for whole birds was only about 64 percent
of the United States output Further processed output for the United
States was approximately 26 percent of the total during 1968 while
less than 15 percent of the total Texas processing output was further
processed products The parts output for Texas and the United States
is roughly comparable (7 percent for Texas and about 9 percent for the
United States)
24
v SUMliARY CONCLUSIONS AND IMPLICATIONS
Retail Phase
The results of the retail phase of the survey contain several intershy
esting findings Over 25 percent of total turkey purchases by commercial
Eating establishments were believed to be turkey from outside Texas
Purchases of turkey by all commercial eating establishments in Texas
during 1968 were composed of approximately 79 percent whole birds 9
percent parts and slightly less than 12 percent further processed proshy
ducts About 15 to 16 million pounds of turkey ere sold through Texas
commercial eating establishments during 1968 Results of the survey
reveal that cafeterias on a per establishment basis serve the most
turkey averaging about 7000 pounds sold per establishment per year
Of course not all restaurants serve turkey Depending on city size
Isomewhere between 30 and 45 percent of all restaurants in Texas serve
turkey at some time during the year Also significant is that of the
total commercial eating establishments in Texas approximately 12 pershy
cent serve turkey during Thanksgiving and Christmas only Therefore
approximately 18 to 33 percent depending upon city size serve turkey
other than those two holiday periods
The composition of purchases by independent and chain supermarkets in
Texas during 1968 was approximately 88 percent whole birds 6 percent parts
and 6 percent further processed items About 20 to 21 million pounds of
turkey were sold through this type of retail outlet in 1968 Slightly
1 Restaurants as in the U S Census of Business are defined as retail establishments selling prepared foods and drinks for conshysumption on the premises or for immediate consumption
25
1less than 8 percent of the total purchases were believed to be turkey
from Texas
Comparison of the results obtained from commercial eating estah1ishshy
ments with supermarkets shows that supermarkets on the average purchase
more whole birds (as a percentage of their respective total turkey purshy
chases) than do eating establishments Conversely comparing only further
processed purchases reveals that commercial eating establishments purchase
a larger proportion of their volume as further processed products than
do supermarkets
With regard to promotion programs only 29 percent of the managers
or meat buyers of commercial eating establishments that serve turkey
were familiar with the advertising aids made available through the National
1Turkey Federation This information in combination with the information
that about 12 percent of all commercial eating establishments serve turkey
at Thanksgiving and Christmas only indicates that opportunity exists
for increased promotional effort directed tmrard this retail outlet segshy
ment to be of benefit
Total sales of turkey in Texas through commercial eating estab1ishshy
ments and independent and chain supermarkets was estimated to be about
235 to 37 million pounds With approximately 10 million persons in Texas
during 1968 the estimated total per capita consumption in Texas would
be from 35 to 37 pounds This estimate is probably lower than the
true per capita consumption in the state since turkey consumed in insti shy
tutions and in-plant cafeterias is not included in the survey estimate
1 See Appendix tables
2 As previously mentioned this estimate excludes turkey purchased through small grocery stores institutions and in-plant cafeterias
26
However of more significance is the fact that this estimate is subshy
stantially below the 1968 national average per capita turkey consumption
1estimate of 79 pounds These figures indicate that Texans probably
do not consume as much turkey as in other areas of the United States
Processor Phase
As is evident from Tables 11 and 12 of the preceding section parts
and further processed products have been an increasing percentage of the
total United States turkey utilization during recent years During 1968
356 percent of the total turkey certified for slaughter under federal
inspection was utilized as either parts or further processed This comshy
pares with 218 percent for turkeys processed in Texas There is no
reason to forsee any future slowdown in the increases in relative importance
of parts and especially further processed products in the United States
Thus adjustments in processor utilization in Texas are indicated if
Texas processors t-Jish to align their utilization more closely with conshy
sumption trends and processor utilization trends elsewhere in the United
States
The survev of Texas processors revealed that between 31 and 32 pershy
cent of all turkey processing plant output was shipped to further proshy
cessors during 1968 However only about 11 percent of the total output
of Texas processors was further processed (excluding smoked whole turkey)l
This indicates that a substantial amount of Texas turkey is being processed
outside Texas
1 United States Department of Agriculture National Food Situation NFS-128 Economic Research Service iJashington DC ~ay 1969 p 21
2 Table 10 Section IV
27
It is also interesting to note that of the total further processed
output in Texas during 1968 nearly 86 percent of it was shipped outside
the state This would indicate that Texas processors are supplying some
further processed turkey products to other areas in the United States
In light of recent national trends mentioned above this market segment
has the greatest potential for future expansion
28
APPENDICES
29
APPENDIX A
The survey questionnaire utilized for this study contained a
number of questions concerning the attitudes toward turkey of the
manager or meat buyer of the various retail establishments interviewed
During the retail outlet phase of the study only those establishments
that purchased turkey were interviewed Thus all responses reported
in the tables of this appendix are from only those establishments
that purchased some form of turkey during 1968
Commercial Eating Establishments
A majority of those eating establishments selling turkey felt
that Sunday was the best day of the week to sell turkey Table 1
However 42 percent felt that there was no difference as to day of the
week The 47 percent that felt Sunday was the best day indicates that
turkey still may have a significant Sunday only image among commercial
eating establishments
The most frequently occurring menu item among restaurants and
cafeterias was turkey and dressing next was turkey sandwiches Tables
2 and 3 (Percentages do not add to 100 in Table 2 since a single
establishment could of course have more than one turkey item on the
menv) One reason for the frequency of occurrence for various types
of turkey 1s apparently profit Table 5 The most frequently occurring
menu items were also the most profitable for the establishment
30
RESPONSES TO SELECTED QUESTIONSshyRESTAURANTS HOTELS AND CAFETERIAS
TEXAS TURKEY MARKET SURVEY
TABLE 1
Question What particular days if any do you find best for serving turkey
Monday 5 Tuesday 5 Wednesday 35 Thursday 29 Friday 29 Saturday 5 Sunday 468 No difference 424
TABLE 2
Question What different ways do you serve turkey
Turkey and Dressing 856 Turkey Sandwiches 649 Turkey Salad 186 Turkey Tetrazzini 62 Turkey A La King 278 Turkey Roas ts 57 Miscellaneous Servings 237
TABLE 3
Question Which two ways are the most popular with your customers
1 Turkey and Dressing + Turkey S andtmiddotri ches 73 Turkey and Dressing + Turkey Salad 4 iurkey and DreSSing + Turkey A La King 21 Turkey and Dressing + Turkey Roasts 2
2 Turkey Sandto1i ches + Turkey Salad 66 Turkey Sandwiches + Turkey A La King 34
31
TABLE 4
Question What turkey dishes or items do you feel most profitable to you
Turkey and Dressing 759 Turkey A La King 127 Other 114
Question Second most profitable
Turkey Sandwiches 82 Turkey Roas t 7 Turkey Salad 102 Turkey Tetrazzini 8
TABLE 5
Question What problems if any concerning turkey do you have in regard to
A StGras and Handling
1 No problems - 959 2 Other problems - Turkey has to be thawed before cooking
Difficult to slice and bone Turkey products spoil too fast Storage facilities inadequate
B Preparation and Cooking
1 No problem - 964 2 Other problems - Breast cooks first when roasted
SlOW to cook Proper thawing of whole turkey Require more labor to cook and prepare
whole turkeys
C Serving and Merchandising
1 No problems - 964 2 Other problems - Unfrozen turkey preferred
Too much dark meat Difficult to slice breasts Requires more labor to prepare and serve
32
The extent of use and general attitudes of commercial eating
establishments toward portion control turkey products is reported
in Table 6 Nearly 66 percent of those interviewed did not buy any
portion control turkey products The most popular type portion control
product was turkey rolls Of those buying portion control products
90 percent said they had no suggestions for improving this ty~e product
Significantly of those who did not buy portion control products
over 51 percent said they had no particular reason for not buying them
This suggests that there are many commercial easting establishments
that may switch to portion control products in the future given that
labor pressures on retail establishments increase in the future The
most frequently occurring reason for not using portion control turkey
products was that the management of the establishment felt portion
control products to be of inferior quality to the same product prepared
in their own establishments
General attitudes toward the promotion of turkey in commercial
eating establishments is reported in Table 7 and 8 Nearly 60 percent
of the commercial eating establishments that serve turkey were not
familiar with any advertising aids made available through the National
Turkey Federation Of those interviewed 28 percent said they would
use display materials for turkey in their establishments In addition
70 percent said they had no opinion This indicates that at least
the majority of commercial eating establishments are not against display
material for turkey in their establishments Menu clip-ons and nlace
mats are apparently the most desirable type of display material
Some suggestions for new or improved turkey products are tabulated
in Table 9
33
TABLE 6
Question Do you buy portion control turkey products If so lrhat are they
None 657 Turkey Breasts 71 Turkey Rolls 242 Turkey Steaks 20 Turkey Les 5 Turkey Thighs 5
Question If you do buy portion control turkey products do you have any suggestions for improvement of the portion control type product
No suggestions 897
Some suggestions a Portion type products with price factor comparable
to chickens b White turkey rolls of 5-6 lbs Present rolls
either 2 lbs or 9-12 lbs c Rolls that wontt dry out too fast d Rolls with more flavor e Rolls i-Tith more gelatin f Rolls with less gelatin g Rolls sliced to fit slice of bread h Rolls of better quality meats
Question If you dont buy portion control turkey products what are your reasons for not using the portion type product
No reasons 515
Prefer whole turkey because c~ more profit more types of dishes ~p~~r to handle better flavor and quality 345
Other reasons a Portion products too expensive 31 b Portion products quality inferior 52 c Portions products too dry 10 d Do not like pre-cooked products 5 e Portion products have poor flavor 10 f Li~ited freezer capacity 10 g Portion products have too much gelatin 1 o~
34
TABLE 7
Question Are you familiar with the advertising aids made available through the National Turkey Federation
Yes No No response
293 598 109
TABLE 8
Question lVhat would be your opinion toward the use of special display materials in your establishment for merchandising turkey dishes or items
No opinion Display materials Hould help and would use to merchandise sale of turkey dishes or items Recommends display materials on holidays
702
283 15
Question ~fuat kind or type of materials do you feel would be most helpful
No opinion Henu clip-ons Table tents and place mats Colored pictures on display of turkey
dishes or items
634 146 200
TABLE 9
Question What in your opinion is needed in the form of new or improved turk~y products
No opinion
Suggestions a Turkey rolls of better quality and flavor b Rolls with less gelatin c Products at cheaper price d Sliced white meat in square cans (bread size) e Larger turkey breasts f ~IDre smoked turkey products g Steaks cut from breasts
Supermarkets
The managers or meat buyers of both the independent and chain
supermarkets were asked several questions concerning their opinion about t
turkey merchandising This portion of the appendix reports the responses
to these questions
The managers were asked their opinion regarding the increase
(or decrease) in their sales of various turkey items over the past 5
years A majority of managers responded that their sales of whole
turkey sliced turkey turkey TV dinners and turkey pot pies have
increased in sales most during the past 5 years Other items such as
halves quarters backS and necks have increased in sales the least
in the opinion of the managers
Another question asked the managers tlas In your opinion what
share of the turkey retail market will be held by further processed
items 5 and 10 years from now The responses to this question were
categorized by percent of the turkey retail market that will be held by
further processed products 5 and 10 years from now For example 13
percent of the managers felt that somewhere between 0 and 15 percent
of the turkey retail market would be held by further processed products
5 years from now However only 6 percent of the managers felt that
o to 15 percent of the market would be further processed 10 years from
now Slightly over 35 percent of the managers answered 16 to 39
percent 5 years from now compared with 22 percent who answered the same
way for 10 years from now Slightly less than 30 percent of the
managers felt that further processed would be somewhere between 40 and 59
percent of the market 5 years from now compared to 28 percent of the
managers who answered the same way for 10 years from now In contrast
36
2 percent of the managers felt that 5 years from now further processed
items would hold somewhere between 60 and 100 percent of the retail
market compared to 44 percent of the managers who an~vered the same
way for 10 years from now These responses show that- in the opinion
of the managers of supermarkets -further processed products will
continue increasing in importance in the total retail turkey market
One of the questions asked the managers was what form or manner
of merchandising they felt generated the most turkey sales during the
summer Table 10 A suecial or feature price on turkey was the method
of merchandising most~ioften mentioned by the managers next was advertiSing
turkey products Managers also felt that items such as TV dinners
pot pies and small turkeys or turkey slices sold best in the summer
Note that all of these items except small turkeys are further proshy
cessed items It is generally agreed among the supermarket trade that
sales of whole birds especially the larger ones are important only
during the holiday season Further processed products however will
sell during the summer months
TABLE 10
Question In your opinion what form of turkey or what manner of merchandising seems to generate turkey or turkey product sales most in the summer
Special price 31 Advertising 16 T V dinners 14 Pot pies 13 Special displays 9 Small turkeys 5 Turkey slices 4 Turkey Bar-B-Q 4 Turkeoy Tecipes 2 Turkey reasts 2
37
The managers were also asked if they were familiar with the
advertising aids made available through the National Tureky Federation_
The majority of managers 64 percent were not familiar lath these
aids Here again as with commercial eating establishment managers
a substantial number are not familiar with advertising aids available
for turkey which indicates that improvement in communication to these
managers is needed
38
APPENDIX B
PROCESSORS
The questionnaire utilized for the processor phase of the study
contained several questions pertinent to the potential for expanding
total processing capacity in Texas Each processor was asked In
your plant what is the physical factor most limiting to an increase
in your output A total of 18 processo~answered this question
Freezing capacity as the most limiting physical factor was mentioned by
7 of the 18 processors The problem of adequate labor was mentioned
by 3 processors one answered that the kill line was most limiting
one said the dress line and one said chilling A total of 3 processors
had no physical factor limiting increased output and 2 said that all
factors (kill line dress line packing chilling and freezing) were
all equally limiting factors-in increasing their output
Only 3 of 18 processors felt they had no physical factor limiting
an increase in their output This indicates that with the labor and
plants available in Texas today processing output could not be increased
substantially without further capital being committed to additional
processing facilities

2
TABLE 1
PRODUCTI ON OF TURKEYS IN TEXAS SELECTED YEARS 1945-68
Year Number of Texas Rank Among Birds U S States
1945
1950
1951
1952
1953
1954
1955
1960
1961
1962
1963
1964
1965
1966
1967
1968
Thousands
4602
4423
3187
3677
3383
3006
3018
3929
4784
4074
4577
4858
5272
6397
8071
7205
2
2
5
4
5
5
5
7
7
5
6
6
6
6
5
Not Available
Source U S Department of Agriculture Agricultural Statistics Washington DC 1968
3
existing marketing problems as well as onportunities that confront the
industry Afterwards additional steps could be taken to improve marshy
ket knowledge in or out-of-state to assist in formulating an effective
marketing strategy for Texas turkeys
Interest in market information was further strengthened by the fact
that Texas producers make a sizable financial contribution toward national
turkey promotion programs It was felt advisable to assess the relative
need for local versus out-of-state market promotion endeavors and the
direction either or both should take
The Texas Turkey Federation sought the assistance of the Texas
Agricultural Experiment Station in obtaining the above noted Texas marshy
ket analysis The Texas Agricultural Market Research and Development
Center at Texas AamplJ University meanwhile was established and the
research project was assigned to it for design and completion This is
the final report of the research
Texas has the prospect of remaining a major turkey producing area
in the future according to at least two analyses of interregional aspects
of turkey production and marketing One analysis by ampwden Carter and
Dean at the University of California was made in 1965 Three analytical
models were applied tvi th the result that Texas continued to be a major
1supplier of turkeys Bawden made a further extension of the above study
at the University of Wisconsin with Texas still indicated as a major
producer 2
1 D Lee Bawden H O Carter and G W Dean Interregional Competition in the United States Turkey Industry Hi1gardia-Journa1 of Agricultural Science Vol 37 No 13 University of California June 1966
2 D Lee Bawden The Cost of Producing Turkeys A Comparison Among States Bulletin 558 University of Wisconsin June 1968
4
Although interregional competition models have become quite sophisshy
ticated in design and computers make their use more feasible than before
some limitations due to design simplification remain Nonetheless the
broad indications generally are valid so long as the production and transshy
portation costs used reasonably reflect existing conditions
5
II TIm PESEARCH DESlGN
Design of research to measure and analyze a product market for an
area as large as Texas is a formidable task This is especially so if it
is to be accomplished at a reasonable cost Several alternatives were
considered with final adoption of a plan to intervieH a state-vide samnle
of retail food supermarkets and food chains in order to measure the relashy
tive importance of various turkey product retail sales A further phase
included intervie1ving of the food buyer or manager of a statetvide sample
of restaurants and cafeterias as well as food service operations of hotels
and motels A third phase waS a survey of wholesale brokers and
distributors
Following the above a complete survey was made of all turkey proshy
cessing facilities located in Texas with the exception of a few minor
specialized operations A total of twenty-one tvere included
For the retail food outlet survey all major metropolitan areas were
included plus a nrobability sample of the remaining cities As noted in
Table 2 this resulted in a total of 31 cities being selected for survey
interviews A total of 878 retail establishments were represented in the
completed survey
It is not possible within the framework of this repo~t7 to go into
a further analysis of the statewide retail food handlers sampling design
Examination of the sample 1n terms of two major classifications--the number
of establishments in the four major cities of Dallas Ft lJorth Houston
and San Antonio versus the remainder of the state reveals a near optimum
balance in the sampleJ
6
TABLE 2
SAMPLE DESIGN FOR TURKEY RETAIL HARKET SURVEY IN TEXAS
Number Included in SampleType Cities Es tab lishments
Co leted
Restaurants
Cafeterias
Hotels and motels
31
18
31
100
35
99
102
22
84
Independent supermarkets
Chain supermarkets
TOTAL
31
99 90
580
878
All major chain supermarkets were included in the sample Informashytion ~las supplied by all central offices except in a few relatively minor cases
7
All interviews were conducted on a personal basis by staff members
of the Texas Agricultural Harket Research and Development Center and two
market research graduate students working with the Center The research
questionnaires used were designed and field tested prior to their final
adoption by the Centers staff Intervieing of retail establishments
occurred in the fall and winter of 1968-69 The turkey processors and
wholesale distributors were surveyed during the spring and early summer
of 1969
~~o deviations were made from the original research design Rather
early in the survey of wholesale distributors it became evident that the
amount of cross selling among firms that were general wholesalers and those
that were brand renresentatives nroduced a set of figures that were not
suited for the intended purpose Therefore the distributor ohase was
drop~ed from consideration
The second deviation represented an addition to the sampling procedure
In order to establish a satisfactory base from ~hich to expand the retail
survey data to a state figure a statewide telephone survey was instituted
The purpose was to determine the proportion of restaurants hotels and
motels that serve turkey To be eligible for the earlier detailed survey
of turkey product use an eating establishment had to serve turkey Thereshy
fore a count of non-serving establishments was derived from a separate
survey to fulfill that need
8
III RESULTS OF THE P~TAIL OUTLET SURVEY
Commercial Eating Establishments
A portion of the study was a survey of commercial eating establishshy
ments in Texas The basic objective was to expand the results of the
survey to a state consumption total sold through eating establishments
Restaurants hotels and motels with restaurants and cafeterias were
defined as the universe for commercial eating establishments
The sample survey included 102 restaurants 84 hotels or motels
with restaurants and 22 cafeterias for a total of 208 eating establishments
Table 3 shows the results of the survey in terms of the mean average
number of pounds served per establishment for 1968 The results are disshy
aggregated in this table on the basis of city size
In order to expand the results of the sample survey to an approxishy
mation of total state consumption through all commercial eating establishshy
ments the total number in Texas of each type establishment is multiplied
by the approximate percentage of each type that serve turkey This in
turn is multiplied by the mean average number of pounds served per estabshy
lishment with the result being an approximation of the total state conshy
sumption of turkey through all commercial eating establishments
Table 4 shows the total number of each type of commereial eating
establishment in the state and the approximate percentage of the total
that serve turkey
The information contained in Tables 3 and 4 was utilized to approxishy
mate the total number of pounds of turkey served through all eating
establishments in 1968 This estimate is presented in Table 5
9
TABLE 3
BEAN AVERAGE NUHBER OF POUNDS OF TURKEY SERVED PER ESTABLISHHENT 1968 TEXAS BY CITY SIZE BASED ON SAHPLE SURVEY
Type of Commercial City Size ~ajor City All ether Cities
---Pounds--shy
Restaurantsa
4726 1637
aHotel or Hotel uith Restaurant 5463 2082
Cafeterias 7304 6832
It Hajor city is defined as Dallas Pt Horth San Antonio and Houston
a Throughout this study restaurants were defined as retail establishments selling prepared foods and drinks for consumption on premises or for immedi~te consumption This definition conforms to the US Bureau of Census definition
Source Sample Survey
10
TABLE 4
TOTAL mIMBER OF EATING EATABLISHHENTS BY CITY SIZE IN TEXAS BY TYPE AND
PERCENT THAT SERVE TURKEY 1968
Type of Commercial (1) (2) (3) Eating Establishments Total Number of Percent of the Total Number By City Size Establishments
in Texas Total that Serve
Turkey of Establishshyments that Serve
Turkey (Column 1 times column 2)
Hajor Cit-ta
Restaurants 2167 420 910
Hotels or 1ote1sb
with Res taurants 338 890 301
Cafeterias 295 100 295
All Other Cities
Restaurants 5080 300 1524
Hotels or Motelsb
with Restaurants 927 870 807
Cafeterias 405 100 405
a Hajor city is defined as Dallas Ft Worth San Antonio and Houston
b Estimate of total number of hotels and motels with restaurants for 1968 in Texas derived from 1963 U S Bureau of Cecsus data and inshyformation from the Austin office of the Texas Hotel and i10te1 Association
Source Sample survey and estimates from U S Bureau of the Census Census of Business 1967 Retail Trade Texas BC67-RA45 U S Government Printing Office Washington DC 1969 p 45-1
11
TABLE 5
APPROXIMATE NUMBER OF POUNDS OF TURKEY SERVED THROUGH ALL
EATING ESTABLISHMENTS IN TEXAS 1968
14ean Average I Total NumberNumber ofType of Commercial Es tab lishmentsEating Establishment NUM~ er of P ouJ )f Pounds
ServedServed perin Texas that Serve Turkey Es tab lishmen t
1ajor City
4726Restaurant 910 4300660
Hotel or Hotel 5463301 1644363 with Restaurant
Cafeteria 7304295 2154680
All Other Cities
Restaurant 16371524 2494788
Hotel or Motel 2082807 1680174 with Restaurant
6832Cafeteria 405 2766960
STATE TOTAL 4242 15041625XXX
Source Tables 3 and 4
12
Of course the estimate of total state consumption in Table 5 is
not considered to be completely accurate but it does give an approximashy
tion that somewhere between 15 and 16 million pounds of turkey were served
through commercial eating establishments in Texas during 1968
Other interesting statistics from the sample survey concern the
percent of total turkey sales through commercial eating establishments
Llat was believed from Texas and the type of turkey purchased by these
establishments Based on the survey data 744 percent of total turkey
purchased by commercial eating establishments in Texas during 1968 was
believed to be Texas turkey Conversely 256 percent was believed to
be from outside the state
Table 6 shows the percent of each major type of turkey purchased
by commercial eating establishments during 1968 Note that 207 percent
of all purchases were other than whole birds
TABLE 6
PERCENT OF EACH t1AJOR TYPE OF TURKEY PURCHASED BY C011MERCIAL EATING ESTABLISHMENTS IN TEXAS 1968
Type of Turkey Percent of Purchases
Whole 793 Parts 93 Further Processed 114
One of the results of the survey that is of prime interest in the
consideration of promotional programs is that about 12 percent of all c~
mercial eating establishments except cafeterias in Texas serve turkey at
Thanksgiving and Christmas only This indicates that additional promotional
13
effort directed toward restaurants and hotels or motels vi th restaurants
could induce expansion of turkey sales through this type of retail outlet
Supermarkets
Another portion of the study was a survey of both independent and
chain supermarkets in Texas The basic objective of this survey was to
determine the percent of turkey purchases by these retail outlets that
were from Texas and also to indicate the proportion of ~urchases by
supermarkets that were whole birds as opposed to parts or further processed
The sample survey consi3ted of a total of 670 supermarkets in Texas
of which 90 were independent supermarkets and 580 chain supermarkets
The small ind~e1dent grocery stores--the so-called ~om and Pop stores-shy
and drive-ins were not included in the independent store group These
stores nationally sell between 20 and 30 percent of all food Many do
not have meat departments at all Therefore their share of the turkey
retail sales is likely less than 10 percent Sampling of these small
retail outlets was consequently ignored
Based on the sample survey data 777 percent of the total turkey
purchased by independent and chain supermarkets in Texas during 1968 was
believed to be Texas turkey The remaining 223 percent was believed to
be from outside the state
The percentage of each major type of turkey purchased by both chain
and independent supermarkets during 1968 is presented in Table 7 Note
that 128 percent of all purchases were~either parts or further processed
As previously mentioned 690 independent and chain supermarkets
were included in the sample survey There are approximately 1150 independent
14
TABLE 7
TYPE OF TURKEY PURCHASED BY FOOD SUPER1ARKETS ~ TEXAS ~ 1968
Type of Turkey Percent ojf Total Purchases
Whole 881
Parts 57
Roasts and Rolls 28
Sliced 10
Frozen Food Specialty 02
TV Dinners and Pot Pies 20
Canned 01
Other 01
Source Sample Survey
15
and chain supermarkets in Texas not including drive-ins and small grocery
stores 1 Using the sample survey information approximately 17500 pounds
of turkey were sold per supermarket in Texas during 1968 Multiplying
this average times the total number of supermarkets yields a state total
for all supermarkets of approximately 20125000 pounds This estimate as
the one for commercial eating establishments should not be considered
completely accurate
All Retail Outlets
Combining the results of the expansion to state totals for commershy
cial eating establishments and independent and chain supermarkets an
approximate total of between 35 and 37 million pounds of turkey middotmiddot~Cre sold
through these outlets in 1968 This total of course does not include
turkey consumed in various institutions (such as hospitals or school
lunch programs) or in-plant cafeterias
Miscellaneous Survey Results
Other results of the survey are reported in the Appendix of this
report These results are primarily concerned with the attitudes of
the managers and meat buyers in the retail establishments surveyed
1 1968 Director of Sury~rmcrets an Crocory Chains Business Guides Inc i7ew York Nep York
16
IV RESULTS OF THE PROCESSOR SURVEY
Texas Processors
A total of 21 Texas processors were surveyed during 1969 in order
to determine 1) where turkeys processed in Texas were being shipped 2) the
composition of the output of Texas processing plants and 3) whether or
not they were being shipped to ~holesalers retail out lets or further
processors
Approximately 58 percent of all turkey processed in Texas was shipped
outside Texas Table 8 This is a weighted mean average percentage
based upon results of the survey of processors
The percent of turkey processed in Texas that was shipped to various
types of first receivers is noted in Table 9 Whereas about 80 percent
of the individually wrapped bulk turkey is going to retail outletsvirshy
tually all of the bulk pack whole turkey is moving to further processors
Approximately 52 percent of the parts and 16 percent of the further proshy
cessed is sold directly to retail outlets It is important to note that
316 percent of all turkey processed in Texas is going to further proshy
cessors while 561 percent is gOing directly to a retailer
The composition of output of all turkey processing plants in Texas
is reported in Table 10 Nearly 15 percent of all output is further
processed turkey products This 15 percent includes smoked whole turkeys
Of the total further processed output reported from the survey approximately
25 percent was smoked whole turkey which was nearly 4 percent of total
output of all processors
Information W8S also obtained from the survey concerning the source
of processors raw product procurement During 1968 994 percent of
Texas processormiddots supply came from Texas
c
17
TABLE 8
GEOGRAPHIC DESTINATION OF TURKEY PROCESSED IN TEXAS t BY TYPE 1968
Shi22ed To Tyne of Turkey Texas Outside Texas
Whole Turkey 475a 525 Individually Wrapped 494 506 Bulk Pack 426 574
Parts 349 651
bFurther Processed 141 859
All Turkeyc 446 554
a Percentages cross total to 100 percent
b Includes smoked turkey
Weighted mean average of Ylho1e parts t and further processed
Source Processor Survey
18
c
TABLE 9
P8i 1ECEI~rtRS OF TUU(Y PROCESSED IN TEXAS BY TYPE 1965 a
T2e of TurkeI Broker or Wholesaler
ShiEEed To Retail Further Outlet Processed bother
---Percent--shy
Whole Turkey Total Individually Wrapped Bulk Pack
85 119 02
567 803 04
337 61
993
11 17 01
100 100 100
Parts 65 523 201 211 100
Further Processedc 01 164 00 835 100
All Turkeyd 81 561 316 42 100
a Percentages in this table do not include one processor in Texas who declined to provide information
b Mostly exports from the United States and sales to institutions
Includes smoked turkey
d Weighted mean average of whole parts and further processed9
Source Processor Survey
19
TABLE 10
COMPOSITION OF TURKEY PROCESSOR OUTPUT TEXAS 1968
Ype of Turkey
Whole
Parts
All Further Processed Smoked Whole Other Further Processed
Percent of Total Outputa
782
70
148 37
111
a All percentages are based upon reports of several firms and thereshyfore do not reflect the operations of anyone firm
Source Processor Survey
20
Texas Processing VB U S Processing
The results of the survey of Texas processors can easily be compared
with the national situation The output of turkey bv all federally inshy
spected turkey processing plants is reported by the U S Department of
Agriculture by months and annually These data reveal some significant
information
Total turkey output in the Unicd States increased by about 25 pershy
cent between 1963 and 1968 Table 11 The largest percentage growth
in the total turkey market has occurred in turkey parts and next is
further processed turkey products The share of the total market accounted
for by turkey parts and further processed items has advanced during recent
years In 1963 parts and further processed composed 206 percent of
the total certified while in 1968 they composed 356 percent of the
total certified
Since annual data include the Thanksgiving and Christmas season a
more complete picture of the increasing importance of parts and further
processed over the last fetv years may be gained from data for the first
6 months of each year Table 12 For the January-June period of 1963
parts and further processed items composed 640 percent of the total
turkey certified For the same period of 1968 they composed 914 pershy
cent of the total certified Notice also that the general trend of
whole birds as a percent of total certified has been dOvmward since 1963
The upward trend in parts and further processed turkey items for
the United States in recent years is clearly evident from Tables 11 and
12 The data in these tables also suggest that for other than the holi shy
day season the parts and further proces3ed segment of the total market
is here the greatest grOtth is occurring
--- ----Year
1963
1964
1965
1966
1967
1968
Increase 1963-1968
I Cut-up As Tfuole asFurther Processed
Percentage Of Percentage Of TotalFurther As Percentage Of Processed ()Whole Total Certified CertifiedCut-up Total Certified Total Certi fied
1000 11 bull
48578
6024i
97245
121337
114540
135077
1781
TABLE 11
UNITED STATES TUFKEY UTILIZATION ABSOLUTE AND M PERCENTAGE OF TOTAL CERTIFIED READY-TO-COOK WEIGHT 1963-1968
Percent 1000 Percent 1000 Percent 1bs 1bs
42 190694 164 924500 794
48 211009 168 981900 784
73 252935 190 979900 737
82 334732 226 1021800 692
69 318146 191 1232300 740
93 382754 263 937767 644
1007 14
1000 1bs
1163800 100
1253200 100
1330100 100
1477 900 100
1665000 11)0
1455598 100
251
Source United States Department of Agriculture Selected Series for Poultry and Eggs Economic Research Service 1gt1ashington D C 1969
11 I-
IYear
1963
1964
1965
1966
1967
1968
1969
I ncreas E
1963-1968
I 1000
Ibs
18098
19638
27652
34302
b r lM~
52112
69433
1879
TABLE 12
UNITED STATES TURKEY UTILIZATION ABSOLUT~ AND AS PERCENTAGE OF TOTAL CERTIFIED READY-TO-COOK WEIGHT JANJARY TO JUNE 1963-1969
Cut-up As Percen~ f
Cut-up [ota1 C~rtiLell~otgt~p~~l Total Cert1hed
Percent 1000 Percent 1100 Percent 1bs 1bs
124 75513 516 52671 360
122 90899 565 50327 313
176 102968 657 26075 167
166 143788 697 28161 137
171 151449 560 72 847 269
223 161324 691 19872 86
298 206196 886 -42888a a
1136 623
I Further Processed ~ Further As percent~g~ Of
-1ho1e
fuo1e As Pcrc~l1ta- Of
rota1 C~rLfl1
Total Certified () --shy
1000 1bs
146282 100
160864 100
15 695 100
206251 100
270404 100
233308 100
232741 118 4
595
a 1[bo1e birds from storage N N
United States Department of Agriculture Poultry Statistical Reporting Service Crop Reporting BoardSource POU 2-1 Washington DC 1963 to 1969 issues
23
Consumers today are consistently demanding more convenient forms of
agricultural products Parts and especially further processed items
other than smoked whole birds are the forms that meet this demand
Comparing Tables 10 and 11 shows that Texas processing output is
substantially different from the national output For 1968 Texas outshy
put of whole birds averaged 78 percent of the total Texas output while
tne national average output for whole birds was only about 64 percent
of the United States output Further processed output for the United
States was approximately 26 percent of the total during 1968 while
less than 15 percent of the total Texas processing output was further
processed products The parts output for Texas and the United States
is roughly comparable (7 percent for Texas and about 9 percent for the
United States)
24
v SUMliARY CONCLUSIONS AND IMPLICATIONS
Retail Phase
The results of the retail phase of the survey contain several intershy
esting findings Over 25 percent of total turkey purchases by commercial
Eating establishments were believed to be turkey from outside Texas
Purchases of turkey by all commercial eating establishments in Texas
during 1968 were composed of approximately 79 percent whole birds 9
percent parts and slightly less than 12 percent further processed proshy
ducts About 15 to 16 million pounds of turkey ere sold through Texas
commercial eating establishments during 1968 Results of the survey
reveal that cafeterias on a per establishment basis serve the most
turkey averaging about 7000 pounds sold per establishment per year
Of course not all restaurants serve turkey Depending on city size
Isomewhere between 30 and 45 percent of all restaurants in Texas serve
turkey at some time during the year Also significant is that of the
total commercial eating establishments in Texas approximately 12 pershy
cent serve turkey during Thanksgiving and Christmas only Therefore
approximately 18 to 33 percent depending upon city size serve turkey
other than those two holiday periods
The composition of purchases by independent and chain supermarkets in
Texas during 1968 was approximately 88 percent whole birds 6 percent parts
and 6 percent further processed items About 20 to 21 million pounds of
turkey were sold through this type of retail outlet in 1968 Slightly
1 Restaurants as in the U S Census of Business are defined as retail establishments selling prepared foods and drinks for conshysumption on the premises or for immediate consumption
25
1less than 8 percent of the total purchases were believed to be turkey
from Texas
Comparison of the results obtained from commercial eating estah1ishshy
ments with supermarkets shows that supermarkets on the average purchase
more whole birds (as a percentage of their respective total turkey purshy
chases) than do eating establishments Conversely comparing only further
processed purchases reveals that commercial eating establishments purchase
a larger proportion of their volume as further processed products than
do supermarkets
With regard to promotion programs only 29 percent of the managers
or meat buyers of commercial eating establishments that serve turkey
were familiar with the advertising aids made available through the National
1Turkey Federation This information in combination with the information
that about 12 percent of all commercial eating establishments serve turkey
at Thanksgiving and Christmas only indicates that opportunity exists
for increased promotional effort directed tmrard this retail outlet segshy
ment to be of benefit
Total sales of turkey in Texas through commercial eating estab1ishshy
ments and independent and chain supermarkets was estimated to be about
235 to 37 million pounds With approximately 10 million persons in Texas
during 1968 the estimated total per capita consumption in Texas would
be from 35 to 37 pounds This estimate is probably lower than the
true per capita consumption in the state since turkey consumed in insti shy
tutions and in-plant cafeterias is not included in the survey estimate
1 See Appendix tables
2 As previously mentioned this estimate excludes turkey purchased through small grocery stores institutions and in-plant cafeterias
26
However of more significance is the fact that this estimate is subshy
stantially below the 1968 national average per capita turkey consumption
1estimate of 79 pounds These figures indicate that Texans probably
do not consume as much turkey as in other areas of the United States
Processor Phase
As is evident from Tables 11 and 12 of the preceding section parts
and further processed products have been an increasing percentage of the
total United States turkey utilization during recent years During 1968
356 percent of the total turkey certified for slaughter under federal
inspection was utilized as either parts or further processed This comshy
pares with 218 percent for turkeys processed in Texas There is no
reason to forsee any future slowdown in the increases in relative importance
of parts and especially further processed products in the United States
Thus adjustments in processor utilization in Texas are indicated if
Texas processors t-Jish to align their utilization more closely with conshy
sumption trends and processor utilization trends elsewhere in the United
States
The survev of Texas processors revealed that between 31 and 32 pershy
cent of all turkey processing plant output was shipped to further proshy
cessors during 1968 However only about 11 percent of the total output
of Texas processors was further processed (excluding smoked whole turkey)l
This indicates that a substantial amount of Texas turkey is being processed
outside Texas
1 United States Department of Agriculture National Food Situation NFS-128 Economic Research Service iJashington DC ~ay 1969 p 21
2 Table 10 Section IV
27
It is also interesting to note that of the total further processed
output in Texas during 1968 nearly 86 percent of it was shipped outside
the state This would indicate that Texas processors are supplying some
further processed turkey products to other areas in the United States
In light of recent national trends mentioned above this market segment
has the greatest potential for future expansion
28
APPENDICES
29
APPENDIX A
The survey questionnaire utilized for this study contained a
number of questions concerning the attitudes toward turkey of the
manager or meat buyer of the various retail establishments interviewed
During the retail outlet phase of the study only those establishments
that purchased turkey were interviewed Thus all responses reported
in the tables of this appendix are from only those establishments
that purchased some form of turkey during 1968
Commercial Eating Establishments
A majority of those eating establishments selling turkey felt
that Sunday was the best day of the week to sell turkey Table 1
However 42 percent felt that there was no difference as to day of the
week The 47 percent that felt Sunday was the best day indicates that
turkey still may have a significant Sunday only image among commercial
eating establishments
The most frequently occurring menu item among restaurants and
cafeterias was turkey and dressing next was turkey sandwiches Tables
2 and 3 (Percentages do not add to 100 in Table 2 since a single
establishment could of course have more than one turkey item on the
menv) One reason for the frequency of occurrence for various types
of turkey 1s apparently profit Table 5 The most frequently occurring
menu items were also the most profitable for the establishment
30
RESPONSES TO SELECTED QUESTIONSshyRESTAURANTS HOTELS AND CAFETERIAS
TEXAS TURKEY MARKET SURVEY
TABLE 1
Question What particular days if any do you find best for serving turkey
Monday 5 Tuesday 5 Wednesday 35 Thursday 29 Friday 29 Saturday 5 Sunday 468 No difference 424
TABLE 2
Question What different ways do you serve turkey
Turkey and Dressing 856 Turkey Sandwiches 649 Turkey Salad 186 Turkey Tetrazzini 62 Turkey A La King 278 Turkey Roas ts 57 Miscellaneous Servings 237
TABLE 3
Question Which two ways are the most popular with your customers
1 Turkey and Dressing + Turkey S andtmiddotri ches 73 Turkey and Dressing + Turkey Salad 4 iurkey and DreSSing + Turkey A La King 21 Turkey and Dressing + Turkey Roasts 2
2 Turkey Sandto1i ches + Turkey Salad 66 Turkey Sandwiches + Turkey A La King 34
31
TABLE 4
Question What turkey dishes or items do you feel most profitable to you
Turkey and Dressing 759 Turkey A La King 127 Other 114
Question Second most profitable
Turkey Sandwiches 82 Turkey Roas t 7 Turkey Salad 102 Turkey Tetrazzini 8
TABLE 5
Question What problems if any concerning turkey do you have in regard to
A StGras and Handling
1 No problems - 959 2 Other problems - Turkey has to be thawed before cooking
Difficult to slice and bone Turkey products spoil too fast Storage facilities inadequate
B Preparation and Cooking
1 No problem - 964 2 Other problems - Breast cooks first when roasted
SlOW to cook Proper thawing of whole turkey Require more labor to cook and prepare
whole turkeys
C Serving and Merchandising
1 No problems - 964 2 Other problems - Unfrozen turkey preferred
Too much dark meat Difficult to slice breasts Requires more labor to prepare and serve
32
The extent of use and general attitudes of commercial eating
establishments toward portion control turkey products is reported
in Table 6 Nearly 66 percent of those interviewed did not buy any
portion control turkey products The most popular type portion control
product was turkey rolls Of those buying portion control products
90 percent said they had no suggestions for improving this ty~e product
Significantly of those who did not buy portion control products
over 51 percent said they had no particular reason for not buying them
This suggests that there are many commercial easting establishments
that may switch to portion control products in the future given that
labor pressures on retail establishments increase in the future The
most frequently occurring reason for not using portion control turkey
products was that the management of the establishment felt portion
control products to be of inferior quality to the same product prepared
in their own establishments
General attitudes toward the promotion of turkey in commercial
eating establishments is reported in Table 7 and 8 Nearly 60 percent
of the commercial eating establishments that serve turkey were not
familiar with any advertising aids made available through the National
Turkey Federation Of those interviewed 28 percent said they would
use display materials for turkey in their establishments In addition
70 percent said they had no opinion This indicates that at least
the majority of commercial eating establishments are not against display
material for turkey in their establishments Menu clip-ons and nlace
mats are apparently the most desirable type of display material
Some suggestions for new or improved turkey products are tabulated
in Table 9
33
TABLE 6
Question Do you buy portion control turkey products If so lrhat are they
None 657 Turkey Breasts 71 Turkey Rolls 242 Turkey Steaks 20 Turkey Les 5 Turkey Thighs 5
Question If you do buy portion control turkey products do you have any suggestions for improvement of the portion control type product
No suggestions 897
Some suggestions a Portion type products with price factor comparable
to chickens b White turkey rolls of 5-6 lbs Present rolls
either 2 lbs or 9-12 lbs c Rolls that wontt dry out too fast d Rolls with more flavor e Rolls i-Tith more gelatin f Rolls with less gelatin g Rolls sliced to fit slice of bread h Rolls of better quality meats
Question If you dont buy portion control turkey products what are your reasons for not using the portion type product
No reasons 515
Prefer whole turkey because c~ more profit more types of dishes ~p~~r to handle better flavor and quality 345
Other reasons a Portion products too expensive 31 b Portion products quality inferior 52 c Portions products too dry 10 d Do not like pre-cooked products 5 e Portion products have poor flavor 10 f Li~ited freezer capacity 10 g Portion products have too much gelatin 1 o~
34
TABLE 7
Question Are you familiar with the advertising aids made available through the National Turkey Federation
Yes No No response
293 598 109
TABLE 8
Question lVhat would be your opinion toward the use of special display materials in your establishment for merchandising turkey dishes or items
No opinion Display materials Hould help and would use to merchandise sale of turkey dishes or items Recommends display materials on holidays
702
283 15
Question ~fuat kind or type of materials do you feel would be most helpful
No opinion Henu clip-ons Table tents and place mats Colored pictures on display of turkey
dishes or items
634 146 200
TABLE 9
Question What in your opinion is needed in the form of new or improved turk~y products
No opinion
Suggestions a Turkey rolls of better quality and flavor b Rolls with less gelatin c Products at cheaper price d Sliced white meat in square cans (bread size) e Larger turkey breasts f ~IDre smoked turkey products g Steaks cut from breasts
Supermarkets
The managers or meat buyers of both the independent and chain
supermarkets were asked several questions concerning their opinion about t
turkey merchandising This portion of the appendix reports the responses
to these questions
The managers were asked their opinion regarding the increase
(or decrease) in their sales of various turkey items over the past 5
years A majority of managers responded that their sales of whole
turkey sliced turkey turkey TV dinners and turkey pot pies have
increased in sales most during the past 5 years Other items such as
halves quarters backS and necks have increased in sales the least
in the opinion of the managers
Another question asked the managers tlas In your opinion what
share of the turkey retail market will be held by further processed
items 5 and 10 years from now The responses to this question were
categorized by percent of the turkey retail market that will be held by
further processed products 5 and 10 years from now For example 13
percent of the managers felt that somewhere between 0 and 15 percent
of the turkey retail market would be held by further processed products
5 years from now However only 6 percent of the managers felt that
o to 15 percent of the market would be further processed 10 years from
now Slightly over 35 percent of the managers answered 16 to 39
percent 5 years from now compared with 22 percent who answered the same
way for 10 years from now Slightly less than 30 percent of the
managers felt that further processed would be somewhere between 40 and 59
percent of the market 5 years from now compared to 28 percent of the
managers who answered the same way for 10 years from now In contrast
36
2 percent of the managers felt that 5 years from now further processed
items would hold somewhere between 60 and 100 percent of the retail
market compared to 44 percent of the managers who an~vered the same
way for 10 years from now These responses show that- in the opinion
of the managers of supermarkets -further processed products will
continue increasing in importance in the total retail turkey market
One of the questions asked the managers was what form or manner
of merchandising they felt generated the most turkey sales during the
summer Table 10 A suecial or feature price on turkey was the method
of merchandising most~ioften mentioned by the managers next was advertiSing
turkey products Managers also felt that items such as TV dinners
pot pies and small turkeys or turkey slices sold best in the summer
Note that all of these items except small turkeys are further proshy
cessed items It is generally agreed among the supermarket trade that
sales of whole birds especially the larger ones are important only
during the holiday season Further processed products however will
sell during the summer months
TABLE 10
Question In your opinion what form of turkey or what manner of merchandising seems to generate turkey or turkey product sales most in the summer
Special price 31 Advertising 16 T V dinners 14 Pot pies 13 Special displays 9 Small turkeys 5 Turkey slices 4 Turkey Bar-B-Q 4 Turkeoy Tecipes 2 Turkey reasts 2
37
The managers were also asked if they were familiar with the
advertising aids made available through the National Tureky Federation_
The majority of managers 64 percent were not familiar lath these
aids Here again as with commercial eating establishment managers
a substantial number are not familiar with advertising aids available
for turkey which indicates that improvement in communication to these
managers is needed
38
APPENDIX B
PROCESSORS
The questionnaire utilized for the processor phase of the study
contained several questions pertinent to the potential for expanding
total processing capacity in Texas Each processor was asked In
your plant what is the physical factor most limiting to an increase
in your output A total of 18 processo~answered this question
Freezing capacity as the most limiting physical factor was mentioned by
7 of the 18 processors The problem of adequate labor was mentioned
by 3 processors one answered that the kill line was most limiting
one said the dress line and one said chilling A total of 3 processors
had no physical factor limiting increased output and 2 said that all
factors (kill line dress line packing chilling and freezing) were
all equally limiting factors-in increasing their output
Only 3 of 18 processors felt they had no physical factor limiting
an increase in their output This indicates that with the labor and
plants available in Texas today processing output could not be increased
substantially without further capital being committed to additional
processing facilities
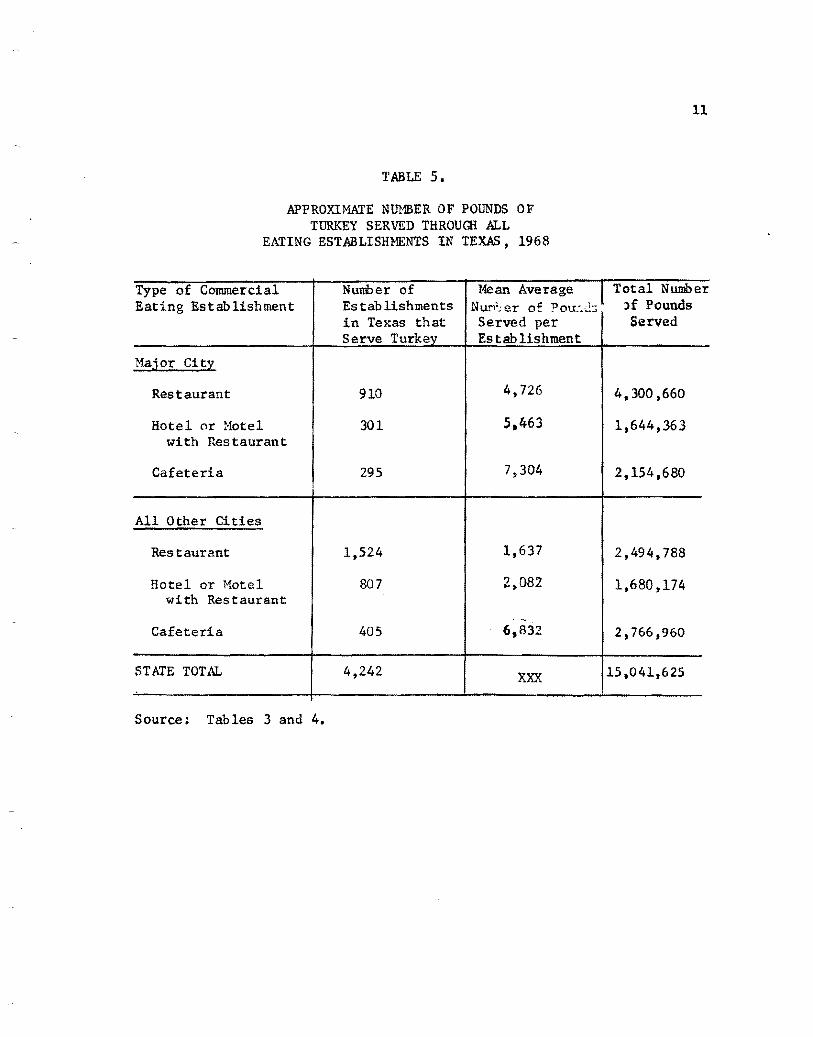

c
17
TABLE 8
GEOGRAPHIC DESTINATION OF TURKEY PROCESSED IN TEXAS t BY TYPE 1968
Shi22ed To Tyne of Turkey Texas Outside Texas
Whole Turkey 475a 525 Individually Wrapped 494 506 Bulk Pack 426 574
Parts 349 651
bFurther Processed 141 859
All Turkeyc 446 554
a Percentages cross total to 100 percent
b Includes smoked turkey
Weighted mean average of Ylho1e parts t and further processed
Source Processor Survey
18
c
TABLE 9
P8i 1ECEI~rtRS OF TUU(Y PROCESSED IN TEXAS BY TYPE 1965 a
T2e of TurkeI Broker or Wholesaler
ShiEEed To Retail Further Outlet Processed bother
---Percent--shy
Whole Turkey Total Individually Wrapped Bulk Pack
85 119 02
567 803 04
337 61
993
11 17 01
100 100 100
Parts 65 523 201 211 100
Further Processedc 01 164 00 835 100
All Turkeyd 81 561 316 42 100
a Percentages in this table do not include one processor in Texas who declined to provide information
b Mostly exports from the United States and sales to institutions
Includes smoked turkey
d Weighted mean average of whole parts and further processed9
Source Processor Survey
19
TABLE 10
COMPOSITION OF TURKEY PROCESSOR OUTPUT TEXAS 1968
Ype of Turkey
Whole
Parts
All Further Processed Smoked Whole Other Further Processed
Percent of Total Outputa
782
70
148 37
111
a All percentages are based upon reports of several firms and thereshyfore do not reflect the operations of anyone firm
Source Processor Survey
20
Texas Processing VB U S Processing
The results of the survey of Texas processors can easily be compared
with the national situation The output of turkey bv all federally inshy
spected turkey processing plants is reported by the U S Department of
Agriculture by months and annually These data reveal some significant
information
Total turkey output in the Unicd States increased by about 25 pershy
cent between 1963 and 1968 Table 11 The largest percentage growth
in the total turkey market has occurred in turkey parts and next is
further processed turkey products The share of the total market accounted
for by turkey parts and further processed items has advanced during recent
years In 1963 parts and further processed composed 206 percent of
the total certified while in 1968 they composed 356 percent of the
total certified
Since annual data include the Thanksgiving and Christmas season a
more complete picture of the increasing importance of parts and further
processed over the last fetv years may be gained from data for the first
6 months of each year Table 12 For the January-June period of 1963
parts and further processed items composed 640 percent of the total
turkey certified For the same period of 1968 they composed 914 pershy
cent of the total certified Notice also that the general trend of
whole birds as a percent of total certified has been dOvmward since 1963
The upward trend in parts and further processed turkey items for
the United States in recent years is clearly evident from Tables 11 and
12 The data in these tables also suggest that for other than the holi shy
day season the parts and further proces3ed segment of the total market
is here the greatest grOtth is occurring
--- ----Year
1963
1964
1965
1966
1967
1968
Increase 1963-1968
I Cut-up As Tfuole asFurther Processed
Percentage Of Percentage Of TotalFurther As Percentage Of Processed ()Whole Total Certified CertifiedCut-up Total Certified Total Certi fied
1000 11 bull
48578
6024i
97245
121337
114540
135077
1781
TABLE 11
UNITED STATES TUFKEY UTILIZATION ABSOLUTE AND M PERCENTAGE OF TOTAL CERTIFIED READY-TO-COOK WEIGHT 1963-1968
Percent 1000 Percent 1000 Percent 1bs 1bs
42 190694 164 924500 794
48 211009 168 981900 784
73 252935 190 979900 737
82 334732 226 1021800 692
69 318146 191 1232300 740
93 382754 263 937767 644
1007 14
1000 1bs
1163800 100
1253200 100
1330100 100
1477 900 100
1665000 11)0
1455598 100
251
Source United States Department of Agriculture Selected Series for Poultry and Eggs Economic Research Service 1gt1ashington D C 1969
11 I-
IYear
1963
1964
1965
1966
1967
1968
1969
I ncreas E
1963-1968
I 1000
Ibs
18098
19638
27652
34302
b r lM~
52112
69433
1879
TABLE 12
UNITED STATES TURKEY UTILIZATION ABSOLUT~ AND AS PERCENTAGE OF TOTAL CERTIFIED READY-TO-COOK WEIGHT JANJARY TO JUNE 1963-1969
Cut-up As Percen~ f
Cut-up [ota1 C~rtiLell~otgt~p~~l Total Cert1hed
Percent 1000 Percent 1100 Percent 1bs 1bs
124 75513 516 52671 360
122 90899 565 50327 313
176 102968 657 26075 167
166 143788 697 28161 137
171 151449 560 72 847 269
223 161324 691 19872 86
298 206196 886 -42888a a
1136 623
I Further Processed ~ Further As percent~g~ Of
-1ho1e
fuo1e As Pcrc~l1ta- Of
rota1 C~rLfl1
Total Certified () --shy
1000 1bs
146282 100
160864 100
15 695 100
206251 100
270404 100
233308 100
232741 118 4
595
a 1[bo1e birds from storage N N
United States Department of Agriculture Poultry Statistical Reporting Service Crop Reporting BoardSource POU 2-1 Washington DC 1963 to 1969 issues
23
Consumers today are consistently demanding more convenient forms of
agricultural products Parts and especially further processed items
other than smoked whole birds are the forms that meet this demand
Comparing Tables 10 and 11 shows that Texas processing output is
substantially different from the national output For 1968 Texas outshy
put of whole birds averaged 78 percent of the total Texas output while
tne national average output for whole birds was only about 64 percent
of the United States output Further processed output for the United
States was approximately 26 percent of the total during 1968 while
less than 15 percent of the total Texas processing output was further
processed products The parts output for Texas and the United States
is roughly comparable (7 percent for Texas and about 9 percent for the
United States)
24
v SUMliARY CONCLUSIONS AND IMPLICATIONS
Retail Phase
The results of the retail phase of the survey contain several intershy
esting findings Over 25 percent of total turkey purchases by commercial
Eating establishments were believed to be turkey from outside Texas
Purchases of turkey by all commercial eating establishments in Texas
during 1968 were composed of approximately 79 percent whole birds 9
percent parts and slightly less than 12 percent further processed proshy
ducts About 15 to 16 million pounds of turkey ere sold through Texas
commercial eating establishments during 1968 Results of the survey
reveal that cafeterias on a per establishment basis serve the most
turkey averaging about 7000 pounds sold per establishment per year
Of course not all restaurants serve turkey Depending on city size
Isomewhere between 30 and 45 percent of all restaurants in Texas serve
turkey at some time during the year Also significant is that of the
total commercial eating establishments in Texas approximately 12 pershy
cent serve turkey during Thanksgiving and Christmas only Therefore
approximately 18 to 33 percent depending upon city size serve turkey
other than those two holiday periods
The composition of purchases by independent and chain supermarkets in
Texas during 1968 was approximately 88 percent whole birds 6 percent parts
and 6 percent further processed items About 20 to 21 million pounds of
turkey were sold through this type of retail outlet in 1968 Slightly
1 Restaurants as in the U S Census of Business are defined as retail establishments selling prepared foods and drinks for conshysumption on the premises or for immediate consumption
25
1less than 8 percent of the total purchases were believed to be turkey
from Texas
Comparison of the results obtained from commercial eating estah1ishshy
ments with supermarkets shows that supermarkets on the average purchase
more whole birds (as a percentage of their respective total turkey purshy
chases) than do eating establishments Conversely comparing only further
processed purchases reveals that commercial eating establishments purchase
a larger proportion of their volume as further processed products than
do supermarkets
With regard to promotion programs only 29 percent of the managers
or meat buyers of commercial eating establishments that serve turkey
were familiar with the advertising aids made available through the National
1Turkey Federation This information in combination with the information
that about 12 percent of all commercial eating establishments serve turkey
at Thanksgiving and Christmas only indicates that opportunity exists
for increased promotional effort directed tmrard this retail outlet segshy
ment to be of benefit
Total sales of turkey in Texas through commercial eating estab1ishshy
ments and independent and chain supermarkets was estimated to be about
235 to 37 million pounds With approximately 10 million persons in Texas
during 1968 the estimated total per capita consumption in Texas would
be from 35 to 37 pounds This estimate is probably lower than the
true per capita consumption in the state since turkey consumed in insti shy
tutions and in-plant cafeterias is not included in the survey estimate
1 See Appendix tables
2 As previously mentioned this estimate excludes turkey purchased through small grocery stores institutions and in-plant cafeterias
26
However of more significance is the fact that this estimate is subshy
stantially below the 1968 national average per capita turkey consumption
1estimate of 79 pounds These figures indicate that Texans probably
do not consume as much turkey as in other areas of the United States
Processor Phase
As is evident from Tables 11 and 12 of the preceding section parts
and further processed products have been an increasing percentage of the
total United States turkey utilization during recent years During 1968
356 percent of the total turkey certified for slaughter under federal
inspection was utilized as either parts or further processed This comshy
pares with 218 percent for turkeys processed in Texas There is no
reason to forsee any future slowdown in the increases in relative importance
of parts and especially further processed products in the United States
Thus adjustments in processor utilization in Texas are indicated if
Texas processors t-Jish to align their utilization more closely with conshy
sumption trends and processor utilization trends elsewhere in the United
States
The survev of Texas processors revealed that between 31 and 32 pershy
cent of all turkey processing plant output was shipped to further proshy
cessors during 1968 However only about 11 percent of the total output
of Texas processors was further processed (excluding smoked whole turkey)l
This indicates that a substantial amount of Texas turkey is being processed
outside Texas
1 United States Department of Agriculture National Food Situation NFS-128 Economic Research Service iJashington DC ~ay 1969 p 21
2 Table 10 Section IV
27
It is also interesting to note that of the total further processed
output in Texas during 1968 nearly 86 percent of it was shipped outside
the state This would indicate that Texas processors are supplying some
further processed turkey products to other areas in the United States
In light of recent national trends mentioned above this market segment
has the greatest potential for future expansion
28
APPENDICES
29
APPENDIX A
The survey questionnaire utilized for this study contained a
number of questions concerning the attitudes toward turkey of the
manager or meat buyer of the various retail establishments interviewed
During the retail outlet phase of the study only those establishments
that purchased turkey were interviewed Thus all responses reported
in the tables of this appendix are from only those establishments
that purchased some form of turkey during 1968
Commercial Eating Establishments
A majority of those eating establishments selling turkey felt
that Sunday was the best day of the week to sell turkey Table 1
However 42 percent felt that there was no difference as to day of the
week The 47 percent that felt Sunday was the best day indicates that
turkey still may have a significant Sunday only image among commercial
eating establishments
The most frequently occurring menu item among restaurants and
cafeterias was turkey and dressing next was turkey sandwiches Tables
2 and 3 (Percentages do not add to 100 in Table 2 since a single
establishment could of course have more than one turkey item on the
menv) One reason for the frequency of occurrence for various types
of turkey 1s apparently profit Table 5 The most frequently occurring
menu items were also the most profitable for the establishment
30
RESPONSES TO SELECTED QUESTIONSshyRESTAURANTS HOTELS AND CAFETERIAS
TEXAS TURKEY MARKET SURVEY
TABLE 1
Question What particular days if any do you find best for serving turkey
Monday 5 Tuesday 5 Wednesday 35 Thursday 29 Friday 29 Saturday 5 Sunday 468 No difference 424
TABLE 2
Question What different ways do you serve turkey
Turkey and Dressing 856 Turkey Sandwiches 649 Turkey Salad 186 Turkey Tetrazzini 62 Turkey A La King 278 Turkey Roas ts 57 Miscellaneous Servings 237
TABLE 3
Question Which two ways are the most popular with your customers
1 Turkey and Dressing + Turkey S andtmiddotri ches 73 Turkey and Dressing + Turkey Salad 4 iurkey and DreSSing + Turkey A La King 21 Turkey and Dressing + Turkey Roasts 2
2 Turkey Sandto1i ches + Turkey Salad 66 Turkey Sandwiches + Turkey A La King 34
31
TABLE 4
Question What turkey dishes or items do you feel most profitable to you
Turkey and Dressing 759 Turkey A La King 127 Other 114
Question Second most profitable
Turkey Sandwiches 82 Turkey Roas t 7 Turkey Salad 102 Turkey Tetrazzini 8
TABLE 5
Question What problems if any concerning turkey do you have in regard to
A StGras and Handling
1 No problems - 959 2 Other problems - Turkey has to be thawed before cooking
Difficult to slice and bone Turkey products spoil too fast Storage facilities inadequate
B Preparation and Cooking
1 No problem - 964 2 Other problems - Breast cooks first when roasted
SlOW to cook Proper thawing of whole turkey Require more labor to cook and prepare
whole turkeys
C Serving and Merchandising
1 No problems - 964 2 Other problems - Unfrozen turkey preferred
Too much dark meat Difficult to slice breasts Requires more labor to prepare and serve
32
The extent of use and general attitudes of commercial eating
establishments toward portion control turkey products is reported
in Table 6 Nearly 66 percent of those interviewed did not buy any
portion control turkey products The most popular type portion control
product was turkey rolls Of those buying portion control products
90 percent said they had no suggestions for improving this ty~e product
Significantly of those who did not buy portion control products
over 51 percent said they had no particular reason for not buying them
This suggests that there are many commercial easting establishments
that may switch to portion control products in the future given that
labor pressures on retail establishments increase in the future The
most frequently occurring reason for not using portion control turkey
products was that the management of the establishment felt portion
control products to be of inferior quality to the same product prepared
in their own establishments
General attitudes toward the promotion of turkey in commercial
eating establishments is reported in Table 7 and 8 Nearly 60 percent
of the commercial eating establishments that serve turkey were not
familiar with any advertising aids made available through the National
Turkey Federation Of those interviewed 28 percent said they would
use display materials for turkey in their establishments In addition
70 percent said they had no opinion This indicates that at least
the majority of commercial eating establishments are not against display
material for turkey in their establishments Menu clip-ons and nlace
mats are apparently the most desirable type of display material
Some suggestions for new or improved turkey products are tabulated
in Table 9
33
TABLE 6
Question Do you buy portion control turkey products If so lrhat are they
None 657 Turkey Breasts 71 Turkey Rolls 242 Turkey Steaks 20 Turkey Les 5 Turkey Thighs 5
Question If you do buy portion control turkey products do you have any suggestions for improvement of the portion control type product
No suggestions 897
Some suggestions a Portion type products with price factor comparable
to chickens b White turkey rolls of 5-6 lbs Present rolls
either 2 lbs or 9-12 lbs c Rolls that wontt dry out too fast d Rolls with more flavor e Rolls i-Tith more gelatin f Rolls with less gelatin g Rolls sliced to fit slice of bread h Rolls of better quality meats
Question If you dont buy portion control turkey products what are your reasons for not using the portion type product
No reasons 515
Prefer whole turkey because c~ more profit more types of dishes ~p~~r to handle better flavor and quality 345
Other reasons a Portion products too expensive 31 b Portion products quality inferior 52 c Portions products too dry 10 d Do not like pre-cooked products 5 e Portion products have poor flavor 10 f Li~ited freezer capacity 10 g Portion products have too much gelatin 1 o~
34
TABLE 7
Question Are you familiar with the advertising aids made available through the National Turkey Federation
Yes No No response
293 598 109
TABLE 8
Question lVhat would be your opinion toward the use of special display materials in your establishment for merchandising turkey dishes or items
No opinion Display materials Hould help and would use to merchandise sale of turkey dishes or items Recommends display materials on holidays
702
283 15
Question ~fuat kind or type of materials do you feel would be most helpful
No opinion Henu clip-ons Table tents and place mats Colored pictures on display of turkey
dishes or items
634 146 200
TABLE 9
Question What in your opinion is needed in the form of new or improved turk~y products
No opinion
Suggestions a Turkey rolls of better quality and flavor b Rolls with less gelatin c Products at cheaper price d Sliced white meat in square cans (bread size) e Larger turkey breasts f ~IDre smoked turkey products g Steaks cut from breasts
Supermarkets
The managers or meat buyers of both the independent and chain
supermarkets were asked several questions concerning their opinion about t
turkey merchandising This portion of the appendix reports the responses
to these questions
The managers were asked their opinion regarding the increase
(or decrease) in their sales of various turkey items over the past 5
years A majority of managers responded that their sales of whole
turkey sliced turkey turkey TV dinners and turkey pot pies have
increased in sales most during the past 5 years Other items such as
halves quarters backS and necks have increased in sales the least
in the opinion of the managers
Another question asked the managers tlas In your opinion what
share of the turkey retail market will be held by further processed
items 5 and 10 years from now The responses to this question were
categorized by percent of the turkey retail market that will be held by
further processed products 5 and 10 years from now For example 13
percent of the managers felt that somewhere between 0 and 15 percent
of the turkey retail market would be held by further processed products
5 years from now However only 6 percent of the managers felt that
o to 15 percent of the market would be further processed 10 years from
now Slightly over 35 percent of the managers answered 16 to 39
percent 5 years from now compared with 22 percent who answered the same
way for 10 years from now Slightly less than 30 percent of the
managers felt that further processed would be somewhere between 40 and 59
percent of the market 5 years from now compared to 28 percent of the
managers who answered the same way for 10 years from now In contrast
36
2 percent of the managers felt that 5 years from now further processed
items would hold somewhere between 60 and 100 percent of the retail
market compared to 44 percent of the managers who an~vered the same
way for 10 years from now These responses show that- in the opinion
of the managers of supermarkets -further processed products will
continue increasing in importance in the total retail turkey market
One of the questions asked the managers was what form or manner
of merchandising they felt generated the most turkey sales during the
summer Table 10 A suecial or feature price on turkey was the method
of merchandising most~ioften mentioned by the managers next was advertiSing
turkey products Managers also felt that items such as TV dinners
pot pies and small turkeys or turkey slices sold best in the summer
Note that all of these items except small turkeys are further proshy
cessed items It is generally agreed among the supermarket trade that
sales of whole birds especially the larger ones are important only
during the holiday season Further processed products however will
sell during the summer months
TABLE 10
Question In your opinion what form of turkey or what manner of merchandising seems to generate turkey or turkey product sales most in the summer
Special price 31 Advertising 16 T V dinners 14 Pot pies 13 Special displays 9 Small turkeys 5 Turkey slices 4 Turkey Bar-B-Q 4 Turkeoy Tecipes 2 Turkey reasts 2
37
The managers were also asked if they were familiar with the
advertising aids made available through the National Tureky Federation_
The majority of managers 64 percent were not familiar lath these
aids Here again as with commercial eating establishment managers
a substantial number are not familiar with advertising aids available
for turkey which indicates that improvement in communication to these
managers is needed
38
APPENDIX B
PROCESSORS
The questionnaire utilized for the processor phase of the study
contained several questions pertinent to the potential for expanding
total processing capacity in Texas Each processor was asked In
your plant what is the physical factor most limiting to an increase
in your output A total of 18 processo~answered this question
Freezing capacity as the most limiting physical factor was mentioned by
7 of the 18 processors The problem of adequate labor was mentioned
by 3 processors one answered that the kill line was most limiting
one said the dress line and one said chilling A total of 3 processors
had no physical factor limiting increased output and 2 said that all
factors (kill line dress line packing chilling and freezing) were
all equally limiting factors-in increasing their output
Only 3 of 18 processors felt they had no physical factor limiting
an increase in their output This indicates that with the labor and
plants available in Texas today processing output could not be increased
substantially without further capital being committed to additional
processing facilities
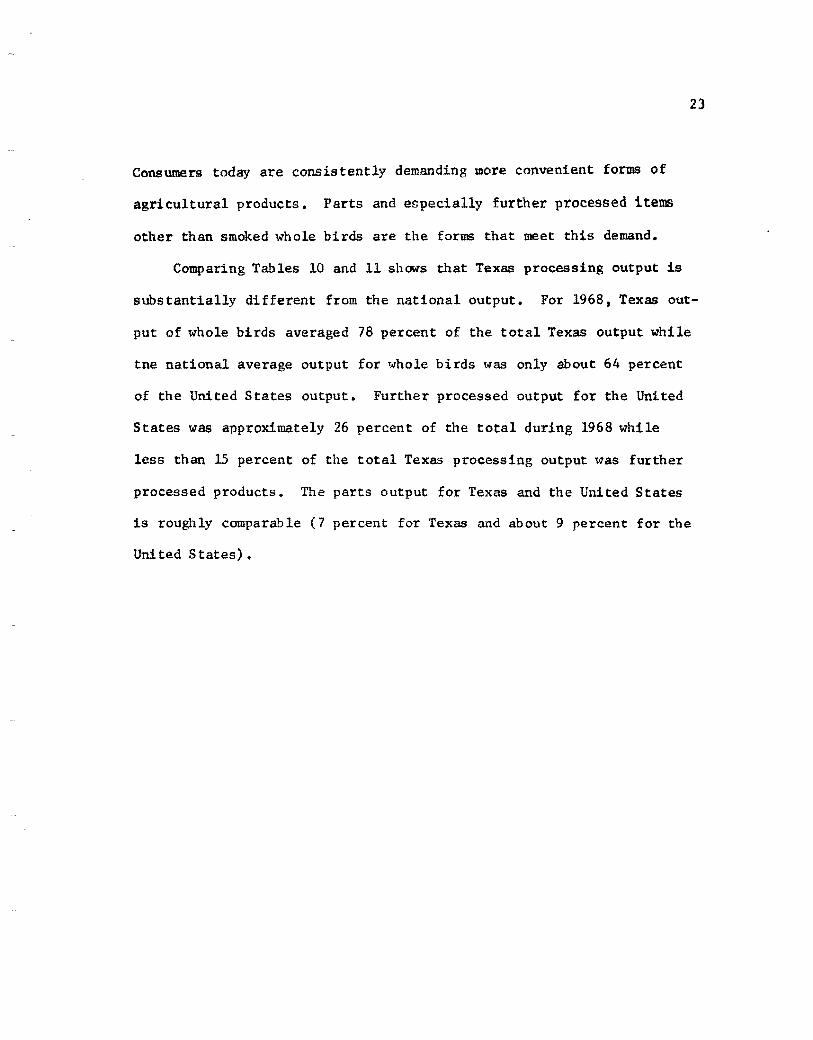
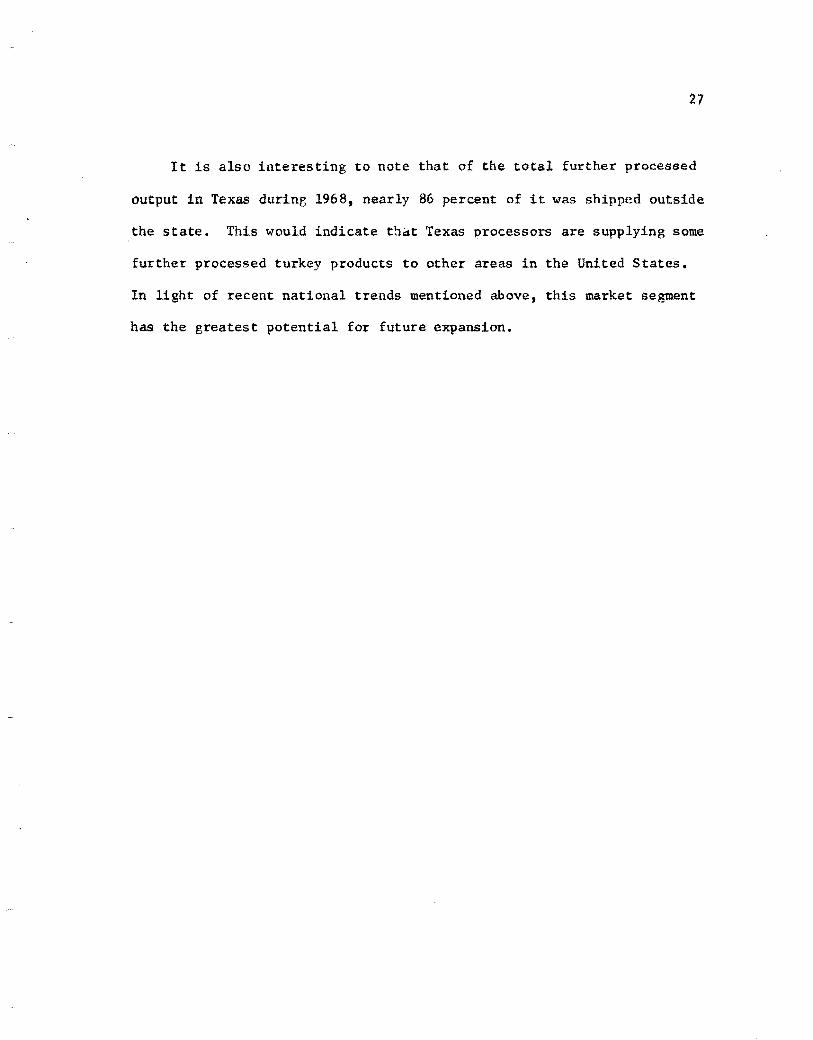