Stephen Fuller, Charles Hall and Merritt Taylor*...
187
TEXAS VEGETABLE, MELON, AND CITRUS CROPS: PRODUCTION, LOCATION AND COMPETITIVE POSITION Stephen Fuller, Charles Hall and Merritt Taylor* TAMRC Information Report No. IR-1-91 April 1991 * Professor of Agricultural Economics, Texas A&M University, Extension Economist, Horticultural Marketing, Department of Agricultural Economics, Texas A&M University, and Extension Economist-Management, Weslaco, Texas, respectively.
Transcript of Stephen Fuller, Charles Hall and Merritt Taylor*...

TEXAS VEGETABLE, MELON, AND CITRUS CROPS: PRODUCTION, LOCATION AND
COMPETITIVE POSITION
Stephen Fuller, Charles Hall and Merritt Taylor*
TAMRC Information Report No. IR-1-91
April 1991
* Professor of Agricultural Economics, Texas A&M University, Extension Economist, Horticultural Marketing, Department of Agricultural Economics, Texas A&M University, and Extension Economist-Management, Weslaco, Texas, respectively.

TEXAS VEGETABLE, MELON, AND CITRUS CROPS: PRODUCTION, LOCATION AND COMPETITIVE POSITION
Texas Agricultural Market Research Center (TAMRC) Information Report No. IR-1-91 prepared by Stephen Fuller, Charles Ha1l, and Merritt Taylor. Fuller is a Professor and Hall an Extension Economist - Horticultural Marketing in the Department of Agricultural Economics at Texas A&M University, College Station, Texas. Taylor is an Extension Economist - Management at Weslaco, Texas. Appreciation is expressed to Karen Kunz and Haruna Bello for assembly of data included in this report. April 1991.
ABSTRACT: This report provides detailed statistical information on selected vegetable, melon, and citrus crop production in Texas. Information is offered on acreage, production, price, location of production, and competition during the Texas production and marketing window. In 1987, Texas producers harvested 63,500 acres of selected vegetable crops, 25,000 acres of honeydew and cantaloupe, and 23,000 acres of citrus with a total estimated value of $280 million. Texas vegetable, melon, and citrus production is concentrated in the Lower Rio Grande Valley. Texas is an important contributor to the nation's annual supply of onion, cabbage, carrots, cantaloupe, and honeydew. About half of the U.S. fresh cabbage shipments are originated by Texas producers in January, February, March, April, and December. Texas producers supply about two-thirds of fresh onion shipments in April and early May. In May and June, about half of the cantaloupe and three-fourths of the honeydew originate in Texas. Recent freezes distort Texas' long-run role as a citrus supplier.
The Texas Agricultural Market Research Center (TAMRC) has been providing timely, unique and professional research on a wide range of issues relating to agricultural markets and commodities of importance to Texas and the nation for more than two decades. TAMRC is a market research service of the Texas Agricultural Experiment Station and the Texas Agricultural Extension Service. The main TAMRC objective is to conduct research leading to expanded and more efficient markets for Texas and U.S. agricultural products. Major TAMRC research divisions include International Market Research, Consumer and Survey Research, Commodity Market Research, and Contemporary Market Issues Research.
ii
TABLE OF CONTENTS
Page
LIST OF TABLES. . . . . . . . . . . . . . . . . . . . . . . . . . . . . . . . . . . . . . . . . . . . . . . . .. 111
LIST OF FIGURES . . . . . . . . . . . . . . . . . . . . . . . . . . . . . . . . . . . . . . . . . . . . . . . .. VI
LIST OF APPENDIX TABLES ........................................ vii
INTRODUCTION . . . . . . . . . . . . . . . . . . . . . . . . . . . . . . . . . . . . . . . . . . . . . . . . . .. 1
TEXAS ACREAGE, YIELD, PRODUCTION, PRICE AND VALUE ............ 2
Vegetables . . . . . . . . . . . . . . . . . . . . . . . . . . . . . . . . . . . . . . . . . . . . . . . . . . . . 2
Melons ...................................................... 3
Citrus ....................................................... 3
LOCATION OF TEXAS VEGETABLE, MELON, AND CITRUS PRODUCTION .. 3
Vegetables . . . . . . . . . . . . . . . . . . . . . . . . . . . . . . . . . . . . . . . . . . . . . . . . . . . . 4
Melons ...................................................... 4
Citrus ....................................................... 4
TEXAS PRODUCTION AND COMPETING REGIONS ..................... 5
Vegetables . . . . . . . . . . . . . . . . . . . . . . . . . . . . . . . . . . . . . . . . . . . . . . . . . . .. 5
Melons and Citrus . . . . . . . . . . . . . . . . . . . . . . . . . . . . . . . . . . . . . . . . . . . . . . 6
THE TEXAS PRODUCTION WINDOW AND COMPETING REGIONS ........ 6
Vegetables . . . . . . . . . . . . . . . . . . . . . . . . . . . . . . . . . . . . . . . . . . . . . . . . . . .. 7
Melons and Citrus . . . . . . . . . . . . . . . . . . . . . . . . . . . . . . . . . . . . . . . . . . . . .. 7
CONCLUSIONS .................................................... 8
REFERENCES ........................................... . . . . . . . .. 10
APPENDIX . . . . . . . . . . . . . . . . . . . . . . . . . . . . . . . . . . . . . . . . . . . . . . . . . . . . . .. 60
iii
LIST OF TABLES
Table 1. Texas Broccoli: Harvested Acreage, Yield, Price, Production, and Value, Fresh Market and Processing, 1983-88 ................ 12
Table 2. Texas Cabbage: Harvested Acreage, Yield, Price, Production, and Value, Fresh Market and Processing, 1983-87 ................ 13
Table 3. Texas Carrots: Harvested Acreage, Yield, Price, Production, and Value, Fresh Market and Processing, 1983-88 ................ 14
Table 4. Texas Celery: Harvested Acreage, Yield, Price, Production, and Value, Fresh Market and Processing, 1983-88 . . . . . . . . . . . . . . . . . . .. 15
Table 5. Texas Cucumber: Harvested Acreage, Yield, Price, Production, and Value, Fresh Market and Processing, 1983-87 ................ 16
Table 6. Texas Green Bell Peppers: Harvested Acreage, Yield, Price, Production, and Value, Fresh Market and Processing, 198387 . . . . . . . . . . . . . . . . . . . . . . . . . . . . . . . . . . . . . . . . . . . . . . . . . . .. 17
Table 7. Texas Dry Onions: Harvested Acreage, Yield, Price, Production, and Value, Fresh Market and Processing, 198388 . . . . . . . . . . . . . . . . . . . . . . . . . . . . . . . . . . . . . . . . . . . . . . . . . . .. 18
Table 8. Texas Tomatoes: Harvested Acreage, Yield, Price, Production, and Value, Fresh Market, 1983-88 . . . . . . . . . . . . . . . . . . . . . . . . . . .. 19
Table 9. Texas Cantaloupe: Harvested Acreage, Yield, Price, Production, and Value, Fresh Market and Processing, 198387 . . . . . . . . . . . . . . . . . . . . . . . . . . . . . . . . . . . . . . . . . . . . . . . . . . .. 20
Table 10. Texas Honeydew: Harvested Acreage, Yield, Price, Production, and Value, Fresh Market and Processing, 1983-88 ................ 21
Table 11. Texas Grapefruit: Bearing Acreage, Yield, Production, Price, and Value, Fresh Market and Processing, 1983-88 ................ 22
Table 12. Texas Oranges: Bearing Acreage, Yield, Production, Price, and Value, Fresh Market and Processing, 1983-88 .................... 23
Table 13. Texas Broccoli: Location of Harvested Acreage, Fresh Market and Processing, 1981-85 ................................... 24
iv
Table 14. Texas Cabbage: Location of Harvested Acreage, Fresh Market and Processing, 1981-85 . . . . . . . . . . . . . . . . . . . . . . . . . . . . . . . . . . .. 25
Table 15. Texas Carrots: Location of Harvested Acreage, Fresh Market and Processing, 1981-85 .................................... 26
Table 16. Texas Cucumber: Location of Harvested Acreage, Fresh Market and Processing, 1981-85 . . . . . . . . . . . . . . . . . . . . . . . . . . . . .. 27
Table 17. Texas Green Bell Pepper: Location of Harvested Acreage, Fresh Market and Processing, 1981-85 ......................... 28
Table 18. Texas Dry Onions: Location of Harvested Acreage, Fresh Market and Processing, 1981-86 . . . . . . . . . . . . . . . . . . . . . . . . . . . . . . 29
Table 19. Texas Tomatoes: Location of Harvested Acreage, Fresh Market, 1981-85 ......................................... 30
Table 20. Texas Cantaloupe: Location of Harvested Acreage, Fresh Market and Processing, 1981-85 .............................. 31
Table 21. Texas Honeydew: Location of Harvested Acreage, Fresh Market and Processing, 1981-85 ............................ " 32
Table 22. Texas Grapefruit: Location of Bearing Acreage, Fresh Market and Processing, 1981-89 .................................... 33
Table 23. Texas Oranges: Location of Bearing Acreage, Fresh Market and Processing, 1981-89 .................................... 34
Table 24. Estimated Broccoli Production and Acreage by State, Fresh Market and Processing, 1983-88 .............................. 35
Table 25. Estimated Cabbage Production and Acreage by State, Fresh Market and Processing, 1977-81 .............................. 36
Table 26. Estimated Carrot Production and Acreage by State, Fresh Market and Processing, 1983-88 . . . . . . . . . . . . . . . . . . . . . . . . . . . . .. 37
Table 27. Estimated Celery Production and Acreage by State, Fresh Market and Processing, 1983-88 . . . . . . . . . . . . . . . . . . . . . . . . . . . . .. 38
Table 28. Estimated Cucumber Production and Acreage by State, Processing, 1984-88 ....................................... 39
v
Table 29. Estimated Green Bell Pepper Production and Acreage by State~ Fresh Market and Processing, 1977-81 ......................... 40
Table 30. Estimated Onion Production and Acreage by State, Fresh Market and Processing, 1983-88 ............................ " 41
Table 31. Estimated Tomato Production and Acreage by State, Fresh Market and Processing, 1983-88 . . . . . . . . . . . . . . . . . . . . . . . . . . . . .. 42
Table 32. Estimated Cantaloupe Production and Acreage by State, Fresh Market, 1977-81 ......................................... 43
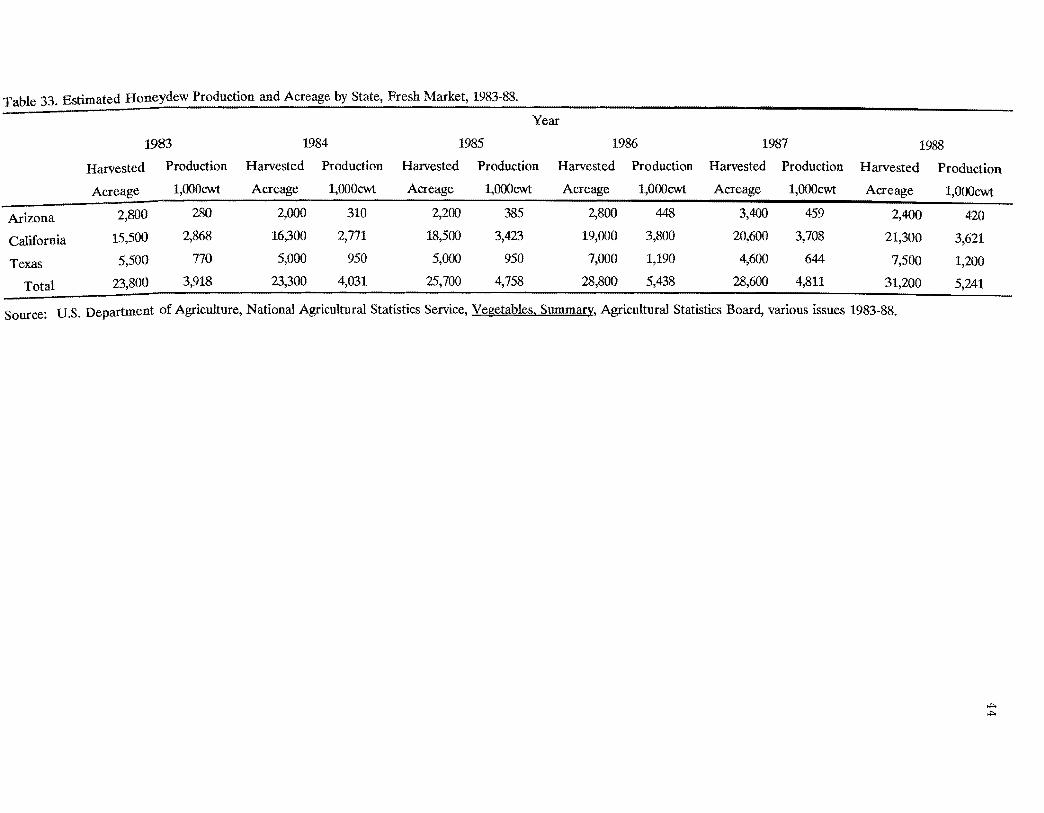
Table 33. Estimated Honeydew Production and Acreage by State, Fresh Market, 1983-88 ......................................... 44
Table 34. Estimated Grapefruit Production and Bearing Acreage by State, Fresh Market and Processing, 1982-88 ......................... 45
Table 35. Estimated Orange Production and Bearing Acreage by State, Fresh Market and Processing, 1982-88 ............ . . . . . . . . . . . .. 46
vi
LIST OF FIGURES
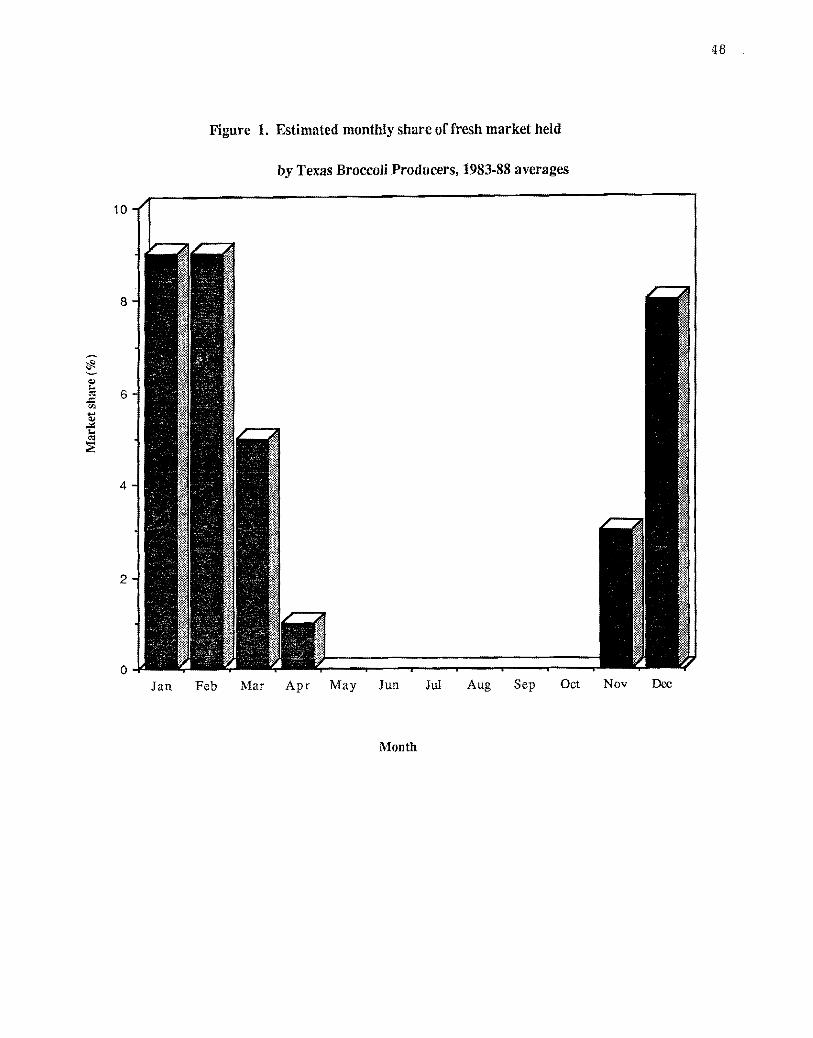
Figure 1. Estimated monthly share of fresh market held by Texas Broccoli Producers, 1983-88 averages . . . . . . . . . . . . . . . . . . . . . . . . .. 48
Figure 2. Estimated monthly share of fresh market held by Texas Cabbage Producers, 1983-88 averages ......................... 49
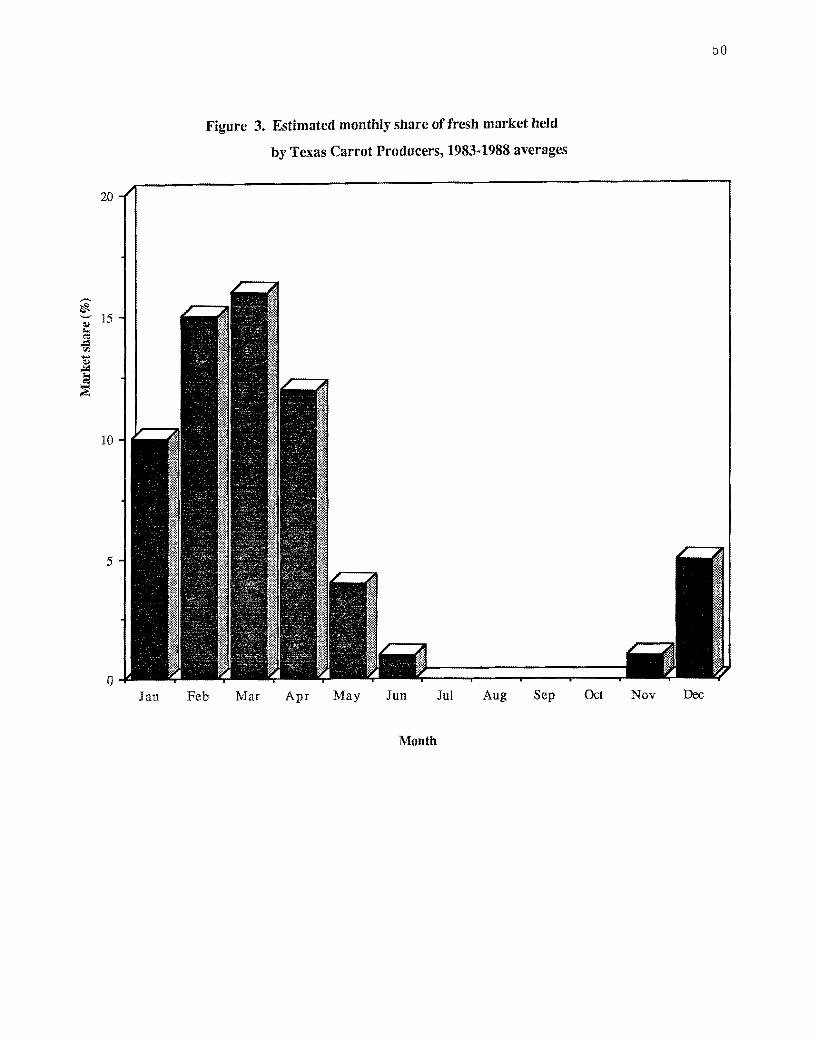
Figure 3. Estimated monthly share of fresh market held by Texas Carrot Producers, 1983-88 averages ................................ 50
Figure 4. Estimated monthly share of fresh market held by Texas Celery Producers, 1983-88 averages ................................ 51
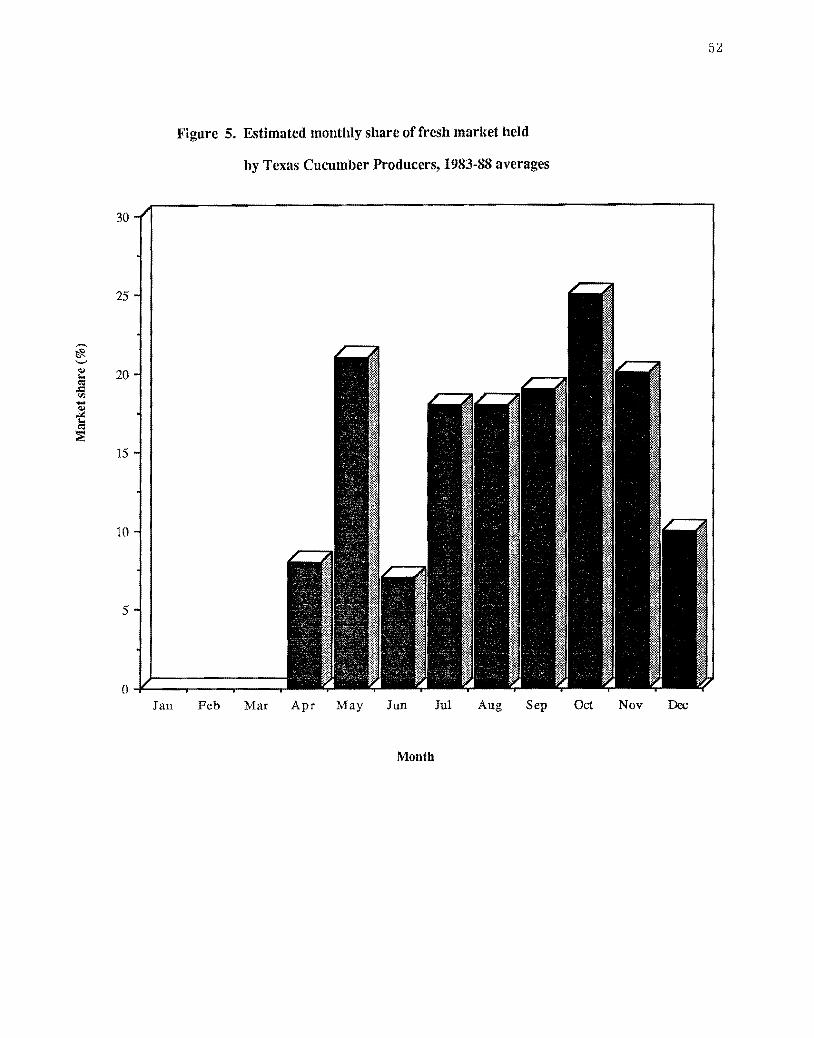
Figure 5. Estimated monthly share of fresh market held by Texas Cucumber Producers, 1983-88 averages ........................ 52
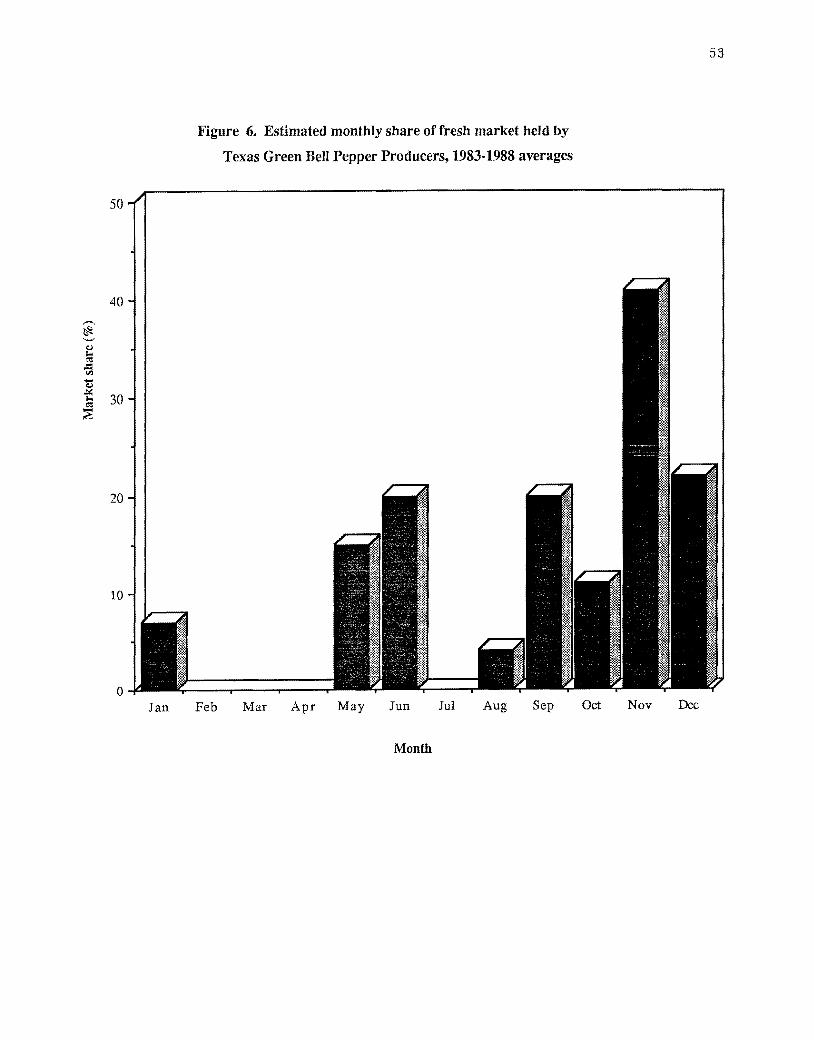
Figure 6. Estimated monthly share fresh market held by Texas Green Bell Pepper Producers, 1983-88 averages ....................... 53
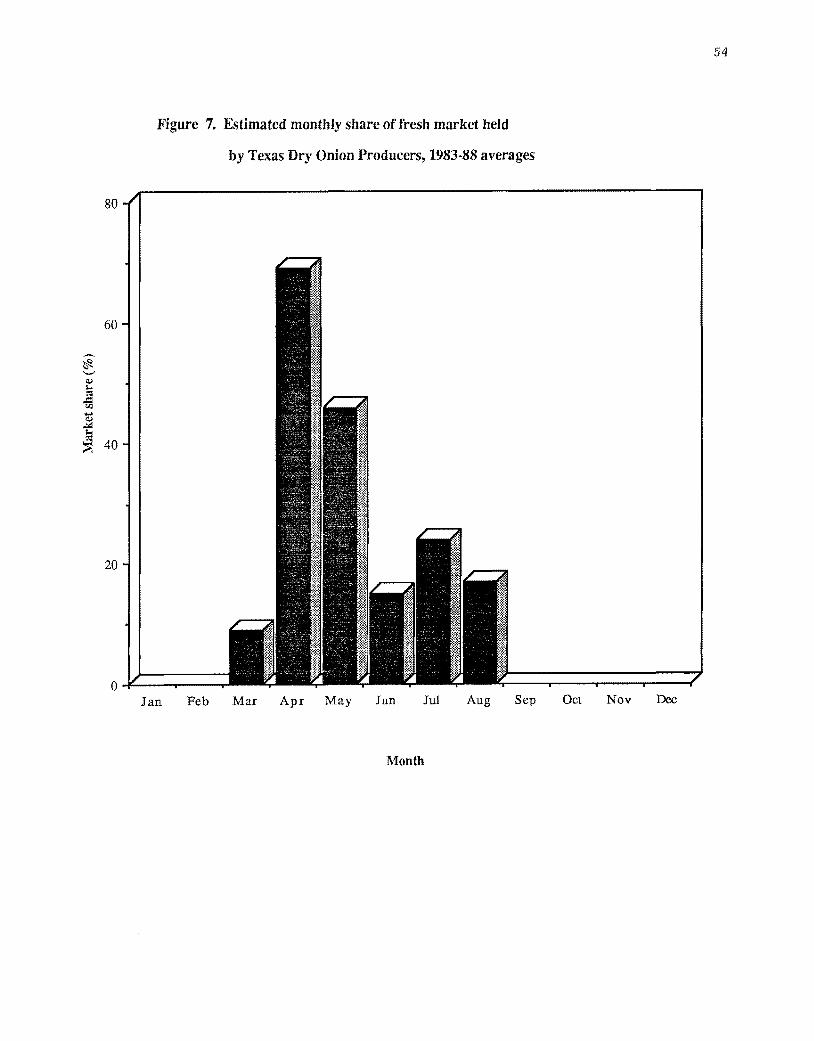
Figure 7. Estimated monthly share fresh market held by Texas Dry Onion Producers, 1983-88 averages ................................ 54
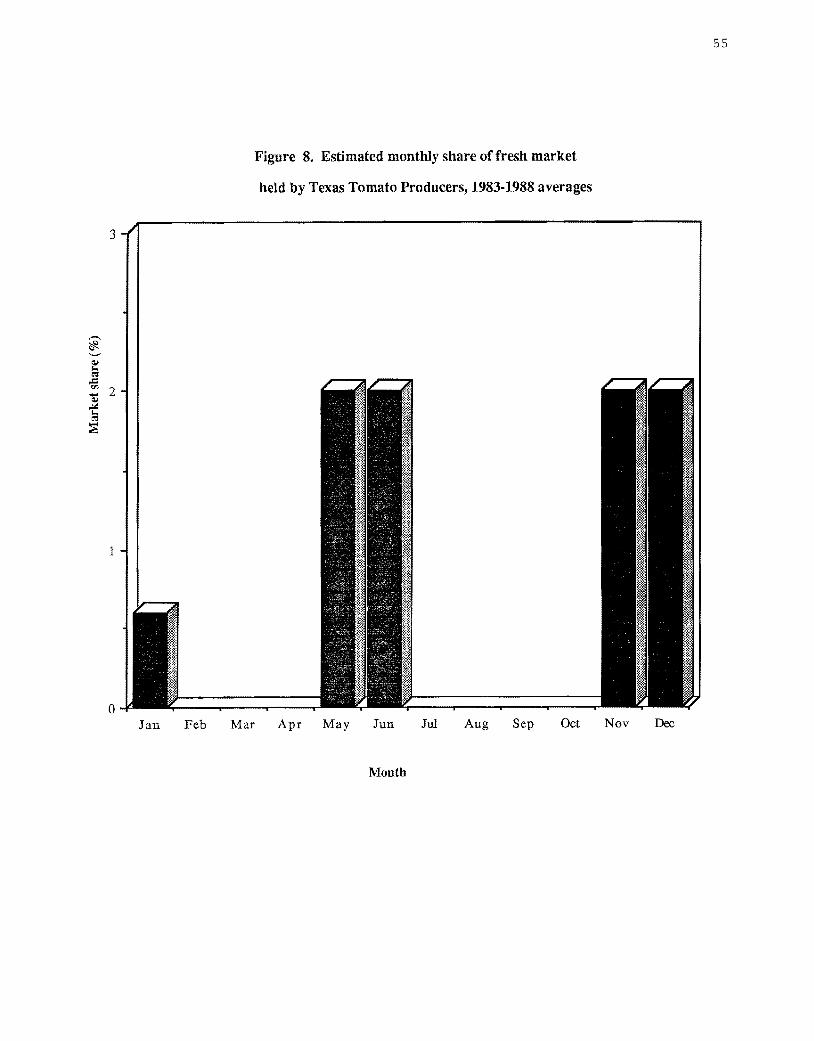
Figure 8. Estimated monthly share of fresh market held by Texas Tomato Producers, 1983-88 averages ................................ 55
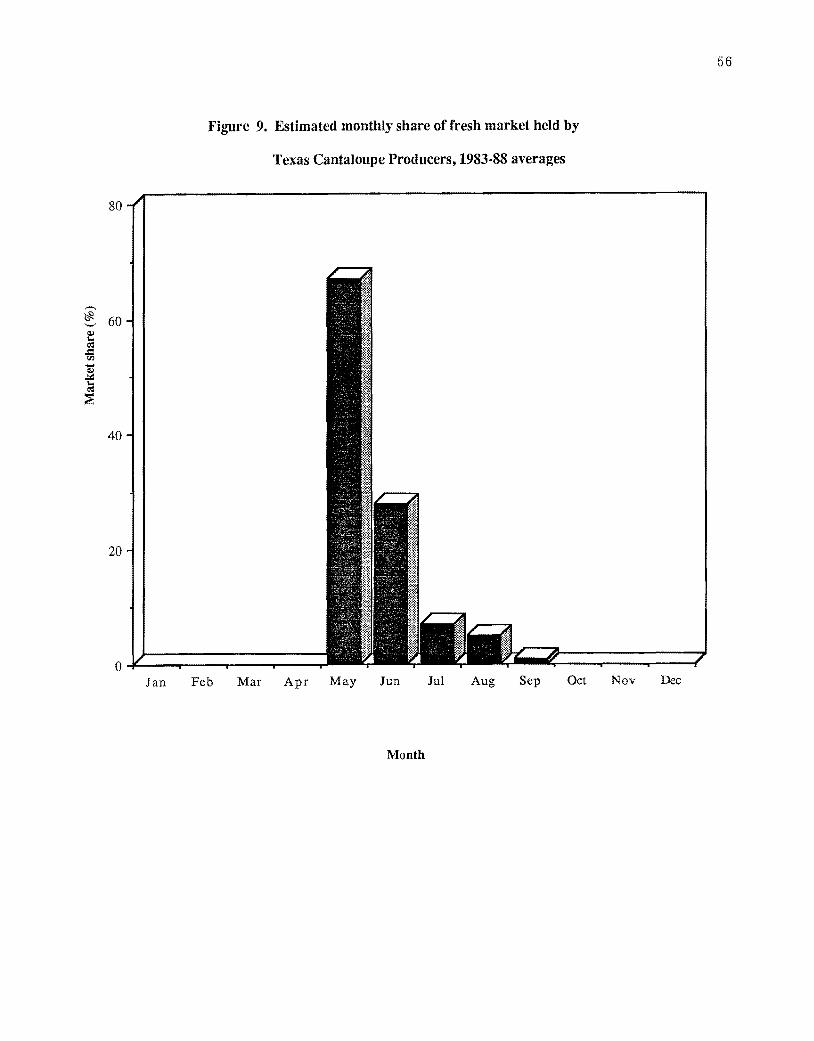
Figure 9. Estimated monthly share of fresh market held by Texas Cantaloupe Producers, 1983-88 averages ....................... 56
Figure 10. Estimated monthly share of fresh market held by Texas Honeydew Producers, 1983-88 averages ........................ 57
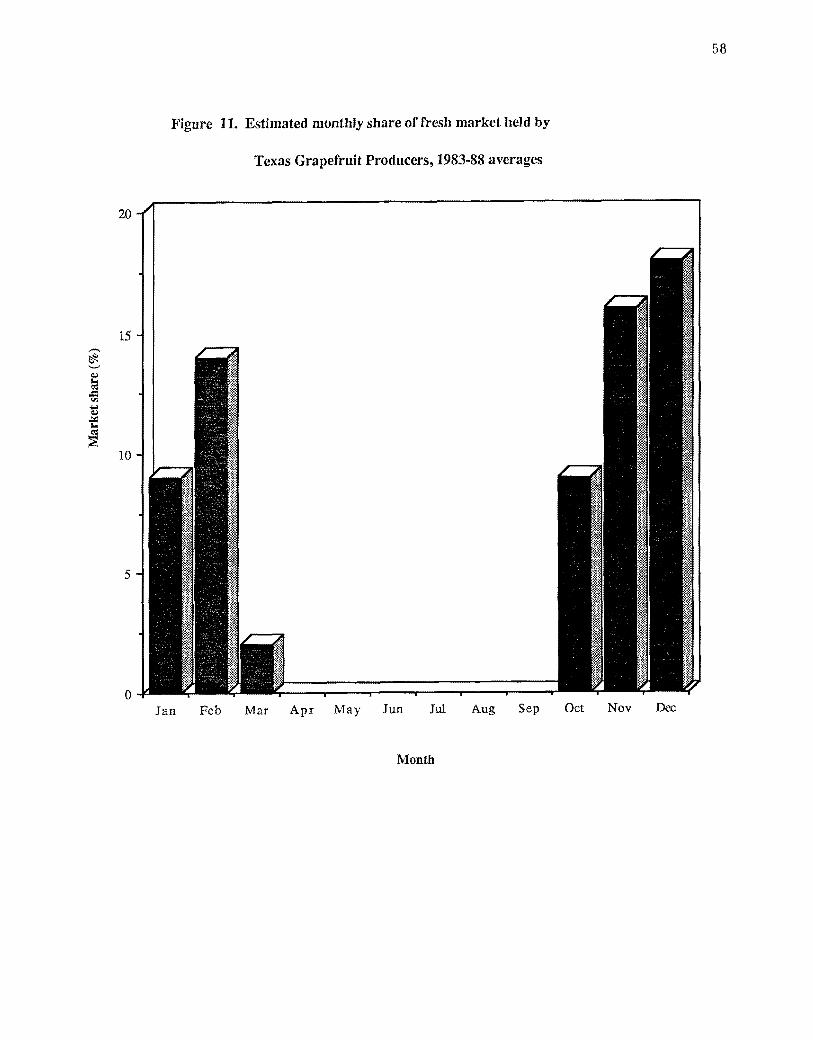
Figure 11. Estimated monthly share of fresh market held by Texas Grapefruit Producers, 1983-88 averages ....... . . . . . . . . . . . . . . . .. 58
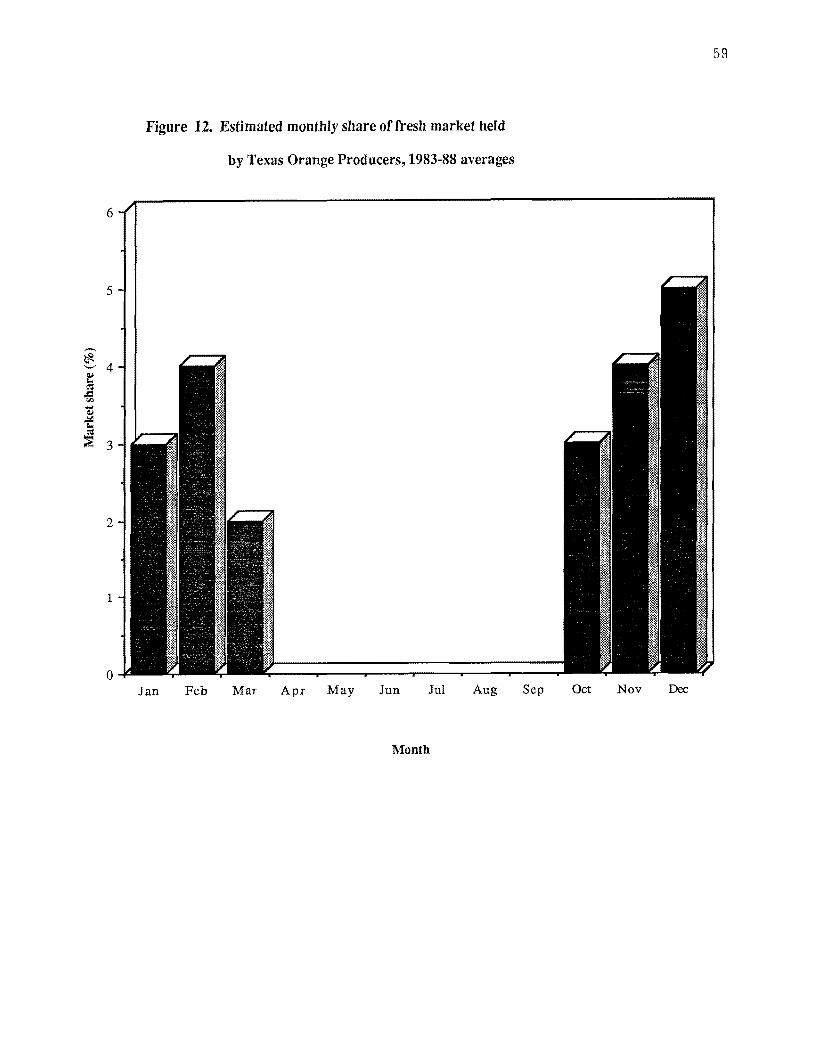
Figure 12. Estimated monthly share of fresh market held by Texas Orange Producers, 1983-88 averages ................................ 59
vii
LIST OF APPENDIX TABLES
Table 1A. Texas and Competing Regions Market Share by Month for Broccoli, During the Texas Window, 1983 ...................... 61
Table 1A. Texas and Competing Regions Market Share by Month for Broccoli, During the Texas Window, 1984 ...................... 62
Table 1A. Texas and Competing Regions Market Share by Month for Broccoli, During the Texas Window, 1985 ...................... 63
Table 1A. Texas and Competing Regions Market Share by Month for Broccoli, During the Texas Window, 1986 ...................... 64
Table 1A Texas and Competing Regions Market Share by Month for Broccoli, During the Texas Window, 1987 ...................... 65
Table 1A. Texas and Competing Regions Market Share by Month for Broccoli, During the Texas Window, 1988 ...................... 66
Table 2A. Texas and Competing Regions Market Share by Month for Cabbage, During the Texas Window, 1983 .. . . . . . . . . . . . . . . . . . . .. 67
Table 2A. Texas and Competing Regions Market Share by Month for Cabbage, During the Texas Window, 1984 ..... . . . . . . . . . . . . . . . . . 71
Table 2A. Texas and Competing Regions Market Share by Month for Cabbage, During the Texas Window, 1985 ............. . . . . . . . .. 75
Table 2A. Texas and Competing Regions Market Share by Month for Cabbage, During the Texas Window, 1986 .. . . . . . . . . . . . . . . . . . . .. 79
Table 2A. Texas and Competing Regions Market Share by Month for Cabbage, During the Texas Window, 1987 ...................... 83
Table 2A Texas and Competing Regions Market Share by Month for Cabbage, During the Texas Window, 1988 ...................... 85
Table 3A. Texas and Competing Regions Market Share by Month for Carrots, During the Texas \Vindow, 1983 ... . . . . . . . . . . . . . . . . . . .. 87
Table 3A. Texas and Competing Regions Market Share by Month for Carrots, During the Texas Window, 1984 ....... . . . . . . . . . . . . . . .. 89

viii
Table 3A. Texas and Competing Regions Market Share by Month for Carrots, During the Texas Window, 1985 ....................... 91
Table 3A. Texas and Competing Regions Market Share by Month for Carrots, During the Texas Window, 1986 . . . . . . . . . . . . . . . . . . . . . .. 93
Table 3A. Texas and Competing Regions Market Share by Month for Carrots, During the Texas Window, 1987 . . . . . . . . . . . . . . . . . . . . . .. 95
Table 3A. Texas and Competing Regions Market Share by Month for Carrots, During the Texas Window, 1988 ....................... 97
Table 4A. Texas and Competing Regions Market Share by Month for Celery, During the Texas Window, 1983 . . . . . . . . . . . . . . . . . . . . . . .. 99
Table 4A. Texas and Competing Regions Market Share by Month for Celery, During the Texas Window, 1984 . . . . . . . . . . . . . . . . . . . . . .. 100
Table 4A. Texas and Competing Regions Market Share by Month for Celery, During the Texas Window, 1985 . . . . . . . . . . . . . . . . . . . . . .. 101
Table 4A. Texas and Competing Regions Market Share by Month for Celery, During the Texas Window, 1986 . . . . . . . . . . . . . . . . . . . . . .. 102
Table 4A. Texas and Competing Regions Market Share by Month for Celery, During the Texas Window, 1987 . . . . . . . . . . . . . . . . . . . . . .. 103
Table 4A. Texas and Competing Regions Market Share by Month for Celery, During the Texas Window, 1988 . . . . . . . . . . . . . . . . . . . . . .. 104
Table SA Texas and Competing Regions Market Share by Month for Cucumbers, During the Texas Window, 1983 ................... 105
Table SA. Texas and Competing Regions Market Share by Month for Cucumbers, During the Texas Window, 1984 ................... 107
Table SA. Texas and Competing Regions Market Share by Month for Cucumbers, During the Texas Window, 1985 ................... 109
Table SA. Texas and Competing Regions Market Share by Month for Cucumbers, During the Texas Window, 1986 ................... 113
Table SA. Texas and Competing Regions Market Share by Month for Cucumbers, During the Texas Window, 1987 ................... 117
ix
Table SA. Texas and Competing Regions Market Share by Month for Cucumbers, During the Texas Window, 1988 ................... 119
Table 6A. Texas and Competing Regions Market Share by Month for Bell Peppers, During the Texas Window, 1983 ..................... 121
Table 6A. Texas and Competing Regions Market Share by Month for Bell Peppers, During the Texas Window, 1984 ..................... 123
Table 6A. Texas and Competing Regions Market Share by Month for Bell Peppers, During the Texas Window, 1985 ..................... 126
Table 6A. Texas and Competing Regions Market Share by Month for Bell Peppers, During the Texas Window, 1986 ..................... 128
Table 6A. Texas and Competing Regions Market Share by Month for Bell Peppers, During the Texas Window, 1987 ..................... 130
Table 6A. Texas and Competing Regions Market Share by Month for Bell Peppers, During the Texas Window, 1988 ..................... 132
Table 7A. Texas and Competing Regions Market Share by Month for Dry Onions, During the Texas Window, 1983 ...................... 134
Table 7A. Texas and Competing Regions Market Share by Month for Dry Onions, During the Texas Window, 1984 ...................... 138
Table 7A. Texas and Competing Regions Market Share by Month for Dry Onions, During the Texas Window, 1985 ...................... 140
Table 7A. Texas and Competing Regions Market Share by Month for Dry Onions, During the Texas Window, 1986 ...................... 142
Table 7A. Texas and Competing Regions Market Share by Month for Dry Onions, During the Texas Window, 1987 ...................... 144
Table 7A Texas and Competing Regions Market Share by Month for Dry Onions, During the Texas Window, 1988 ...................... 146
Table 8A. Texas and Competing Regions Market Share by Month for Tomatoes, During the Texas Window, 1983 .................... 147
Table 8A. Texas and Competing Regions Market Share by Month for Tomatoes, During the Texas Window, 1984 .................... 148

• • • • • • •
x
Table SA. Texas and Competing Regions Market Share by Month for Tomatoes, During the Texas Window, 1985 .................... 149
Table SA Texas and Competing Regions Market Share by Month for Tomatoes, During the Texas Window, 1986 .................... 150
Table 8A. Texas and Competing Regions Market Share by Month for Tomatoes, During the Texas Window, 1987 ......... 0 1510 • 0 ••• 0 • 0 0
Table 8A. Texas and Competing Regions Market Share by Month for Tomatoes, During the Texas Window, 1988 .. 0 152••••••• 0 • 0 • 0 0 0 •• 0
Table 9Ao Texas and Competing Regions Market Share by Month for Cantaloupes, During the Texas Window, 1983 " 0 • • • • • • •• 153
Table 9A. Texas and Competing Regions Market Share by Month for Cantaloupes, During the Texas Window, 1984 .................. 154
Table 9A. Texas and Competing Regions Market Share by Month for Cantaloupes, During the Texas Window, 1985 .................. 155
Table 9A. Texas and Competing Regions Market Share by Month for Cantaloupes, During the Texas Window, 1986 ... 0 156••• 0 •• 0 • • • • • ••
Table 9A. Texas and Competing Regions Market Share by Month for Cantaloupes, During the Texas Window, 1987 . 1570 • 0 0 0 •• 0 0 0 •••••• 0
Table 9A. Texas and Competing Regions Market Share by Month for Cantaloupes, During the Texas Window, 1988 .................. 158
Table lOA. Texas and Competing Regions Market Share by Month for Honeydews, During the Texas Window, 1983 .. 0 159• 0 ••• 0 0 0 0 • • • • • ••
Table lOA. Texas and Competing Regions Market Share by Month for Honeydews, During the Texas Window, 1984 . 1600 • 0 •• 0 0 •• 0 0 • • • • • ••
Table lOA. Texas and Competing Regions Market Share by Month for Honeydews, During the Texas Window, 1985 ........ . . . . . . . . . .. 161
Table lOA. Texas and Competing Regions Market Share by Month for Honeydews, During the Texas Window, 1986 ....... 0 162•••••••••• 0
Table lOA. Texas and Competing Regions Market Share by Month for Honeydews, During the Texas Window, 1987 .. 0 1630 •• 0 ••• 0 ••••• 0 0 0

xi
Table lOA. Texas and Competing Regions Market Share by Month for Honeydews, During the Texas Window, 1988 . . . . . . . . . . . . . . . . . .. 164
Table llA. Texas and Competing Regions Market Share by Month for Grapefruit, During the Texas Window, 1984 . . . . . . . . . . . . . . . . . . .. 165
Table llA. Texas and Competing Regions Market Share by Month for Grapefruit, During the Texas Window, 1985 . . . . . . . . . . . . . . . . . . .. 166
Table llA. Texas and Competing Regions Market Share by Month for Grapefruit, During the Texas Window, 1986 . . . . . . . . . . . . . . . . . . .. 167
Table llA. Texas and Competing Regions Market Share by Month for Grapefruit, During the Texas Window, 1987 .................... 168
Table 11A. Texas and Competing Regions Market Share by Month for Grapefruit, During the Texas Window, 1988 . . . . . . . . . . . . . . . . . . .. 170
Table 12A. Texas and Competing Regions Market Share by Month for Oranges, During the Texas Window, 1984 ..................... 171
Table 12A. Texas and Competing Regions Market Share by Month for Oranges, During the Texas Window, 1985 ..................... 172
Table 12A. Texas and Competing Regions Market Share by Month for Oranges, During the Texas Window, 1986 ..................... 173
Table 12A. Texas and Competing Regions Market Share by Month for Oranges, During the Texas Window, 1987 ..................... 174
Table 12A. Texas and Competing Regions Market Share by Month for Oranges, During the Texas Window, 1988 ..................... 175
TEXAS VEGETABLE, MELON, AND CITRUS CROPS: PRODUCTION, LOCATION AND
COMPETITIVE POSITION
Stephen Fuller, Charles Hall and Merritt Taylor
The purpose of this report is to provide statistical data on selected vegetable, melon,
and citrus fruit crops produced in Texas. The products examined include eight vegetables
(broccoli, cabbage, carrots, celery, cucumbers, green bell peppers, onions, and tomatoes),
two melons (cantaloupe and honeydew), and two citrus fruits (grapefruit and oranges). The
report offers information on (1) acres harvested, yield/acre, production, prices, and total
value for each of the Texas-produced products; (2) the production locations for each of the
crops produced in Texas; (3) competing states' production of each commodity; and (4)
regional competitors during Texas' production window. An effort was made to collect at
least five years of historical data for each product. However, due to reductions in federal
and state funding and changing commodity priorities, statistical data for some products were
not available for the most recent five year period.
Data to construct this report were made available by the U.S. Department of
Agriculture (USDA) and the Texas Department of Agriculture (IDA). A series of annual
publications from Texas Vegetable Statistics (IDA), provided information on acres
harvested, yield/acre, production, prices, total value, and location of Texas' vegetable and
melon production. The Vegetable Summary, an annual USDA publication, supplied data
on production in Texas as well as that of competing states. Similar information on citrus
was taken from the Citrus Fruits, another annual USDA publication. Data regarding the
location of citrus production in Texas was from the Texas Citrus Tree Inventory Survey

2
(IDA). Information on regional competitors during Texas' production window came from
Fresh Fruit and Vegetable Shipments (USDA).
The report is divided into four sections. The first two sections provide detail about
the level and location of acreage, yield, production, price and value of Texas vegetable,
melon, and citrus products. The latter two sections offer insight on Texas' relative role as
a national producer.
TEXAS ACREAGE, YIELD, PRODUCTION, PRICE AND VALUE
An effort was made to include 1983-87 data for each product and in the case of
broccoli, carrots, celery, onions, honeydew, and citrus, the 1988 data were available and
accordingly were included. Unfortunately, statistics for Texas celery were available only for
1988.
Vegetables
In 1987, Texas producers harvested 63,500 acres of the selected vegetable crops
(excluding celery) and sold this production for an estimated $197.2 million. In contrast,
products from 83,600 acres were harvested in 1983 at a value of $192.9 million (Tables 1-8).
Typically, onions have occupied the greatest acreage and have had the largest total value.
The statewide value of onion production during the study period ranged from a high of
$87.5 million in 1984 to a low of $48.5 million in 1988 (Table 7). Other total value leaders
included cabbage, with annual sales ranging from $34.6 to $76.9 million during the same
period (Table 2). The annual value of green bell peppers varied from $22.6 to $33.8 million
(Table 6) while the range on carrots extended from $17.2 to $30.1 million (Table 3). The
3
remaining vegetables (broccoli, cucumbers, and tomatoes) have been allotted smaller
acreage and have generally returned less total value to producers.
Melons
Cantaloupe and honeydew are important Texas crops with annual producer sales
averaging about $58 million during the 1983-87 period. Harvested acreage of these crops
has been relatively constant at about 25,000 acres (Tables 9 and 10).
Citrus
A catastrophic freeze in December of 1983 seriously damaged the Texas citrus
industry. The bearing acreage of grapefruit and oranges in 1983-84 was estimated at 43,256
and 24,280 respectively (Tables 11 and 12). In the several seasons following the freeze,
bearing acreage declined to about one-third of the 1983-84 season. Despite the reduced
acreage, the value of annual citrus production in the 1987-88 season ($39.2 million)
exceeded that of 1983-84 ($20.9 million). The low price and value in 1983-84 was the result
of the freeze-damaged fruit.
LOCATION OF TEXAS VEGETABLE, MELON AND CITRUS PRODUCTION
Texas harvested acreage by subregion was used as a proxy to estimate Texas
production of vegetable, melon, and citrus output because the data is unavailable by Texas
subregion. Estimates of harvested acreage by subregion was discontinued in 1986 (except
onions). The most recent five-year period of data extends from 1981-85. Also, no

4
information on Texas harvested celery acreage is available by subregion since efforts to
collect Texas celery data commenced after 1986.
Vegetables
The lower Rio Grande Valley is the dominant source of Texas vegetables (Tables 13
19). For example, in 1983 about 70% of the harvested acreage for the selected vegetables
(excluding celery) was located in the lower Rio Grande Valley. The Plains and Winter
Garden region included about 12% and 10% of the state's harvested acreage, respectively,
in 1983. Acreage leaders in the Valley include onions, cabbage, carrots, cucumbers, green
bell peppers, and tomatoes.
Melons
About two-thirds of the harvested cantaloupe acreage and 75% of the honeydew
acreage is located in the lower Rio Grande Valley (Tables 20,21). The Trans Pecos region
typically includes nearly 12% of the harvested cantaloupe and honeydew and the Winter
Garden region about 8% of the cantaloupe acreage.
Citrus
Based on the Texas Citrus Tree Survey, all Texas citrus acreage is located in the
lower Rio Grande Valley. Hidalgo county includes about 80% of all bearing acreage.
Cameron county includes about 15% of the bearing acreage and Willacy county the
remainder (Tables 22,23).
5
TEXAS PRODUCTION AND COMPETING REGIONS
To gain perspective on the role of Texas as a national vegetable, melon, and citrus
supplier, historic data on harvested acreage and production by state were collected. Efforts
were made to collect the most recent 5-year series which, in most cases, included the 1983
88 period. However, for cabbage, green bell pepper, and cantaloupe a comparable historic
record exists only prior to 1981. Consequently, data for those crops for 1977-81 are included
here.
Vegetables
Texas is an important contributor to the annual national supply of vegetables, but
consistently leads the nation only with its spring and summer non-storage onion production
(Tables 24-31). Historically, Texas has produced about half of the spring/summer onion
crop (Table 30). Typically, Texas and Florida rank either first or second as suppliers of
cabbage. Texas generally supplies about one-fifth of the annual national cabbage output
(Table 25). Texas is the second largest carrot supplier with a production share that averages
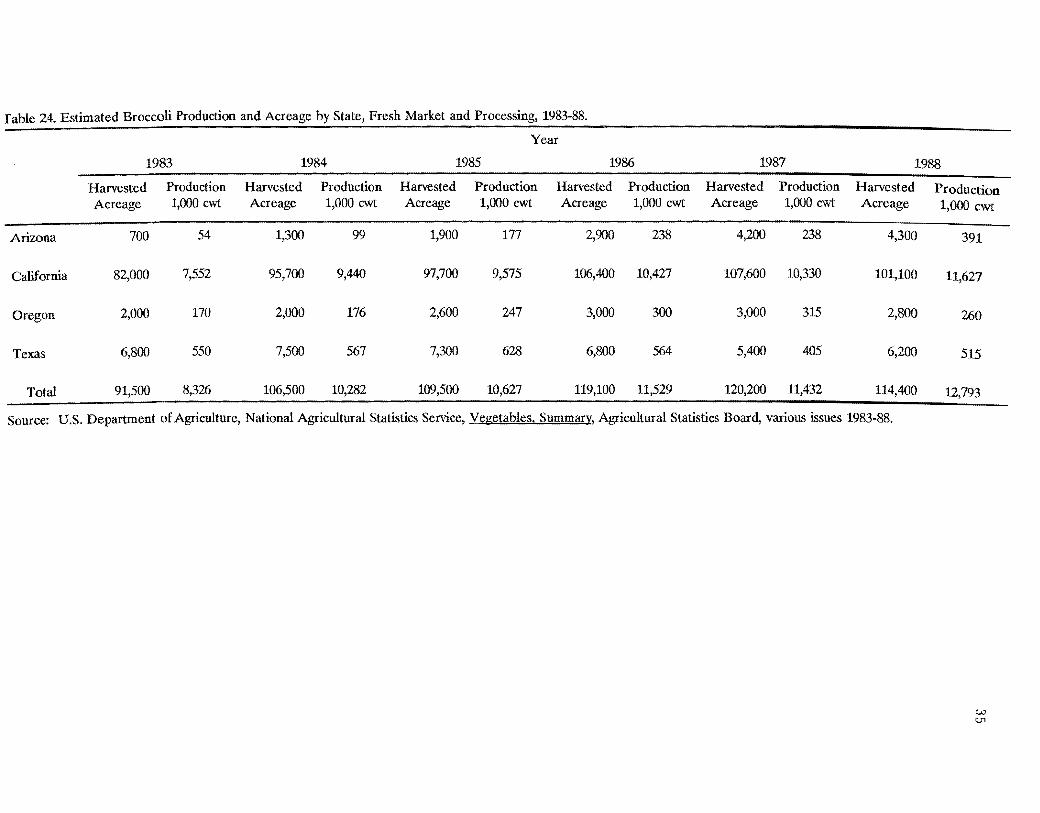
about 10% (Table 26). Only about 5% of the annual broccoli supply is generated by Texas
producers. Nevertheless, Texas ranks second behind California which supplies over 90% of
all broccoli (Table 24). Texas ranks as the third and fourth most important supplier of
green bell peppers (Table 29) and cucumbers (Table 28), respectively, with production
shares of about 13 and 7%. On the average, Texas produces only about 1 % of the annual
fresh tomato supply (Table 31).
6
Melons and Citrus
Texas is the second largest national supplier of cantaloupe (Table 32) and honeydew
melons (Table 33) behind California. Texas generally produces about 17 and 20% of all
cantaloupe and honeydew, respectively. The freeze that badly damaged the Texas citrus
industry in December of 1983, also makes it difficult to obtain an accurate perspective on
Texas' role as a national citrus supplier (Tables 34 and 35). During the study period, Texas
produced from 0 to 18% of the U.S. grapefruit output and 0 to 3% of all national orange
output.
TIlE TEXAS PRODUCTION WINDOW AND COMPETING REGIONS
The most accurate perspective of the role of any region as a national supplier of a
perishable product is best provided by examining production data over a shorter time frame
than one year. Accordingly, the share of the nation's monthly fresh vegetable, melon, and
fruit shipments originating in Texas was calculated. Shipment data for products destined
to the fresh market are gathered by the USDA Agricultural Marketing Service (AMS). In
addition to monthly domestic shipments by state, data were collected on foreign exports by
state and imports by foreign nations. All data is on a monthly basis over the five-year period
of 1983-88. The complete data set is presented in Appendix A. The monthly market shares
held by Texas producers for various vegetables and fruit products are shown in Figures 1
through 12.

7
Vegetables
The data indicate that Texas supplies a significant share of the domestically
originated fresh vegetable shipments in selected months. For example, nearly half of all
fresh cabbage domestic shipments originate in Texas during January, February, March,
April, and December (Figure 2). Further, Texas producers supply about two-thirds of all
fresh onion shipments in April and about half in May (Figure 7). Texas is also an important
supplier of carrots, cucumbers, and green bell peppers (Figures 3, 5 and 6). The monthly
market share of Texas vegetables does not generally exceed 25% in any given month. The
Texas shipping season is extended, however, for carrots, cucumbers, and peppers. Carrots
and green bell peppers are shipped in significant quantities for eight months and cucumbers
for nine months per year. Broccoli and ceJ,ery shipments by Texas producers are confined
to the winter and fall months and have monthly market shares no larger than 8 to 12%
(Figures 1 and 4). The share of the monthly national fresh tomato market supplied by
Texas in May, June, November, and December approaches 2% (Figure 8).
Melons and Citrus
Texas is a leading supplier of melons during the spring season (Figures 9, 10). In
May, about two-thirds of the cantaloupe and 97% of the honeydew originate in Texas. In
June, however, Texas supplies only about 28% of the cantaloupe and 60% of the honeydew.
Texas producers made small shipments of melons to foreign buyers in the 1983 and 1984
seasons.
The freeze of December 1983 distorts the image of Texas as a national supplier of
citrus (Figures 11 and 12). Based on data from the two most recent growing seasons (1987
8
and 1988), the Texas monthly market share during the fall ranges from 9 to 18% for
grapefruit and in the spring from 2 to 14% (Figure 11). The Texas orange monthly market
share averages about 3% in both the spring and fall seasons.
CONCLUSIONS
The role of Texas as a major national supplier of vegetables, melons, and citrus has
changed over the years. The major feature of Texas production has been the instability
caused by several years of severe weather problems. The area devoted to vegetables has
dropped by nearly 25% since the early 1980s. Nevertheless, while onion acreage has
dropped markedly, cabbage, green bell peppers and carrots have all experienced acreage
increases. Other vegetables like broccoli, cucumbers, and tomatoes have declined in
production.
Melon production in Texas has remained fairly constant while Texas citrus production
was devastated by a freeze in 1983 and again in 1988. Citrus acreage as a result has
dwindled significantly.
Despite declines in production, Texas still remains a significant national supplier of
vegetables and melons. Texas is the nation's largest supplier of onions and second largest
supplier of cabbage, carrots, broccoli, cantaloupe, and honeydew melons. The national
ranking of Texas as a supplier of citrus has slipped considerably in recent years. During
certain months of the year (the "Texas window"), however, shipments of vegetables and
melons from Texas dominate national markets. Texas onions, for example, account for 66%
of the onion market in April and May. Texas melons dominate during the spring season.

9
At the same time, Texas ships most of its broccoli and celery in the fall and winter months
but only accounts for 8 to 12% of national supply during those months.
10
REFERENCES
U.S. Department of Agriculture, National Agricultural Statistics Service, Citrus Fruits, Agricultural Statistics Board, various issues 1982-1988.
U.S. Department of Agriculture, National Agricultural Statistics Service, Ve~etable Summary, Crop Reporting Board, various issues 1977-81.
U.S. Department of Agriculture, National Agricultural Statistics Service, Texas Ve~etable Statistics, Agricultural Statistics Board, various issues 1983-88.
U.S. Department of Agriculture, Agricultural Marketing Service, Fresh Fruit and Ve~etable Shipments, Fruit and Vegetable Division, Market News Branch, various issues, 19841988.

11
TABLES

Table 1. Texas Broccoli: Harvested Acreage, Yield, Price, Production, and Value, Fresh Market and Processing, 1983-88.
Year Harvested Acres Yield/Acre Production Price Value winter Fall winter Fall Winter Fall winter Fall winter Fall
---Acres--- ---cwt-- -1000 cwt ---$/cwt-- ---$1000--
1983 3,300 3,500 84 78 277 273 37.73 40.23 10,452 10,982
1984 2,700 4,800 59 85 159 408 45.53 30.47 7,240 12,432
1985a 7,300 86 628 $23.40 14,695
1986 6,800 83 564 25.80 14,562
1987 5,400 75 405 29.20 11,826
1988 6,200 83 515 20.60 10,590
aWinter and Fall estimates were discontinued in 1985.
Source: U.S. Department of Agriculture, Texas Vegetable Statistics, various issues 1983-88.
f---' N

Table 2. Texas Cabbage: Harvested Acreage, Yield, Price, Production, and Value, Fresh Market and Processing, 1983-87.
Year Harvested Acres Yield/Acre Production Price Value
Acres cwt 1000 cwt $/cwt $1000
1983 14,600 285 4,162 8.30 34,589
1984 14,400 285 4,088 18.80 76,983
1985 14,000 270 3,780 10.50 39,690
1986 16,200 300 4,860 7.55 36,693
1987 15,000 330 4,950 7.40 36,630
source: U.S. Department of Agriculture, Texas Vegetable statistics, various issues 1983-87.
f-' W

Table 3. Texas Carrots: Harvested Acreage, Yield, Price, Production, and Value, Fresh Market and Processing, 1983-88.
Year Harvested Acres Yield/Acre Production Prices Value
acres cwt 1000 cwt $/cwt $1000
1983 15,300 209 3,201 8.58 27,458
1984 15,000 145 2,175 13.80 30,096
1985 13,800 145 2,001 11. 20 22,432
1986 11,600 175 2,030 8.94 18,148
1987 11,500 190 2,185 8.48 18,520
1988 10,000 180 1,800 9.59 17,269
Source: U.S. Department of Agriculture, Texas Vegetable statistics, various issues 1983-88.
f--"..,.
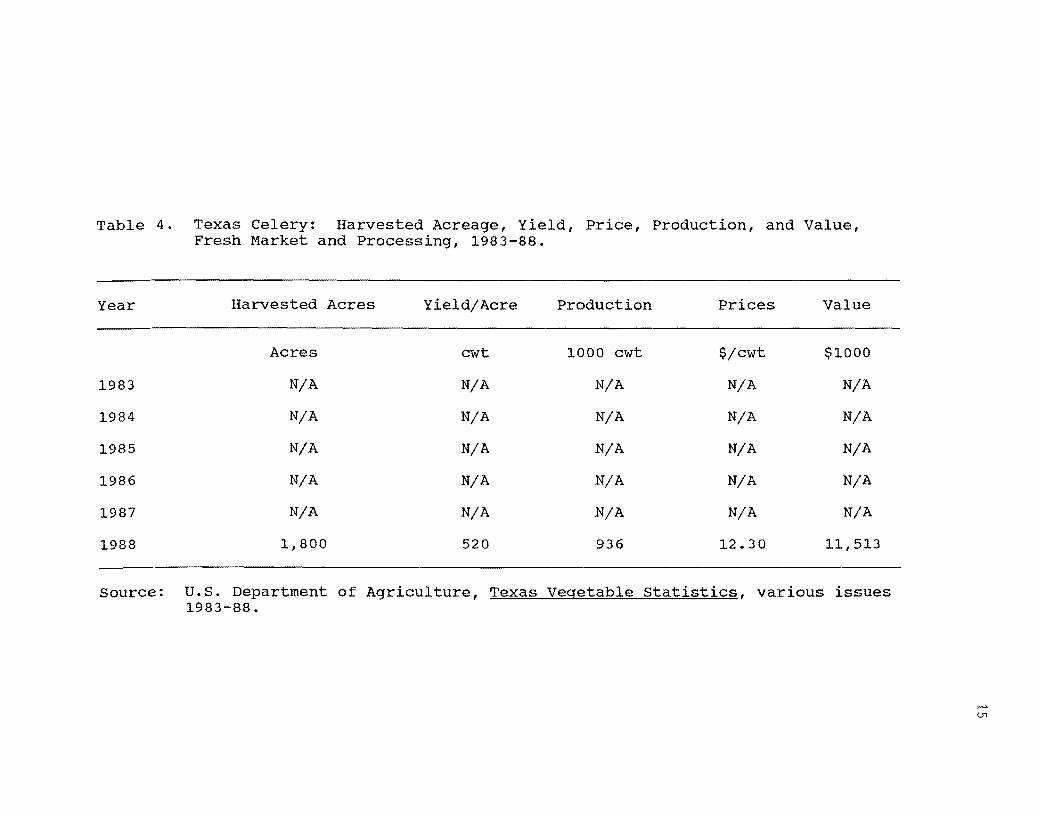
Table 4. Texas Celery: Harvested Acreage, Yield, Price, Production, and Value, Fresh Market and Processing, 1983-88.
Year Harvested Acres YieldjAcre Production Prices Value
Acres cwt 1000 cwt $jcwt $1000
1983 NjA NjA NjA NjA NjA
1984 NjA NjA NjA NjA NjA
1985 NjA NjA NjA NjA NjA
1986 NjA NjA NjA NjA NjA
1987 NjA NjA NjA NjA NjA
1988 1,800 520 936 12.30 11,513
Source: U.S. Department of Agriculture, Texas Vegetable Statistics, various issues 1983-88.
!-' 01

Table 5. Texas Cucumbers: Harvested Acreage, Yield, Price, Production, and Value, Fresh Market and Processing, 1983-87.
Year Harvested Acres Yield/Acre Production Prices Value
Acres cwt 1000 cwt $/cwt $1000
1983 8,800 105 924 18.00 16,632
1984 6,800 130 884 14.50 12,786
1985 6,000 120 720 13.50 9,720
1986 6,500 140 910 11.30 10,283
1987 5,800 120 696 17.00 11,832
source: U.S. Department of Agriculture, Texas Vegetable Statistics, various issues 1983-87.
f-> 0")
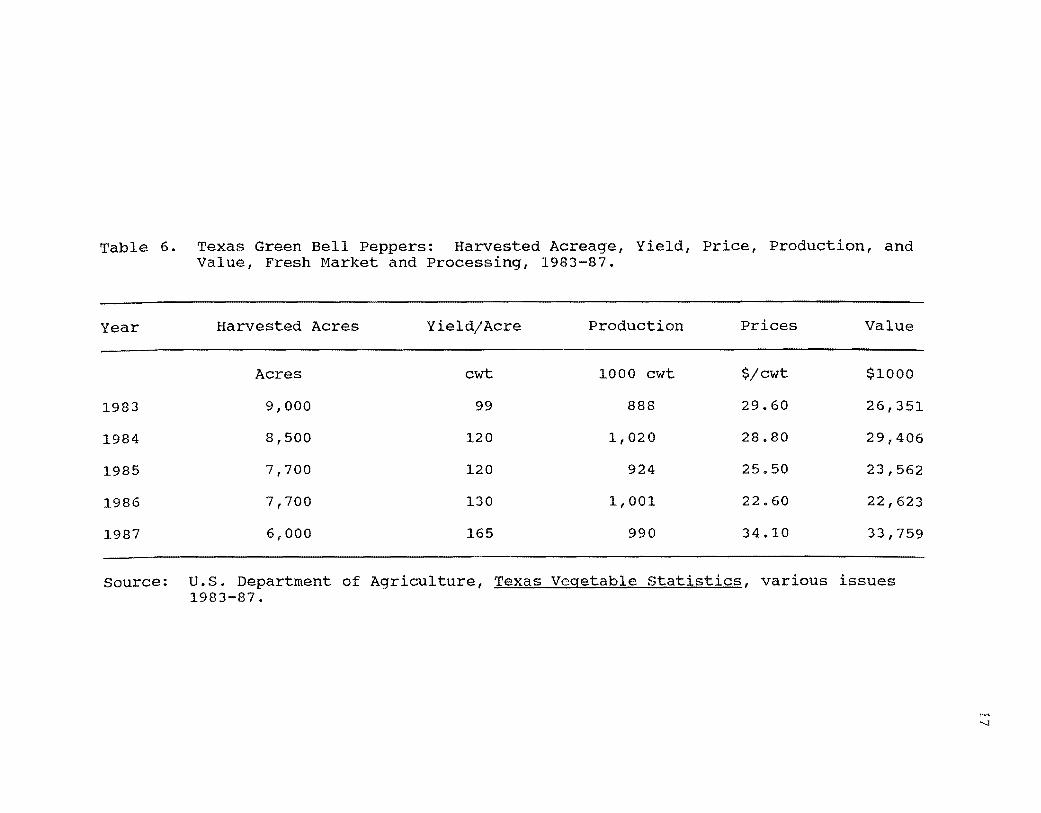
Table 6. Texas Green Bell Peppers: Harvested Acreage, Yield, Price, Production, and Value, Fresh Market and Processing, 1983-87.
Year Harvested Acres Yield/Acre Production Prices Value
Acres cwt 1000 cwt $/cwt $1000
1983 9,000 99 888 29.60 26,351
1984 8,500 120 1,020 28.80 29,406
1985 7,700 120 924 25.50 23,562
1986 7,700 130 1,001 22.60 22,623
1987 6,000 165 990 34.10 33,759
Source: U.S. Department of Agriculture, Texas Vegetable statistics, various issues 1983-87.
f-" --.J

Table 7. Texas Dry Onions: Harvested Acreage, Yield, Price, Production, and Value, Fresh Market and Processing, 1983-88.
Year Harvested Acres Yield/Acre Production Price Value spring Summer Spring Summer Spring Summer Spring Summer Spring Summer
----Acres---- ----cwt--- --1000 cwt-- ----$/cwt---- ----$1,000---
1983 19,000 6,200 200 265 3,800 1,643 11. 20 11.90 42,560 19,552
1984 18,600 6,000 180 260 3,348 1,560 19.60 14.00 65,621 21,840
1985 17,000 4,100 190 230 3,230 943 12.30 15.50 39,729 14,617
1986 12,000 5,300 300 290 3,600 1,537 9.74 11. 70 35,064 17,983
1987 12,500 4,700 220 170 2,750 799 25.30 10.40 69,575 8,310
1988 14,000 4,100 230 210 3,220 861 12.00 11. 40 38,640 9,815
Source: U. S. Department of Agriculture, Texas Vegetable Statistics, various issues 1983-88.
i-' co
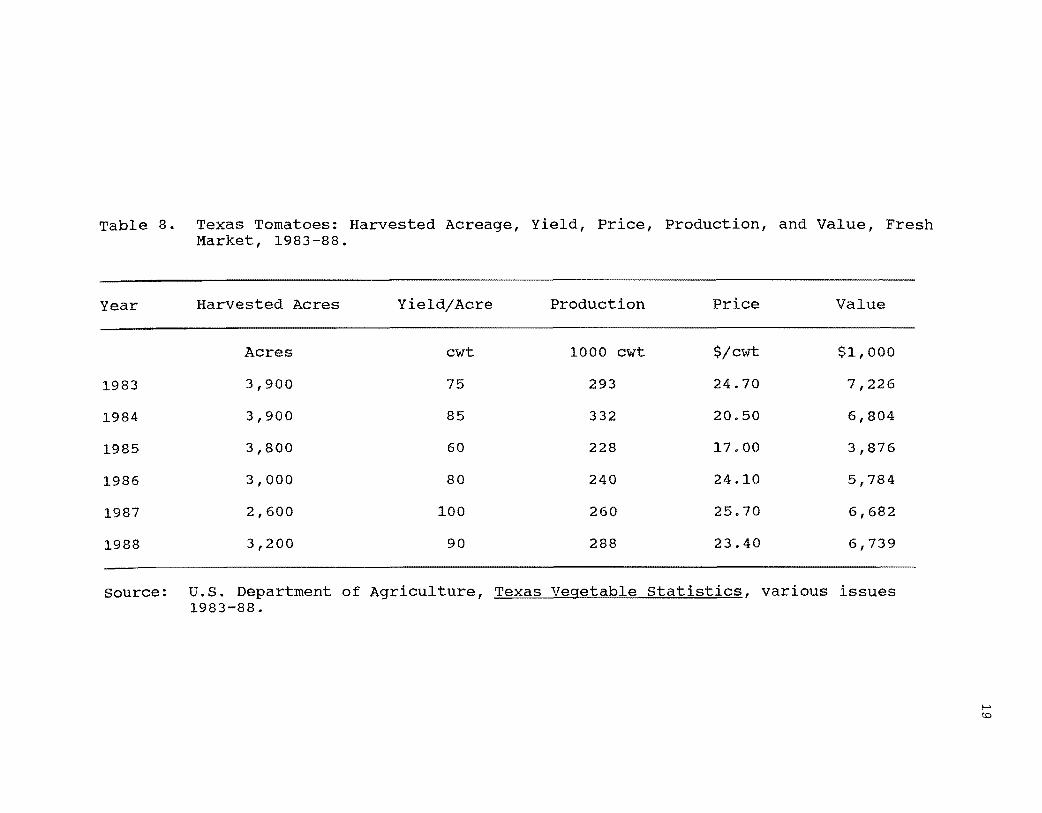
Table 8. Texas Tomatoes: Harvested Acreage, Yield, Price, Production, and Value, Fresh Market, 1983-88.
Year Harvested Acres Yield/Acre Production Price Value
Acres cwt 1000 cwt $/cwt $1,000
1983 3,900 75 293 24.70 7,226
1984 3,900 85 332 20.50 6,804
1985 3,800 60 228 17.00 3,876
1986 3,000 80 240 24.10 5,784
1987 2,600 100 260 25.70 6,682
1988 3,200 90 288 23.40 6,739
source: U.S. Department of Agriculture, Texas Vegetable statistics, various issues 1983-88.
I-> ::0

Table 9. Texas Cantaloupe: Harvested Acreage, Yield, Price, Production, and Value, Fresh Market and Processing, 1983-87.
Year Harvested Acres Yield/Acre Production Price Value spring Summer Spring Summer spring Summer spring Summer Spring Summer
----Acres---- ----cwt---- --1000 cwt-- ---$/cwt--- ---$1,000--
1983 14,300 4,700 130 110 1,859 517 17.40 13.60 32,347 7,031
1984 13,700 4,300 180 160 2,466 688 13.50 9.70 33,291 6,674
1985a 21,000 160 3,360 13.30 44,688
1986a 22,000 160 3,520 14.30 50,366
1987a 17,000 105 1,785 13.00 23,205
aSpring and Summer estimates were discontinued in 1985.
Source: U.S. Department of Agriculture, Texas Vegetable Statistics, various issues 1983-88.
N o

Table 10. Texas Honeydew: Harvested Acreage, Yield, Price, Production, and Value, Fresh Market and Processing, 1983-88.
Year Harvested Acres Yield/Acre Production Price Value
Acres cwt 1000 cwt $/cwt $1000
1983 5,500 140 770 20.40 15,708
1984 5,000 190 950 15.30 14,535
1985 5,000 190 950 19.90 18,905
1986 7,000 170 1,190 18.30 21,777
1987 4,600 140 644 30.60 19,706
1988 7,500 160 1,200 17.20 20,640
Source: U.S. Department of Agriculture, Texas Vegetable Statistics, various issues 1983-88.
N,....

Table 11. Texas Grapefruit: Bearing Acreage, Yield, Production, Price, and Value, Fresh Market and Processing, 1983-88.
Year Bearing Acres Yield/Acrea Productionb Price Value
Acres boxes/acre 1000 carton $/carton $1000
1983-84 43,256 74 3,200 2.93 9,385
1984-85 19,100 o o o o
1985-86 13,500 16 220 9.44 2,076
1986-87 13,500 143 1,925 8.19 15,759
1987-88 14,000 271 3,800 7.03 26,701
aDue to a severe freeze in December 1983, no commercial supplies were harvested for the 1984-85 Texas citrus crop season.
b 80 lbs/carton
Source: U.s. Department of Agriculture, National Agricultural statistical service, citrus , Agricultural Statistics Board, various issues, 1984-88.
N N

Table 12. Texas Oranges: Bearing Acreage, Yield, Production, Price, and Value, Fresh Market and Processing, 1983-88.
Year Bearing Acres Yield/Acrea Productiona Price Value
Acres boxes/acre 1000 carton $/carton $1000
1983-84 24,280 103 2,510 4.58 11,492
1984-85a 11,380 0 0 0 0
1985-86 8,300 37 310 10.22 3,138
1986-87 3,500 105 875 8.68 7,593
1987-88 9,100 157 1,430 8.76 12,525
a85 Lbs/carton
bDue to a severe freeze in December 1983, no commercial supplies were harvested for the 1984-85 Texas citrus crop season.
source: U.s. Department of Agriculture, National Agricultural statistical Service, Citrus Fruits, Agricultural Statistics Board, various issues, 1984-88.
N CAl
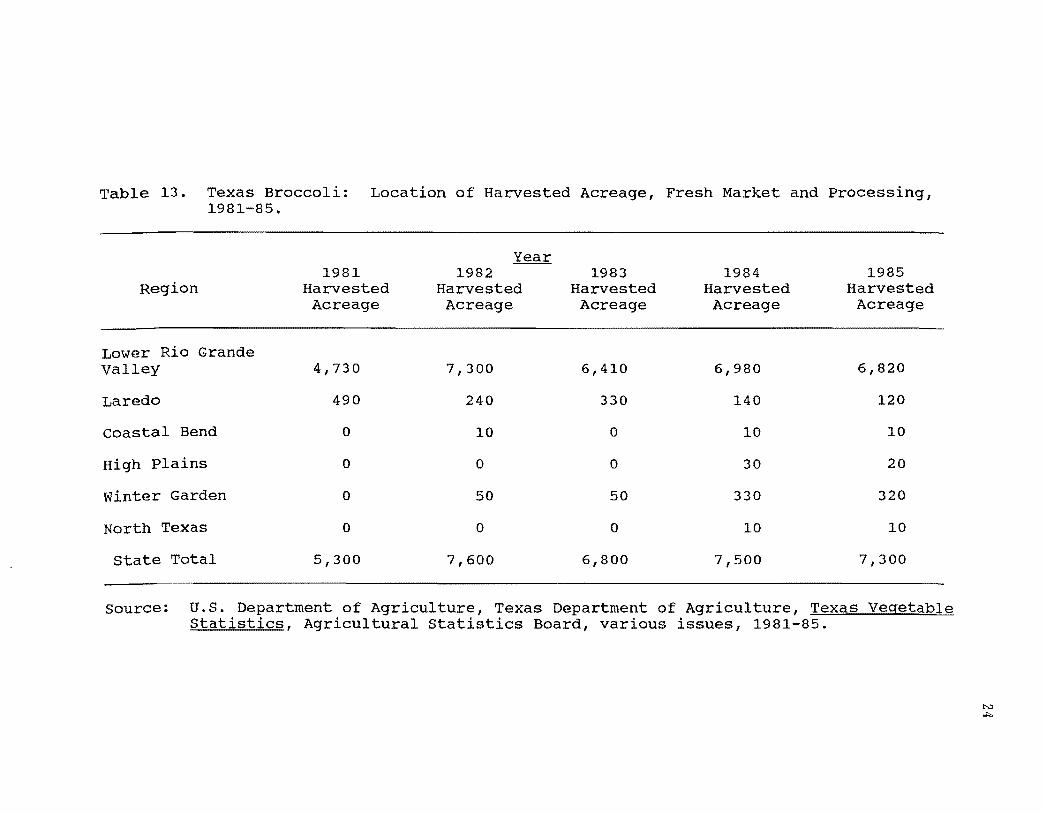
Table 13. Texas Broccoli: Location of Harvested Acreage, Fresh Market and Processing, 1981-85.
Year 1981 1982 1983 1984 1985
Region Harvested Harvested Harvested Harvested Harvested Acreage Acreage Acreage Acreage Acreage
Lower Rio Grande Valley
Laredo
Coastal Bend
High Plains
winter Garden
North Texas
state Total
4,730
490
0
0
0
0
5,300
7,300
240
10
0
50
0
7,600
6,410
330
0
0
50
0
6,800
6,980
140
10
30
330
10
7,500
6,820
120
10
20
320
10
7,300
Source: U.S. Department of Agriculture, Texas Department of Agriculture, Texas Vegetable Statistics, Agricultural statistics Board, various issues, 1981-85.
N..,.
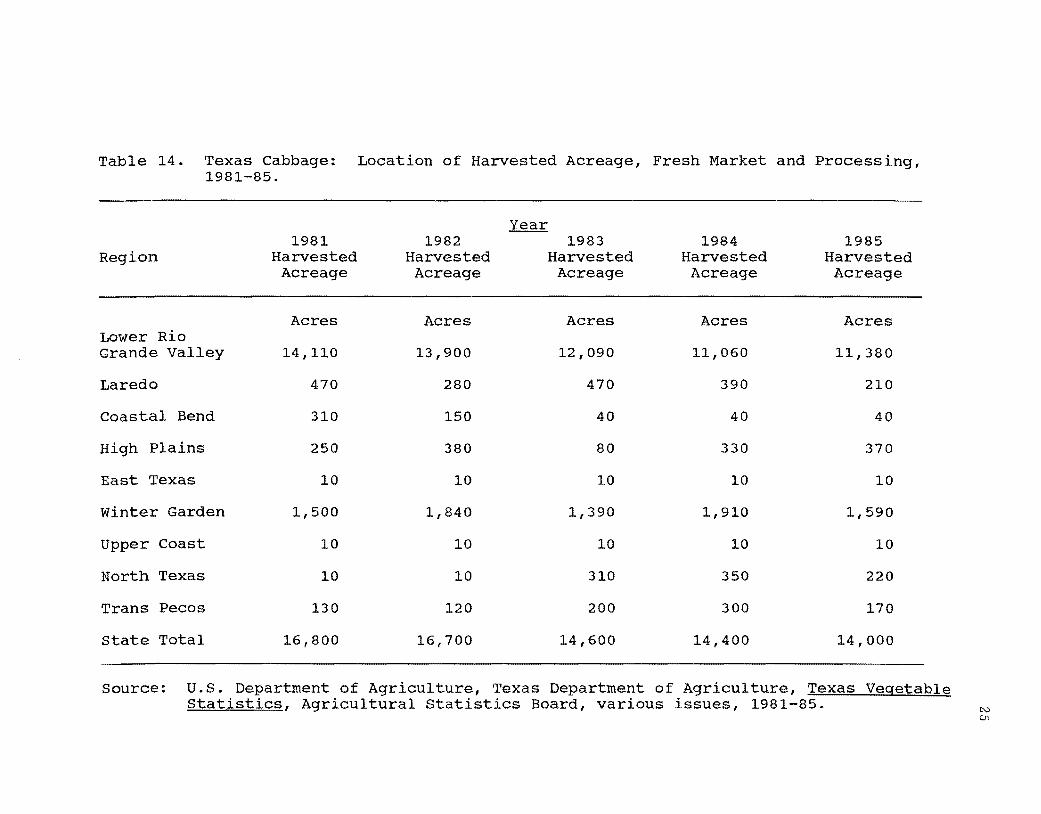
Table 14. Texas Cabbage: Location of Harvested Acreage, Fresh Market and Processing, 1981-85.
Year 1981 1982 1983 1984 1985
Region Harvested Harvested Harvested Harvested Harvested Acreage Acreage Acreage Acreage Acreage
Acres Acres Acres Acres Acres Lower Rio Grande Valley 14,110 13,900 12,090 11,060 11,380
Laredo 470 280 470 390 210
Coastal Bend 310 150 40 40 40
High Plains 250 380 80 330 370
East Texas 10 10 10 10 10
winter Garden 1,500 1,840 1,390 1,910 1,590
Upper Coast 10 10 10 10 10
North Texas 10 10 310 350 220
Trans Pecos 130 120 200 300 170
state Total 16,800 16,700 14,600 14,400 14,000
Source: U.S. Department of Agriculture, Texas Department of Agriculture, Texas Vegetable Statistics, Agricultural Statistics Board, various issues, 1981-85. N
CJ1
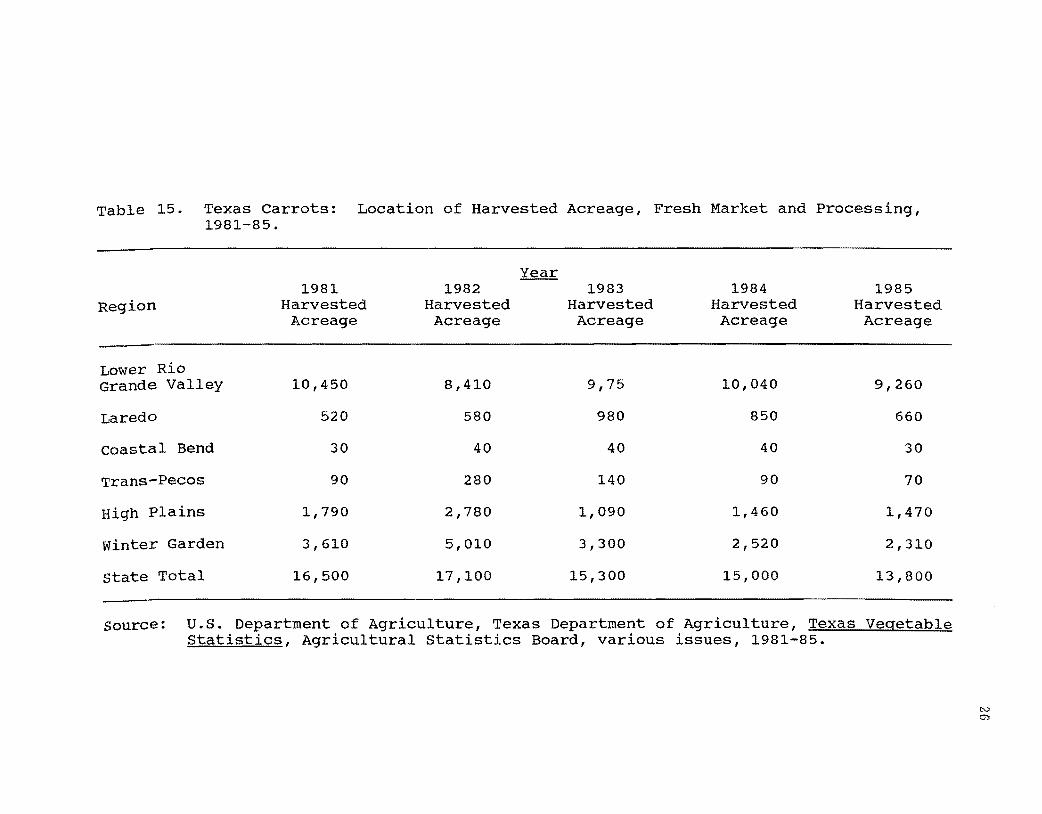
Table 15. Texas Carrots: Location of Harvested Acreage, Fresh Market and processing, 1981-85.
Year 1981 1982 1983 1984 1985
Region Harvested Harvested Harvested Harvested Harvested Acreage Acreage Acreage Acreage Acreage
Lower Rio Grande Valley
Laredo
coastal Bend
Trans-Pecos
High Plains
winter Garden
state Total
10,450
520
30
90
1,790
3,610
16,500
8,410
580
40
280
2,780
5,010
17,100
9,75
980
40
140
1,090
3,300
15,300
10,040
850
40
90
1,460
2,520
15,000
9,260
660
30
70
1,470
2,310
13,800
source: U.S. Department of Agriculture, Texas Department of Agriculture, Texas Vegetable statistics, Agricultural statistics Board, various issues, 1981-85.
N 0':)
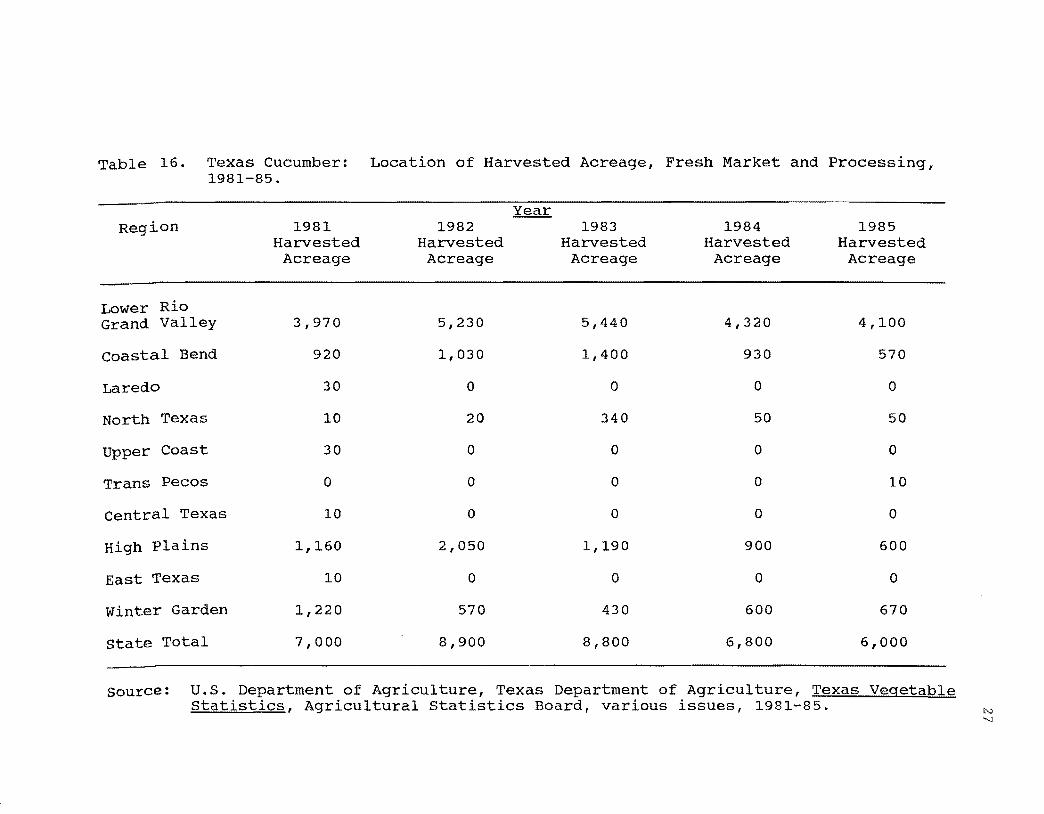
Table 16. Texas Cucumber: Location of Harvested Acreage, Fresh Market and Processing, 1981-85.
Year Region 1981 1982 1983 1984 1985
Harvested Harvested Harvested Harvested Harvested Acreage Acreage Acreage Acreage Acreage
Lower Rio Grand Valley
coastal Bend
Laredo
North Texas
Upper Coast
Trans Pecos
Central Texas
High Plains
East Texas
winter Garden
state Total
3,970
920
30
10
30
o
10
1,160
10
1,220
7,000
5,230
1,030
o
20
o
o
o
2,050
o
570
8,900
5,440
1,400
o
340
o
o
o
1,190
o
430
8,800
4,320
930
o
50
o
o
o
900
o
600
6,800
4,100
570
o
50
o
10
o
600
o
670
6,000
source: U.S. Department of Agriculture, Texas Department of Agriculture, Texas Vegetable Statistics, Agricultural statistics Board, various issues, 1981-85. N
"-l
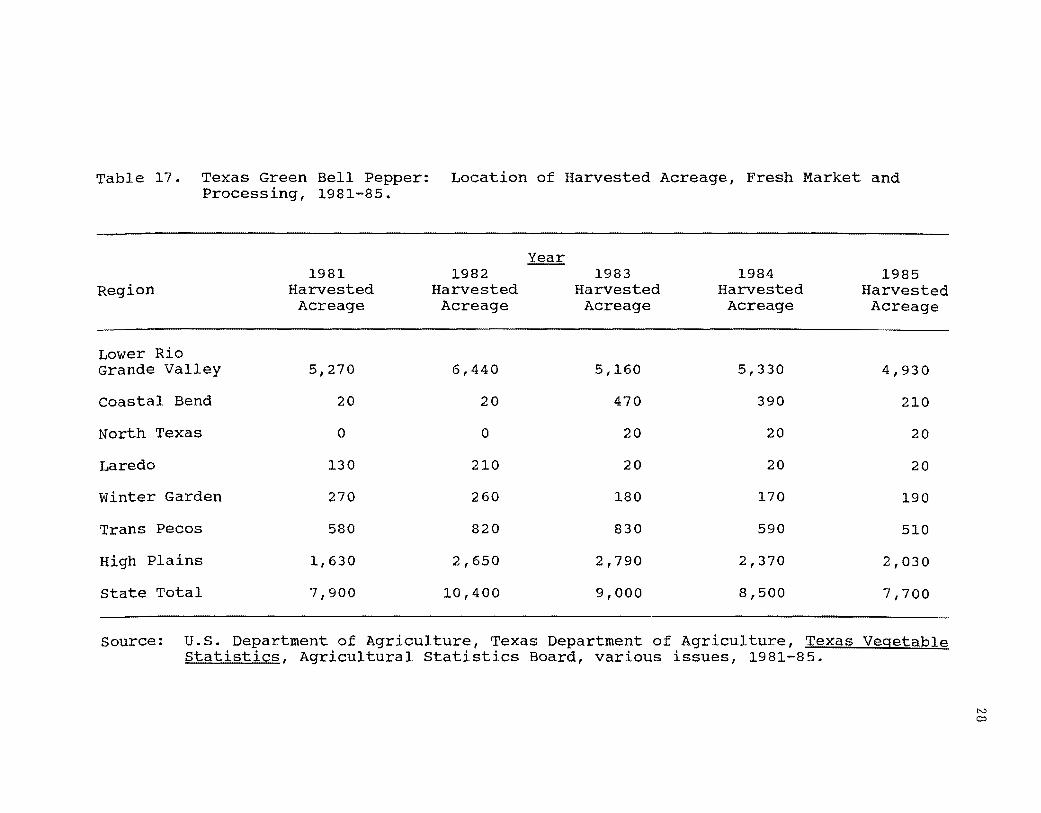
Table 17. Texas Green Bell Pepper: Location of Harvested Acreage, Fresh Market and Processing, 1981-85.
Year 1981 1982 1983 1984 1985
Region Harvested Harvested Harvested Harvested Harvested Acreage Acreage Acreage Acreage Acreage
Lower Rio Grande Valley
coastal Bend
North Texas
Laredo
winter Garden
Trans Pecos
High Plains
state Total
5,270
20
o
130
270
580
1,630
7,900
6,440
20
o
210
260
820
2,650
10,400
5,160
470
20
20
180
830
2,790
9,000
5,330
390
20
20
170
590
2,370
8,500
4,930
210
20
20
190
510
2,030
7,700
Source: U.S. Department of Agriculture, Texas Department of Agriculture, Texas Vegetable Statistics, Agricultural statistics Board, various issues, 1981-85.
N CP

Table 18. Texas Dry Onions: Location of Harvested Acreage, Fresh Market and Processing, 1981-86.
Year
Region 1981 1982 1983 1984 1985 1986 Harvested Harvested Harvested Harvested Harvested Harvested
Acreage Acreage Acreage Acreage Acreage Acreage
Lower Rio Grande Valley 15,670 16,400 16,200 15,700 14,000 10,000
Laredo 500 700 500 900 700 500
High Plains 3,600 4,000 4,200 3,800 2,600 3,600
Winter Garden 2,450 2,500 2,300 2,000 2,300 1,500
North Texas 0 0 0 500 300 200
Trans Pecos 2,000 2,000 2,000 1,700 1,200 1,500
state Total 24,150 25,600 25,200 24,600 21,100 17,300
Source: U.S. Department of Agriculture, Texas Department of Agriculture, Texas Vegetable Statistics, Agricultural statistics Board, various issues, 1981-86.
tv co
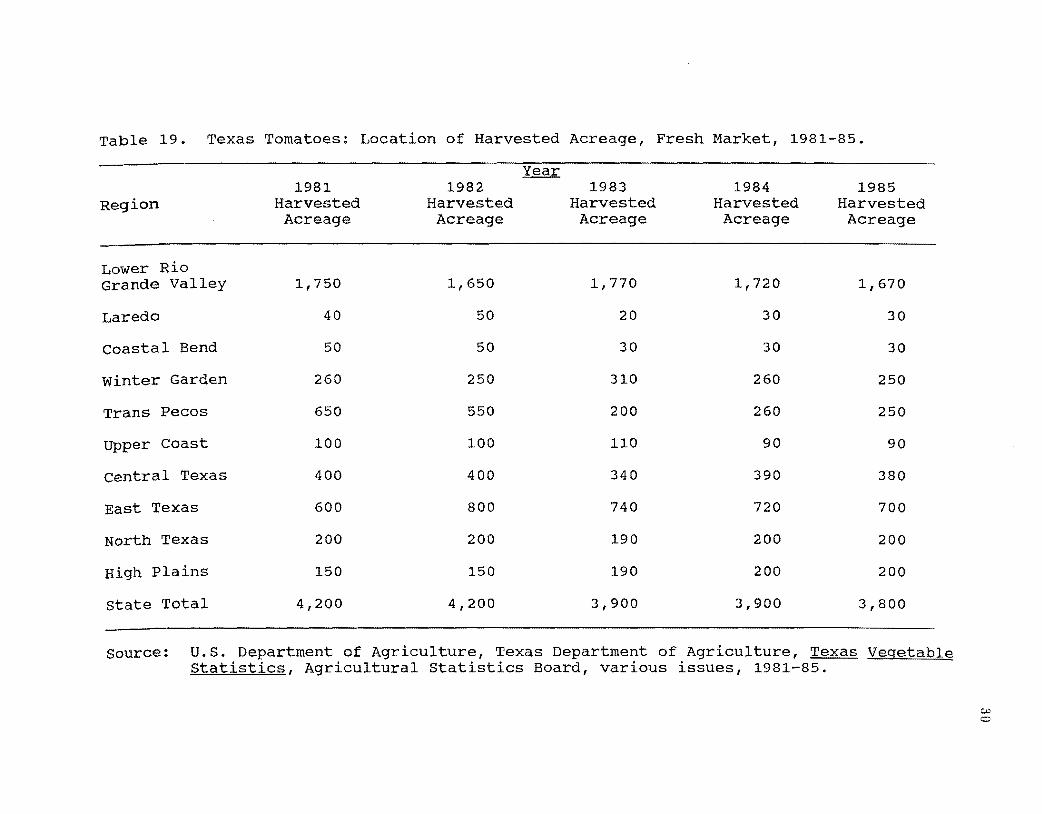
Table 19. Texas Tomatoes: Location of Harvested Acreage, Fresh Market, 1981-85.
Year 1981 1982 1983 1984 1985
Region Harvested Harvested Harvested Harvested Harvested Acreage Acreage Acreage Acreage Acreage
Lower Rio Grande valley
Laredo
Coastal Bend
Winter Garden
Trans Pecos
Upper Coast
central Texas
East Texas
North Texas
High Plains
state Total
1,750
40
50
260
650
100
400
600
200
150
4,200
1,650
50
50
250
550
100
400
800
200
150
4,200
1,770
20
30
310
200
110
340
740
190
190
3,900
1,720
30
30
260
260
90
390
720
200
200
3,900
1,670
30
30
250
250
90
380
700
200
200
3,800
Source: U.S. Department of Agriculture, Texas Department of Agriculture, Texas Vegetable Statistics, Agricultural Statistics Board, various issues, 1981-85.
CJ.:)
o
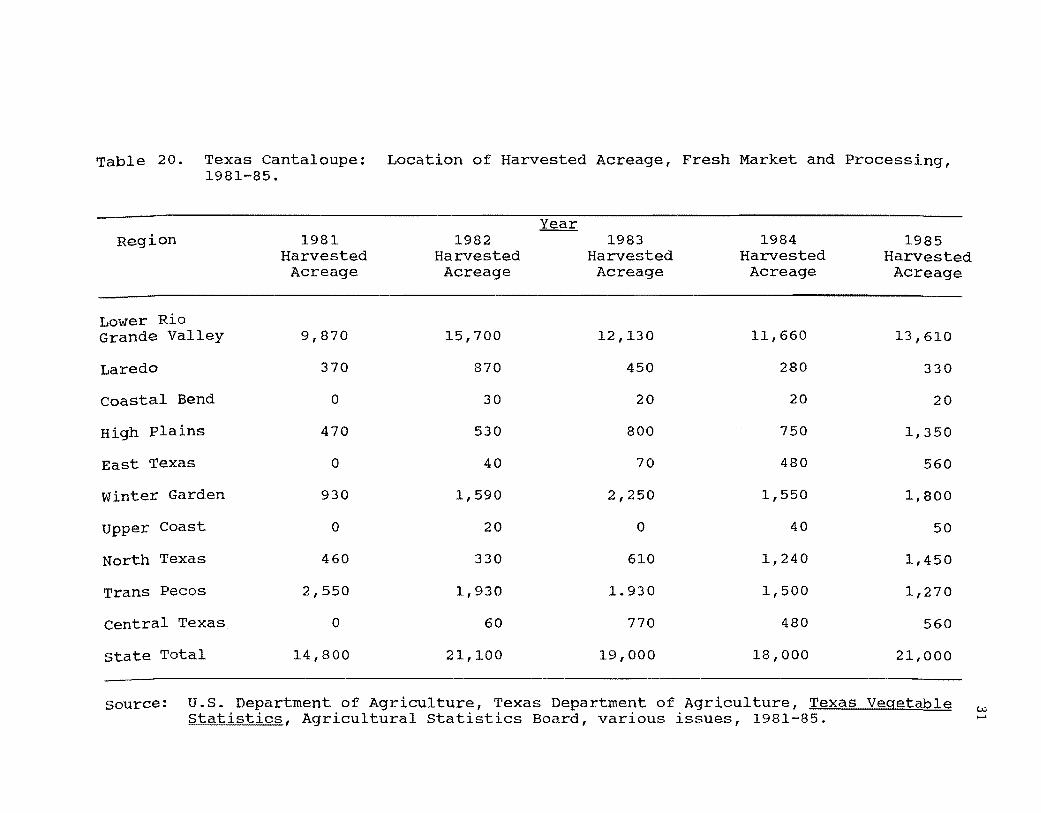
Table 20. Texas Cantaloupe: Location of Harvested Acreage, Fresh Market and Processing, 1981-85.
Year Region 1981 1982 1983 1984 1985
Harvested Harvested Harvested Harvested Harvested Acreage Acreage Acreage Acreage Acreage
Lower Rio Grande Valley
Laredo
coastal Bend
High Plains
East Texas
Winter Garden
Upper Coast
North Texas
Trans Pecos
Central Texas
state Total
9,870
370
o
470
o
930
o
460
2,550
o
14,800
15,700
870
30
530
40
1,590
20
330
1,930
60
21,100
12,130
450
20
800
70
2,250
o
610
1.930
770
19,000
11,660
280
20
750
480
1,550
40
1,240
1,500
480
18,000
13,610
330
20
1,350
560
1,800
50
1,450
1,270
560
21,000
source: U.S. Department of Agriculture, Texas Department of Agriculture, Texas Vegetable CJ,;)
......Statistics, Agricultural statistics Board, various issues, 1981-85.
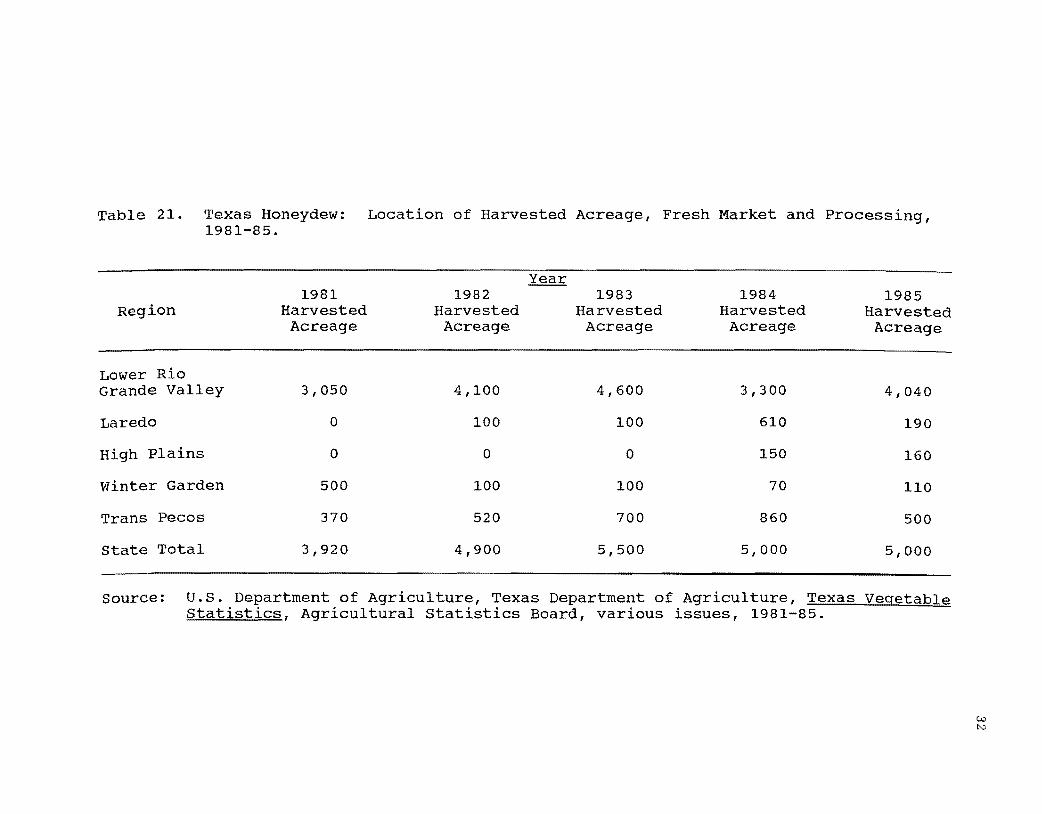
Table 21. Texas Honeydew: Location of Harvested Acreage, Fresh Market and Processing, 1981-85.
Year 1981 1982 1983 1984 1985
Region Harvested Harvested Harvested Harvested Harvested Acreage Acreage Acreage Acreage Acreage
Lower Rio Grande Valley
Laredo
High Plains
Winter Garden
Trans Pecos
state Total
3,050
o
o
500
370
3,920
4,100
100
o
100
520
4,900
4,600
100
o
100
700
5,500
3,300
610
150
70
860
5,000
4,040
190
160
110
500
5,000
Source: U.S. Department of Agriculture, Texas Department of Agriculture, Texas Vegetable Statistics, Agricultural statistics Board, various issues, 1981-85.
c..o t\;l
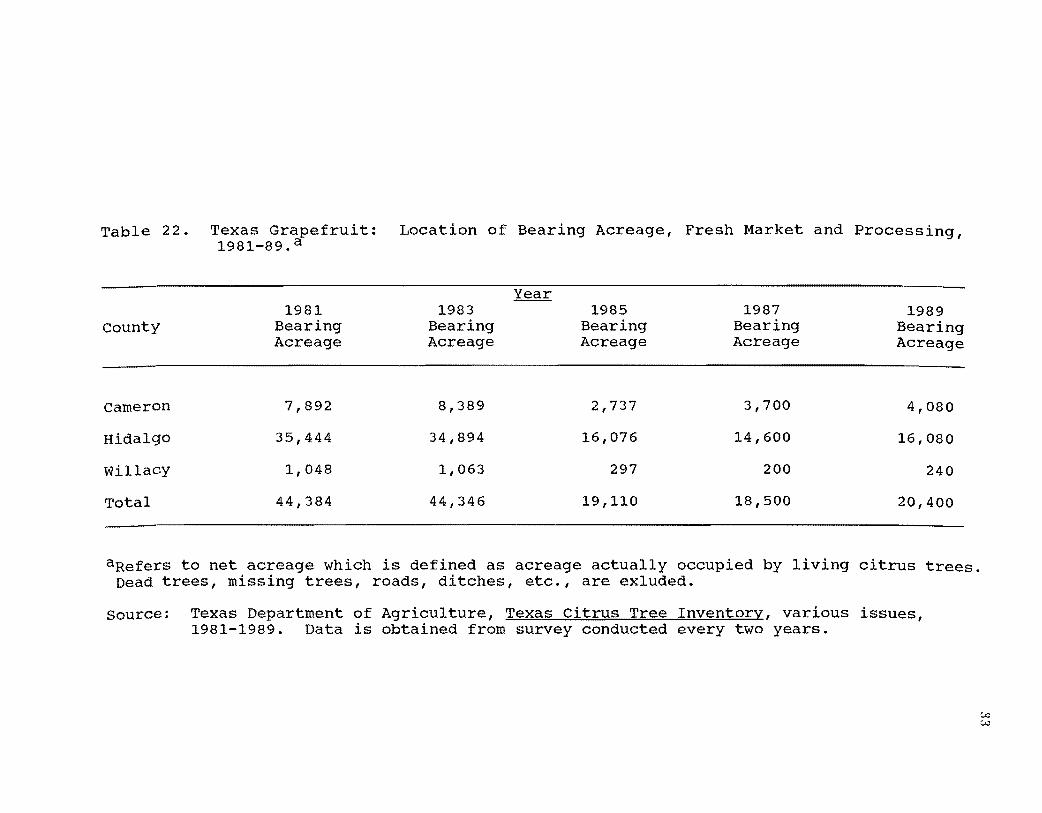
Table 22. Texas Grapefruit: Location of Bearing Acreage, Fresh Market and Processing, 1981-89. a
Year 1981 1983 1985 1987 1989
county Bearing Acreage
Bearing Acreage
Bearing Acreage
Bearing Acreage
Bearing Acreage
Cameron 7,892 8,389 2,737 3,700 4,080
Hidalgo 35,444 34,894 16,076 14,600 16,080
willacy 1,048 1,063 297 200 240
Total 44,384 44,346 19,110 18,500 20,400
aRefers to net acreage which is defined as acreage actually occupied by living citrus trees. Dead trees, missing trees, roads, ditches, etc., are exluded.
source: Texas Department of Agriculture, Texas citrus Tree Inventory, various issues, 1981-1989. Data is obtained from survey conducted every two years.
w w

Table 23. Texas Oranges: Location of Bearing Acreage, Fresh Market and Processing, 1981-89. a
Year 1981 1983 1985 1987 1989
county Bearing Acreage
Bearing Acreage
Bearing Acreage
Bearing Acreage
Bearing Acreage
Cameron 1,512 1,527 467 1,000 1,190
Hidalgo 22,856 21,835 10,491 10,400 12,410
willacy 1,337 1,213 422 400 400
Total 25,705 24,575 11,380 11,800 14,000
aRefers to net acreage which defined as acreage actually occupied by living citrus trees. Dead trees, missing trees, roads, ditches, etc., are exluded.
source: Texas Department of Agriculture, Texas citrus Tree Inventory, various issues, 1981-1989. Data obtained from survey conducted every two years.
w *'"
fable 24. Estimated Broccoli Production and Acreage by State, Fresh Market and Processing, 1983-88.
Year
1983 1984 1985 1986 1987 1988
Harvested Production Harvested Production Harvested Production Harvested Production Harvested Production Harvested Production Acreage 1,000 cwt Acreage 1,000 cwt Acreage 1,000 cwt Acreage 1,000 cwt Acreage 1,000 cwt Acreage 1,000 cwt
54 1,300 99 1,900 177 2,900 238 4,200 238
California 82,000 7,552 95,700 9,440 97,700 9,575 106,400 10,427 107,600 10,330 101,100 11,627
Oregon 2,000 170 2,000 176 2,600 247 3,000 300 3,000 315 2,800 260
Texas 6,800 550 7,500 567 7,300 628 6,800 564 5,400 405 6,200
Arizona 700 4,300 391
515
Total 91,500 8,326 106,500 10,282 109,500 10,627 119,100 11,529 120,200 11,432 114,400 12,793
Source: U.S. Department of Agriculture, National Agricultural Statistics Service, Vegetables, Summary, Agricultural Statistics Board, various issues 1983-88.
w CJ1
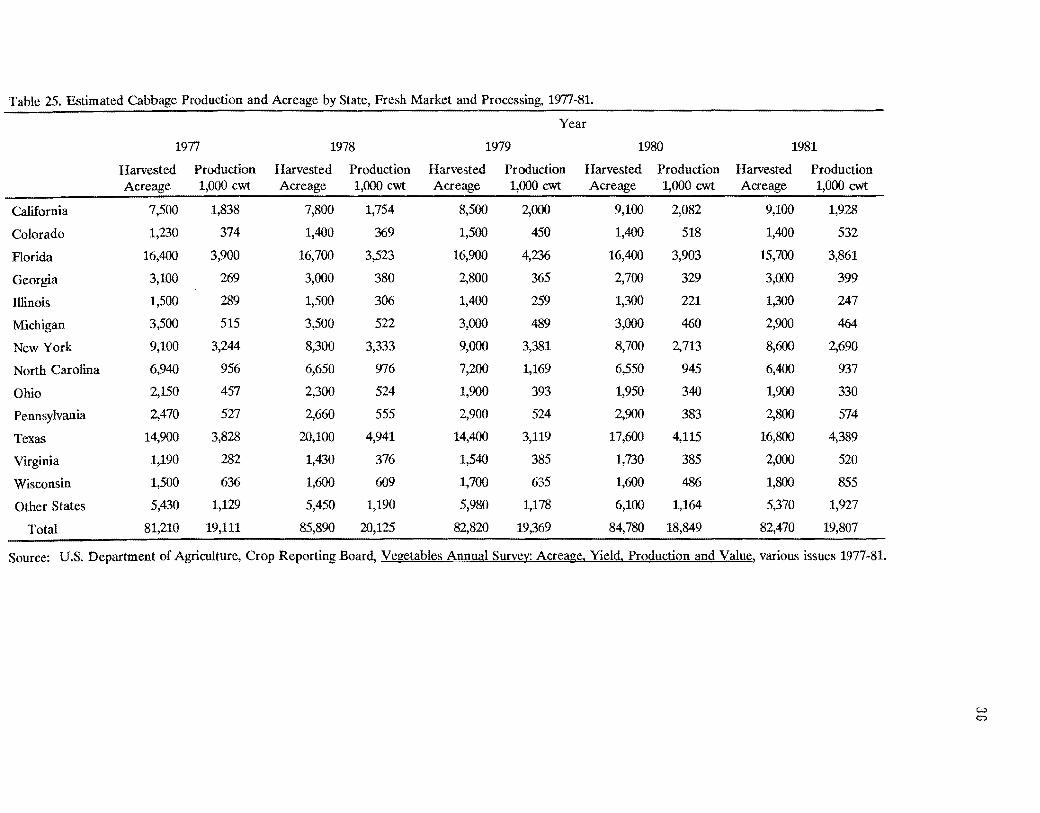
Table 25. Estimated Cabbage Production and Acreage by State, Fresh Market and Processing, 1977-81.
Year
1977 1978 1979 1980 1981
Harvested Production Harvested Production Harvested Production Harvested Production Harvested Production Acreage 1,000 cwt Acreage 1,000 cwt Acreage 1,000 cwt Acreage 1,000 cwt Acreage 1,000 cwt
California 7,500 1,838 7,800 1,754 8,500 2,000 9,100 2,082 9,100 1,928
Colorado 1,230 374 1,400 369 1,500 450 1,400 518 1,400 532
Florida 16,400 3,900 16,700 3,523 16,900 4,236 16,400 3,903 15,700 3,861
Georgia 3,100 269 3,000 380 2,800 365 2,700 329 3,000 399
Illinois 1,500 289 1,500 306 1,400 259 1,300 221 1,300 247
Michigan 3,500 515 3,500 522 3,000 489 3,000 460 2,900 464
New York 9,100 3,244 8,300 3,333 9,000 3,381 8,700 2,713 8,600 2,690
North Carolina 6,940 956 6,650 976 7,200 1,169 6,550 945 6,400 937
Ohio 2,150 457 2,300 524 1,900 393 1,950 340 1,900 330
Pennsylvania 2,470 527 2,660 555 2,900 524 2,900 383 2,800 574
Texas 14,900 3,828 20,100 4,941 14,400 3,119 17,600 4,115 16,800 4,389
Virginia 1,190 282 1,430 376 1,540 385 1,730 385 2,000 520
Wisconsin 1,500 636 1,600 609 1,700 635 1,600 486 1,800 855
Other States 5,430 1,129 5,450 1,190 5,980 1,178 6,100 1,164 5,370 1,927
Total 81,210 19,111 85,890 20,125 82,820 19,369 84,780 18,849 82,470 19,807
Source: U.S. Department of Agriculture, Crop Reporting Board, Vegetables Annual Survey: Acreage. Yield. Production and Value, various issues 1977-81.
W 0:>

Table 26. Estimated Carrot Production and Acreage by State, Fresh Market and Processing, 1983-88.
Year 1983 1984 1985 1986 1987 1988
State Harvested Production Harvested Production Harvested Production Harvested Production Harvested Production Harvested Production Acreage 1,000 cwt Acreage 1,000 cwt Acreage 1,000 cwt Acreage 1,000 cwt Acreage 1,000 cwt Acreage 1,000 cwt
California 39,400 11,490 41,100 12,011 39,900 10,959 40,000 12,568 43,000 12,500 51,100 21,170
Florida 10,000 1,100 10,600 731 11,500 1,058 12,300 849 12,100 1,065 12,200 1,183
Michigan 7,200 1,656 7,500 2,025 6,400 1,664 3,700 925 7,000 1,925 6,700 1,709
Texas 15,300 3,201 15,000 2,175 13,800 2,001 11,600 2,030 11,500 2,185 10,000 1,800
Washington 4,000 1,600 4,300 1,828 5,200 2,262 5,800 2,407 6,600 3,036 5,600 2,912
Wisconsin 3,200 1,488 5,200 1,898 3,300 1,551 3,500 1,523 3,500 1,750 3,200 1,296
Other 10,500 3,053 9,940 3,066 10,000 3,421 9,200 3,132 9,420 2,998 8,850 2,431
Total 87,400 23,138 93,640 23,734 90,100 22,916 86,100 23,434 93,120 25,539 97,650 32,501
Source: U.S. Department of Agriculture, National Agricultural Statistics Service, Vegetables. Summary, Agricultural Statistics Board, various issues 1983-88.
w -...,J
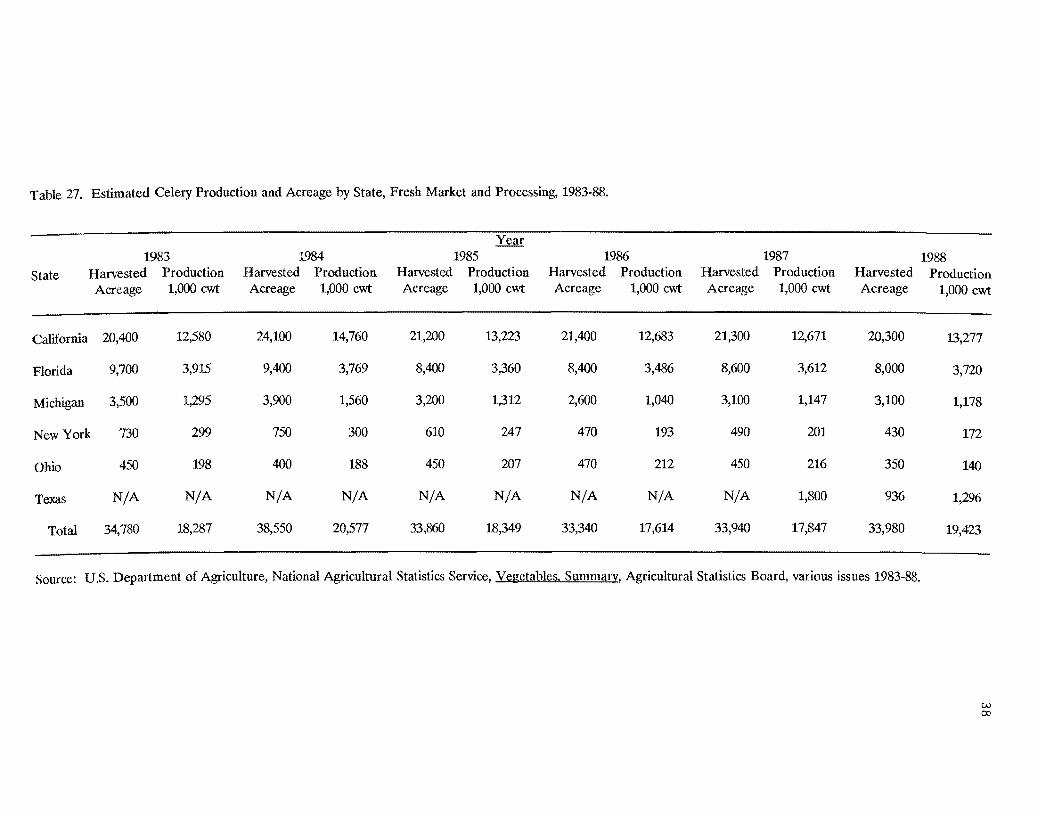
Table 27. Estimated Celery Production and Acreage by State, Fresh Market and Processing, 1983-88.
1983 1984 1985 1986 1987 1988 Harvested Production Harvested Production Harvested Production Harvested Production Harvested Production Harvested ProductionState Acreage 1,000 cwt Acreage 1,000 cwt Acreage 1,000 cwt Acreage 1,000 cwt Acreage 1,000 cwt Acreage 1,000 cwt
California 20,400 12,580 24,100 14,760 21,200 13,223 21,400 12,683 21,300 12,671 20,300 13,277
Florida 9,700 3,915 9,400 3,769 8,400 3,360 8,400 3,486 8,600 3,612 8,000 3,720
Michigan 3,500 1,295 3,900 1,560 3,200 1,312 2,600 1,040 3,100 1,147 3,100 1,178
New York 730 299 750 300 610 247 470 193 490 201 430 172
198 400 188 450 207 470 212 450 216 350Ohio 450 140
Texas N/A N/A N/A N/A N/A N/A N/A N/A N/A 1,800 936 1,296
Total 34,780 18,287 38,550 20,577 33,860 18,349 33,340 17,614 33,940 17,847 33,980 19,423
Source: U.S. Department of Agriculture, National Agricultural Statistics Service, Vegetables. Summary, Agricultural Statistics Board, various issues 1983-88.
w 00

Table 28. Estimated Cucumber Production and Acreage by State, Processing, 1984-88.1
Year 1984 1985 1986 1987 1988
Harvested Production Harvested Production Harvested Production Harvested Production Harvested Production
State Acreage 1,000 cwt Acreage 1,000 cwt Acreage 1,000 cwt Acreage 1,000 cwt Acreage 1,000 cwt
California 3,300 1,128 4,100 1,469 4,000 1,293 4,100 1,230 3,800 1,380
Florida 4,700 423 4,800 480 4,400 484 3,900 468 6,000 720
Michigan 21,300 2,343 24,000 2,688 24,000 2,784 24,000 3,216 23,000 2,530
North Carolina 26,100 1,722 29,100 1,984 25,300 1,619 24,700 1,689 25,900 2,009
4,800 1,126 4,800 1,209 4,500 1,144 4,500 936 3,900 725Ohio
South Carolina 9,300 706 13,600 971 13,300 955 13,200 778 11,200 795
Texas 6,800 816 6,100 750 8,200 852 9,800 940 14,100 1,071
Wisconsin 7,800 1,227 6,700 1,239 7,200 1,080 5,700 915 6,800 938
Other States 19,480 2,871 21,200 2,923 19,610 2,617 19,730 2,534 24,170 2,861
Total 103,580 12,364 114,400 13,716 110,510 10,213 109,630 12,709 118,870 13,031
IData were unavailable for 1983.
Source: U.S. Department of Agriculture, National Agricultural Statistics Service, Vegetables, Summary, Agricultural Statistics Board, various issues 1984-88. CJ.:l co
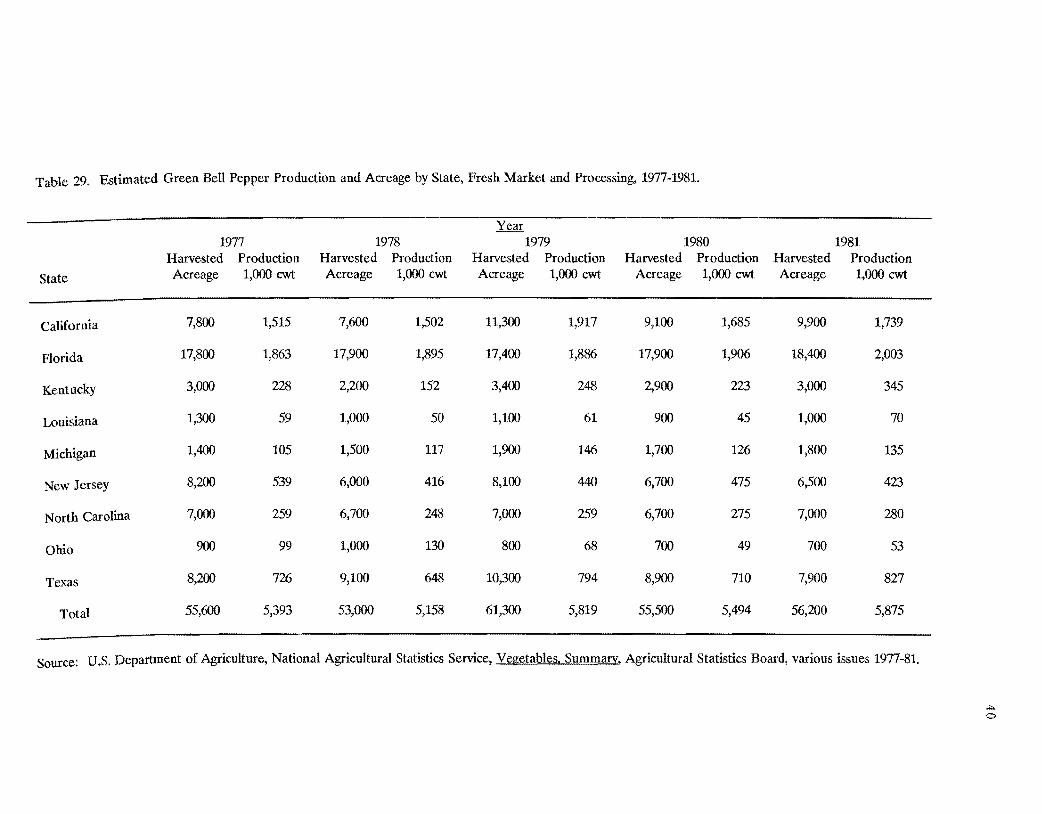
Table 29. Estimated Green Bell Pepper Production and Acreage by State, Fresh Market and Processing, 1977-1981.
Year 1977 1978 1979 1980 1981
Harvested Production Harvested Production Harvested Production Harvested Production Harvested Production
State Acreage 1,000 cwt Acreage 1,000 cwt Acreage 1,000 cwt Acreage 1,000 cwt Acreage 1,000 cwt
California 7,800 1,515 7,600 1,502 11,300 1,917 9,100 1,685 9,900 1,739
Florida 17,800 1,863 17,900 1,895 17,400 1,886 17,900 1,906 18,400 2,003
Kentucky 3,000 228 2,200 152 3,400 248 2,900 223 3,000 345
Louisiana 1,300 59 1,000 50 1,100 61 900 45 1,000 70
Michigan 1,400 105 1,500 117 1,900 146 1,700 126 1,800 135
New Jersey 8,200 539 6,000 416 8,100 440 6,700 475 6,500 423
North Carolina 7,000 259 6,700 248 7,000 259 6,700 275 7,000 280
Ohio 900 99 1,000 130 800 68 700 49 700 53
Texas 8,200 726 9,100 648 10,300 794 8,900 710 7,900 827
Total 55,600 5,393 53,000 5,158 61,300 5,819 55,500 5,494 56,200 5,875
Source: U.S. Department of Agriculture, National Agricultural Statistics Service, Vegetables, Summary. Agricultural Statistics Board, various issues 1977-81.
"'" 0

Table 30. Estimated Onion Production and Acreage by State, Fresh Market and Processing, 1983-88.1
(Spring and Summer non-storage only)
Year 1983 1984 1985 1986 1987 1988
State Harvested Production Harvested Production Harvested Production Harvested Production Harvested Production Harvested Production Acreage 1,000 cwt Acreage 1,000 cwt Acreage 1,000 cwt Acreage 1,000 cwt Acreage 1,000 cwt Acreage 1,000 cwt
Arizona 1,600 656 2,300 805 1,200 564 1,200 660 1,300 585 1,200 450
California 7,600 2,166 7,700 2,734 7,800 3,510 7,800 2,886 8,200 3,198 8,500 3,315
New Mexico 3,900 1,248 3,900 1,365 4,500 1,463 4,700 1,810 5,400 2,106 6,400 2,752
Texas 25,200 5,543 24,600 4,908 21,100 4,173 17,300 5,137 17,200 3,549 18,100 4,081
Washington 1,200 492 1,200 432 1,300 390 1,300 429 1,400 532 1,600 640
Total 39,500 10,065 39,700 10,244 35,900 10,100 32,300 10,922 33,500 9,970 35,800 11,238
1The production of storage onions in 1983, 1984, 1985, 1986, 1987 and 1988 was 19,186; 23,594; 25,709; 22,426; 25,167; and 24,866 thousand cwts, respectively. This production is concentrated in the Pacific Northwest, Colorado, Michigan and New York. In addition, 35,000 to 40,000 thousand cwts of onion are annually produced in California for
processing.
Source: U.S. Department of Agriculture, National Agricultural Statistics Service, Vegetables, Summary, Agricultural Statistics Board, various issues 1983-88.
..t:o ,.....

Table 31. Estimated Tomato Production and Acreage by State, Fresh Market and Processing, 1983-88.
1983 1984 1985 1986 1987 1988
State Harvested Production Harvested Production Harvested Production Harvested Production Harvested Production Harvested Production Acreage 1,000 cwt Acreage 1,000 cwt Acreage 1,000 cwt Acreage 1,000 cwt Acreage 1,000 cwt Acreage 1,000 cwt
Fresh Markets:
California 29,300 8,114 27,900 7,452 28,600 7,783 28,600 7,938 28,600 8,217 27,500 8,906
Florida 47,200 13,664 47,100 13,886 47,100 14,130 52,300 15,952 55,300 16,950 58,000 18,850
New Jersey 5,700 542 6,000 570 6,300 725 6,200 682 6,100 580 5,800 406
S. Carolina 4,800 936 4,700 1,128 4,200 1,155 4,000 1,200 3,600 882 3,700 1,480
Texas 3,900 293 3,900 332 3,800 228 3,000 240 2,600 260 3,200 288
Other 32,400 3,688 33,280 4,821 34,580 5,752 33,010 5,542 33,400 4,858 32,550 5,685
Total 123,300 27,237 122,880 28,189 124,580 29,773 127,110 31,554 129,600 31,747 140,750 35,615
Processing Markets:
California 233,500 119,459 239,700 131,835 217,000 122,040 210,400 129,606 214,000 134,050 226,100 130,957
Michigan 9,200 3,662 7,400 3,478 6,600 3,326 5,400 2,668 5,000 2,370 5,200 2,246
Ohio 19,000 8,132 15,900 8,099 14,800 7,696 16,000 7,360 17,700 7,186
Other 37,150 9,344 35,600 10,519 30,360 10,078 21,460 7,896 21,600 8,152 25,920 7,809
Total 298,850 140,597 298,600 153,623 269,860 143,543 252,060 147,866 256,600 151,932 274,920 148,198
Source: U.S. Department of Agriculture, National Agricultural Statistics Service, Vegetables. Summary, Agricultural Statistics Board, various issues 1983-88. ;.I:::.
N

Table 32. Estimated Cantaloupe Production and Acreage by State, Fresh Market, 1977-81.
Year 1977 1978 1979 1980 1981
Harvested Production Harvested Production Harvested Production Harvested Production Harvested Production
State Acreage 1,000 cwt Acreage 1,000 cwt Acreage 1,000 cwt Acreage 1,000 cwt Acreage 1,000 cwt
Arizona 10,450 1,585 9,900 1,521 9,100 1,245 6,500 907 5,200 858
California 40,400 6,236 53,100 8,349 52,900 8,075 53,400 8,436 53,000 9,375
Colorado 850 115 920 147 920 138 850 106 800 144
Georgia 3,700 233 4,000 220 4,200 227 3,800 152 3,500 193
Indiana 1,800 270 1,800 252 2,600 338 2,600 338 2,800 392
Maryland 0 ° ° 0 0 0 0 0 1,400 112
Michigan 2,000 160 2,100 168 1,600 184 1,500 180 1,600 184
South Carolina 3,100 140 2,800 120 2,800 106 2,900 96 3,300 129
Texas 17,200 2,021 19,300 2,079 18,100 2,108 16,300 2,027 14,800 1,959
Total 79,500 10,760 93,920 12,856 92,220 12,421 87,850 12,242 86,400 13,346
Source: U.S. Department of Agriculture, National Agricultural Statistics Service, Vegetables, Summary, Agricultural Statistics Board, various issues 1977-1981.
~ CJ.:)
1988
Table 33. Estimated Honeydew Production and Acreage by State, Fresh Market, 1983-88.
Year
1983 1984 1985 1986 1987
Harvested Production Harvested Production Harvested Production Harvested Production Harvested Production Harvested Production
Acreage I,OOOcwt Acreage 1,000cwt Acreage I,OOOcwt Acreage 1,000cwt Acreage 1,000cwt Acreage 1,000cwt
2,800 280 2,000 310 2,200 385 2,800 448 3,400 459 2,400Arizona 420
2,868 16,300 2,771 18,500 3,423 19,000 3,800 20,600 3,708California 15,500 21,300 3,621
5,500 770 5,000 950 5,000 950 7,000 1,190 4,600 644 7,500 1,200Texas
23,800 3,918 23,300 4,031 25,700 4,758 28,800 5,438 28,600 4,811 31,200Total 5,241
Source: U.S. Department of Agriculture, National Agricultural Statistics Service, Vegetables. Summary, Agricultural Statistics Board, various issues 1983-88.
..,...,.
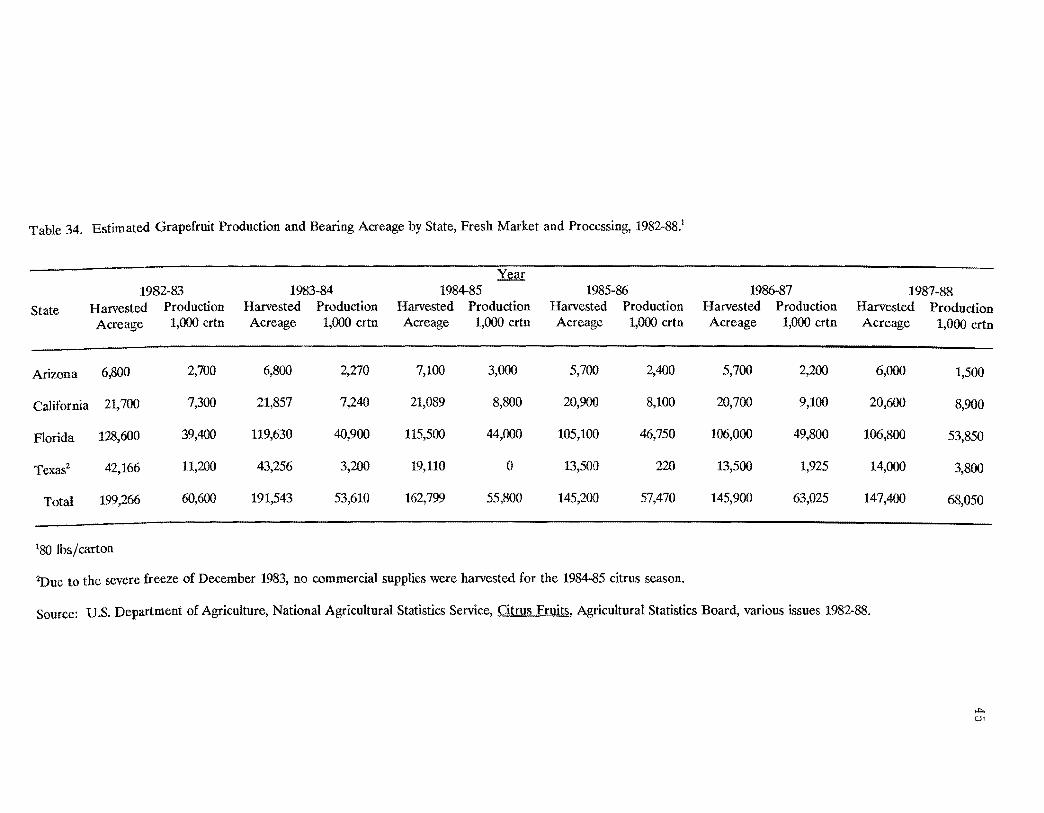
Table 34. Estimated Grapefruit Production and Bearing Acreage by State, Fresh Market and Processing, 1982-88.1
Year 1982-83 1983-84 1984-85 1985-86 1986-87 1987-88
State Harvested Production Harvested Production Harvested Production Harvested Production Harvested Production Harvested Production Acreage 1,000 crtn Acreage 1,000 crtn Acreage 1,000 crtn Acreage 1,000 crtn Acreage 1,000 crtn Acreage 1,000 crtn
Arizona 6,800 2,700 6,800 2,270 7,100 3,000 5,700 2,400 5,700 2,200 6,000 1,500
California 21,700 7,300 21,857 7,240 21,089 8,800 20,900 8,100 20,700 9,100 20,600 8,900
Florida 128,600 39,400 119,630 40,900 115,500 44,000 105,100 46,750 106,000 49,800 106,800 53,850
Texas2 42,166 11,200 43,256 3,200 19,110 ° 13,500 220 13,500 1,925 14,000 3,800
Total 199,266 60,600 191,543 53,610 162,799 55,800 145,200 57,470 145,900 63,025 147,400 68,050
180 lbs/carton
2Due to the severe freeze of December 1983, no commercial supplies were harvested for the 1984-85 citrus season.
Source: U.S. Department of Agriculture, National Agricultural Statistics Service, Citrus Fruits, Agricultural Statistics Board, various issues 1982-88.
CJl "'"
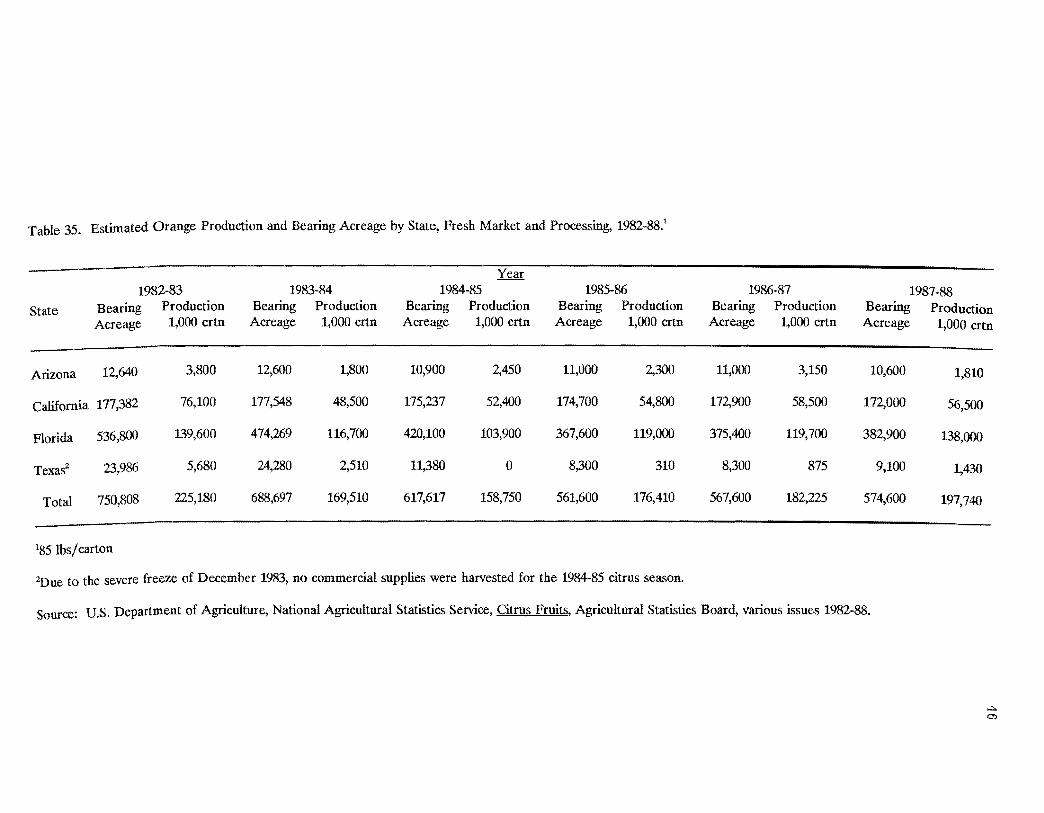
Table 35. Estimated Orange Production and Bearing Acreage by State, Fresh Market and Processing, 1982-88.1
Year 1982-83 1983-84 1984-85 1985-86 1986-87 1987-88
State Bearing Production Bearing Production Bearing Production Bearing Production Bearing Production Bearing Production Acreage 1,000 crtn Acreage 1,000 crtn Acreage 1,000 crtn Acreage 1,000 crtn Acreage 1,000 crtn Acreage 1,000 crtn
Arizona 12,640 3,800 12,600 1,800 10,900 2,450 11,000 2,300 11,000 3,150 10,600 1,810
California 177,382 76,100 177,548 48,500 175,237 52,400 174,700 54,800 172,900 58,500 172,000 56,500
Florida 536,800 139,600 474,269 116,700 420,100 103,900 367,600 119,000 375,400 119,700 382,900 138,000
Texas2 23,986 5,680 24,280 2,510 11,380 0 8,300 310 8,300 875 9,100 1,430
Total 750,808 225,180 688,697 169,510 617,617 158,750 561,600 176,410 567,600 182,225 574,600 197,740
185 lbs/carton
2Due to the severe freeze of December 1983, no commercial supplies were harvested for the 1984-85 citrus season.
Source: U.S. Department of Agriculture, National Agricultural Statistics Service, Citrus Fruit!h Agricultural Statistics Board, various issues 1982-88.
...,. 0)

47
FIGURES
48
Figure 1. Estimated monthly share of fresh market held
by Texas Broccoli Producers, 1983-88 averages
10
8
,-.,
~ '-" <:,I... eo:
.::I 6 ,...'" e ~
21
4
2
o Jan Feb Mar Apr May Jun Jul Aug Sep Oct Nov Dec
Month

49
Figure 2. Estimated monthly share of fresh market held
by Texas Cabbage Producers, 1983-88 averages
60
50
40
30
20
10
o Jan Feb Mar Apr May Jun Jui Aug Sep Oct Nov Dec
Month
---
20
50
Figure 3. Estimated monthly share of fresh market held
by Texas Carrot Producers, 1983-1988 averages
~ 15
<lJ... ~ .d '" ~ ... ~
~
10
5
o Jan Feb Mar Apr May Jun Jul Aug Sep Oct Nov Dec
Month

51
Figure 4. Estimated monthly share of fresh market held
by Texas Celery Producers, 1983-88 averages
15
10 ,-..,
~
IlJ
~ '"' or.: IlJ -.:.:: ~ '"' ~
5
o Jan Feb Mar Apr May Jun Jul Aug Sep Oct Nov Dec
Month
52
Figure 5. Estimated monthly share of fresh market held
by Texas Cucumber Producers, 1983-88 averages
~ <lJ r. 20 ! .....'" <lJ
~ C':
~ 15
Jan Feb Mar Apr May Jun Ju1 Aug Sep Oct Nov Dec
Month
53
Figure 6. Estimated monthly share of fresh market held by
Texas Green Bell Pepper Producers, 1983-1988 averages
50
40
""'"' ~ '-'
a CI.>
..t:l til
CI.> -.:.:: loo 30 ~
20
10
o Jan Feb Mar Apr May Jun Jul Aug Sep Oct Nov Dec
Month
54
80
Figure 7. Estimated monthly share of fresh market held
by Texas Dry Onion Producers, 1983-88 averages
60
* ~
'-" Q,l
-~ Q,l .:.:I ~ -40~
20
O~---T--"'T'"
Jan Feb Mar Apr May Jun Jul Aug Sep Oct Nov Dec
Month
55
Figure 8. Estimated monthly share of fresh market
held by Texas Tomato Producers, 1983-1988 averages
Jan Feb Mar Apr May Jun Jul Aug Sep Oct Nov Dec
Month
56
Figure 9. Estimated monthly share of fresh market held by
Texas Cantaloupe Producers, 1983·88 averages
80
""' ~ '-'
l!:! C':I ..d <I:l .... ~
.!Ii: I-< C':I;;
60
40
20
o~--.....--......------.... Jan Feb Mar Apr May Jun Jul Aug Sep Oct Nov Dec
Month

57
Figure 10. Estimated monthly share offresh market held by
Texas Honeydew Producers, 1983~88 averages
~
~ 'l.I 60... ~
~ ... Q,>
..:.:... C':
~
40
Jan Feb Mar Apr May Jun JuI Aug Sep Oct Nov Dec
Month
58
Figure 11. Estimated monthly share of fresh market held by
Texas Grapefruit Producers, 1983-88 averages
20
15 ,-..
'-' * <l.>
C<:! '"' ..c .....'" <l.> ~
'"' ~ 10
5
o Jan Feb Mar Apr May Jun Ju1 Aug Sep Oct Nov Dec
Month
59
Figure 12. Estimated monthly share of fresh market held
by Texas Orange Producers, 1983-88 averages
Jan Feb Mar Apr May Jun Jul Aug Sep Oct Nov Dec
Month

60
APPENDIX
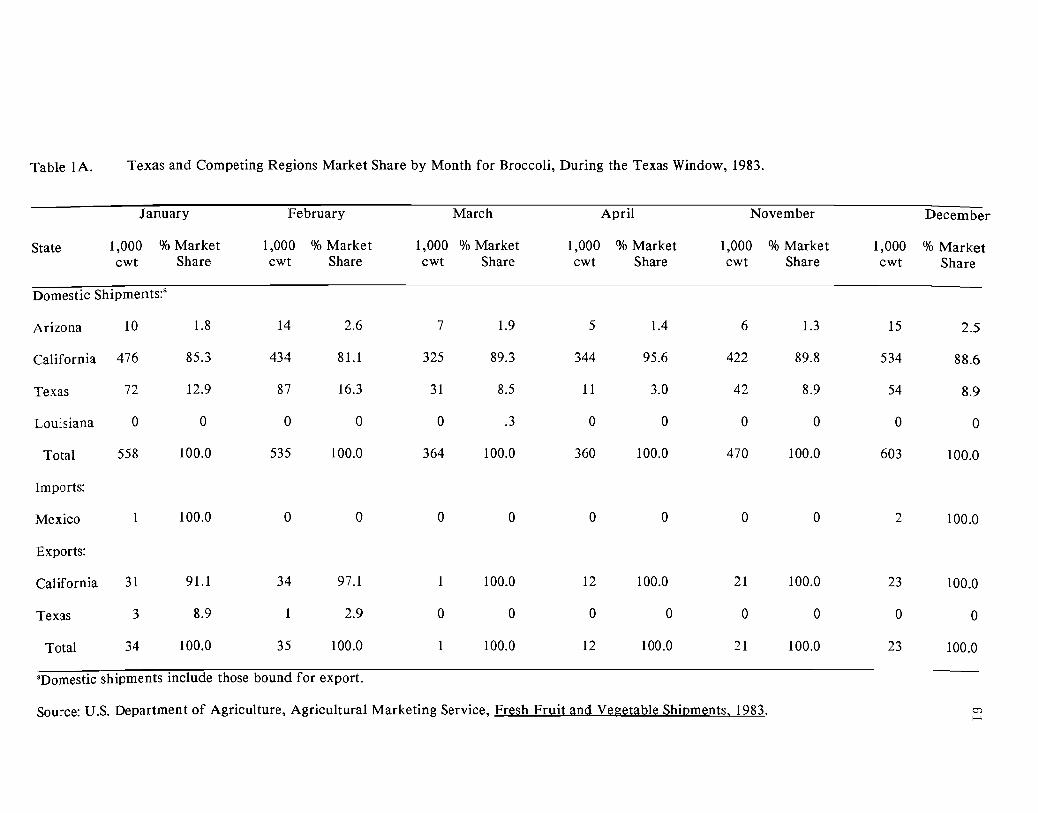
Table lAo Texas and Competing Regions Market Share by Month for Broccoli, During the Texas Window, 1983.
January February March April November December
State 1,000 % Market 1,000 % Market 1,000 % Market 1,000 % Market 1,000 % Market 1,000 % Market cwt Share cwt Share cwt Share cwt Share cwt Share cwt Share
Domestic Shipments:a
Arizona 10 1.8 14 2.6 7 1.9 5 1.4 6 1.3 15 2.5
California 476 85.3 434 81.1 325 89.3 344 95.6 422 89.8 534 88.6
Texas 72 12.9 87 16.3 31 8.5 11 3.0 42 8.9 54 8.9
Louisiana 0 0 0 0 0 .3 0 0 0 0 0 0
Total 558 100.0 535 100.0 364 100.0 360 100.0 470 100.0 603 100.0
Imports:
Mexico 100.0 0 0 0 0 0 0 0 0 2 100.0
Exports:
California 31 91.1 34 97.1 100.0 12 100.0 21 100.0 23 100.0
Texas 3 8.9 2.9 0 0 0 0 0 0 0 0
Total 34 100.0 35 100.0 100.0 12 100.0 21 100.0 23 100.0
aDomestic shipments include those bound for export.
Source: U.S. Department of Agriculture, Agricultural Marketing Service, Fresh Fruit and Vegetable Shipments, 1983. en f-'

Table lA. Texas and Competing Regions' Market Share by Month for Broccoli, During the Texas Window, 1984
January February March April October November December
1,000 %Market 1,000 %Market 1,000 %Market 1,000 %Market 1,000 %Markct 1,000 %Market 1,000 %Market
cwt Share cwt Share cwt Share cwt Share cwt Share eM Share cwt Share
Domestic Shipments:'
Arizona 28 4.5 17 3.4 12 2.1 6 .9 1 .2 17 3.4 28 4.6
California 581 94.2 453 90.4 565 97.2 664 97.4 406 99.2 458 92.7 520 85.7
Texas 8 1.3 31 6.2 4 .7 12 1.7 2 .4 19 3.0 59 9.7
Total 617 100.0 501 100.0 581 100.0 682 100.0 409 100.0 494 100.0 607 100.0
Imports:
Canada 0 0 0 0 1 25.0 0 0
Mexico 7 10()'0 12 100.0 9 100.0 3 100.0 3 75.0 2 100.0 3 100.0
Total 7 100.0 12 100.0 9 100.0 3 100.0 4 100.0 2 100.0 3 100.0
E}.])orts:
California 32 100.0 24 100.0 30 100.0 46 100.0 8 100.0 21 100.0 18 94.7
Texas 0 0 0 0 0 0 1 5.3
Total 32 100.0 24 100.0 30 100.0 46 100.0 8 100.0 21 100.0 19 100.0
aDomestic shipments include those bound for export.
Source: U.S. Department of Agriculture, Agricultural Marketing Service, Fresh Fruit and Vegetable Shipments, 1984.
0')
~
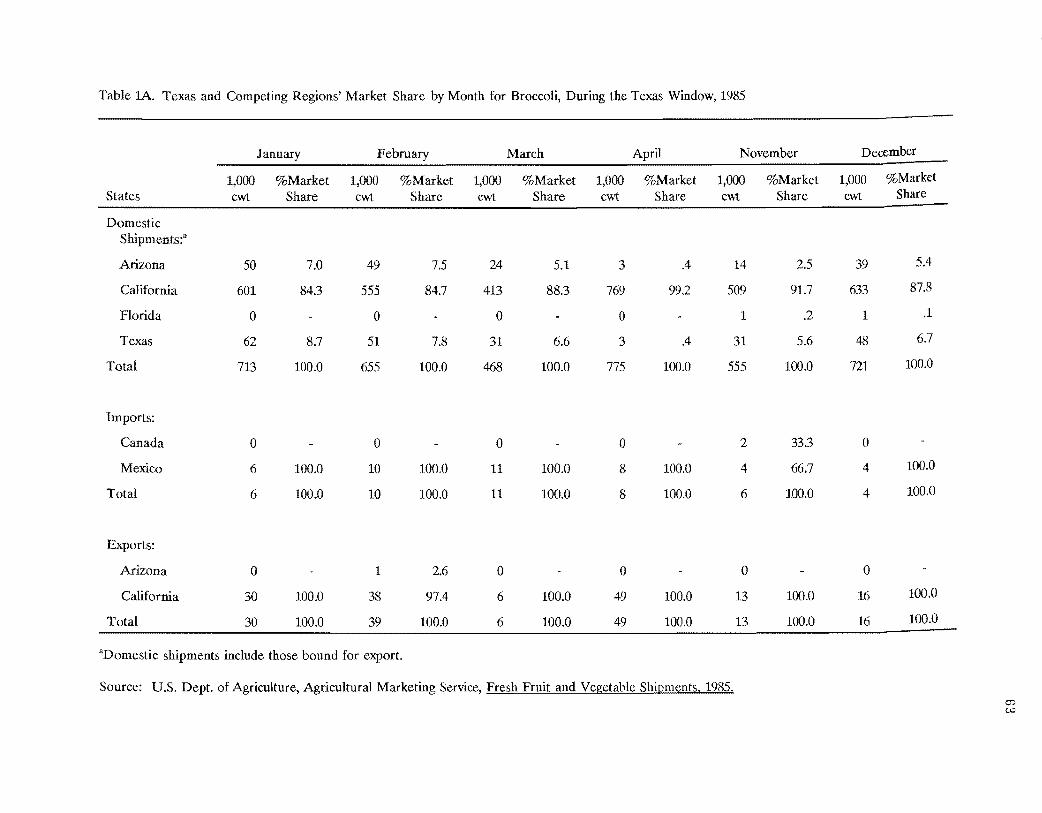
Table lA. Texas and Competing Regions' Market Share by Month for Broccoli, During the Texas Window, 1985
January February March April November December
States cwt %Market
Share 1,000 cwt
%Market Share
1,000 cwt
%Market Share
1,000 cwt
%Market Share
1,000 cwt
%Market Share
1,000 cwt
%Market Share
Domestic Shipments:a
Arizona
California
Florida
Texas
Total
50
601
0
62
713
7.0
84.3
8.7
100.0
49
555
0
51
655
7.5
84.7
7.8
100.0
24
413
0
31
468
5.1
88.3
6.6
100.0
3
769
0
3
775
.4
99.2
.4
100.0
14
509
1
31
555
2.5
91.7
.2
5.6
100.0
39
633
1
48
721
5.4
87.8
.1
6.7
100.0
Imports:
Canada
Mexico
Total
0
6
6
100.0
100.0
0
10
10
100.0
100.0
0
11
11
100.0
100.0
0
8
8
100.0
100.0
2
4
6
33.3
66.7
100.0
0
4
4
100.0
100.0
Exports:
Arizona
California
Total
0
30
30
100.0
100.0
1
38
39
2.6
97.4
100.0
0
6
6
100.0
100.0
0
49
49
100.0
100.0
0
13
13
100.0
100.0
0
16
16 100.0
"Domestic shipments include those bound for export.
Source: U.S. Dept. of Agriculture, Agricultural Marketing Service, Fresh Fruit and Vegetable Shipments. 1985. O? w
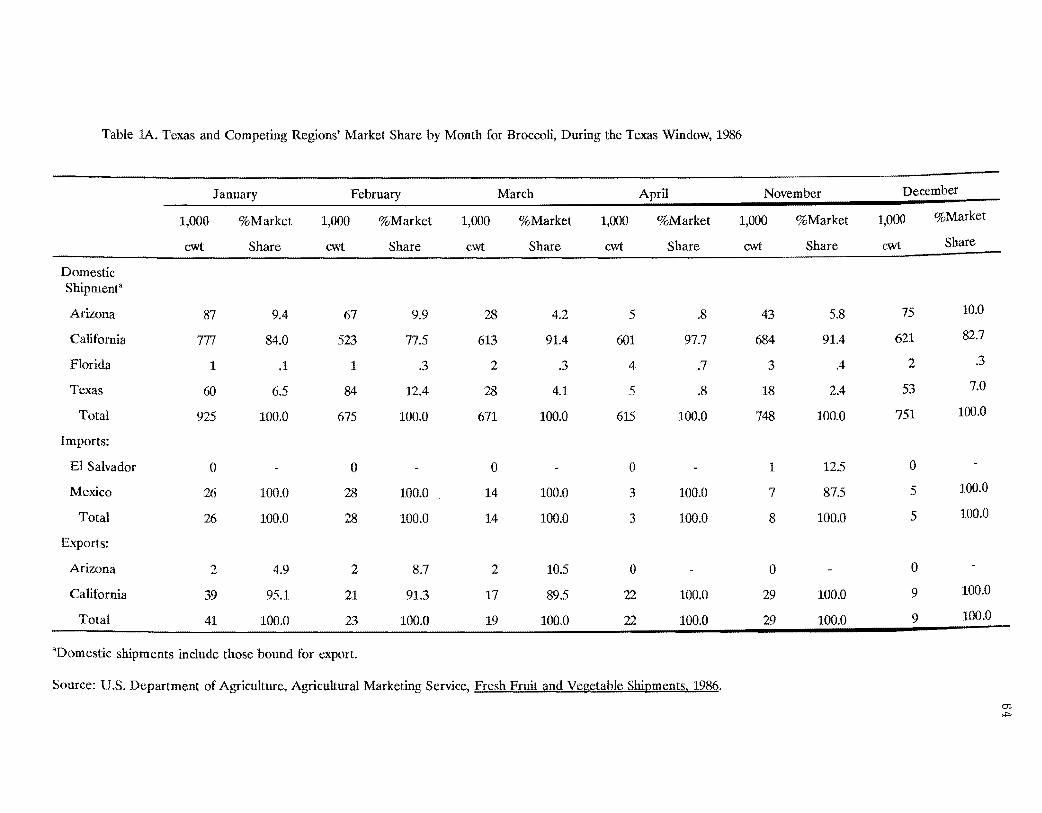
Table 1A. Texas and Competing Regions' Market Share by Month for Broccoli, During the Texas Window, 1986
January February March April November December
1,000 %Market 1,000 %Market 1,000 %Market 1,000 %Market 1,000 %Market 1,000 %Market
cwt Share cwt Share cwt Share cwt Share cwt Share cwt Share
Domestic Shipmenta
Arizona 87 9.4 67 9.9 28 4.2 5 .8 43 5.8 75 10.0
California 777 84.0 523 77.5 613 91.4 601 97.7 684 91.4 621 82.7
Florida 1 .1 1 .3 2 .3 4 .7 3 .4 2 .3
Texas 60 6.5 84 12.4 28 4.1 5 .8 18 2.4 53 7.0
Total 925 100.0 675 100.0 671 100.0 615 100.0 748 100.0 751 100.0
Imports:
El Salvador 0 0 0 a 1 12.5 0
Mexico 26 100.0 28 100.0 14 100.0 3 100.0 7 87.5 5 100.0
Total 26 100.0 28 100.0 14 100.0 3 100.0 8 100.0 5 100.0
Exports:
Arizona 2 4.9 2 8.7 2 10.5 a a a
California 39 95.1 21 91.3 17 89.5 22 100.0 29 100.0 9 100.0
Total 41 100.0 23 100.0 19 100.0 22 100.0 29 100.0 9 100.0
aDomestic shipments include those bound for export.
Source: U.S. Department of Agriculture, Agricultural Marketing Service, Fresh Fruit and Vegetable Shipments. 1986. Q';)
.+>
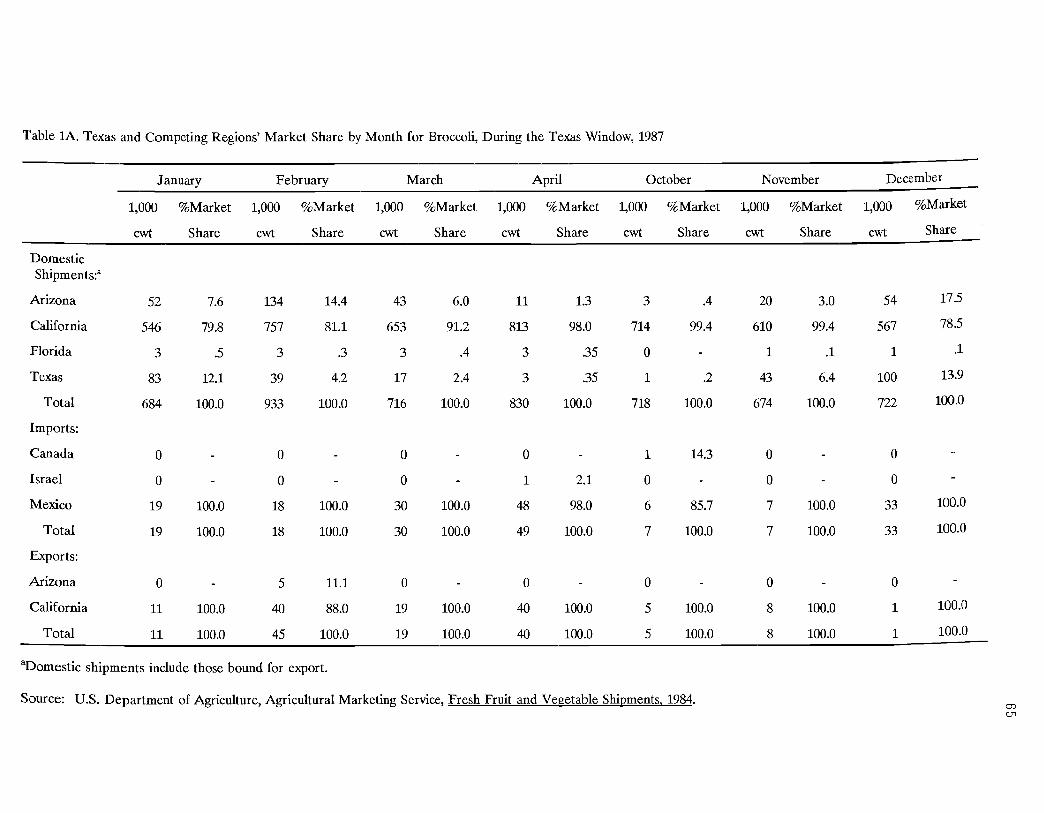
Table lA. Texas and Competing Regions' Market Share by Month for Broccoli, During the Texas Window, 1987
January February March April October November December
1,000 %Market 1,000 %Market 1,000 %Market 1,000 %Market 1,000 % Market 1,000 %Market 1,000 %Market
cwt Share cwt Share cwt Share cwt Share cwt Share cwt Share cwt Share
Domestic Shipments:a
Arizona 52 7.6 134 14.4 43 6.0 11 1.3 3 .4 20 3.0 54 17.5
California 546 79.8 757 81.1 653 91.2 813 98.0 714 99.4 610 99.4 567 78.5
Florida 3 .5 3 .3 3 .4 3 .35 0 1 .1 1 .1
Texas 83 12.1 39 4.2 17 2.4 3 .35 1 .2 43 6.4 100 13.9
Total 684 100.0 933 100.0 716 100.0 830 100.0 718 100.0 674 100.0 722 100.0
Imports:
Canada 0 0 0 0 1 14.3 0 0
Israel 0 0 0 1 2.1 0 0 0
Mexico 19 100.0 18 100.0 30 100.0 48 98.0 6 85.7 7 100.0 33 100.0
Total 19 100.0 18 100.0 30 100.0 49 100.0 7 100.0 7 100.0 33 100.0
Exports:
Arizona 0 5 11.1 0 0 0 0 0
California 11 100.0 40 88.0 19 100.0 40 100.0 5 100.0 8 100.0 1 100.0
Total 11 100.0 45 100.0 19 100.0 40 100.0 5 100.0 8 100.0 1 100.0
aDomestic shipments include those bound for export.
Source: U.S. Department of Agriculture, Agricultural Marketing Service, Fresh Fruit and Vegetable Shipments. 1984. m U1
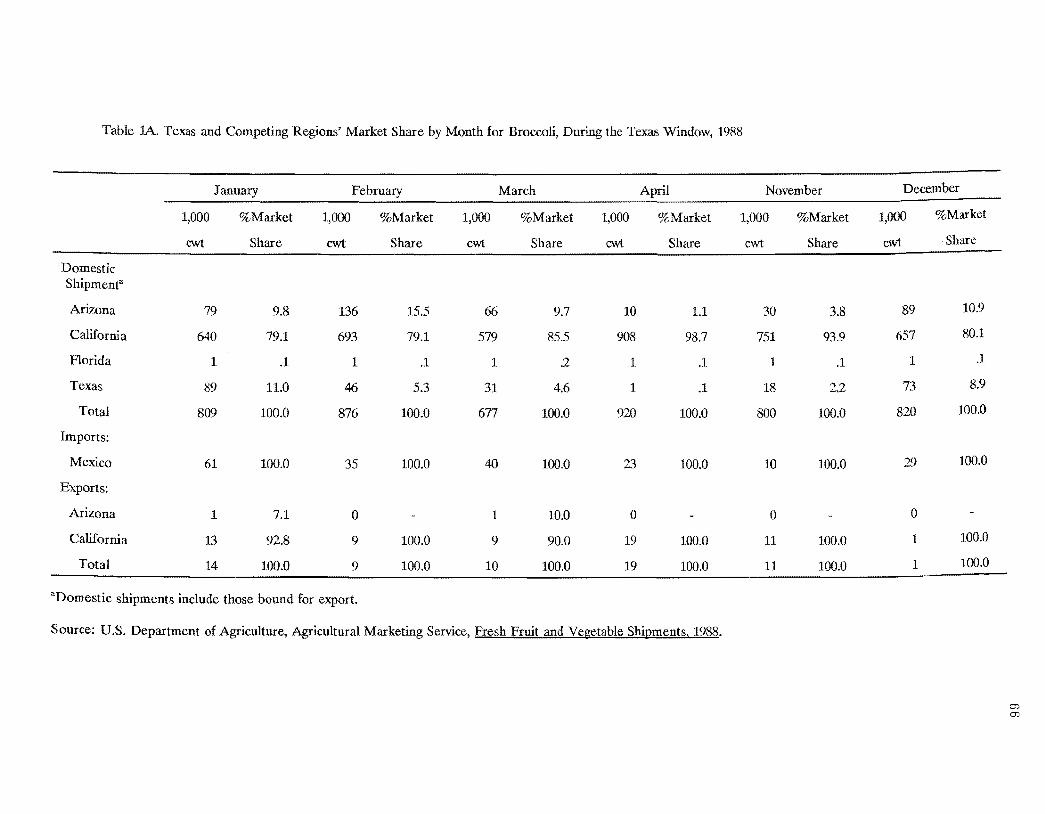
Table lA. Texas and Competing Regions' Market Share by Month for Broccoli, During the Texas Window, 1988
January February March April November December
%Market1,000 %Market 1,000 %Market 1,000 %Market 1,000 %Market 1,000 %Market 1000
Shareewt Share cwt Share cwt Share cwt Share cwt Share cwt
Domestic Shipmenta
Arizona 79 9.8 136 15.5 66 9.7 10 1.1 30 3.8 89 10.9
California 640 79.1 693 79.1 579 85.5 908 98.7 751 93.9 657 80.1
Florida 1 .1 1 .1 1 .2 1 .1 1 .1 1 J
Texas 89 11.0 46 5.3 31 4.6 1 .1 18 2.2 73 8.9
Total 809 100.0 876 100.0 677 100.0 920 100.0 SOO 100.0 820 100.0
Imports:
Mexico 61 100.0 35 100.0 40 100.0 23 100.0 10 100.0 29 100.0
Exports:
Arizona 1 7.1 a 1 10.0 0 0 0
California 13 92.8 9 100.0 9 90.0 19 100.0 11 100.0 1 100.0
Total 14 100.0 9 100.0 10 100.0 19 100.0 11 100.0 1 100.0
aDomestic shipments include those bound for export.
Source: U.S. Department of Agriculture, Agricultural Marketing Service, Er~sh Fruit and Vegetable Shipments. 1988.
en en
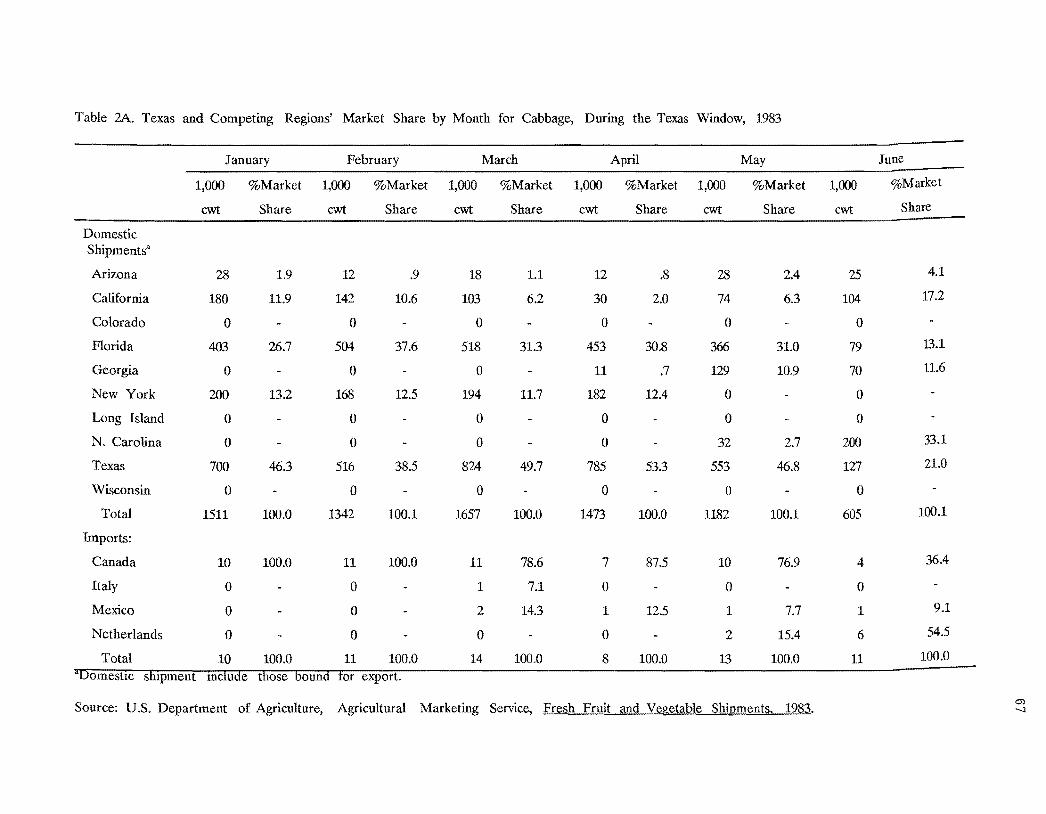
Table 2A. Texas and Competing Regions' Market Share by Month for Cabbage, During the Texas Window, 1983
January February March April May June
1,000 %Market 1,000 %Market 1,000 %Market 1,000 %Market 1,000 %Market 1,000 %Market
cwt Share cwt Share cwt Share cwt Share cwt Share cwt Share
Domestic Shipments3
Arizona 28 1.9 12 .9 18 1.1 12 .8 28 2.4 25 4.1
California 180 11.9 142 10.6 103 6.2 30 2.0 74 6.3 104 17.2
Colorado 0 0 0 ° 0 0
Florida 403 26.7 504 37.6 518 31.3 453 30.8 366 31.0 79 13.1
Georgia 0 0 0 11 .7 129 10.9 70 11.6
New York 200 13.2 168 12.5 194 11.7 182 12.4 0 0
Long Island 0 0 0 0 0 ° N. Carolina 0 0 0 0 32 2.7 200 33.1
Texas 700 46.3 516 38.5 824 49.7 785 53.3 553 46.8 127 21.0
Wisconsin 0 0 0 0 ° 0
Total 1511 100.0 1342 100.1 1657 100.0 1473 100.0 1182 100.1 605
Imports:
Canada 10 100.0 11 100.0 11 78.6 7 87.5 10 76.9 4 36.4
Italy 0 0 1 7.1 0 0 0
Mexico 0 0 2 14.3 1 12.5 1 7.7 1 9.1
Netherlands 0 0 0 0 2 15.4 6 54.5
Total 10 100.0 11 100.0 14 100.0 8 100.0 13 100.0 11 100.0
aOomestIc slupment mclude those bound for export.
enSource: U.S. Department of Agriculture, Agricultural Marketing Service, Fresh Fruit and Vegetable Shipments. 1983. -.J

Table 2A(cont). Texas and Competing Regions' Market Share by Month for Cabbage, During the Texas Window, 1983
January February March April May June
1,000 %Market 1,000 %Market 1,000 %Market 1,000 %Market 1,000 %Market 1,000 %Market
cwt Share cwt Share cwt Share cwt Share cwt Share cwt Share
Exports:
Florida 0 1 33.3 0 0 0 0
New York 0 a 0 0 0 0
Texas 0 2 66.7 4 100.0 2 100.0 2 100.0 0
Total 0 3 100.0 4 100.0 2 100.0 2 100.0 0
"Domestic shipment mclude those bound for export.
Source: U.S. Department of Agriculture, Agricultural Marketing Service, Fresh Fruit and Vegetable Shipments, 1983.
OJ co
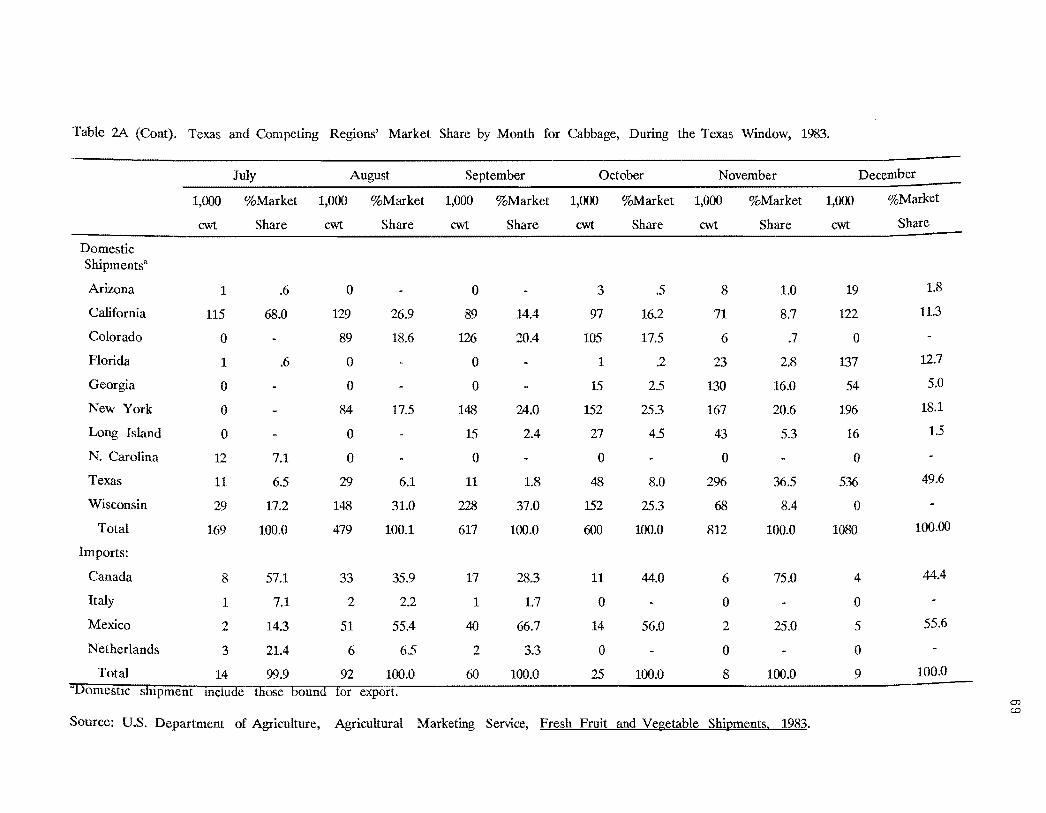
Table 2A (Cont). Texas and Competing Regions' Market Share by Month for Cabbage, During the Texas Window, 1983.
July August September October November December
1,000 %Market 1,000 %Market 1,000 %Market 1,000 %Market 1,000 %Market 1,000 %Market
cwt Share cwt Share cwt Share cwt Share cwt Share cwt Share
Domestic ShipmentsA
Arizona 1 .6 0 0 3 .5 8 1.0 19 1.8
California 115 68.0 129 26.9 89 14.4 97 16.2 71 8.7 122 11.3
Colorado 0 89 18.6 126 20.4 105 17.5 6 .7 0
Florida 1 .6 0 0 1 .2 23 2.8 137 12.7
Georgia 0 0 0 15 2.5 130 16.0 54 5.0
New York 0 84 17.5 148 24.0 152 25.3 167 20.6 196 18.1
Long Island 0 0 15 2.4 27 4.5 43 5.3 16 1.5
N. Carolina 12 7.1 0 0 0 0 0
Texas 11 6.5 29 6.1 11 1.8 48 8.0 296 36.5 536 49.6
Wisconsin 29 17.2 148 31.0 228 37.0 152 25.3 68 8.4 0
Total 169 100.0 479 100.1 617 100.0 600 100.0 812 100.0 1080 100.00
Imports:
Canada 8 57.1 33 35.9 17 28.3 11 44.0 6 75.0 4 44.4
Italy 1 7.1 2 2.2 1 1.7 0 0 0
Mexico 2 14.3 51 55.4 40 66.7 14 56.0 2 25.0 5 55.6
Netherlands 3 21.4 6 6.5 2 3.3 0 0 0
Total 14 99.9 92 100.0 60 100.0 25 100.0 8 100.0 9 100.0
aDomestIc shlpment mciude those bound for export. en CD
Source: U.S. Department of Agriculture, Agricultural Marketing Service, Fresh Fruit and Vegetable Shipments. 1983.

Table 2A (ConL). Texas and Competing Regions' Market Share by Month for Cabbage, During the Texas Window, 1983.
July August September October November December
1,000 %Market 1,000 %Market 1,000 %Market 1,000 %Market 1,000 %Market 1,000 %Market
cwt Share cwt Share cwt Share cwt Share Cwt Share cwt Share
Exports:
Flordia 0 0 0 0 0 0
New York 0 4 100.0 4 100.0 7 100.0 4 100.0 0
Texas 0 0 0 0 0 0
Total 0 4 100.0 4 100.0 7 100.0 4 100.0 0 "Domestlc shlpment mclude those bound for export.
Source: U.S. Department of Agriculture, Agricultural Marketing Service, Fresh Fruit and Vegetable Shipments. 1983.
--.J o

Table 2A. Texas and Competing Regions' Market Share by Month for Cabbage, During the Texas Window, 1984.
January February March April May June
%Market 1,000 %Market 1,000 %Market 1,000 %Market 1,000 %Market 1,000 %Market
cwt Share cwt Share cwt Share cwt Share cwt Share cwt Share
Domestic Shipments3
Arizona 20 2.4 21 2.3 25 2.1 62 4.2 33 2.2 2 .3
California 175 21.3 139 15.3 188 16.1 166 11.3 192 12.9 176 16.8
Colorado 0 0 0 0 0 0
Florida 101 12.3 101 11.1 222 19.0 509 34.6 511 34.2 56 8.5
Georgia 0 0 0 16 1.1 130 8.7 0
New York 255 31.0 203 22.4 191 16.3 82 5.6 0 65 9.9
Long Island 0 0 0 0 0 0
N. Carolina 0 0 0 0 63 4.2 172 26.2
Texas 271 33.3 443 48.8 543 46.4 637 43.3 564 37.8 186 28.3
Virginia 0 0 0 0 0 0
Wisconsin 0 0 0 0 0 0
Total 822 100.0 907 99.9 1169 99.9 1472 100.1 1493 100.0 657 100.0
Imports:
Belgium 0 0 1 .2 1 .6 0 0
Canada 57 17.8 54 15.0 19 4.3 3 1.8 0 0
Costa Rica 0 0 2 .5 3 1.8 0 0
Dominican Rep. 2 .6 4 1.1 9 2.0 2 1.2 0 0
Guatemala 0 1 .3 0 1 .6 3 11.1 1 14.3
Honduras 0 0 0 0 1 3.7 0
Italy 0 0 1 .2 1 .6 0 0
Mexico 258 80.6 265 73.6 344 77.5 107 64.1 5 18.5 0
Netherlands 3 .9 36 10.0 66 14.9 46 27.5 18 66.7 6 85.7
West Germany 0 0 2 .5 3 1.8 0 0
Total 320 99.9 360 100.0 444 100.1 167 100.0 27 100.0 7 100.0 "-.J I-'
"DomestIc shIpments mclude those bound for export.
Source: U.S. Department of Agriculture, Agricultural Marketing Service, Fresh Fruit and Vegetable Shipments. 1985.
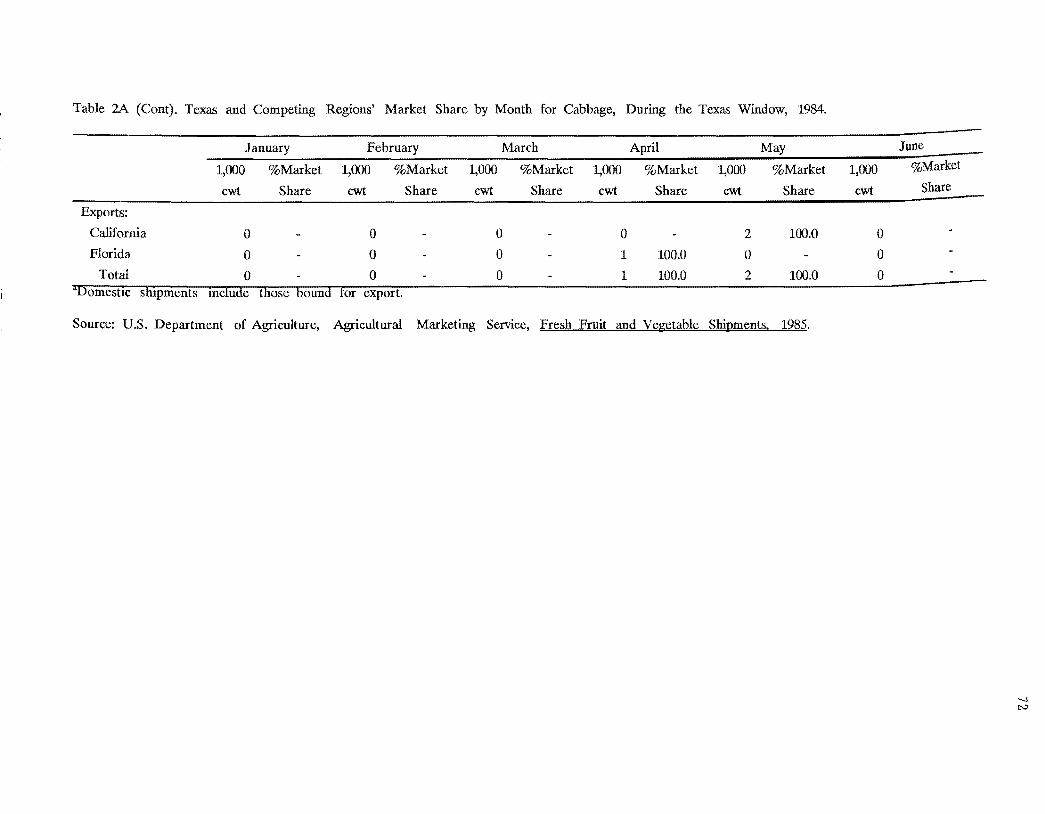
TabJe 2A (Cont). Texas and Competing Regions' Market Share by Month for Cabbage, During the Texas Window, 1984.
January February March April May June
1,000 %Market 1,000 %Market 1,000 %Market 1,000 %Market 1,000 %Market %Market
cwt Share cwt Share cwt Share cwt Share cwt Share cwt Share
Exports:
California
Florida
Total "Domestic shipments
o o o
o o o
Illclude those bound for export.
o o o
o 1
1
100.0
100.0
2
o 2
100.0
100.0
o o o
Source: U.S. Department of Agriculture, Agricultural Marketing Service, Fresh Fruit and Vegetable Shipments, 1985.
-;j
N
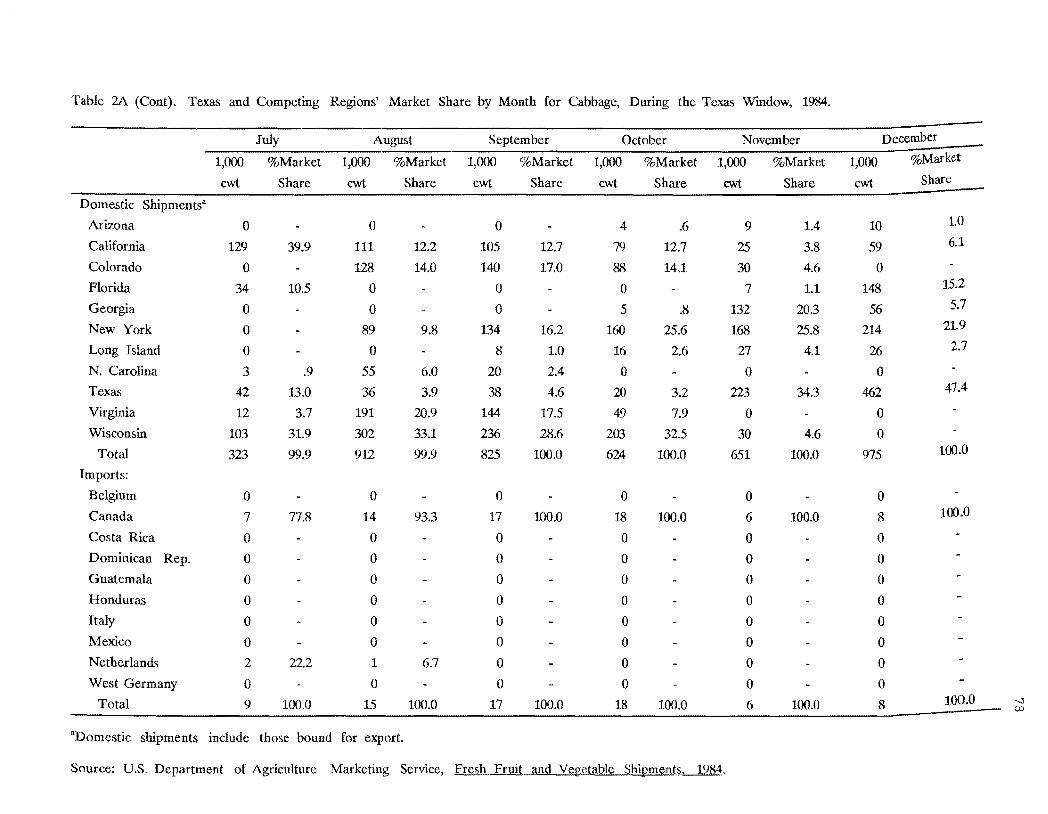
Table 2A (Cont). Texas and Competing Regions' Market Share by Month for Cabbage, During the Texas Window, 1984.
July August September October November December
1,000 %Market 1,000 %Market 1,000 %Market 1,000 %Market 1,000 %Market 1,000 %Market
cwt Share cwt Share cwt Share cwt Share cwt Share cwt Share
Domestic Shipmentsa
Arizona 0 0 0 4 .6 9 1.4 10
California 129 39.9 111 12.2 105 12.7 79 12.7 25 3.8 59 6.1
Colorado 0 128 14.0 140 17.0 88 14.1 30 4.6 ° Florida 34 10.5 0 0 0 7 1.1 148 15.2
Georgia 0 0 0 5 .8 132 20.3 56 5.7
New York 0 89 9.8 134 16.2 160 25.6 168 25.8 214 21.9
Long Island 0 0 8 1.0 16 2.6 27 4.1 26 2.7
N. Carolina 3 .9 55 6.0 20 2.4 0 0 0
Texas 42 13.0 36 3.9 38 4.6 20 3.2 223 34.3 462 47.4
Virginia 12 3.7 191 20.9 144 17.5 49 7.9 0 0
Wisconsin 103 31.9 302 33.1 236 28.6 203 32.5 30 4.6 0
Total 323 99.9 912 99.9 825 100.0 624 100.0 651 100.0 975 100.0
Imports:
Belgium ° 0 0 0 0 0
Canada 7 77.8 14 93.3 17 100.0 18 100.0 6 100.0 8 100.0
Costa Rica 0 0 0 0 0 0
Dominican Rep. 0 0 0 0 0 0
Guatemala 0 0 0 0 0 0
Honduras 0 0 0 0 0 0
Italy 0 0 0 0 0 0
Mexico 0 0 0 0 0 0
Netherlands 2 22.2 1 6.7 0 0 0 0
West Germany 0 0 0 0 0 0
Total 9 100.0 15 100.0 17 100.0 18 100.0 6 100.0 8 100.0 "'-J W
aDomestic shipments include those bound for export.
Source: U.S. Department of Agriculture Marketing Service, Fresh Fruit and Vegetable Shioments. 1984.

Table 2A (Cont). Texas and Competing Regions' Market Share by Month for Cabbage, During the Texas Window, 1984.
July August September October November December
1,000 %Market 1,000 %Market 1,000 %Market 1,000 %Market 1,000 %Market 1,000 %Market
cwt Share ewt Share cwt Share cwt Share cwt Share cwt Share
Exports:
California o o a o o o 100.0Florida o o o o o 1 100.0Total o o o o o 1
aDomestic shipments include those bound for export.
Source: U.S. Department of Agriculture Marketing Service, Fresh Fruit and Vegetable Shipments. 1984.
-...J 0+:>
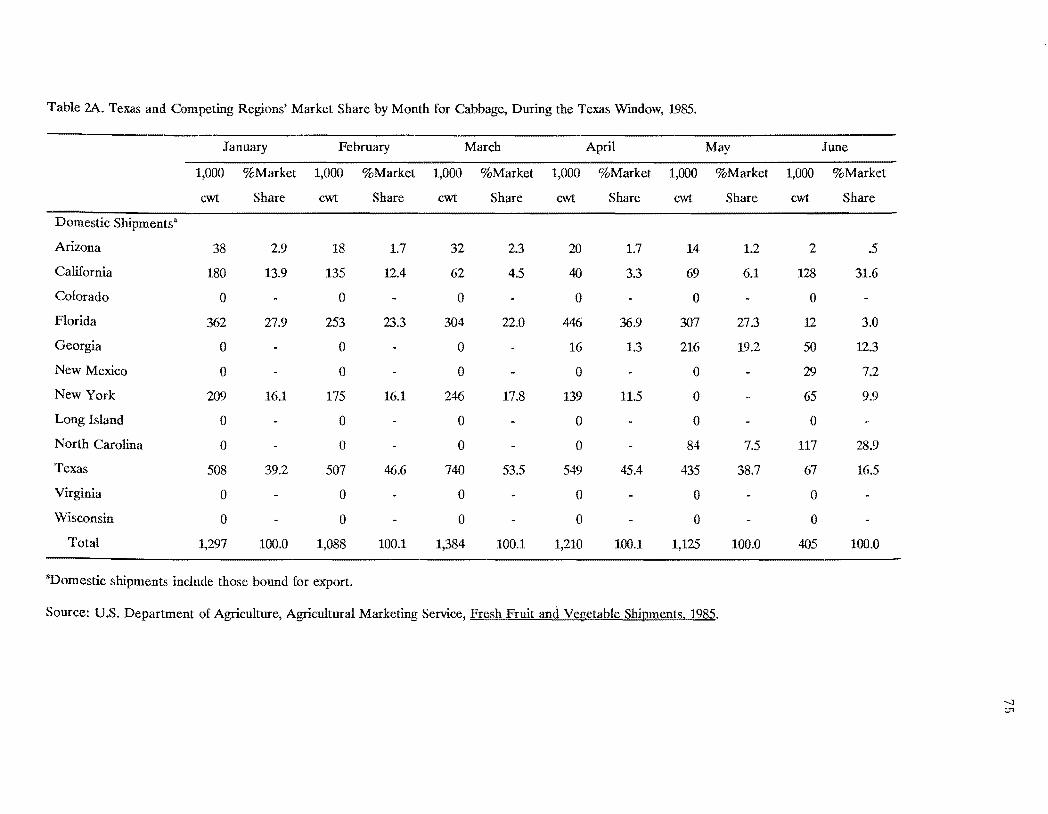
Table 2A. Texas and Competing Regions' Market Share by Month for Cabbage, During the Texas Window, 1985.
January February March April May June
1,000 %Market 1,000 %Market 1,000 %Market 1,000 %Market 1,000 %Market 1,000 %Market
cwt Share cwt Share cwt Share ewt Share cwt Share cwt Share
Domestic Shipments'
Arizona 38 2.9 18 1.7 32 2.3 20 1.7 14 1.2 2 .5
California 180 13.9 135 12.4 62 4.5 40 3.3 69 6.1 128 31.6
Colorado 0 0 0 0 0 0
Florida 362 27.9 253 23.3 304 22.0 446 36.9 307 27.3 12 3.0
Georgia 0 0 0 16 1.3 216 19.2 50 12.3
New Mexico 0 0 0 0 0 29 7.2
New York 209 16.1 175 16.1 246 17.8 139 11.5 0 65 9.9
Long Island 0 0 0 0 0 0
North Carolina 0 0 0 0 84 7.5 117 28.9
Texas 508 39.2 507 46.6 740 53.5 549 45.4 435 38.7 67 16.5
Virginia 0 0 0 0 0 0
Wisconsin 0 0 0 0 0 0
Total 1,297 100.0 1,088 100.1 1,384 100.1 1,210 100.1 1,125 100.0 405 100.0
"Domestic shipments include those bound for export.
Source: U.S. Department of Agriculture, Agricultural Marketing Service, Fresh Fruit and Vegetable Shipments, 1985.
-..J (.Jl
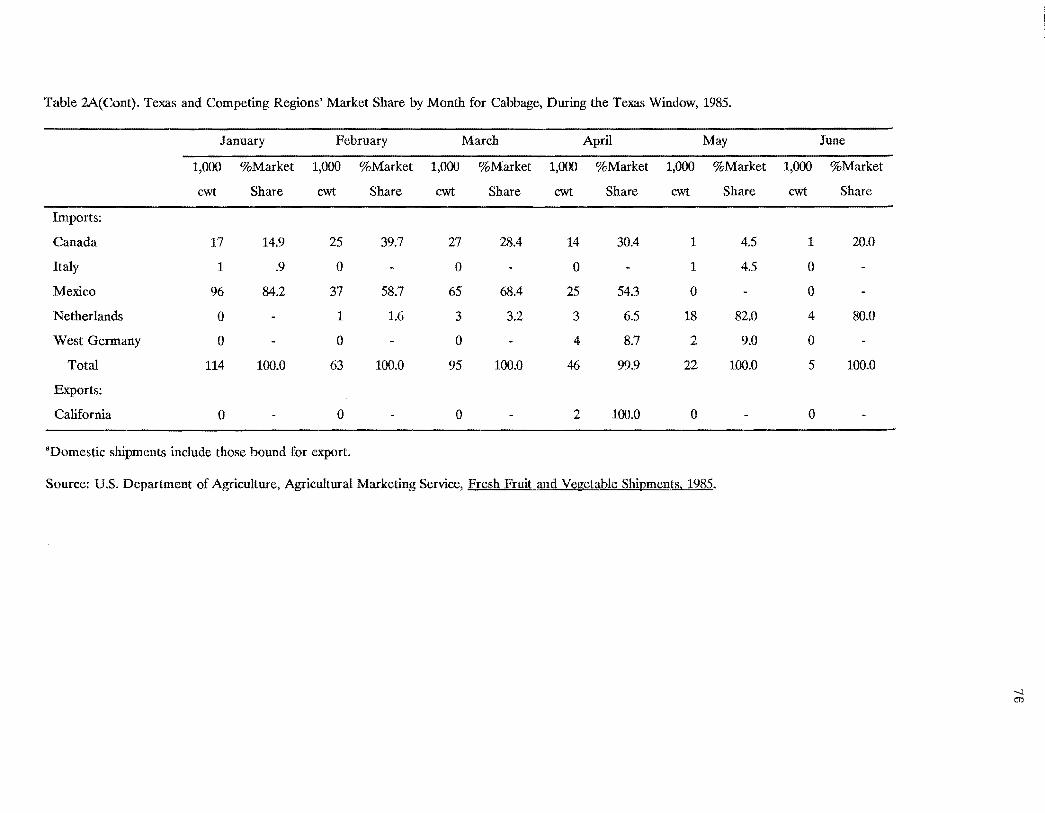
Table 2A(Cont). Texas and Competing Regions' Market Share by Month for Cabbage, During the Texas Window, 1985.
January February March April May June
1,000
cwt
%Market
Share
1,000
cwt
%Market
Share
1,000
cwt
%Market
Share
1,000
cwt
%Market
Share
1,000
cwt
%Market
Share
1,000
cwt
%Market
Share
Imports:
Canada
Italy
Mexico
Netherlands
West Germany
Total
Exports:
California
17
1
96
0
0
114
0
14.9
.9
84.2
100.0
25
0
37
1
0
63
0
39.7
58.7
1.6
100.0
27
0
65
3
0
95
0
28.4
68.4
3.2
100.0
14
0
25
3
4
46
2
30.4
54.3
6.5
8.7
99.9
100.0
1
1
0
18
2
22
0
4.5
4.5
82.0
9.0
100.0
1
0
0
4
0
5
0
20.0
80.0
100.0
aDomestic shipments include those bound for export.
Source: U.S. Department of Agriculture, Agricultural Marketing Service, Fresh Fruit and Vegetable Shipments. 1985.
....:J C'l
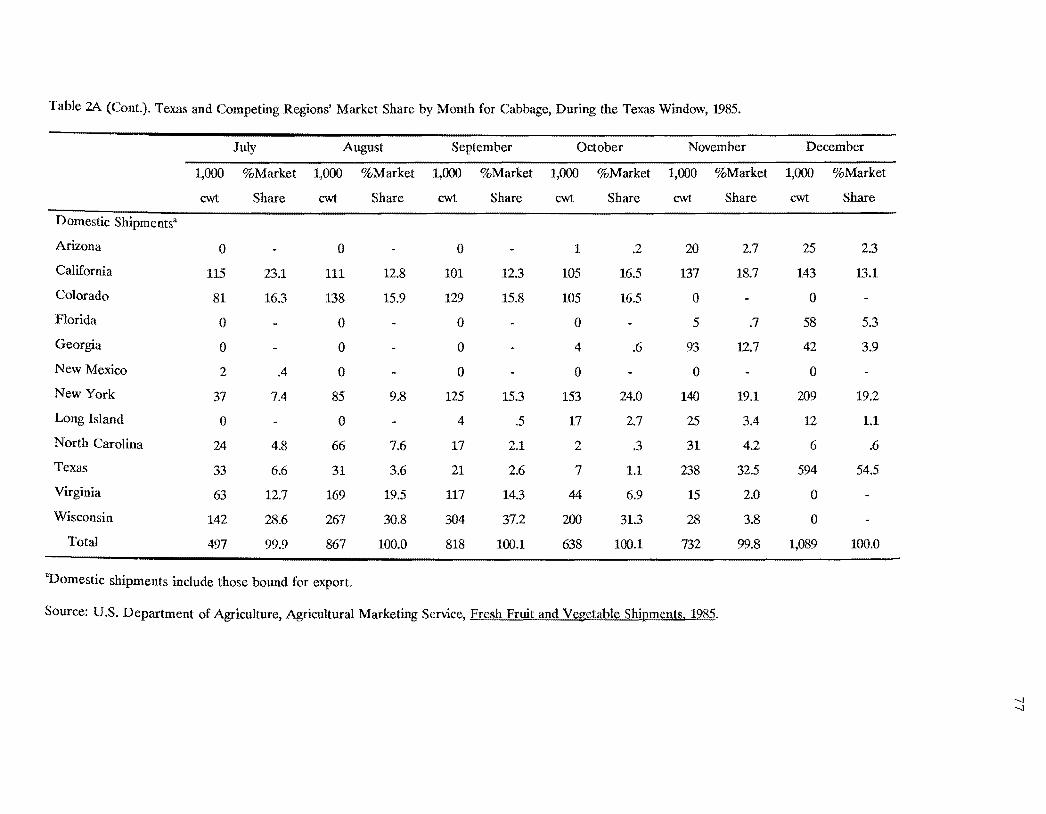
Table 2A (Cont.). Texas and Competing Regions' Market Share by Month for Cabbage, During the Texas Window, 1985.
July August September October November December
1,000 %Market 1,000 %Market 1,000 %Market 1,000 %Market 1,000 %Market 1,000 %Market
cwt Share cwt Share cwt Share cwt Share cwt Share cwt Share
Domestic Shipments"
Arizona 0 0 0 1 .2 20 2.7 25 2.3
California 115 23.1 111 12.8 101 12.3 105 16.5 137 18.7 143 13.1
Colorado 81 16.3 138 15.9 129 15.8 105 16.5 0 0
Florida 0 0 0 0 5 .7 58 5.3
Georgia 0 0 0 4 .6 93 12.7 42 3.9
New Mexico 2 .4 0 0 0 0 0
New York 37 7.4 85 9.8 125 15.3 153 24.0 140 19.1 209 19.2
Long Island 0 0 4 .5 17 2.7 25 3.4 12 1.1
North Carolina 24 4.8 66 7.6 17 2.1 2 .3 31 4.2 6 .6
Texas 33 6.6 31 3.6 21 2.6 7 1.1 238 32.5 594 54.5
Virginia 63 12.7 169 19.5 117 14.3 44 6.9 15 2.0 0
Wisconsin 142 28.6 267 30.8 304 37.2 200 31.3 28 3.8 0
Total 497 99.9 867 100.0 818 100.1 638 100.1 732 99.8 1,089 100.0
"Domestic shipments include those bound for export.
Source: U.S. Department of Agriculture, Agricultural Marketing Service, Fresh Fruit and Vegetable Shipments. 1985.
--.]
--.]

Table 2A (Cont.). Texas and Competing Regions' Market Share by Month for Cabbage, During the Texas Window, 1985.
July August September October November December
1,000
cwt
%Market
Share
1,000
cwt
%Market
Share
1,000
cwt
%Market
Share
1,000
cwt
%Market
Share
1,000
cwt
%Market
Share
1,000
cwt
%Market
Share
Imports:
Canada
Italy
Mexico
Netherlands
West Germany
Total
Exports:
California
1
0
0
3
0
4
0
25.0
75.0
100.0
5
0
0
2
0
7
0
71.4
28.6
100.0
8
0
0
0
0
8
0
100.0
100.0
10
0
0
0
0
10
0
100.0
100.0
26
0
0
0
0
26
0
100.0
100.0
54
0
25
0
0
79
0
68.4
31.6
100.0
"Domestic shipments include those bound for export.
Source: U.S. Department of Agriculture, Agricultural Marketing Service, Fresh Fruit and Vegetable Shipments. 1985.
'-l 0:>
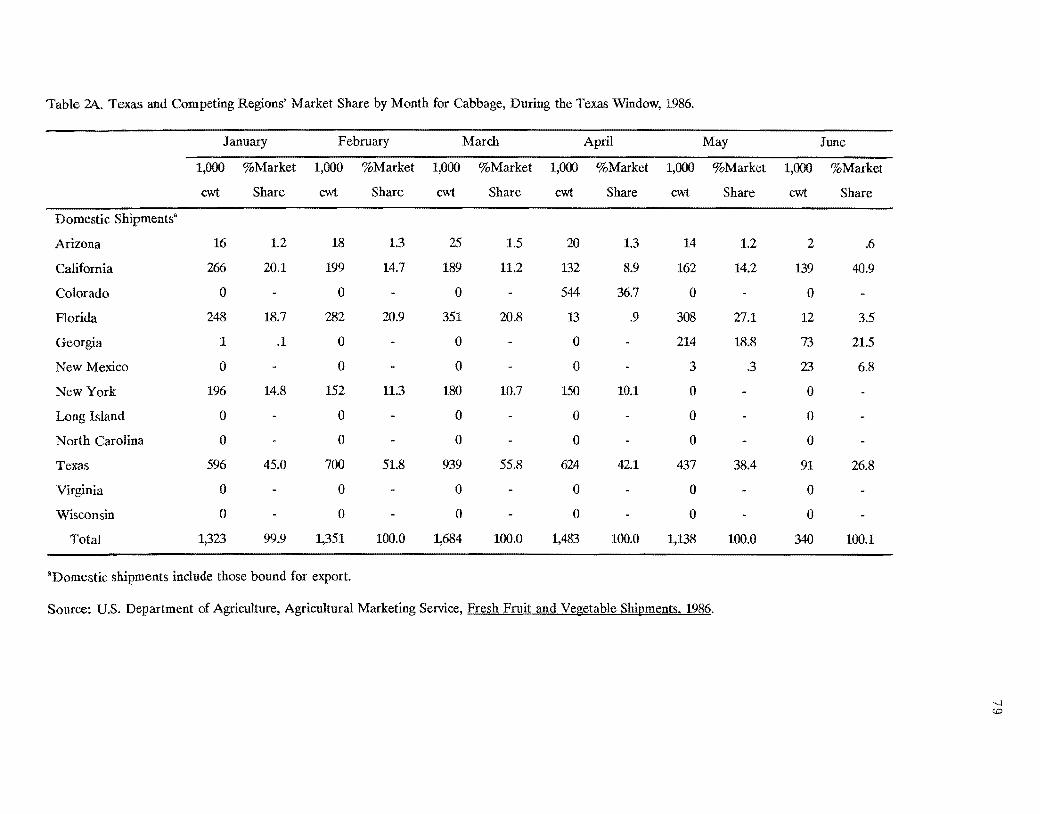
Table 2A. Texas and Competing Regions' Market Share by Month for Cabbage, During the Texas Window, 1986.
January February March April May June
1,000 %Market 1,000 %Market 1,000 %Market 1,000 %Market 1,000 %Market 1,000 %Market
ewt Share cwt Share cwt Share cwt Share cwt Share cwt Share
Domestic Shipmentsa
Arizona 16 1.2 18 1.3 25 1.5 20 1.3 14 1.2 2 .6
California 266 20.1 199 14.7 189 11.2 132 8.9 162 14.2 139 40.9
Colorado 0 0 0 544 36.7 0 0
Florida 248 18.7 282 20.9 351 20.8 13 .9 308 27.1 12 3.5
Georgia 1 .1 0 0 0 214 18.8 73 21.5
New Mexico 0 0 0 a 3 .3 23 6.8
New York 196 14.8 152 11.3 180 10.7 150 10.1 0 0
Long Island 0 0 0 0 0 0
North Carolina 0 0 0 0 0 0
Texas 596 45.0 700 51.8 939 55.8 624 42.1 437 38.4 91 26.8
Virginia 0 0 0 0 0 0
Wisconsin 0 0 0 0 0 0
Total 1,323 99.9 1,351 100.0 1,684 100.0 1,483 100.0 1,138 100.0 340 100.1
aDomestic shipments include those bound for export.
Source: U.S. Department of Agriculture, Agricultural Marketing Service, Fresh Fruit and Vegetable Shipments, 1986.
-..:J to

Table 2A(Cont). Texas and Competing Regions' Market Share by Month for Cabbage, During the Texas Window, 1986.
January February March April May June
1,000 %Market 1,000 %Market 1,000 %Market 1,000 %Market 1,000 %Market 1,000 %Market
cwt Share cwt Share cwt Share cwt Share cwt Share cwt Share
Imports:
Canada
Dominican Republic
Guatemala
Mexico
Netherlands
Total
Exports:
Florida
73 64.6 30 93.8 31 81.6 6 85.7 3 100.0 0
0 0 0 0 0 0
0 0 0 0 0 0
40 35.4 2 6.2 7 18.4 1 14.3 0 0
0 0 0 0 0 1 100.0
113 100.0 32 100.0 38 100.0 7 100.0 3 100.0 1 100.0
1 100.0 0 0 3 100.0 1 100.0 0
"Domestic shipments include those bound for export.
Source: U.S. Department of Agriculture, Agricultural Marketing Service, Fl"esh Fruit and Vegetable Shipments, 1986.
co o
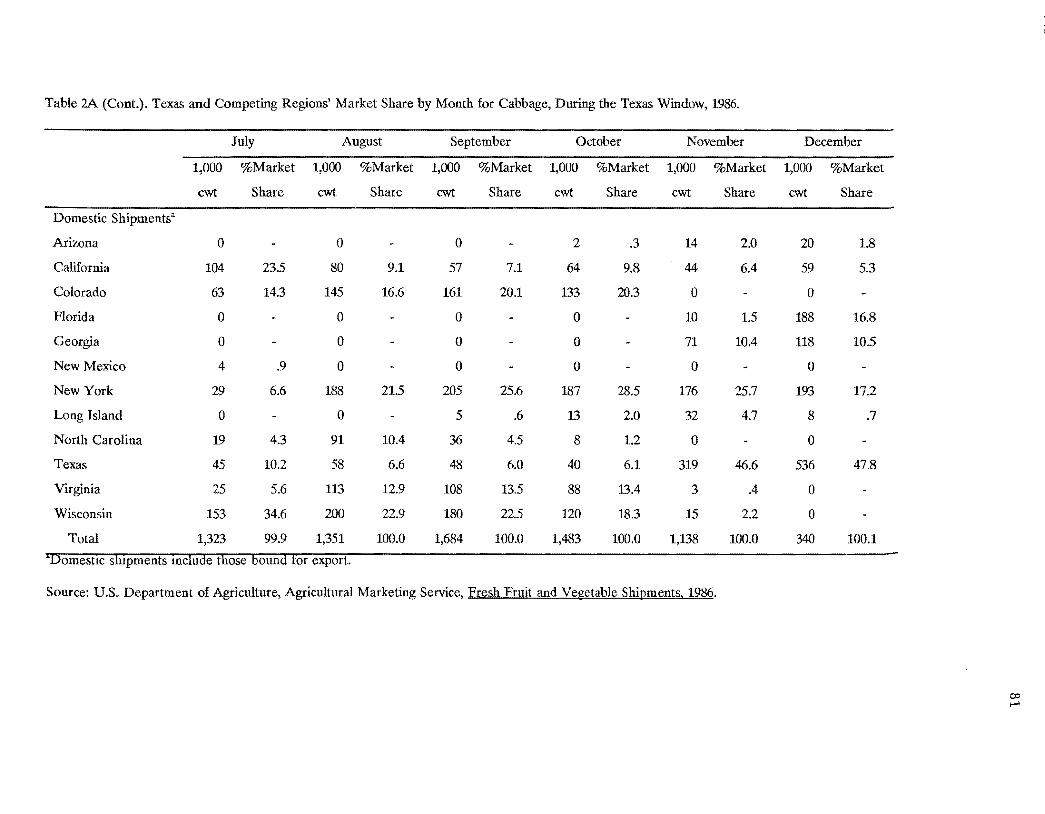
Table 2A (Cont.). Texas and Competing Regions' Market Share by Month for Cabbage, During the Texas Window, 1986.
July August September October November Deeember
1,000 %Market 1,000 %Market 1,000 %Market 1,000 %Market 1,000 %Market 1,000 %Market
ewt Share cwt Share ewt Share cwt Share cwt Share cwt Share
Domestic Shipments'
Arizona a a 0 2 .3 14 2.0 20 1.8
California 104 23.5 80 9.1 57 7.1 64 9.8 44 6.4 59 5.3
Colorado 63 14.3 145 16.6 161 20.1 133 20.3 0 0
Florida 0 0 a 0 10 1.5 188 16.8
Georgia 0 0 0 0 71 10.4 118 10.5
New Mexico 4 .9 0 a 0 a 0
New York 29 6.6 188 21.5 205 25.6 187 28.5 176 25.7 193 17.2
Long Island 0 a 5 .6 13 2.0 32 4.7 8 .7
North Carolina 19 4.3 91 lOA 36 4.5 8 1.2 0 0
Texas 45 10.2 58 6.6 48 6.0 40 6.1 319 46.6 536 47.8
Virginia 25 5.6 113 12.9 108 13.5 88 1304 3 .4 0
Wisconsin 153 34.6 200 22.9 180 22.5 120 18.3 15 2.2 0
Total 1,323 99.9 1,351 100.0 1,684 100.0 1,483 100.0 1,138 100.0 340 100.1
"Domestic shipments mclude those bound for export.
Source: U.S. Department of Agriculture, Agricultural Marketing Service, Fresh Fruit andSe~tabl~ Shipments. 1986.
r-' 00
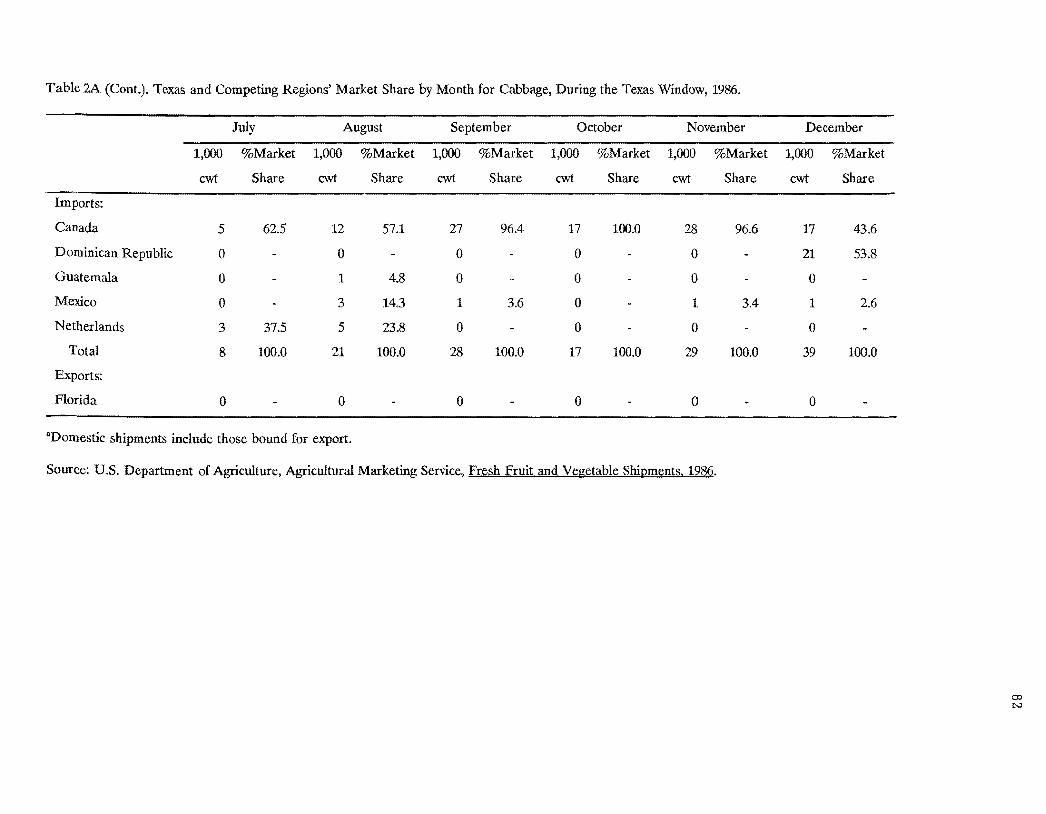
Table 2A (Cont.). Texas and Competing Regions' Market Share by Month for Cabbage, During the Texas Window, 1986.
July August September October November December
1,000 %Market 1,000 %Market 1,000 %Market 1,000 %Market 1,000 %Market 1,000 %Market
cwt Share cwt Share cwt Share cwt Share cwt Share cwt Share
Imports:
Canada 5 62.5 12 57.1 27 96.4 17 100.0 28 96.6 17 43.6
Dominican Republic 0 0 0 0 0 21 53.8
Guatemala 0 1 4.8 0 0 0 0
Mexico 0 3 14.3 1 3.6 0 1 3.4 1 2.6
Netherlands 3 37.5 5 23.8 0 0 0 0
Total 8 100.0 21 100.0 28 100.0 17 100.0 29 100.0 39 100.0
Exports:
Florida 0 0 0 0 0 0
8Domestic shipments include those bound for export.
Source: U.S. Department of Agriculture, Agricultural Marketing Service, Eresh Fruit~d-"Yegetable Shipments. 1986.
co N
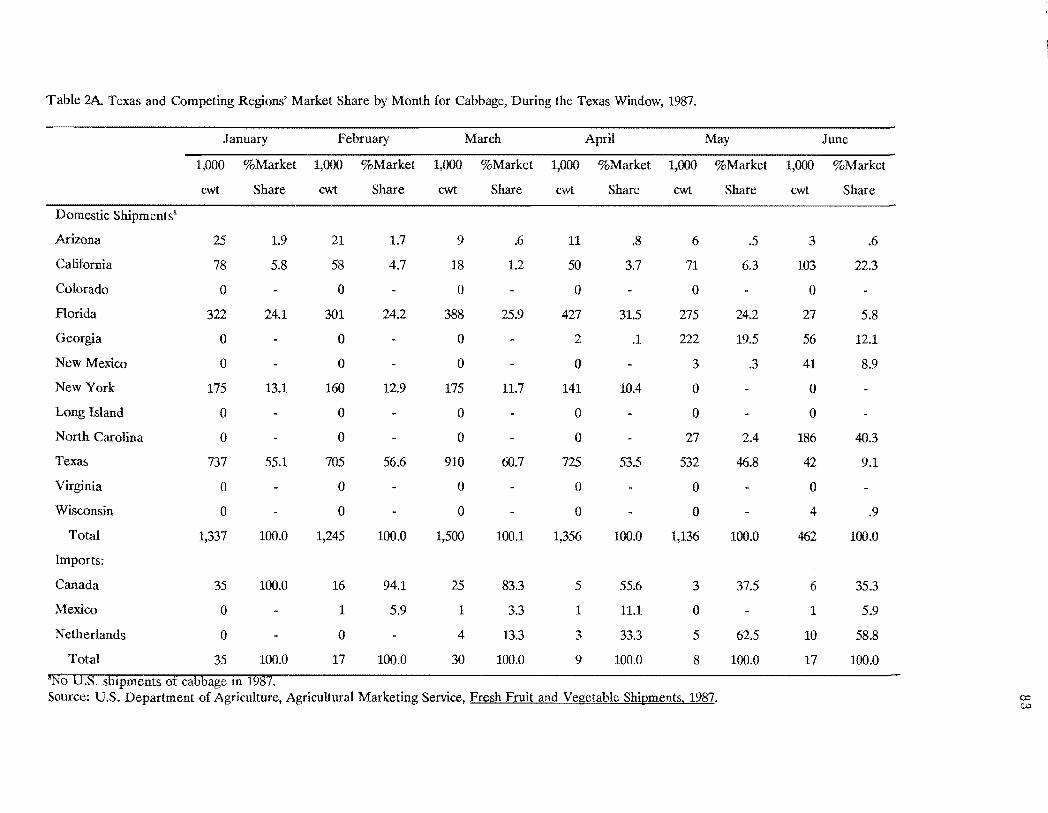
Table 2A. Texas and Competing Regions' Market Share by Month for Cabbage, During the Texas Window, 1987.
January February March April May June
1,000 %Market 1,000 %Market 1,000 %Market 1,000 %Market 1,000 %Market 1,000 %Market
cwt Share cwt Share cwt Share cwt Share cwt Share cwt Share
Domestic Shipmentsa
Arizona 25 1.9 21 1.7 9 .6 11 .8 6 .5 3 .6
California 78 5.8 58 4.7 18 1.2 50 3.7 71 6.3 103 22.3
Colorado 0 0 0 0 0 0
Florida 322 24.1 301 24.2 388 25.9 427 31.5 275 24.2 27 5.8
Georgia 0 0 0 2 .1 222 19.5 56 12.1
New Mexico 0 0 0 0 3 .3 41 8.9
New York 175 13.1 160 12.9 175 11.7 141 lOA 0 0
Long Island 0 0 0 0 0 0
North Carolina 0 0 0 0 27 204 186 40.3
Texas 737 55.1 705 56.6 910 60.7 725 53.5 532 46.8 42 9.1
Virginia 0 0 0 0 0 0
Wisconsin 0 0 0 0 0 4 .9
Total 1,337 100.0 1,245 100.0 1,500 100.1 1,356 100.0 1,136 100.0 462 100.0
Imports:
Canada 35 100.0 16 94.1 25 83.3 5 55.6 3 37.5 6 35.3
Mexico 0 1 5.9 1 3.3 1 11.1 0 1 5.9
Netherlands 0 0 4 13.3 3 33.3 5 62.5 10 58.8
Total 35 100.0 17 100.0 30 100.0 9 100.0 8 100.0 17 100.0
"No U.S. shIpments of cabbage In 1987. Source: U.S. Department of Agriculture, Agricultural Marketing Service, Fresh Fruit and Vegetable Shipments, 1987.

Table 2A (Cont). Texas and Competing Regions' Market Share by Month for Cabbage, During the Texas Wmdow, 1987.
July August September October November December
1,000 %Market 1,000 %Market 1,000 %Market 1,000 %Market 1,000 %Market 1,000 %Market
cwt Share cwt Share cwt Share cwt Share cwt Share cwt Share
Domestic Shipmentsa
Arizona 0 0 0 2 .3 6 .8 6 .5
California 105 22.3 95 11.2 85 10.5 76 11.2 67 8.6 103 9.1
Colorado 61 13.0 163 19.2 194 24.0 212 31.3 17 2.2 0
Florida 0 0 0 0 10 1.3 130 11.5
Georgia 0 0 0 4 .6 152 19.4 129 11.5
New Mexico 0 0 0 0 1 .1 0
New York 51 10.8 199 23.4 186 23.0 236 34.8 199 25.4 208 18.5
Long Island 0 0 7 .9 12 1.8 10 1.3 0
North Carolina 65 13.8 63 7.4 13 1.6 0 0 0
Texas 12 2.5 57 6.7 70 8.7 64 9.4 320 40.9 547 48.6
Virginia 0 101 11.9 117 14.5 31 4.6 0 0
Wisconsin 177 37.6 173 20.3 136 16.8 41 6.0 0 0
Total 471 100.0 851 100.1 808 100.0 678 100.0 782 100.0 1,126 99.7
Imports:
Canada 13 72.2 21 100.0 17 100.0 74 100.0 33 100.0 20 100.0
Mexico 0 0 0 0 0 0
Netherlands 5 27.8 0 0 0 0 0
Total 18 100.0 21 100.0 17 100.0 74 100.0 33 100.0 20 100.0
aNo U.S. exports of cabbage 1n 1987. Source: U.S. Department of Agriculture, Agricultural Marketing Service, Fresh Fruit and Vegetable Shipments, 1987. co
.."
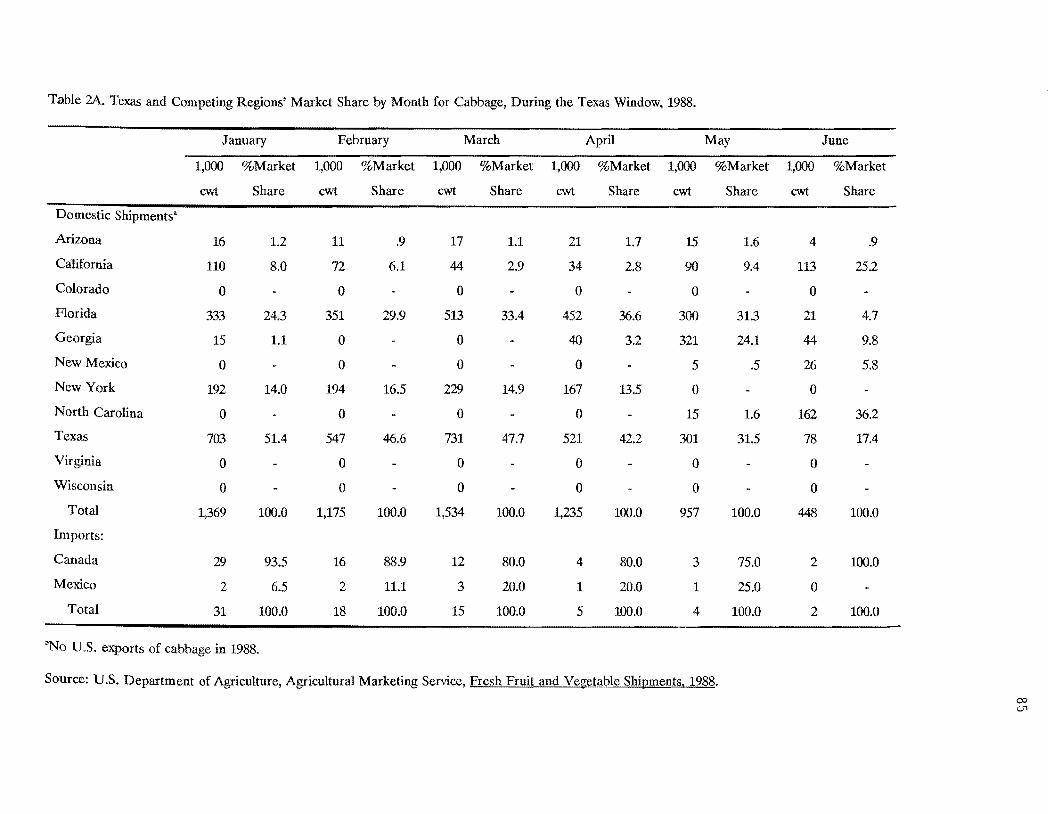
Table 2A. Texas and Competing Regions' Market Share by Month for Cabbage, During the Texas Window, 1988.
January February March April May June
1,000 %Market 1,000 %Market 1,000 %Market 1,000 %Market 1,000 %Market 1,000 %Market
cwt Share cwt Share ewt Share cwt Share cwt Share cwt Share
Domestic Shipments'
Arizona 16 1.2 11 .9 17 1.1 21 1.7 15 1.6 4 .9
California 110 8.0 72 6.1 44 2.9 34 2.8 90 9.4 113 25.2
Colorado 0 0 0 0 0 0
Florida 333 24.3 351 29.9 513 33.4 452 36.6 300 31.3 21 4.7
Georgia 15 1.1 0 0 40 3.2 321 24.1 44 9.8
New Mexico 0 0 0 0 5 .5 26 5.8
New York 192 14.0 194 16.5 229 14.9 167 13.5 0 0
North Carolina 0 0 0 0 15 1.6 162 36.2
Texas 703 51.4 547 46.6 731 47.7 521 42.2 301 31.5 78 17.4
Virginia 0 0 0 0 0 0
Wisconsin 0 0 0 0 0 0
Total 1,369 100.0 1,175 100.0 1,534 100.0 1,235 100.0 957 100.0 448 100.0
Imports:
Canada 29 93.5 16 88.9 12 80.0 4 80.0 3 75.0 2 100.0
Mexico 2 6.5 2 11.1 3 20.0 1 20.0 1 25.0 0
Total 31 100.0 18 100.0 15 100.0 5 100.0 4 100.0 2 100.0
aNo U.S. exports of cabbage in 1988.
Source: U.S. Department of Agriculture, Agricultural Marketing Service, Fresh Fruit and Vegetable Shipments, 1988. 0:> (J1
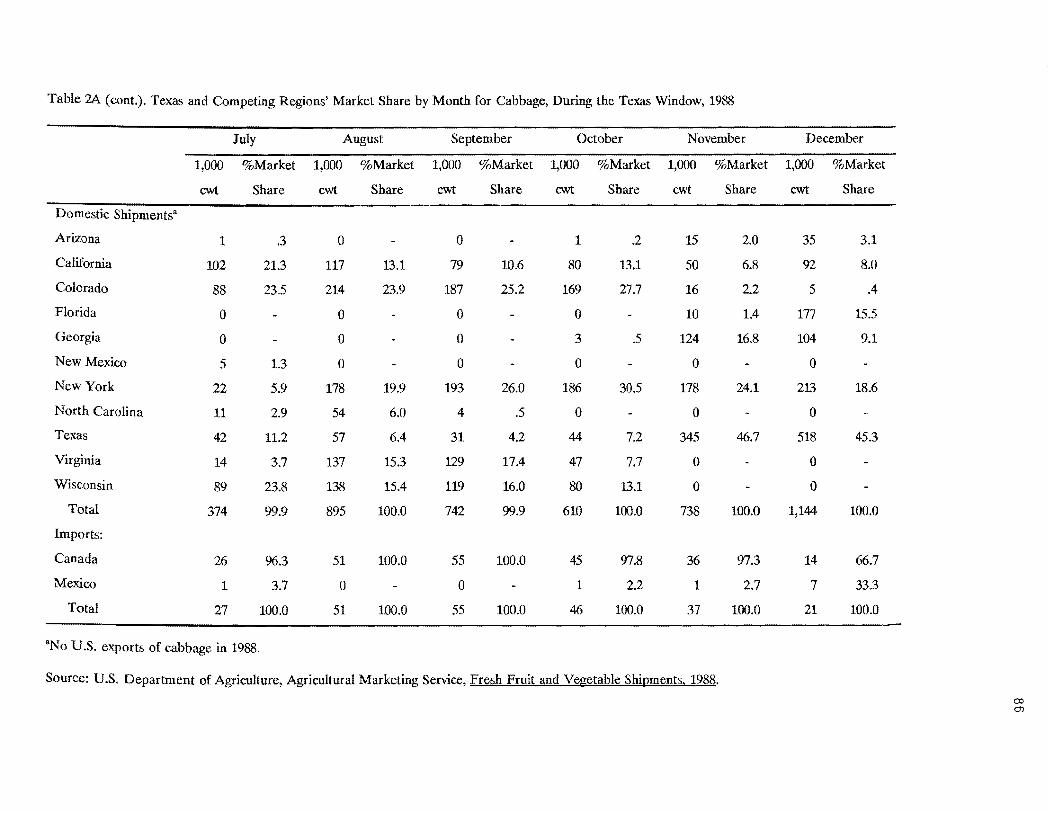
Table 2A (cont.). Texas and Competing Regions' Market Share by Month for Cabbage, During the Texas Window, 1988
July August September October November December
1,000 %Market 1,000 %Market 1,000 %Market 1,000 %Market 1,000 %Market 1,000 %Market
cwt Share cwt Share cwt Share cwt Share cwt Share cwt Share
Domestic Shipmentsa
Arizona 1 .3 0 0 1 .2 15 2.0 35 3.1
California 102 21.3 117 13.1 79 10.6 80 13.1 50 6.8 92 8.0
Colorado 88 23.5 214 23.9 187 25.2 169 27.7 16 2.2 5 .4
Florida 0 0 0 0 10 1.4 177 15.5
Georgia 0 0 0 3 .5 124 16.8 104 9.1
New Mexico 5 1.3 0 0 0 0 0
New York 22 5.9 178 19.9 193 26.0 186 30.5 178 24.1 213 18.6
North Carolina 11 2.9 54 6.0 4 .5 0 0 0
Texas 42 11.2 57 6.4 31 4.2 44 7.2 345 46.7 518 45.3
Virginia 14 3.7 137 15.3 129 17.4 47 7.7 0 0
Wisconsin 89 23.8 138 15.4 119 16.0 80 13.1 0 0
Total 374 99.9 895 100.0 742 99.9 610 100.0 738 100.0 1,144 100.0
Imports:
Canada 26 96.3 51 100.0 55 100.0 45 97.8 36 97.3 14 66.7
Mexico 1 3.7 0 0 1 2.2 1 2.7 7 33.3
Total 27 100.0 51 100.0 55 100.0 46 100.0 37 100.0 21 100.0
aNo U.S. exports of cabbage in 1988.
Source: U.S. Department of Agriculture, Agricultural Marketing Service, Fresh Fruit and Vegetable Shipments, 1988.
O'l 00
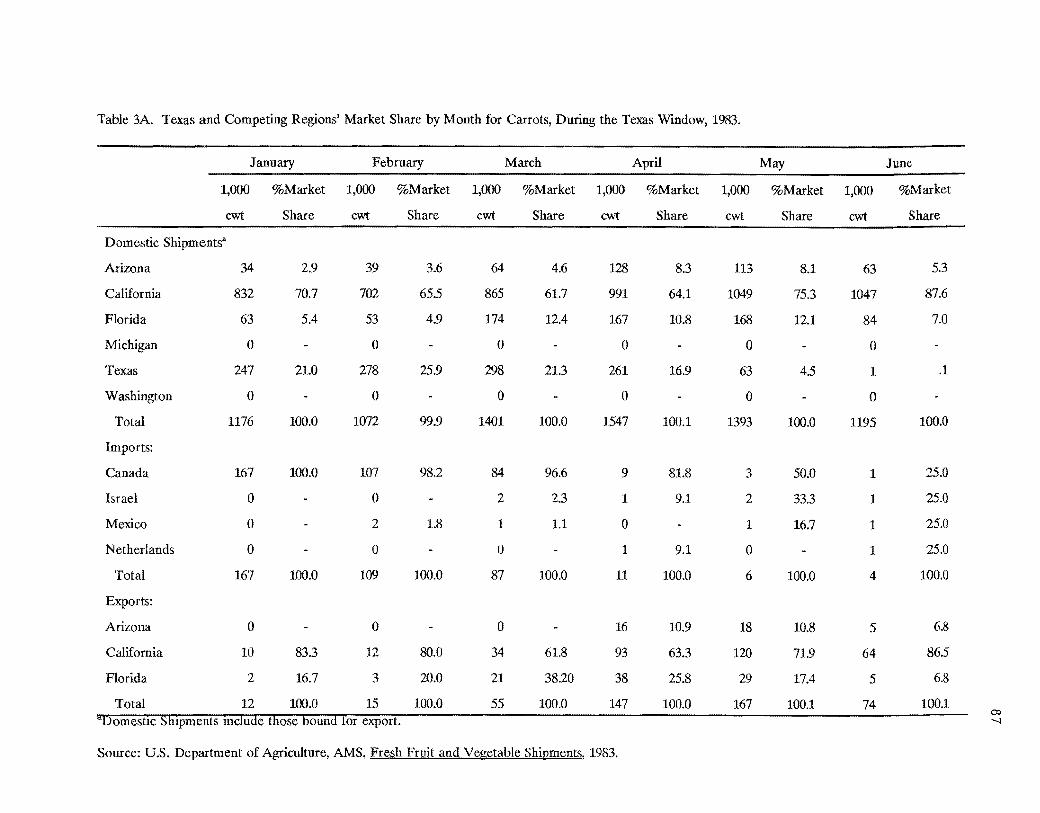
Table 3A Texas and Competing Regions' Market Share by Month for Carrots, During the Texas Window, 1983.
January February March April May June
1,000 %Market 1,000 %Market 1,000 %Market 1,000 %Market 1,000 %Market 1,000 %Market
cwt Share cwt Share cwt Share cwt Share cwt Share cwt Share
Domestic Shipments·
Arizona 34 2.9 39 3.6 64 4.6 128 8.3 113 8.1 63 5.3
California 832 70.7 702 65.5 865 61.7 991 64.1 1049 75.3 1047 87.6
Florida 63 5.4 53 4.9 174 12.4 167 10.8 168 12.1 84 7.0
Michigan 0 0 0 0 0 0
Texas 247 21.0 278 25.9 298 21.3 261 16.9 63 4.5 1 .1
Washington 0 0 0 0 0 0
Total 1176 100.0 1072 99.9 1401 100.0 1547 100.1 1393 100.0 1195 100.0
Imports:
Canada 167 100.0 107 98.2 84 96.6 9 81.8 3 50.0 1 25.0
Israel 0 0 2 2.3 1 9.1 2 33.3 1 25.0
Mexico 0 2 1.8 1 1.1 0 1 16.7 25.0
Netherlands 0 0 0 1 9.1 0 1 25.0
Total 167 100.0 109 100.0 87 100.0 11 100.0 6 100.0 4 100.0
Exports:
Arizona 0 0 0 16 10.9 18 10.8 5 6.8
California 10 83.3 12 SO.O 34 61.8 93 63.3 120 71.9 64 86.5
Florida 2 16.7 3 20.0 21 38.20 38 25.8 29 17.4 5 6.8
Total 12 100.0 15 100.0 55 100.0 147 100.0 167 100.1 74 100.1 co
aDomestIc ShIpments mclude those bound for export. --.;f
Source: U.S. Department of Agriculture, AMS, Fresh Fruit and Vegetable Shipments, 1983.

Table 3A (Cont). Texas and Competing Region's Market Share by Month for Carrots, During the Texas Window, 1983.
July November December
1,000 %Market 1,000 %Market 1,000 %Market
cwt Share cwt Share cwt Share
Domestic Shipmentsa
Arizona 9 1.1 1 .1 13 1.4
California 782 98.1 532 78.8 796 85.7
Florida 1 .1 11 1,4 47 5.1
Michigan
Texas
0
5 .6
141
16
17.6
2.0
0
73 7.9
Washington
Total
0
797 99.9
1
802
.1
100.0
0
929 100.1
Imports:
Canada
Israel
0
2 50.0
216
1
90.8
,4
220
0
92.1
Mexico 1 25.0 20 8,4 18 7.5
Netherlands 1 25.0 1 ,4 1 .4
Total 4 100.0 238 100.0 239 100.0
Exports:
Arizona 0 0 0
California 0 0 3 100.0
Florida 0 0 0
Total 0 0 3 100.0
'Domestic Shipments include those bound for export. co co
Note: The months of August, September and October Texas is not in the carrot market. Source: U.S. Department of Agriculture, AMS, Fresh Fruit and Vegetable Shipments, 1983.
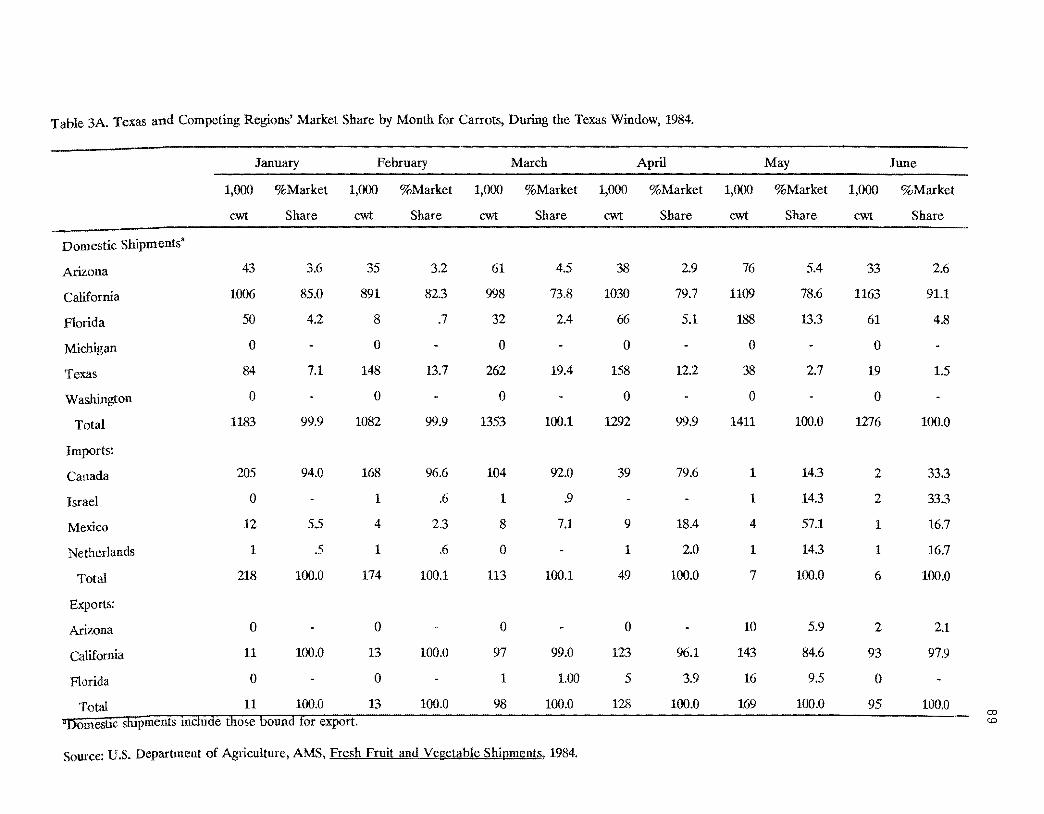
Table 3A. Texas and Competing Regions' Market Share by Month for Carrots, During the Texas Window, 1984.
January February March April May June
1,000 %Market 1,000 %Market 1,000 %Market 1,000 %Market 1,000 %Market 1,000 %Market
cwt Share cwt Share cwt Share cwt Share cwt Share cwt Share
Domestic Shipmentsa
Arizona 43 3.6 35 3.2 61 4.5 38 2.9 76 5.4 33 2.6
California 1006 85.0 891 82.3 998 73.8 1030 79.7 1109 78.6 1163 91.1
Florida 50 4.2 8 .7 32 2.4 66 5.1 188 13.3 61 4.8
Michigan 0 0 0 0 0 0
Texas 84 7.1 148 13.7 262 19.4 158 12.2 38 2.7 19 1.5
Washington a 0 ° 0 a 0
Total 1183 99.9 1082 99.9 1353 100.1 1292 99.9 1411 100.0 1276 100.0
Imports:
Canada 205 94.0 168 96.6 104 92.0 39 79.6 1 14.3 2 33.3
Israel 0 1 .6 1 .9 1 14.3 2 33.3
Mexico 12 5.5 4 2.3 8 7.1 9 18.4 4 57.1 1 16.7
Netherlands 1 .5 1 .6 0 1 2.0 1 14.3 1 16.7
Total 218 100.0 174 100.1 113 100.1 49 100.0 7 100.0 6 100.0
Exports:
Ari7.0na 0 0 a 0 10 5.9 2 2.1
California 11 100.0 13 100.0 97 99.0 123 96.1 143 84.6 93 97.9
Florida 0 ° 1 1.00 5 3.9 16 9.5 0
Total 11 100.0 13 100.0 98 100.0 128 100.0 169 100.0 95 100.0 co
"Domestlc shlpments mclude those bound for export. co
Source: U.S. Department of Agriculture, AMS, Fresh Fruit and Vegetable Shipments, 1984.
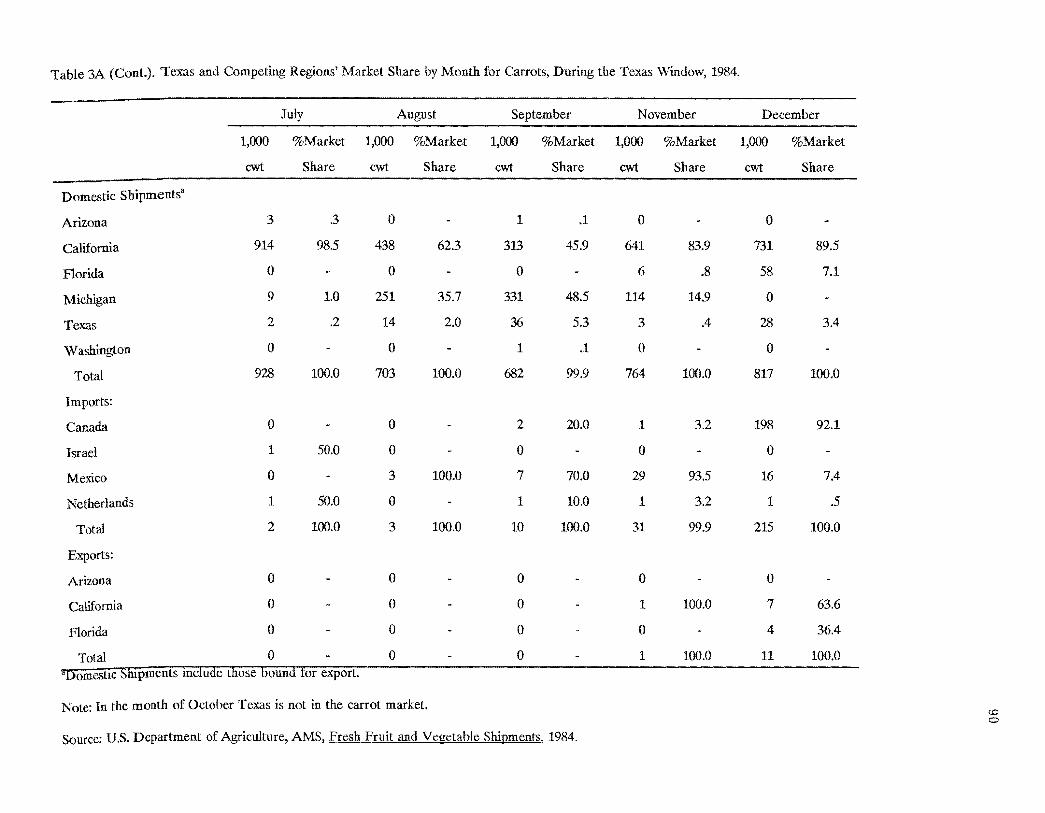
Table 3A (Cont.). Texas and Competing Regions' Market Share by Month for Carrots, During the Texas Window, 1984.
July August September November December
1,000 %Market 1,000 %Market 1,000 %Market 1,000 %Market 1,000 %Market
cwt Share cwt Share cwt Share cwt Share cwt Share
Domestic Shipments'
Arizona 3 .3 0 1 .1 0 0
California 914 98.5 438 62.3 313 45.9 641 83.9 731 89.5
Florida 0 0 0 6 .8 58 7.1
Michigan 9 1.0 251 35.7 331 48.5 114 14.9 0
Texas 2 .2 14 2.0 36 5.3 3 .4 28 3.4
Washington 0 0 1 .1 0 0
Total 928 100.0 703 100.0 682 99.9 764 100.0 817 100.0
Imports:
Canada 0 0 2 20.0 1 3.2 198 92.1
Israel 1 50.0 0 0 0 0
Mexico 0 3 100.0 7 70.0 29 93.5 16 7.4
Netherlands 1 50.0 0 1 10.0 1 3.2 1 .5
Total 2 100.0 3 100.0 10 100.0 31 99.9 215 100.0
Exports:
Arizona 0 0 0 0 0
California 0 0 0 1 100.0 7 63.6
Florida 0 0 0 0 4 36.4
Total 0 0 0 1 100.0 11 100.0 "DomestIc Shipments mclude those bound for export.
Note: In the month of October Texas is not in the carrot market. co
Source: U.S. Department of Agriculture, AMS, Fresh Fruit and VegetabJe Shipments, 1984. 0

Table 3A. Texas and Competing Regions' Market Share by Month for Carrots, During the Texas Window, 1985.
January February March April May June
1,000 %Market 1,000 %Market 1,000 %Market 1,000 %Market 1,000 %Market 1,000 %Market
cwt Share cwt Share cwt Share cwt Share cwt Share cwt Share
Domestic Shipments'
Arizona 13 l.0 23 2.2 72 6.1 81 6.6 102 8.1 65 6.1
California 1060 84.9 838 81.0 948 80.3 943 76.7 1030 81.7 946 88.4
Florida 123 9.8 91 8.8 81 6.9 119 9.7 98 7.8 42 3.9
Michigan 0 0 0 0 0 0
Texas 53 4.2 82 7.9 79 6.7 86 7.0 31 2.5 17 1.6
Total 1249 99.9 1034 99.9 1180 100.0 1229 100.0 1261 100.1 1070 100.0
Imports:
Belgium 2 1.6 1 .7 1 1.0 3 5.8 1 4.3 1 8.3
Canada 105 85.4 143 93.4 86 88.7 41 78.8 17 73.9 9 75.0
Israel 1 .8 0 1 1.0 1 1.9 1 4.3 1 8.3
Mexico 13 10.6 8 5.2 8 8.2 7 13.5 3 13.0 1 8.3
Netherlands 2 1.6 1 .7 1 1.0 0 1 4.3 0
Total 123 100.0 153 100.0 97 99.9 52 100.0 23 99.8 12 99.9
Exports:
Arizona 0 0 3 5.8 8 4.5 9 5.3 0
California 6 66.7 12 70.6 40 76.9 157 89.2 157 91.8 35 89.7
Florida 3 33.3 5 29.4 9 17.3 11 6.3 5 2.9 4 10.3
Total 9 100.0 "Domestlc shipments mlcude those bound for export.
17 100.0 52 100.0 176 100.0 171 100.0 39 100.0 (0
f-'
Source: U.S. Department of Agriculture, AMS, Fresh Fruit and Vegetable Shipments, 1985.
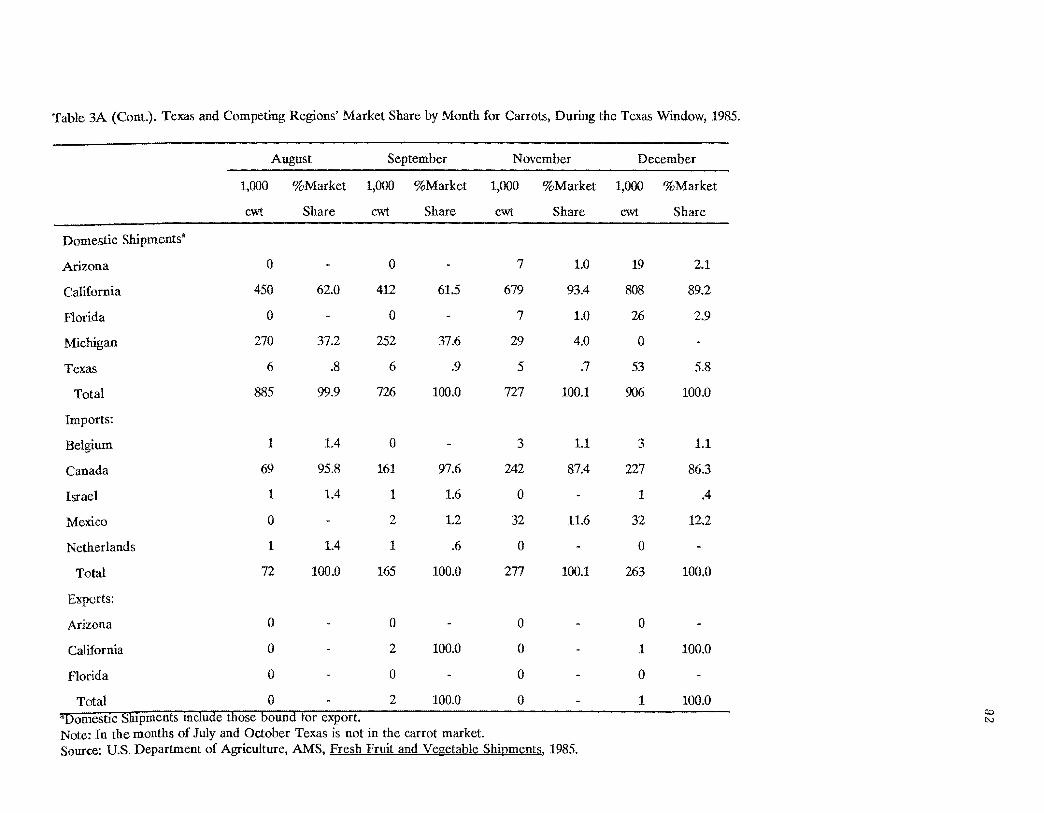
Table 3A (Cont.). Texas and Competing Regions' Market Share by Month for Carrots, During the Texas Window, 1985.
August September November December
1,000 %Market 1,000 %Market 1,000 %Market 1,000 %Market
cwt Share cwt Share cwt Share cwt Share
Domestic Shipments·
Arizona 0 0 7 1.0 19 2.1
California 450 62.0 412 61.5 679 93.4 808 89.2
Florida 0 0 7 1.0 26 2.9
Michigan 270 37.2 252 37.6 29 4.0 0
Texas 6 .8 6 .9 5 .7 53 5.8
Total 885 99.9 726 100.0 727 100.1 906 100.0
Imports:
Belgium 1 1.4 0 3 1.1 3 1.1
Canada 69 95.8 161 97.6 242 87.4 227 86.3
Israel 1 1.4 1 1.6 0 1 .4
Mexico 0 2 1.2 32 11.6 32 12.2
Netherlands 1 1.4 1 .6 0 0
Total 72 100.0 165 100.0 277 100.1 263 100.0
Exports:
Arizona 0 0 0 0
California 0 2 100.0 0 1 100.0
Florida 0 0 0 0
Total 0 2 100.0 0 1 100.0 co"Domestic ShIpments mclude those bound for export. N
Note: In the months of July and October Texas is not in the carrot market. Source: U.S. Department of Agriculture, AMS, Fresh Fruit and Vegetable Shipments, 1985.
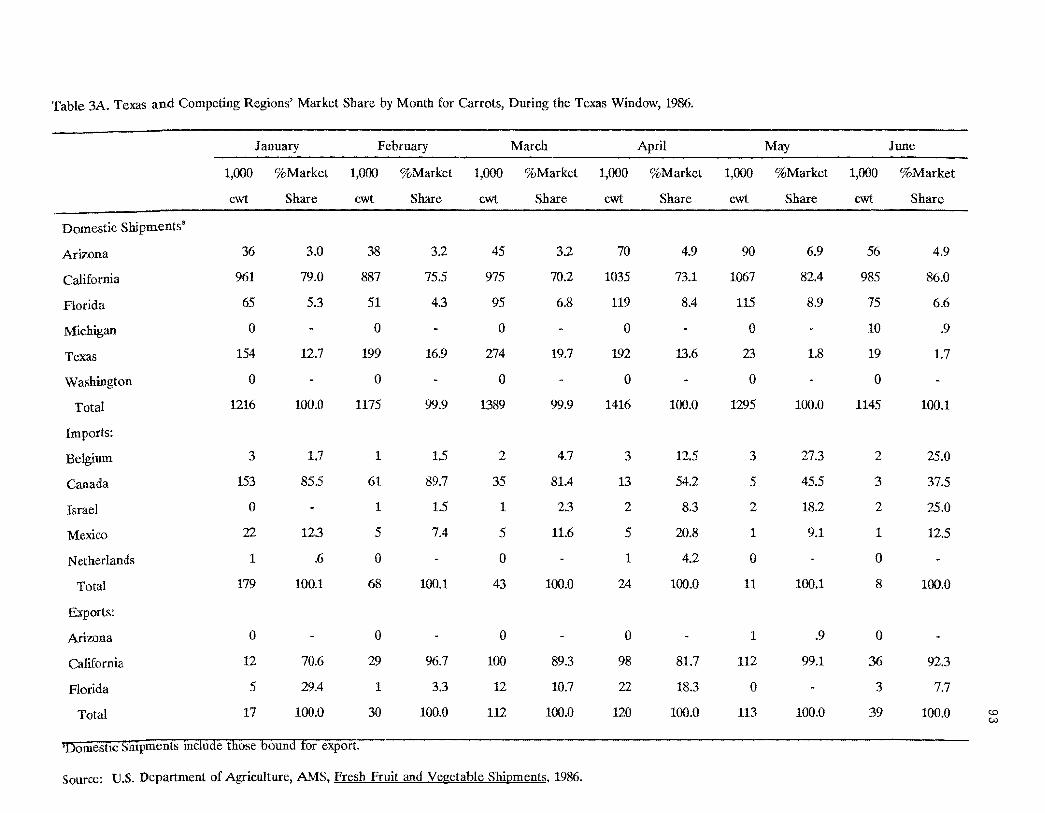
Table 3A. Texas and Competing Regions' Market Share by Month for Carrots, During the Texas Window, 1986.
January February March April May June
1,000 %Market 1,000 %Markct 1,000 %Market 1,000 %Market 1,000 %Market 1,000 %Market
cwt Share cwt Share cwt Share cwt Share cwt Share cwt Share
Domestic Shipmentsa
Arizona 36 3.0 38 3.2 45 3.2 70 4.9 90 6.9 56 4.9
California 961 79.0 887 75.5 975 70.2 1035 73.1 1067 82.4 985 86.0
Florida 65 5.3 51 4.3 95 6.8 119 8.4 115 8.9 75 6.6
Michigan 0 0 0 0 0 10 .9
Texas 154 12.7 199 16.9 274 19.7 192 13.6 23 1.8 19 1.7
Washington 0 0 0 0 0 0
Total 1216 100.0 1175 99.9 1.'389 99.9 1416 100.0 1295 100.0 1145 100.1
Imports:
Belgium 3 1.7 1 1.5 2 4.7 3 12.5 3 27.3 2 25.0
Canada 153 85.5 61 89.7 35 81.4 13 54.2 5 45.5 3 37.5
Israel 0 1 1.5 1 2.3 2 8.3 2 18.2 2 25.0
Mexico 22 12.3 5 7.4 5 11.6 5 20.8 1 9.1 1 12.5
Netherlands 1 .6 0 0 1 4.2 0 0
Total 179 100.1 68 100.1 43 100.0 24 100.0 11 100.1 8 100.0
Exports:
Arizona 0 0 0 0 1 .9 0
California 12 70.6 29 96.7 100 89.3 98 81.7 112 99.1 36 92.3
Florida 5 29.4 1 3.3 12 10.7 22 18.3 0 3 7.7
Total 17 100.0 30 100.0 112 100.0 120 100.0 113 100.0 39 100.0 c.o c.o
'Domestlc Shipments include those bound for export.
Source: U.S. Department of Agriculture, AMS, Fresh Fruit and Vegetable Shipments, 1986.
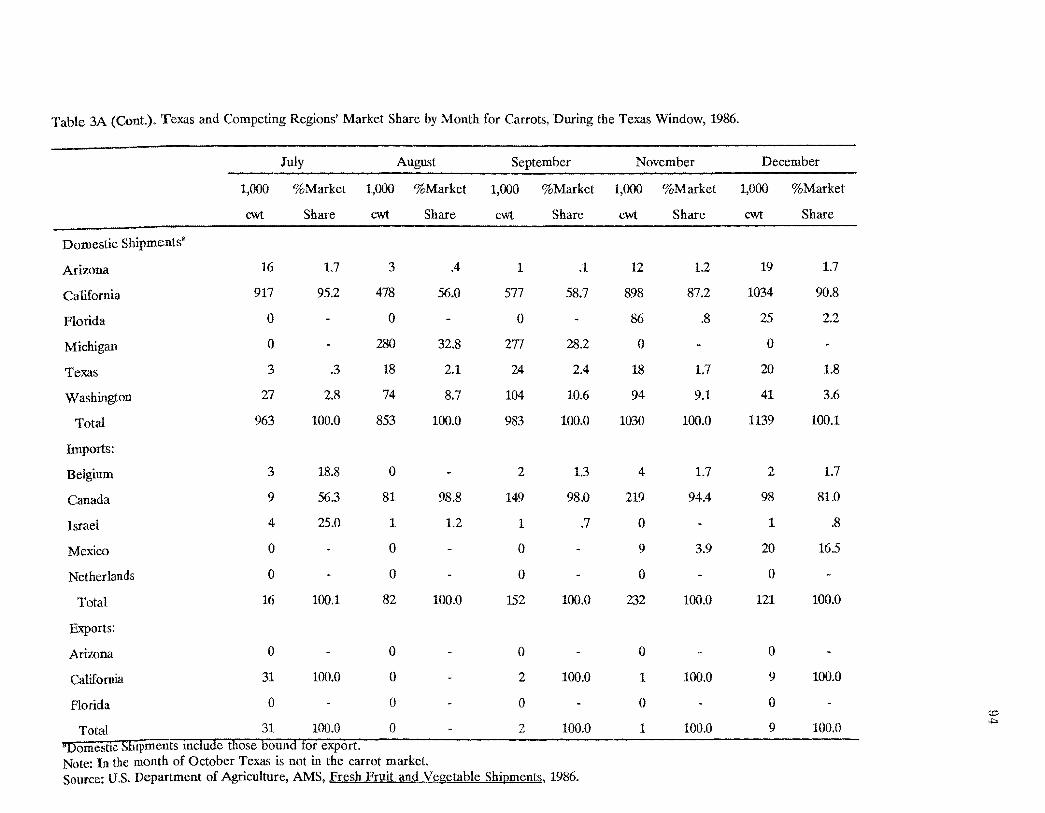
Table 3A (Cont.). Texas and Competing Regions' Market Share by Month for Carrots, During the Texas Window, 1986.
July August September November December
1,000 %Market 1,000 %Market 1,000 %Market 1,000 %Market 1,000 %Market
cwt Share cwt Share cwt Share cwt Share cwt Share
Domestic Shipments'
Arizona 16 1.7 3 .4 1 .1 12 1.2 19 1.7
California 917 95.2 478 56.0 577 58.7 898 87.2 1034 90.8
Florida 0 0 0 86 .8 25 2.2
Michigan 0 280 32.8 277 28.2 0 0
Texas 3 .3 18 2.1 24 2.4 18 1.7 20 1.8
Washington 27 2.8 74 8.7 104 10.6 94 9.1 41 3.6
Total 963 100.0 853 100.0 983 100.0 1030 100.0 1139 100.1
Imports:
Belgium 3 18.8 0 2 1.3 4 1.7 2 1.7
Canada 9 56.3 81 98.8 149 98.0 219 94.4 98 81.0
Israel 4 25.0 1 1.2 1 .7 0 1 .8
Mexico 0 0 0 9 3.9 20 16.5
Netherlands 0 0 0 0 0
Total 16 100.1 82 100.0 152 100.0 232 100.0 121 100.0
Exports:
Arizona 0 0 0 0 0
California 31 100.0 0 2 100.0 1 100.0 9 100.0
Florida 0 0 0 0 0 co
Total 31 100.0 0 2 100.0 1 100.0 9 100.0 *" "Domestic ShIpments mclude those bound for export. Note: In the month of October Texas is not in the carrot market. Source: U.S. Department of Agriculture, AMS, Fresh Fruit and Vegetable Shipments, 1986.
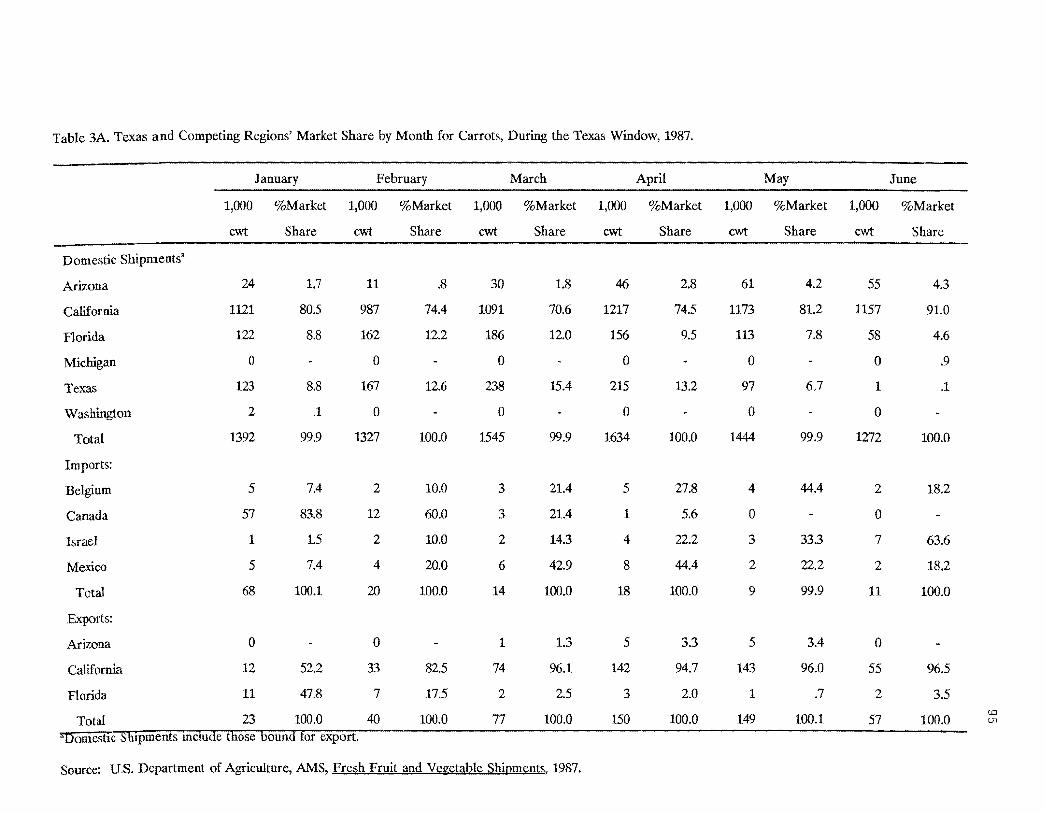
Table 3A. Texas and Competing Regions' Market Share by Month for Carrots, During the Texas Window, 1987.
January February Mareh April May June
1,000 %Market 1,000 %Market 1,000 %Market 1,000 %Market 1,000 %Market 1,000 %Market
cwt Share cwt Share cwt Share cwt Share cwt Share cwt Share
Domestic Shipments'
Arizona 24 1.7 11 .8 30 1.8 46 2.8 61 4.2 55 4.3
California 1121 80.5 987 74.4 1091 70.6 1217 74.5 1173 81.2 1157 91.0
Florida 122 8.8 162 12.2 186 12.0 156 9.5 113 7.8 58 4.6
Michigan 0 ° 0 ° ° 0 .9
Texas 123 8.8 167 12.6 238 15.4 215 13.2 97 6.7 1 .1
Washington 2 .1 ° 0 ° ° 0
Total 1392 99.9 1327 100.0 1545 99.9 1634 100.0 1444 99.9 1272 100.0
Imports:
Belgium 5 7.4 2 10.0 3 21.4 5 27.8 4 44.4 2 18.2
Canada 57 83.8 12 60.0 3 21.4 1 5.6 0 0
Israel 1 1.5 2 10.0 2 14.3 4 22.2 3 33.3 7 63.6
Mexico 5 7.4 4 20.0 6 42.9 8 44.4 2 22.2 2 18.2
Total 68 100.1 20 100.0 14 100.0 18 100.0 9 99.9 11 100.0
Exports:
Arizona 0 0 1 1.3 5 3.3 5 3.4 0
California 12 52.2 33 82.5 74 96.1 142 94.7 143 96.0 55 %.5
Florida 11 47.8 7 17.5 2 2.5 3 2.0 1 .7 2 3.5
Total 23 100.0 40 100.0 77 100.0 150 100.0 149 100.1 57 100.0 (0
VI
"Domestic ShIpments mclude those bound for export.
Source: U.S. Department of Agriculture, AMS, Fresh Fruit and Vegetable Shipments, 1987.
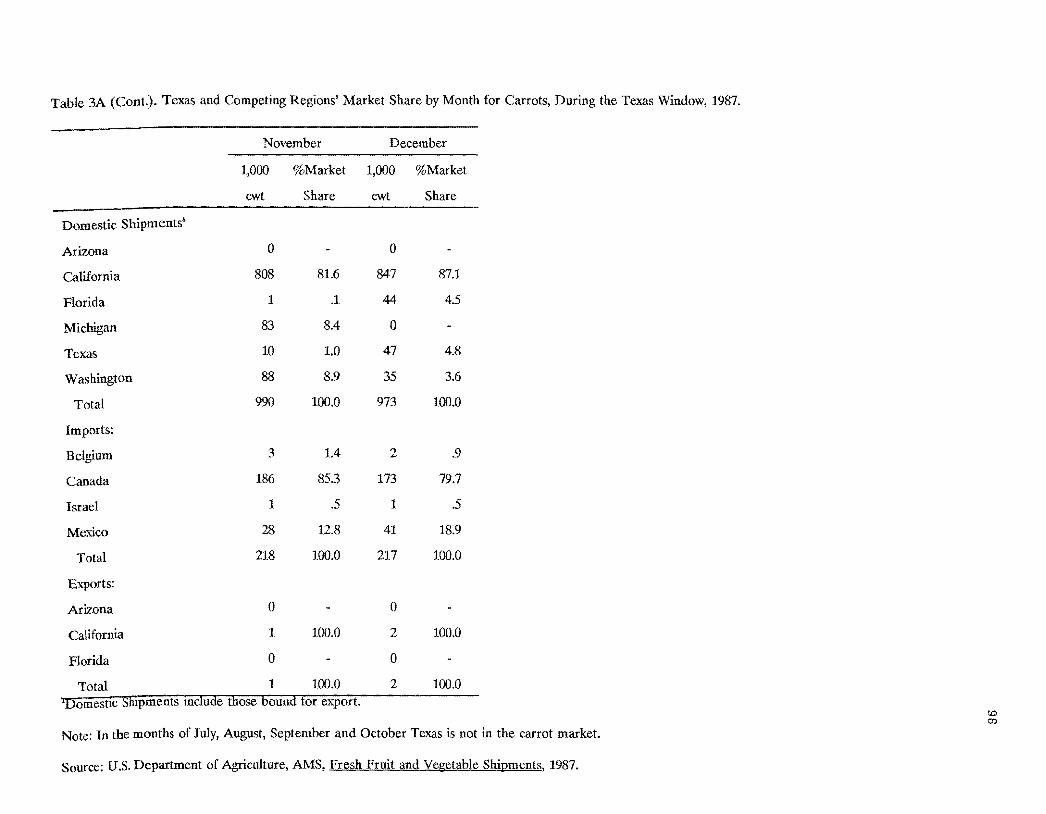
Table 3A (Cont.). Texas and Competing Regions' Market Share by Month for Carrots, During the Texas Window, 1987.
November December
1,000 %Market 1,000 %Market
cwt Share cwt Share
Domestic Shipments'
Arizona 0 0
California 808 81.6 847 87.1
1 .1 44 4.5Florida
Michigan 83 8.4 0
Texas 10 1.0 47 4.8
Washington 88 8.9 35 3.6
Total 990 100.0 973 100.0
Imports:
Belgium 3 1.4 2 .9
Canada 186 853 173 79.7
Israel 1 .5 1 .5
Mexico 28 12.8 41 18.9
Total 218 100.0 217 100.0
Exports:
Arizona 0 0
California 1 100.0 2 100.0
0 0
Total 1 100.0 2 100.0 "Domestic Shipments mdude those bound lor export.
Florida
co CT.)
Note: In the months of JuJy, August, September and October Texas is not in the carrot market.
Source: U.S. Department of Agriculture, AMS, Fresh Fruit and Vegetable Shipments, 1987.
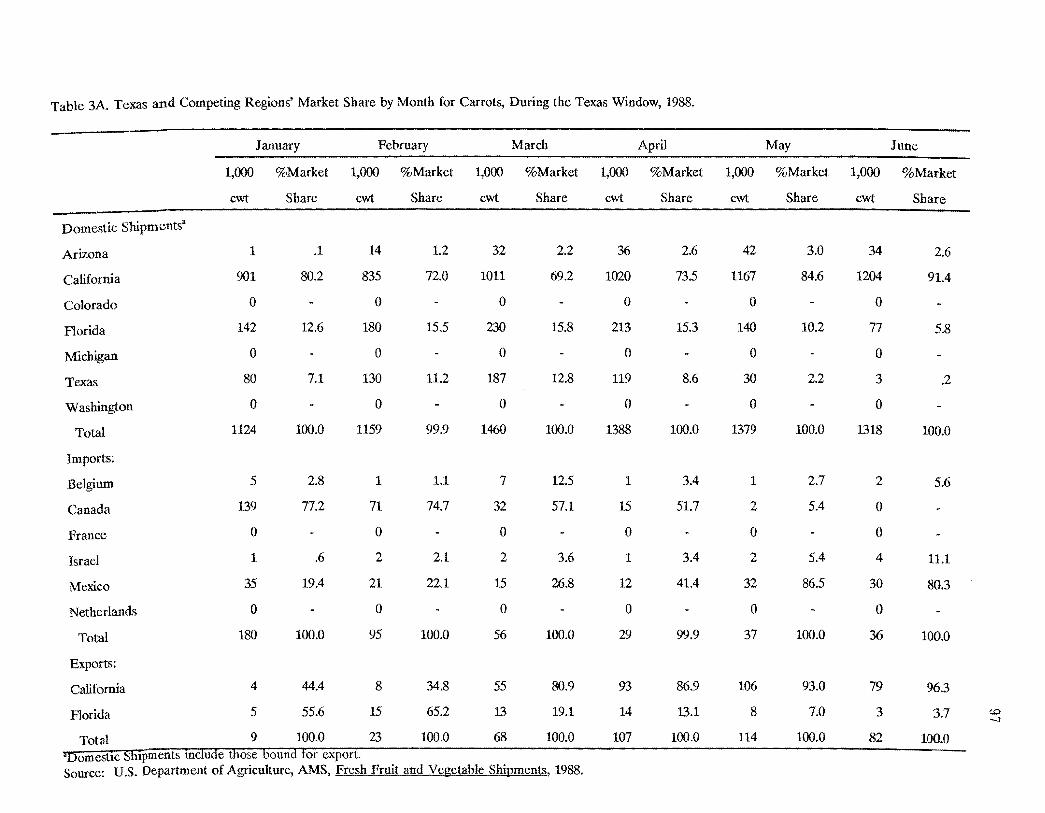
Table 3A. Texas and Competing Regions' Market Share by Month for Carrols, During the Texas Window, 1988.
January February March April May June
1,000 %Market 1,000 %Market 1,000 %Market 1,000 %Market 1,000 %Market 1,000 %Market
cwt Share cwt Share cwt Share cwt Share cwt Share cwt Share
Domestic Shipmentsa
Arizona 1 .1 14 1.2 32 2.2 36 2.6 42 3.0 34 2.6
California 901 80.2 835 72.0 1011 69.2 1020 73.5 1167 84.6 1204 91.4
Colorado ° ° ° 0 ° ° Florida 142 12.6 180 15.5 230 15.8 213 15.3 140 10.2 77 5.8
Michigan ° 0 ° ° 0 0
Texas 80 7.1 130 11.2 187 12.8 119 8.6 30 2.2 3 .2
Washington 0 0 0 0 0 0
Total 1124 100.0 1159 99.9 1460 100.0 1388 100.0 1379 100.0 1318 100.0
Imports:
Belgium 5 2.8 1 1.1 7 12.5 1 3.4 1 2.7 2 5.6
Canada 139 77.2 71 74.7 32 57.1 15 51.7 2 5.4 ° France 0 0 0 ° 0 0
Israel 1 .6 2 2.1 2 3.6 1 3.4 2 5.4 4 11.1
Mexico 35 19.4 21 22.1 15 26.8 12 41.4 32 86.5 30 80.3
Netherlands 0 0 0 0 0 0
Total 180 100.0 95 100.0 56 100.0 29 99.9 37 100.0 36 100.0
Exports:
California 4 44.4 8 34.8 55 80.9 93 86.9 106 93.0 79 96.3
Florida 5 55.6 15 65.2 13 19.1 14 13.1 8 7.0 3 3.7 c.o -...J
Total 9 100.0 23 100.0 68 100.0 107 100.0 114 100.0 82 100.0 'Domestic ShIpments mclude those bound tor export. Source: U.S. Department of Agriculture, AMS, Fresh Fruit and Vegetable Shipments, 1988.

Table 3A (Cont.). Texas and Competing Regions' Market Share by Month for Carrots, During the Texas Window, 1988.
November December
1,000 %Market 1,000 %Market
CM Share CM Share
Domestic Shipments'
Arizona 0 1 .1
California 1019 84.4 1185 91.2
Colorado 0 0
Florida .22 42 3.2
Michigan 119 9.9 0
Texas 2 .2 67 5.2
Washington 66 5.5 4 .3
Total 1208 100.2 1299 100.0
Imports:
Belgium 4 2.1 3 2.9
Canada 162 84.8 67 65.0
France 0 0
Israel 2 1.0 3 2.9
Mexico 23 12.0 30 29.1
Netherlands 0 0
Total 191 99.9 103 99.9
Exports:
California 2 100.0 4 100.0
Florida 0 0
Total 2 100.0 4 100.0 co co
HDomestlc ShIpments mclude those bound for export. Note: In the months of July, August, September and October Texas is not in the carrot market. Source: U.S. Department of Agriculture, AMS, Fresh Fruit and Vegetable Shipments, 1988.

Table 4A. Texas and Competing Regions' Market Share by Month for Celery, During the Texas Window, 1983.
January February March April May December
1,000 %Market 1,000 %Market 1,000 %Market 1,000 %Market 1,000 %Market 1,000 %Market
cwt Share cwt Share cwt Share cwt Share cwt Share cwt Share
Domestic Shipments·
California
Florida
Texas
Total
1118
315
88
1521
73.5
20.7
5.8
100.0
1015
307
84
1406
72.2
21.8
6.0
100.0
968
455
112
1535
63.1
29.6
7.3
100.0
525
484
13
1022
51.4
47.3
1.3
100.0
750
567
13
1330
56.4
42.6
1.0
100.0
1022
326
49
1397
73.2
23.3
3.5
100.0
Exports:
California
Florida
Texas
Total
32
6
a 38
84.2
15.8
a 100.0
38
11
4
53
71.7
20.8
7.5
100.0
23
13
1
37
62.2
35.1
2.7
100.0
3
4
a 7
42.9
57.1
0
100.0
13
23
a 36
36.1
63.9
0
100.0
1
0
0
1
100.0
0
a 100.0
"Domestic shipments include those bound for export.
Source: U.S. Department of Agriculture, Agricltural Marketing Service, Fresh Fruit and Vegetable Shipments. 1983.
co co
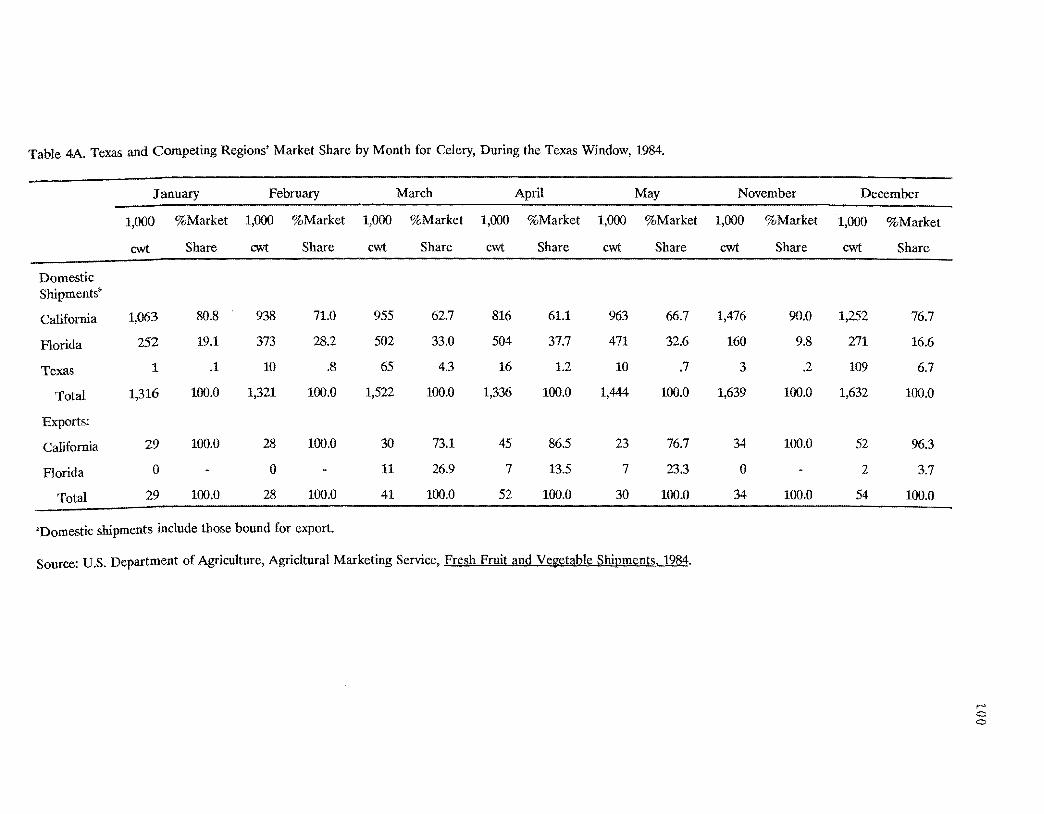
Table 4A. Texas and Competing Regions' Market Share by Month for Celery, During the Texas Window, 1984.
January February March April May November December
1,000 %Market 1,000 %Market 1,000 %Market 1,000 %Market 1,000 %Market 1,000 %Market 1,000 %Market
cwt Share cwt Share cwt Share cwt Share cwt Share cwt Share cwt Share
Domestic Shipmentsa
California
Florida
Texas
Total
1,063
252
1
1,316
80.8
19.1
.1
100.0
938
373
10
1,321
71.0
28.2
.8
100.0
955
502
65
1,522
62.7
33.0
4.3
100.0
816
504
16
1,336
61.1
37.7
1.2
100.0
963
471
10
1,444
66.7
32.6
.7
100.0
1,476
160
3
1,639
90.0
9.8
.2
100.0
1,252
271
109
1,632
76.7
16.6
6.7
100.0
Exports;
California
Florida
Total
29
0
29
100.0
100.0
28
0
28
100.0
100.0
30
11
41
73.1
26.9
100.0
45
7
52
86.5
13.5
100.0
23
7
30
76.7
23.3
100.0
34
0
34
100.0
100.0
52
2
54
96.3
3.7
100.0
'Domestic shipments include those bound for export.
Source: U.S. Department of Agriculture, Agricltural Marketing Service, Fresh Fruit and Vegetable Shipments. 1984.
I-' o o
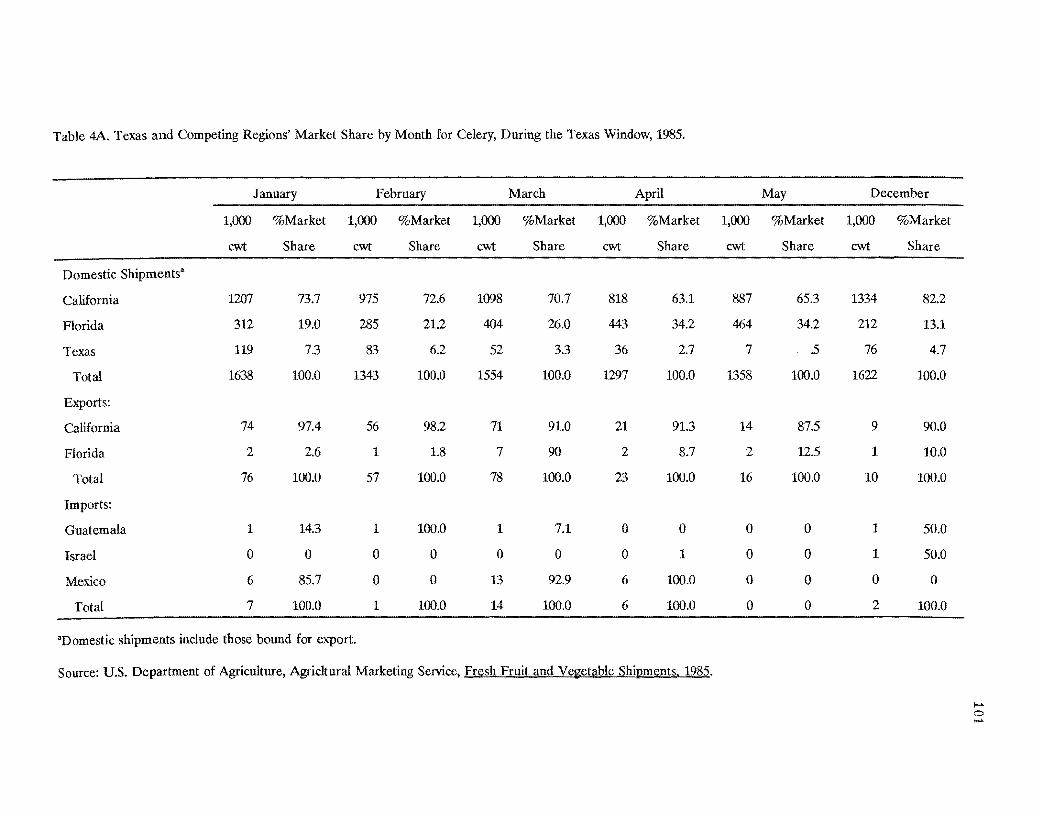
Table 4A. Texas and Competing Regions' Market Share by Month for Celery, During the Texas Window, 1985.
January February March April May December
1,000 %Market 1,000 %Market 1,000 %Market 1,000 %Market 1,000 %Market 1,000 %Market
cwt Share cwt Share cwt Share cwt Share cwt Share cwt Share
Domestic Shipments'
California 1207 73.7 975 72.6 1098 70.7 818 63.1 887 65.3 1334 82.2
Florida 312 19.0 285 21.2 404 26.0 443 34.2 464 34.2 212 13.1
Texas 119 7.3 83 6.2 52 3.3 36 2.7 7 .5 76 4.7
Total 1638 100.0 1343 100.0 1554 100.0 1297 100.0 1358 100.0 1622 100.0
Exports:
California 74 97.4 56 98.2 71 91.0 21 91.3 14 87.5 9 90.0
Florida 2 2.6 1 1.8 7 90 2 8.7 2 12.5 1 10.0
Total 76 100.0 57 100.0 78 100.0 23 100.0 16 100.0 10 100.0
Imports:
Guatemala 1 14.3 1 100.0 1 7.1 ° 0 0 0 1 50.0
Israel 0 0 0 0 0 0 0 1 0 0 1 50.0
Mexico 6 85.7 0 0 13 92.9 6 100.0 0 0 0 0
Total 7 100.0 1 100.0 14 100.0 6 100.0 0 0 2 100.0
"Domestic shipments include those bound for export.
Source: u.s. Department of Agriculture, Agridtural Marketing Service, F~esh F]'uit and_Vegetable Shiomcnts. 1985.
f-' 0 f-'
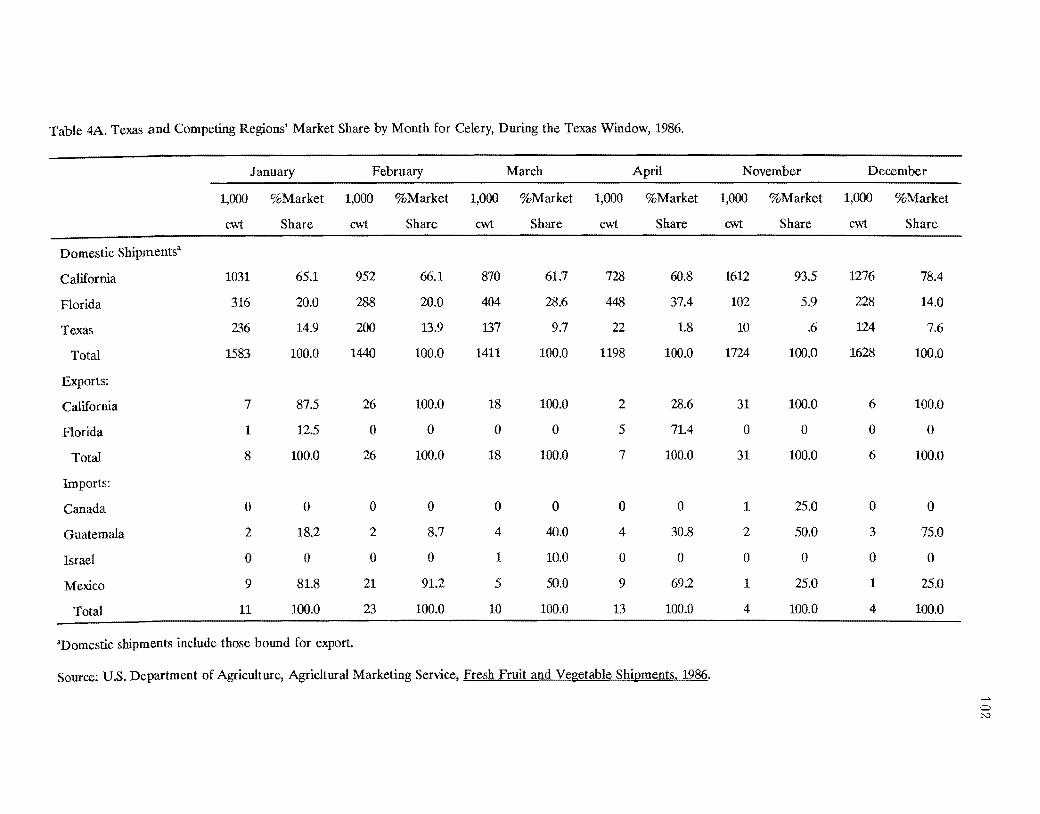
Table 4A. Texas and Competing Regions' Market Share by Month for Celery, During the Texas Window, 1986.
January February March April November December
1,000
cwt
%Market
Share
1,000
cwt
%Market
Share
1,000
cwt
%Market
Share
1,000
cwt
%Market
Share
1,000
cwt
%Market
Share
1,000
cwt
%Market
Share
Domestic Shipments'
California
Florida
Texas
Total
Exports:
California
Florida
Total
Imports:
Canada
Guatemala
Israel
Mexico
Total
1031
316
236
1583
7
1
8
0
2
0
9
11
65.1
20.0
14.9
100.0
87.5
12.5
100.0
0
18.2
0
81.8
100.0
952
288
200
1440
26
0
26
0
2
0
21
23
66.1
20.0
13.9
100.0
100.0
0
100.0
0
8.7
0
91.2
100.0
870
404
137
1411
18
0
18
0
4
1
5
10
61.7
28.6
9.7
100.0
100.0
0
100.0
0
40.0
10.0
SO.O
100.0
72B
448
22
1198
2
5
7
0
4
0
9
13
60.8
37.4
1.8
100.0
2B.6
71.4
100.0
0
30.8
0
69.2
100.0
1612
102
10
1724
31
0
31
1
2
0
1
4
93.5
5.9
.6
100.0
100.0
0
100.0
25.0
50.0
0
25.0
100.0
1276
228
124
1628
6
0
6
0
3
0
1
4
78.4
14.0
7.6
100.0
100.0
0
100.0
0
75.0
0
25.0
100.0
'Domestic shipments include those bound for export.
Source: U.S. Department of Agriculture, Agridtural Marketing Service, Fresh Fruit and Vegetable Shipments. 1986.
f-' a I:,,;)

Table 4A. Texas and Competing Regions' Market Share by Month for Celery, During the Texas Window, 1987.
January February March April May November December
1,000 %Market 1,000 %Market 1,000 % Market 1,000 %Market 1,000 %Market 1,000 %Market 1,000 %Market
cwt Share cwt Share cwt Share cwt Share cwt Share cwt Share cwt Share
Domestic Shipmentsa
California 845 59.9 835 61.4 863 61.5 1019 69.3 856 62.4 1740 95.6 1054 69.7
Florida 265 18.8 348 25.6 389 27.7 399 27.1 504 36.8 79 4.3 267 17.7
Texas 301 21.3 177 13.0 152 10.8 53 3.6 11 .8 1 .1 191 12.6
Total 1411 100.0 1360 100.0 1404 100.0 1471 100.0 1371 100.0 1820 100.0 1512 100.0
Exports:
California 7 100.0 2 67.7 20 95.2 44 100.0 9 52.9 2 100.0 0 0
Florida a 0 1 33.3 1 4.8 a 0 8 47.1 0 a 0 a Total 7 100.0 3 100.0 21 100.0 44 100.0 17 100.0 2 100.0 a 0
Imports:
Canada 0 0 a 0 0 a 0 0 0 0 1 11.1 0 0
Guatemala 4 12.1 7 19.4 4 11.8 3 60.0 4 57.1 4 44.4 8 80.0
Mexico 29 87.9 29 80.6 30 88.2 2 40.0 3 42.9 4 44.4 2 20.0
Total 33 100.0 36 100.0 34 100.0 5 100.0 7 100.0 9 99.9 10 100.0
"Domestic shipments include those bound for export.
Source: U.S. Department of Agriculture, Agricltural Marketing Service, Fresh Fruit and Vegetable Shipments. 1987. ...., c..J 0
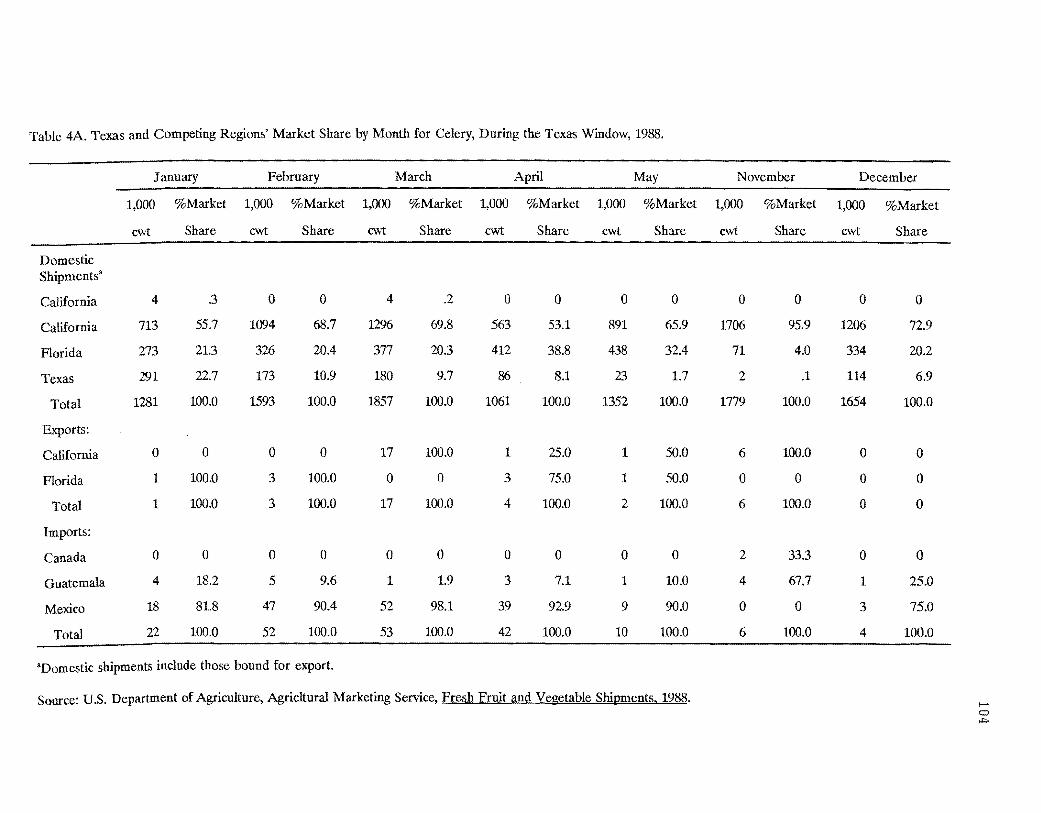
Table 4A. Texas and Competing Regions' Market Share by Month for Celery, During the Texas Window, 1988.
January February March April May November December
1,000 %Market 1,000 %Market 1,000 %Market 1,000 %Market 1,000 %Market 1,000 %Market 1,000 %Market
cwt Share cwt Share cwt Share cwt Share cwt Share cwt Share cwt Share
Domestic Shipments·
California 4 .3 0 0 4 .2 0 0 0 0 0 0 0 0
California 713 55.7 1094 68.7 1296 69.8 563 53.1 891 65.9 1706 95.9 1206 72.9
Florida 273 21.3 326 20.4 377 20.3 412 38.8 438 32.4 71 4.0 334 20.2
Texas 291 22.7 173 10.9 180 9.7 86 8.1 23 1.7 2 .1 114 6.9
Total 1281 100.0 1593 100.0 1857 100.0 1061 100.0 1352 100.0 1779 100.0 1654 100.0
Exports:
California 0 0 0 0 17 100.0 1 25.0 1 50.0 6 100.0 0 0
Florida 1 100.0 3 100.0 0 0 3 75.0 1 50.0 0 0 0 0
Total 1 100.0 3 100.0 17 100.0 4 100.0 2 100.0 6 100.0 0 0
Imports:
Canada 0 0 0 0 0 0 0 0 0 0 2 33.3 0 0
Guatemala 4 18.2 5 9.6 1 1.9 3 7.1 1 10.0 4 67.7 1 25.0
Mexico 18 81.8 47 90.4 52 98.1 39 92.9 9 90.0 0 0 3 75.0
Total 22 100.0 52 100.0 53 100.0 42 100.0 10 100.0 6 100.0 4 100.0
aDomestic shipments include those bound for export.
Source: U.S. Department of Agriculture, Agric1tural Marketing Service, Fresh Fruit and Vegetable Shipments, 1988. I-'
.+:> CI
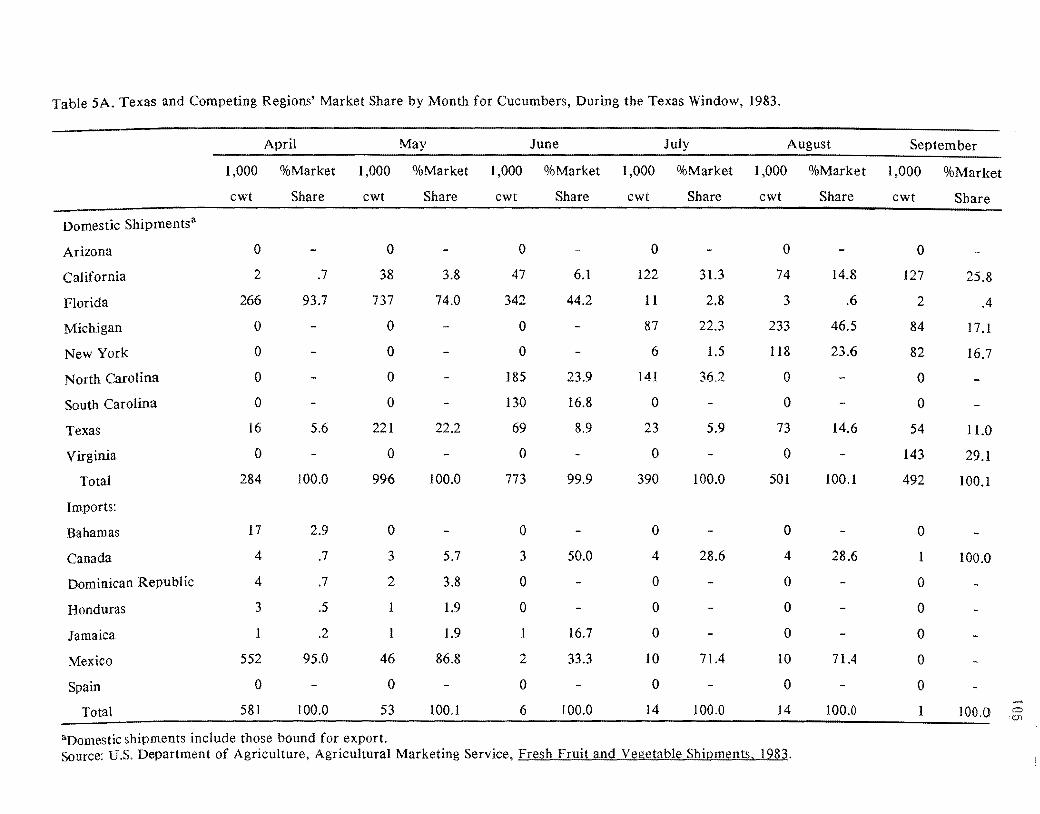
Table 5A. Texas and Competing Regions' Market Share by Month for Cucumbers, During the Texas Window, 1983.
April May June July August September
1,000 %Market 1,000 %Market 1,000 %Market 1,000 %Market 1,000 %Market 1,000 %Market
cwt Share cwt Share cwt Share cwt Share cwt Share cwt Share
Domestic Shipments"
Arizona 0 0 0 0 0 0
California 2 .7 38 3.8 47 6.1 122 31.3 74 14.8 127 25.8
Florida 266 93.7 737 74.0 342 44.2 II 2.8 3 .6 2 .4
Michigan 0 0 0 87 22.3 233 46.5 84 17.1
New York 0 0 0 6 1.5 118 23.6 82 16.7
North Carolina 0 0 185 23.9 141 362 0 0
South Carolina 0 0 130 16.8 0 0 0
Texas 16 5.6 221 22.2 69 8.9 23 5.9 73 14.6 54 11.0
Virginia 0 0 0 0 0 143 29.1
Total 284 100.0 996 100.0 773 99.9 390 100.0 501 100.1 492 100.1
Imports:
Bahamas 17 2.9 0 0 0 0 0
Canada 4 .7 3 5.7 3 50.0 4 28.6 4 28.6 1 100.0
Dominican Republic 4 .7 2 3.8 0 0 0 0
Honduras 3 .5 1.9 0 0 0 0
Jamaica 1 .2 1.9 16.7 0 0 0
Mexico 552 95.0 46 86.8 2 33.3 10 71.4 10 71.4 0
Spain 0 0 0 0 0 0
Total 581 100.0 53 100.1 6 100.0 14 100.0 14 100.0 100.!) I-' <:::)
"Ol
"Domestic shipments include those bound for export. Source: U.S. Department of Agriculture, Agricultural Marketing Service, Fresh Fruit and Vegetable Shipments. 1983.

Table 5A (Cont). Texas and Competing Regions' Market Share by Month for Cucumbers, During the Texas Window, 1983.
October November December
1,000 %Market 1,000 %Market 1,000 %Market
cwt Share cwt Share cwt Share
Domestic Shipments<l
Arizona .2 0 0
California 95 16.4 25 4.1 0
Florida 101 17.4 388 63.6 296 94.6
Michigan 0 0 0
New York 0 0 0
North Carolina 0 0 0
South Carolina 0 0 0
Texas 244 42.1 197 32.3 17 5.4
Virginia 139 24.0 0 0
Total 520 100.1 610 100.0 313 100.0
Imports:
Bahamas 0 0 0
Canada 1 7.1 0 0
Dominican Republic 0 0 0
Honduras 0 0 0
Jamaica 0 0 0
Mexico 13 92.9 391 100.0 652 99.8
Spain 0 0 .2
Total 14 100.0 391 100.0 653 100.0 ...... fiDomestlc shlpments include those bound for export. Cr.l
Note: In the months of January, February, and March, Texas is not in the cucumber market. Source: U.S. Department of Agriculture, Agricultural Marketing Service, Fresh Fruit and Vegetable Shipments. 1983.
0
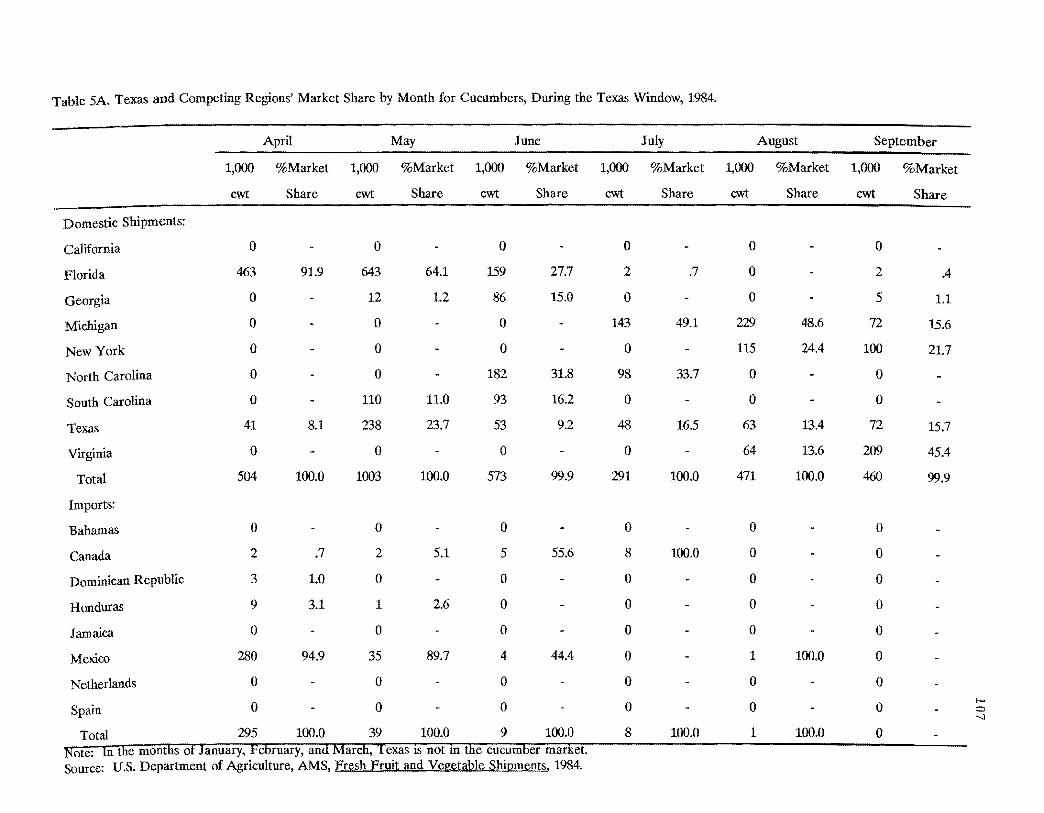
Table 5A. Texas and Competing Regions' Market Share by Month for Cucumbers, During the Texas Window, 1984.
April May June July August September
1,000 %Market 1,000 %Market 1,000 %Market 1,000 %Market 1,000 %Market 1,000 %Market
cwt Share cwt Share cwt Share cwt Share cwt Share cwt Share
Domestic Shipments:
California 0 0 0 0 0 0
Florida 463 91.9 643 64.1 159 27.7 2 .7 0 2 .4
Georgia 0 12 1.2 86 15.0 0 0 5 1.1
Michigan 0 0 0 143 49.1 229 48.6 72 15.6
New York 21.70 0 0 0 115 24.4 100
North Carolina 0 0 182 31.8 98 33.7 0 0
South Carolina 0 110 11.0 93 16.2 0 0 0
Texas 15.741 8.1 238 23.7 53 9.2 48 16.5 63 13.4 72
Virginia 0 0 0 0 64 13.6 209 45.4
504 100.0 1003 100.0 573 99.9 291 100.0 471 100.0 460 99.9Total
Imports:
Bahamas 0 0 0 0 0 0
2 .7 2 5.1 5 55.6 8 100.0 0 0Canada
Dominican Republic 3 1.0 0 0 0 0 0
Honduras 9 3.1 1 2.6 0 0 0 0
Jamaica 0 0 0 0 0 0
Mexico 280 94.9 35 89.7 4 44.4 0 1 100.0 0
Netherlands 0 0 0 0 0 0 I--'
Spain 0 0 0 0 0 0 <::> '-J
295 100.0 39 100.0 9 100.0 8 100.0 1 100.0 0Total Note: In the months of January, February, and March, Texas 15 not ill the cucumber market. Source: U.S. Department of Agriculture, AMS, Fresh Fruit and Vegetable Shipments, 1984.
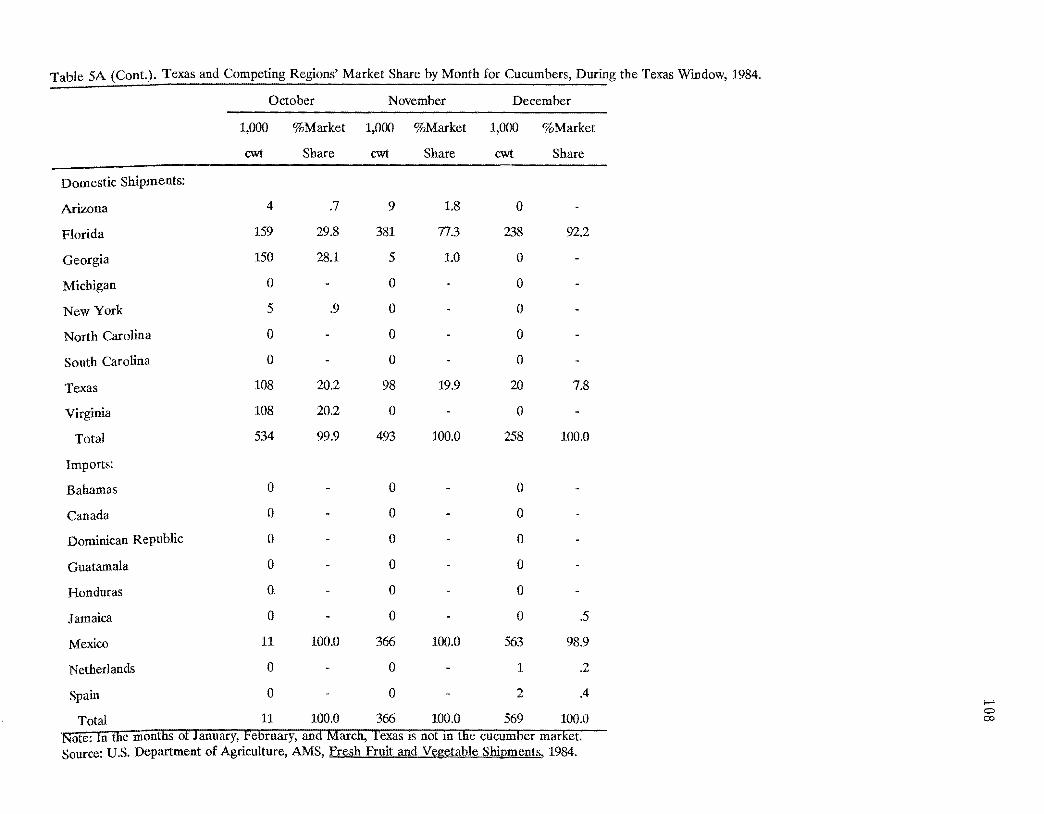
Table 5A (Cont.). Texas and Competing Regions' Market Share by Month for Cucumbers, During the Texas Window, 1984.
October November December
1,000 %Market 1,000 %Market 1,000 %Market
cwt Share cwt Share cwt Share
Domestic Shipments:
Arizona 4 .7 9 1.8 0
Florida 159 29.8 381 77.3 238 92.2
Georgia 150 28.1 5 1.0 0
Michigan 0 0 0
New York 5 .9 0 0
North Carolina 0 0 0
South Carolina 0 0 0
Texas 108 20.2 98 19.9 20 7.8
Virginia 108 20.2 0 0
Total 534 99.9 493 100.0 258 100.0
Imports:
Bahamas 0 0 0
Canada 0 0 0
Dominican Republic 0 0 0
Guatamala 0 0 0
Honduras o. 0 0
Jamaica 0 0 0 .5
Mexico 11 100.0 366 100.0 563 98.9
Netherlands 0 0 1 .2
Spain 0 0 2 .4 ,.... Total 11 100.0 366 100.0 569 100.0
0 00
Note: In the monthS of January, February, and March, Texas IS not m the cucumber market. Source: u.s. Department of Agriculture, AMS, Fresh Fruit and Vegetable Shipments, 1984.
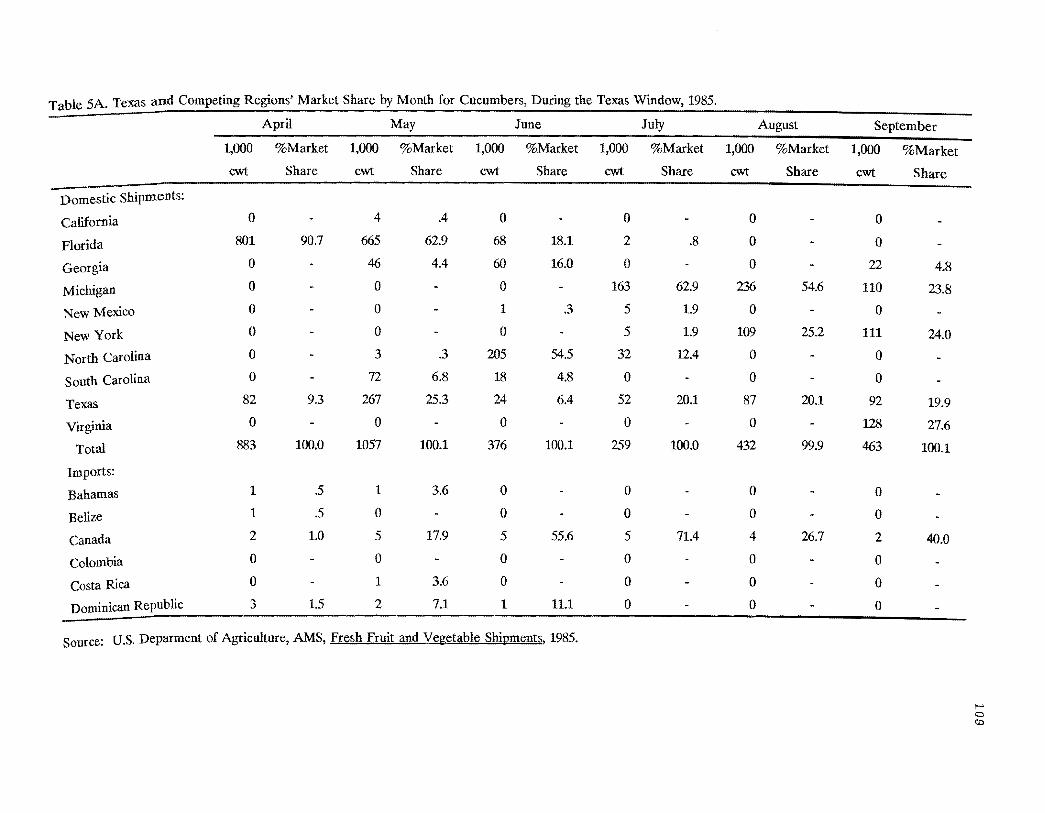
Table 5A. Texas and Competing Regions' Market Share by Month for Cucumbers, During the Texas Window, 1985.
April May June July August September
1,000 %Market 1,000 %Market 1,000 %Market 1,000 %Market 1,000 %Market 1,000 %Market
cwt Share cwt Share cwt Share cwt Share cwt Share cwt Share
-Domestic Shipments:
California 0 4 .4 0 0 0 0
Florida 801 90.7 665 62.9 68 18.1 2 .8 0 0
Georgia 0 46 4.4 60 16.0 0 0 22 4.8
Michigan 0 0 0 163 62.9 236 54.6 110 23.8
New Mexico 0 0 1 .3 5 1.9 0 0
New York 0 0 0 5 1.9 109 25.2 111 24.0
North Carolina 0 3 .3 205 54.5 32 12.4 0 0
South Carolina 0 72 6.8 18 4.8 0 0 0
Texas 82 9.3 267 25.3 24 6.4 52 20.1 87 20.1 92 19.9
Virginia 0 0 0 0 0 128 27.6
Total 883 100.0 1057 100.1 376 100.1 259 100.0 432 99.9 463 100.1
Imports:
Bahamas 1 .5 1 3.6 0 0 0 0
Belize 1 .5 0 0 0 0 0
Canada 2 1.0 5 17.9 5 55.6 5 71.4 4 26.7 2 40.0
Colombia 0 0 0 0 0 0
Costa Rica 0 1 3.6 0 0 0 0
Dominican Republic 3 1.5 2 7.1 1 11.1 0 0 0
Source: U.S. Deparment of Agriculture, AMS, Fresh Fruit and Vegetable Shipments, 1985.
,.....
co c
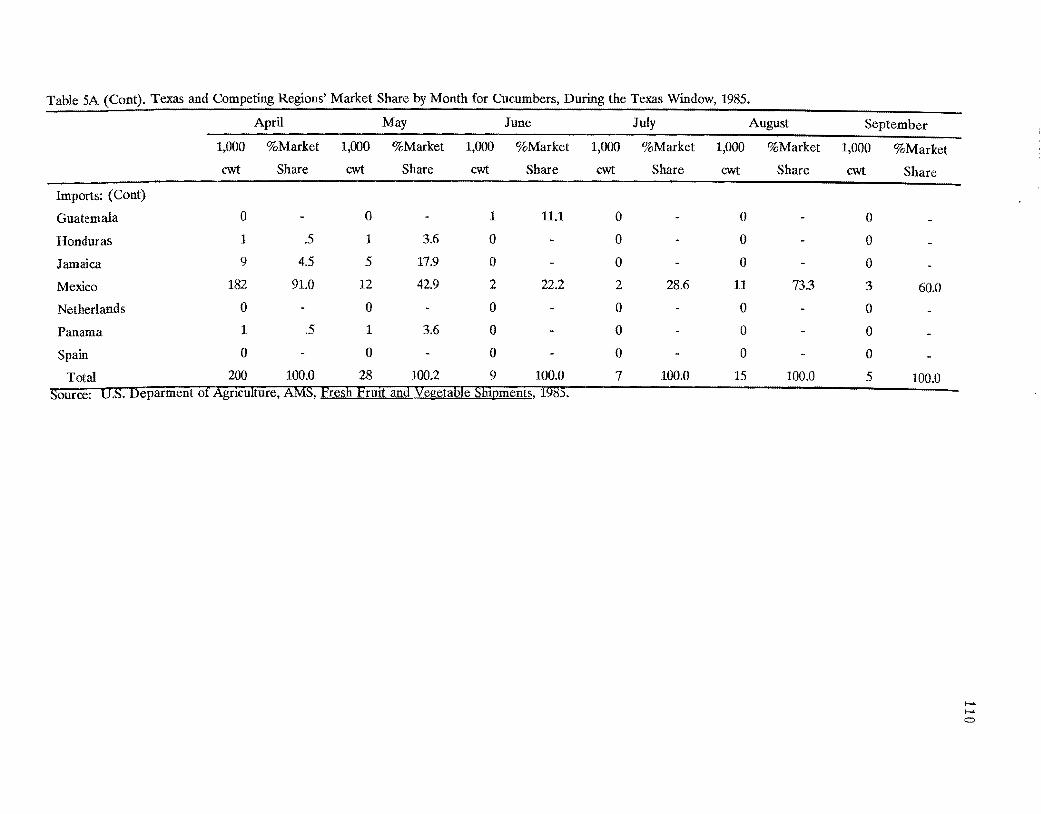
Table 5A (Cont). Texas and Competing Regions' Market Share by Month for Cucumbers, During the Texas Window, 1985.
April May June July August September
1,000 %Market 1,000 %Market 1,000 %Market 1,000 %Market 1,000 %Market 1,000 %Market
cwt Share cwt Share cwt Share cwt Share Sharecwt cwt Share
Imports: (Cont)
Guatemala 0 0 1 11.1 0 0 0
Honduras 1 5 1 3.6 0 0 0 0
Jamaica 9 45 5 17.9 0 0 0 0
Mexico 182 91.0 12 42.9 2 22.2 2 28.6 11 73.3 3 60.0
Netherlands 0 0 0 0 0 0
Panama 1 .5 1 3.6 0 0 0 0
Spain 0 0 0 0 0 0
Total 200 100.0 28 100.2 9 100.0 7 100.0 15 100.0 5 100.0 Source: O.s. Deparment ot Agnculture, AMS, Fresh FrUlt and Vegetable Shtpments, 1985.
........
........ o
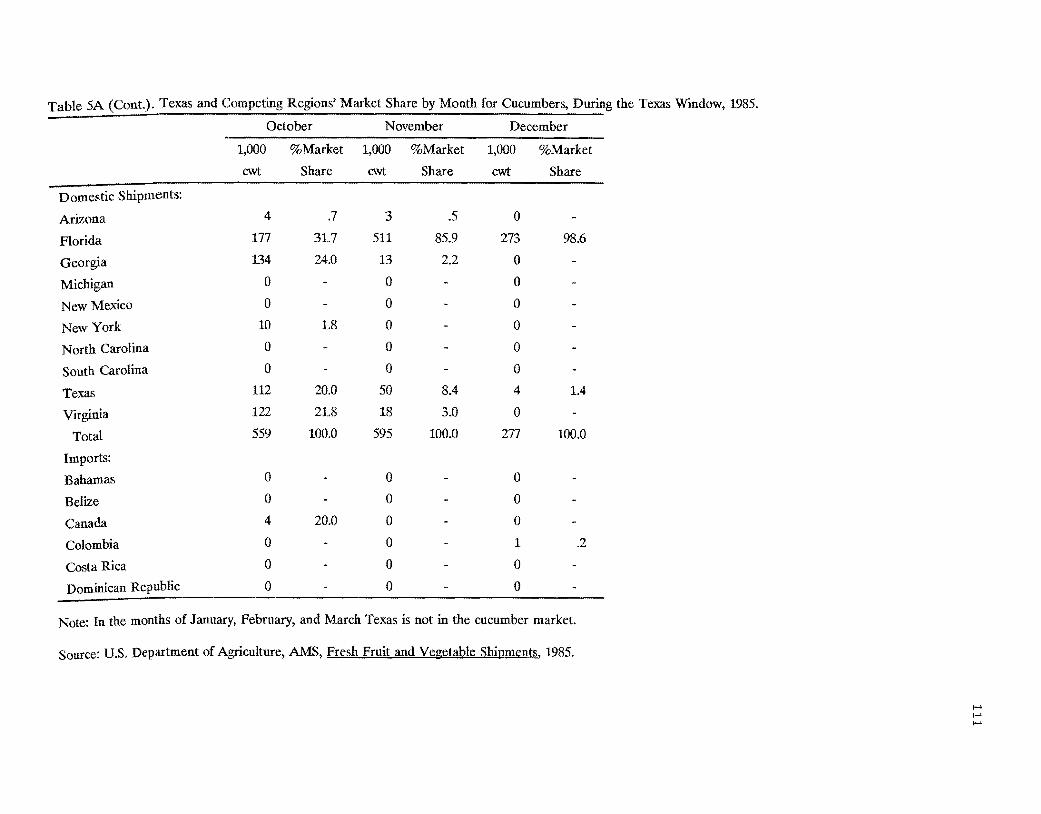
Table 5A (Cont.). Texas and Competing Regions' Market Share by Month for Cucumbers, During the Texas Window, 1985.
October November December
1,000 %Market 1,000 %Market 1,000 %Market
cwt Share cwt Share cwt Share
Domestic Shipments:
Arizona 4 .7 3 .5 0
Florida 177 31.7 511 85.9 273 98.6
Georgia 134 24.0 13 2.2 0
Michigan 0 0 0
New Mexico 0 0 0
New York 10 1.8 0 0
North Carolina 0 0 0
South Carolina 0 0 0
Texa.." 112 20.0 50 8.4 4 1.4
Virginia 122 21.8 18 3.0 0
Total 559 100.0 595 100.0 277 100.0
Imports:
Bahamas 0 0 0
Belize 0 0 0
Canada 4 20.0 0 0
Colombia 0 0 1 .2
Costa Rica 0 0 0
Dominican Republic 0 0 0
Note: In the months of January, February, and March Texas is not in the cucumber market.
Source: U.S, Department of Agriculture, AMS, Fresh Fruit and Vegetable Shipments, 1985.
1-' 1-' 1-'
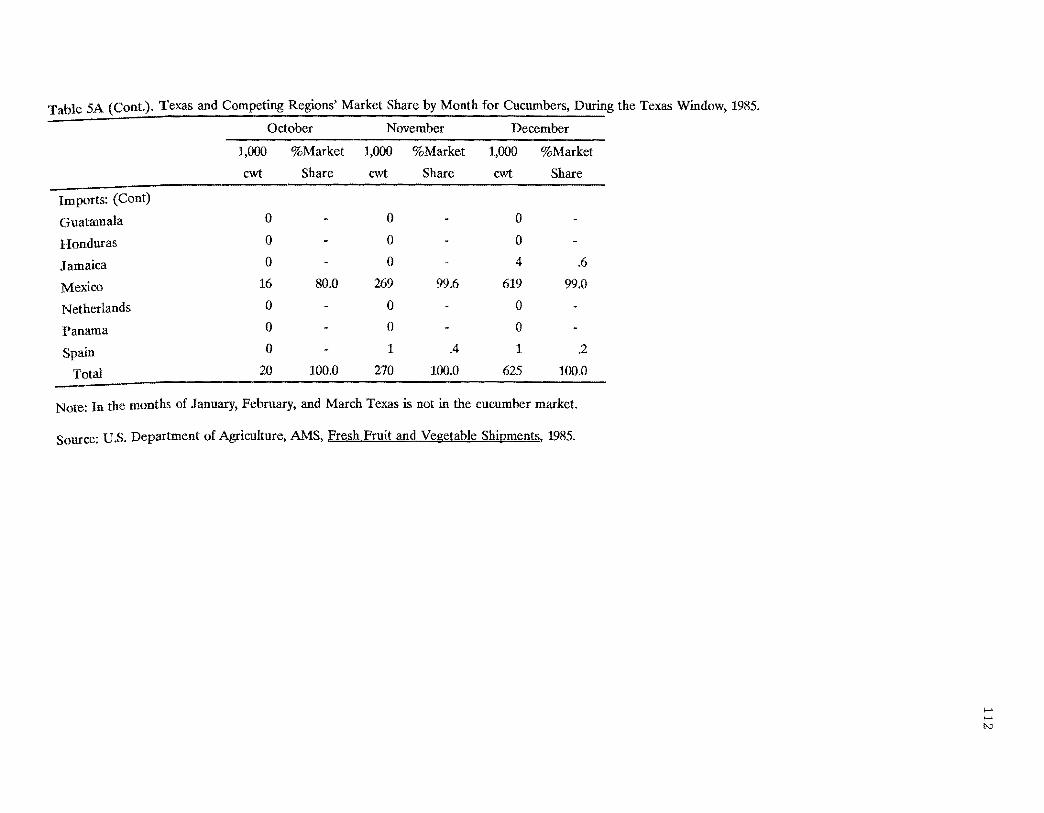
Table 5A (Cont.). Texas and Competing Regions' Market Share by Month for Cucumbers, During the Texas Window, 1985.
October November December
1,000 %Market 1,000 %Market 1,000 %Market
cwt Share cwt Share cwt Share
Imports: (Cont)
Guatamala 0 0 0
Honduras 0 0 ° Jamaica 0 0 4 .6
Mexico 16 80.0 269 99.6 619 99.0
Netherlands ° ° ° Panama 0 ° ° Spain 0 1 .4 1 .2
Total 20 100.0 270 100.0 625 100.0
Note: In the months of January, February, and March Texas is not in the cucumber market.
Source: U.S. Department of Agriculture, AMS, Fresh Fruit and Vegetable Shipments, 1985.
I-> I-> ~
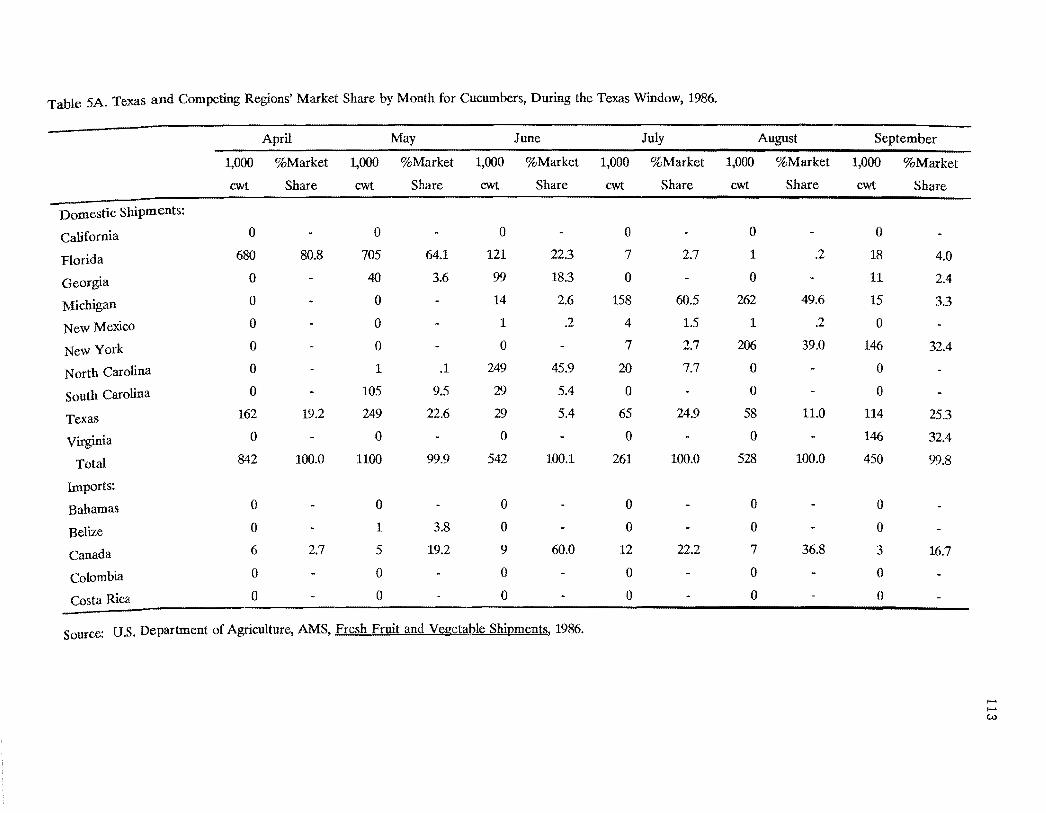
Table 5A. Texas and Competing Regions' Market Share by Month for Cucumbers, During the Texas Window, 1986.
April May June July August September
1,000 %Market 1,000 %Market 1,000 %Market 1,000 %Market 1,000 %Market 1,000 %Market
cwt Share cwt Share cwt Share cwt Share cwt Share cwt Share
Domestic Shipments:
California 0 0 0 0 0 0
Florida 680 80.8 705 64.1 121 22.3 7 2.7 1 .2 18 4.0
Georgia 0 40 3.6 99 18.3 0 0 11 2.4
Michigan 0 0 14 2.6 158 60.5 262 49.6 15 3.3
New Mexico 0 0 1 .2 4 1.5 1 .2 0
New York 0 0 0 7 2.7 206 39.0 146 32.4
North Carolina 0 1 .1 249 45.9 20 7.7 0 0
South Carolina 0 105 9.5 29 5.4 0 0 0
Texas 162 19.2 249 22.6 29 5.4 65 24.9 58 11.0 114 25.3
Virginia 0 0 0 0 0 146 32.4
Total 842 100.0 1100 99.9 542 100.1 261 100.0 528 100.0 450 99.8
Imports:
Bahamas 0 0 0 0 0 0
Belize 0 1 3.8 0 0 0 0
Canada 6 2.7 5 19.2 9 60.0 12 22.2 7 36.8 3 16.7
Colombia 0 0 0 0 0 0
Costa Rica 0 0 0 0 0 0
Source: U.S. Department of Agriculture, AMS, Fresh Fruit and Vegetable Shipments, 1986.
f-<. f-<. C,I.)
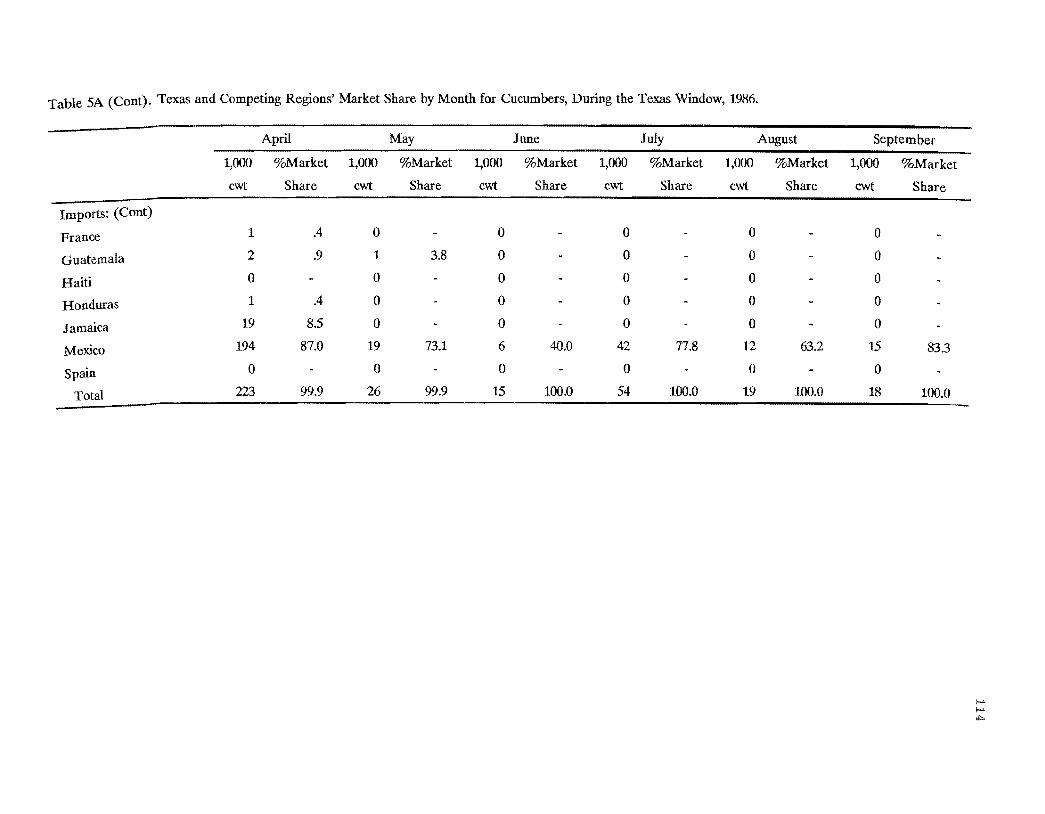
Table SA (Cont). Texas and Competing Regions' Market Share by Month for Cucumbers, During the Texas Window, 1986.
April May June July August September
1,000 %Market 1,000 %Market 1,000 %Market 1,000 %Market 1,000 %Market 1,000 %Market
cwt Share cwt Share cwt Share ewt Share ewt Share cwt Share
Imports: (Cont)
France 1 .4 0 0 0 0 ° Guatemala 2 .9 1 3.8 0 0 0 ° Haiti 0 0 0 0 0 ° Honduras 1 .4 0 0 0 0 0
Jamaica 19 8.5 0 0 0 0 0
Mexico 194 87.0 19 73.1 6 40.0 42 77.8 12 63.2 15 83.3
Spain 0 0 0 0 0 0
Total 223 99.9 26 99.9 15 100.0 54 100.0 19 100.0 18 100.0
,..... ,..... ,.."
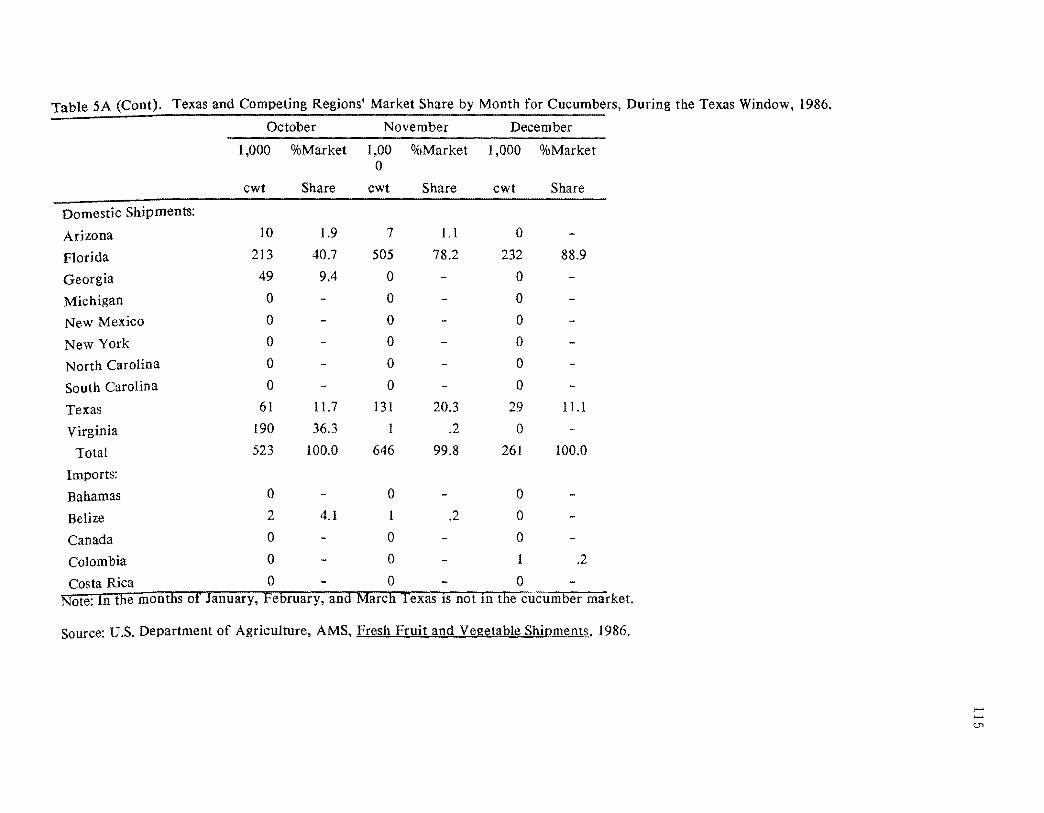
Table 5A (Cont). Texas and Competing Regions' Market Share by Month for Cucumbers, During the Texas Window, 1986.
October November December
1,000 %Market 1,00 %Market 1,000 %Market 0
cwt Share cwt Share cwt Share
Domestic Shipments:
Arizona 10 1.9 7 1.1 0
Florida 213 40.7 505 78.2 232 88.9
Georgia 49 9.4 0 0
Michigan 0 0 0
New Mexico 0 0 0
New York 0 0 0
North Carolina 0 0 0
South Carolina 0 0 0
Texas 61 11.7 131 20.3 29 ILl
Virginia 190 36.3 1 .2 0
Total 523 100.0 646 99.8 261 100.0
Imports:
Bahamas 0 0 0
Belize 2 4.1 .2 0
Canada 0 0 0
Colombia 0 0 1 .2
Costa Rica 0 0 0 Note: In the months of January, February, and March Texas is not in the cucumber market.
Source: U.s. Department of Agriculture, AMS, Fresh Fruit and Vegetable Shipments, 1986.
!-" !-" U1
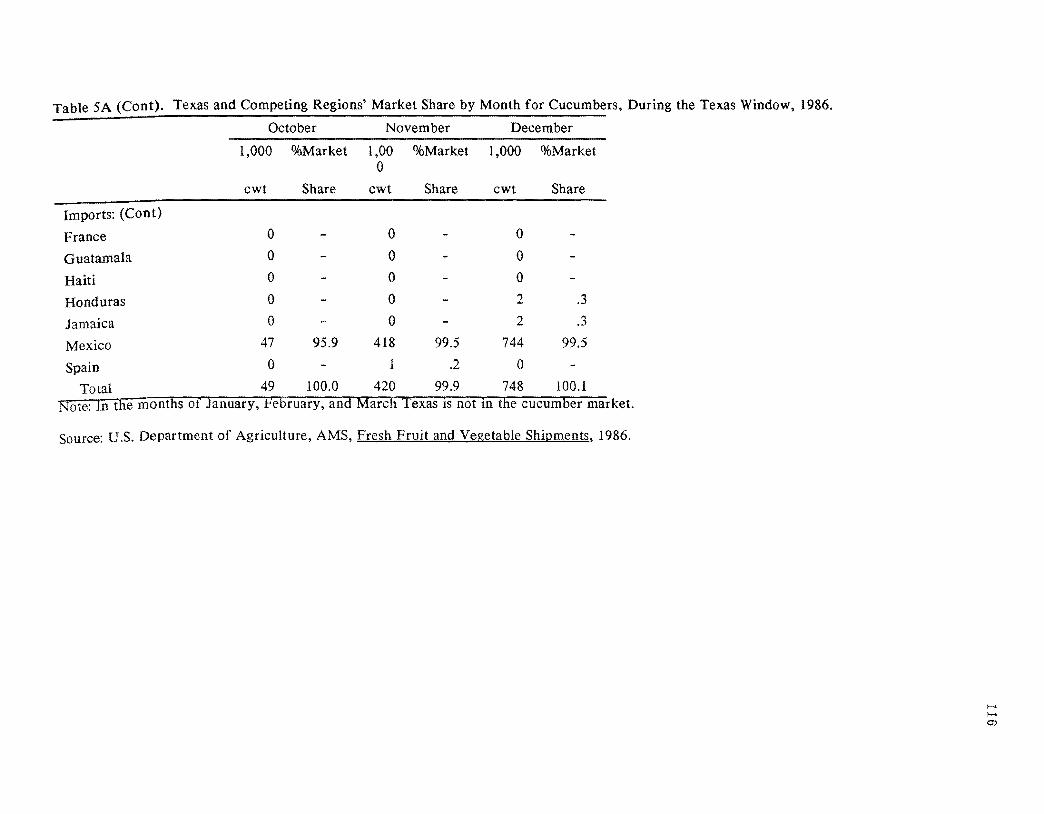
Table SA (Cont). Texas and Competing Regions' Market Share by Month for Cucumbers, During the Texas Window, 1986.
October November December
1,000 %Market 1,00 %Market 1,000 %Market 0
cwt Share cwt Share cwt Share
Imports: (Cont)
France 0 0 0
Guatamala 0 0 0
Haiti 0 0 0
Honduras 0 0 2 .3
Jamaica 0 0 2 .3
Mexico 47 9S.9 418 99.5 744 99.S
Spain 0 1 .2 0
Total 49 100.0 420 99.9 748 100.1 Note: In the months of January, February, and March Texas is not in the cucumber market.
Source: U.S. Department of Agriculture, AMS, Fresh Fruit and Vegetable Shipments, 1986.
f--'. f--'. O'l

Table 5A. Texas and Competing Regions' Market Share by Month for Cucumbers, During the Texas Window, 1987.
April May June July August September
1,000 %Market 1,000 %Market 1,000 %Market 1,000 %Market 1,000 %Market 1,000 %Market
cwt Share cwt Share cwt Share cwt Share cwt Share cwt Share
Domestic Shipments:
California 0 0 1 .2 0 0 0
Florida 476 99.4 663 77.8 173 26.7 4 2.4 2 .6 150 24.8
Georgia 0 10 1.2 125 19.3 0 0 133 22.0
New Mexico 0 0 0 1 .6 0 0
New York 0 0 0 88 53.0 221 70.2 0
North Carolina 0 0 272 42.0 27 16.3 0 0
South Carolina 0 60 7.0 38 5.9 0 0 0
Texas 3 .6 119 14.0 38 5.9 46 27.7 92 29.2 214 35.4
Virginia 0 0 0 0 0 108 17.9
Total 479 100.0 852 100.0 647 100.0 166 100.0 315 100.0 605 100.1
Imports:
Bahamas 0 0 0 0 0 0
Belize 6 1.5 2 3.4 0 0 0 0
Canada 4 1.0 12 20.3 11 52.4 12 75.0 8 34.8 6 40.0
Dominican Republic 0 0 0 0 0 0
El Salvador 0 0 0 0 0 0
Guatemala 0 0 0 0 0 0
Haiti 2 .5 0 0 0 0 0
Honduras 2 .5 0 0 0 0 0
Jamaica 0 0 0 0 0 0
Mexico 397 96.6 45 76.3 9 42.9 4 25.0 14 60.9 9 60.0
Netherlands 0 0 1 4.8 0 1 4.3 0 ;-..
Spain 0 0 0 0 0 0 ;-..
'" Total 411 100.1 59 100.0 21 100.1 16 100.0 23 100.0 15 100.0
Source: U.S. Department of Agriculture, AMS, Fresh Fruit and Vegetable Shipments, 1987.
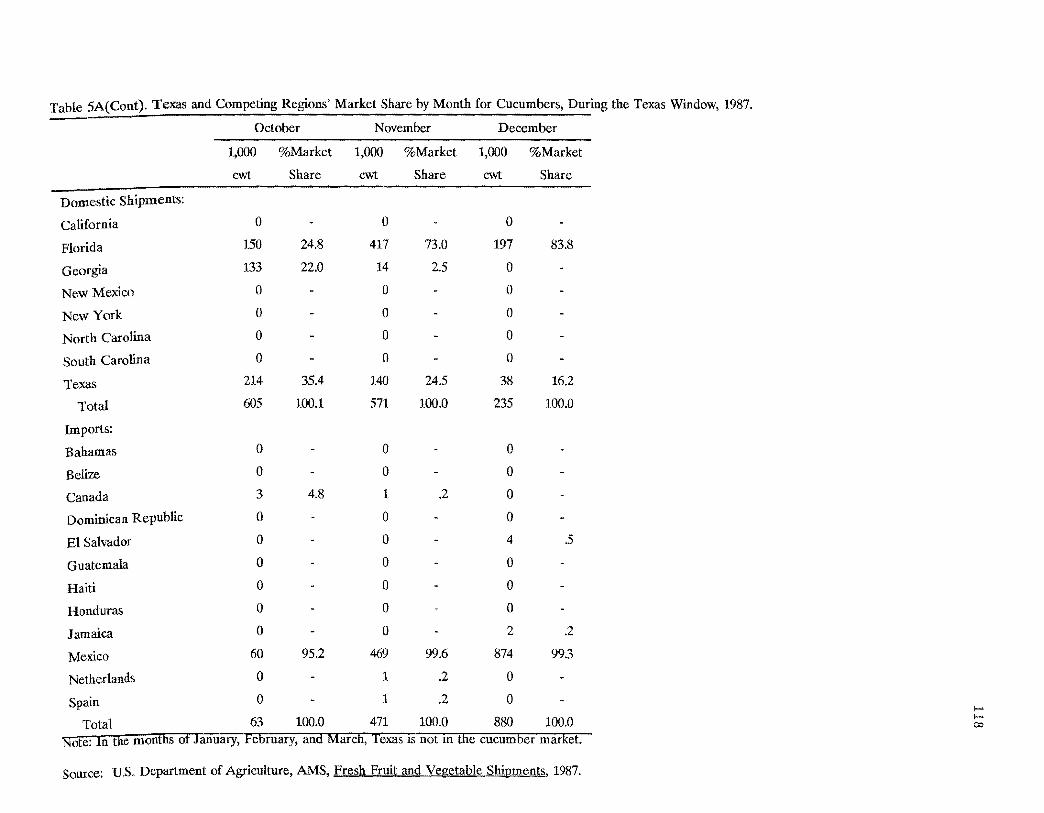
Table 5A(Cont). Texas and Competing Regions' Market Share by Month for Cucumbers, During the Texas Window, 1987.
October November December
1,000 %Market 1,000 %Market 1,000 %Market
cwt Share cwt Share cwt Share
Domestic Shipments:
California 0 0 0
Florida 150 24.8 417 73.0 197 83.8
Georgia 133 22.0 14 2.5 0
New Mexico 0 0 0
New York 0 0 0
North Carolina 0 0 0
South Carolina 0 0 0
Texas 214 35.4 140 24.5 38 16.2
Total 605 100.1 571 100.0 235 100.0
Imports:
Bahamas 0 0 0
Belize 0 0 0
Canada 3 4.8 1 .2 0
Dominican Republic 0 0 0
EI Salvador 0 0 4 .5
Guatemala 0 0 0
Haiti 0 0 0
Honduras 0 0 0
Jamaica 0 0 2 .2
Mexico 60 95.2 469 99.6 874 99.3
Netherlands 0 1 .2 0
Spain 0 1 .2 0 ..... Total 63 100.0 471 100.0 880 100.0
..... 00
Note: In tIle months of January, February, and March, Texas IS not m the cucumber market.
SOllIce: U.S. Department of Agriculture, AMS, Fresh Fruit and Vegetable Shipments, 1987.
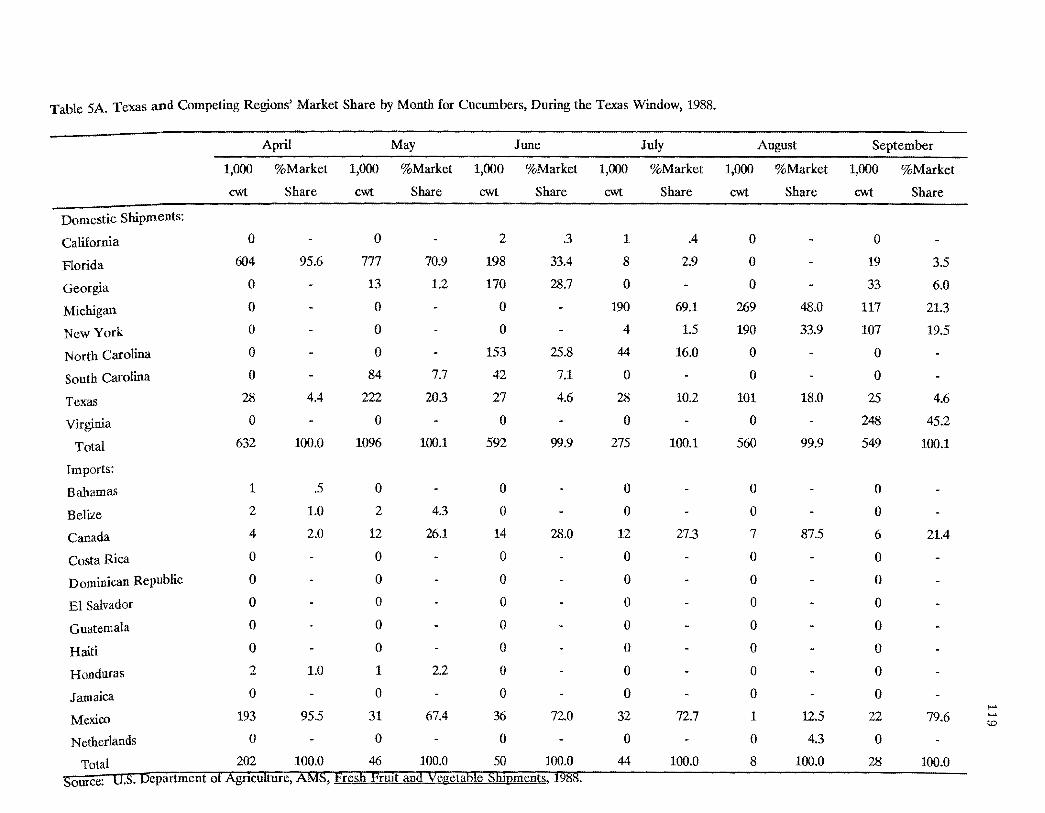
Table 5A. Texas and Competing Regions' Market Share by Month for Cucumbers, During the Texas Window, 1988.
April May June July August September
1,000 %Market 1,000 %Market 1,000 %Market 1,000 %Market 1,000 %Market 1,000 %Market
cwt Share cwt Share cwt Share cwt Share cwt Share cwt Share
Domestic Shipments:
California 0 0 2 .3 1 .4 0 0
Florida 604 95.6 777 70.9 198 33.4 8 2.9 0 19 3.5
Georgia 0 13 1.2 170 28.7 0 0 33 6.0
Michigan 0 0 0 190 69.1 269 48.0 117 21.3
New York 0 0 0 4 1.5 190 33.9 107 19.5
North Carolina 0 0 153 25.8 44 16.0 0 0
South Carolina 0 84 7.7 42 7.1 0 0 0
Texas 28 4.4 222 20.3 27 4.6 28 10.2 101 18.0 25 4.6
Virginia 0 0 0 0 0 248 45.2
Total 632 100.0 1096 100.1 592 99.9 275 100.1 560 99.9 549 100.1
Imports:
Bahamas 1 .5 0 0 0 0 0
Belize 2 1.0 2 4.3 0 0 0 0
Canada 4 2.0 12 26.1 14 28.0 12 27.3 7 87.5 6 21.4
Costa Rica 0 0 0 0 0 0
Dominican Republic 0 0 0 0 0 0
EI Salvador 0 0 0 0 0 0
Guatemala 0 0 0 0 0 0
Haiti 0 0 0 0 0 0
Honduras 2 1.0 1 2.2 0 0 0 0
Jamaica 0 0 0 0 a 0 .....
Mexico 193 95.5 31 67.4 36 72.0 32 72.7 1 12.5 22 79.6 ..... co
Netherlands 0 0 0 a 0 4.3 0
Total 202 100.0 46 100.0 50 100.0 44 100.0 8 100.0 28 100.0 Source: U.S. Department of AgrIculture, AMS, Fresh FrUIt and Vegetable ShIpments, 1988.
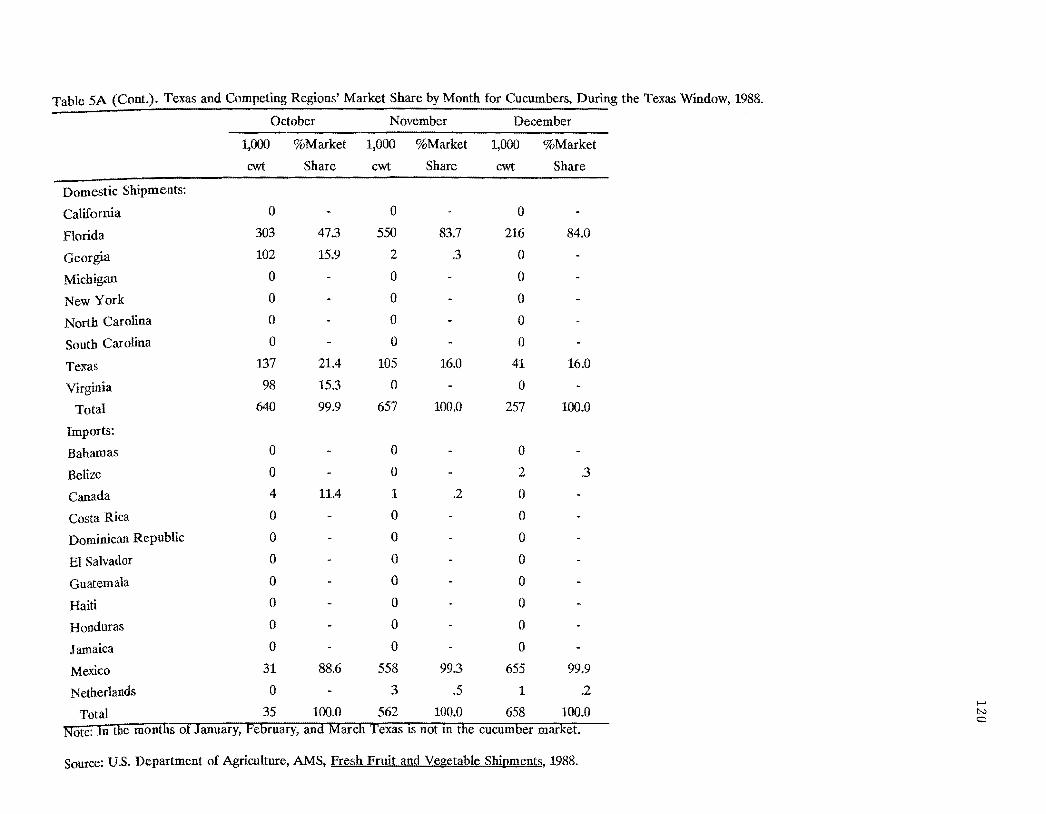
Table 5A (Cont.). Texas and Competing Regions' Market Share by Month for Cucumbers, During the Texas Window, 1988.
October November December
1,000 %Market 1,000 %Market 1,000 %Market
cwt Share cwt Share cwt Share
Domestic Shipments:
California 0 0 0
Florida 303 47.3 550 83.7 216 84.0
Georgia 102 15.9 2 .3 0
Michigan 0 0 0
New York 0 0 0
North Carolina 0 0 0
South Carolina 0 0 0
Texas 137 21.4 105 16.0 41 16.0
Virginia 98 15.3 0 0
Total 640 99.9 657 100.0 257 100.0
Imports:
Bahamas 0 0 0
Belize 0 0 2 .3
Canada 4 11.4 1 .2 0
Costa Rica 0 0 0
Dominican Republic 0 0 0
El Salvador 0 0 0
Guatemala 0 0 0
Haiti 0 0 0
Honduras 0 0 0
Jamaica 0 0 0
Mexico 31 88.6 558 993 655 99.9
Netherlands 0 3 .5 1 .2 f-'
Total 35 100.0 562 100.0 658 100.0 N 0
Note: In the monthS of January, February, and March Texas IS not ill the cucumber market.
Source: U.S. Department of Agriculture, AMS, Fresh Fruit and Vegetable Shipments, 1988.

Table 6A. Texas and Competing Regions' Market Share by Month for Bell Peppers, During the Texas Window, 1983.
January February March April May June
1,000 %Market 1,000 %Market 1,000 %Market 1,000 %Market 1,000 %Market 1,000 %Market
cwt Share cwt Share cwt Share cwt Share cwt Share cwt Share
Domestic Shipments:
Arizona 0 0 0 0 0 2 .4
California 0 0 0 4 1.3 43 8.8 36 7.7
Florida 321 84.7 210 97.7 210 100.0 294 97.7 319 65.1 278 59.7
Michigan 0 0 0 0 0 0
North Carolina 0 0 0 0 0 27 5.8
Texas 58 15.3 5 2.3 0 3 1.0 129 26.3 123 26.4
Total 379 100.0 215 100.0 210 100.0 301 100.0 490 100.2 466 100.0
Imports:
Bahamas 0 0 1 .3 1 .5 0 0
Canada 0 0 0 0 0 0
Dominican Republic 8 6.5 4 2.7 5 1.4 5 2.5 6 9.2 6 66.7
Greece 0 0 0 0 1 1.5 0
India 0 0 0 0 0 0
Jamaica 0 1 .7 1 .3 1 .5 1 1.5 1 11.1
Mexico 116 93.5 144 96.6 345 98.0 197 96.6 57 87.7 2 22.2
Netherlands 0 0 0 0 0 0
Total 124 100.0 149 100.0 352 100.0 204 100.1 65 99.9 9 100.0
Source: U.S. Department of Agriculture, AMS, Fresh Fruit and Vegetable Shipments, 1983.
i--' N i--'
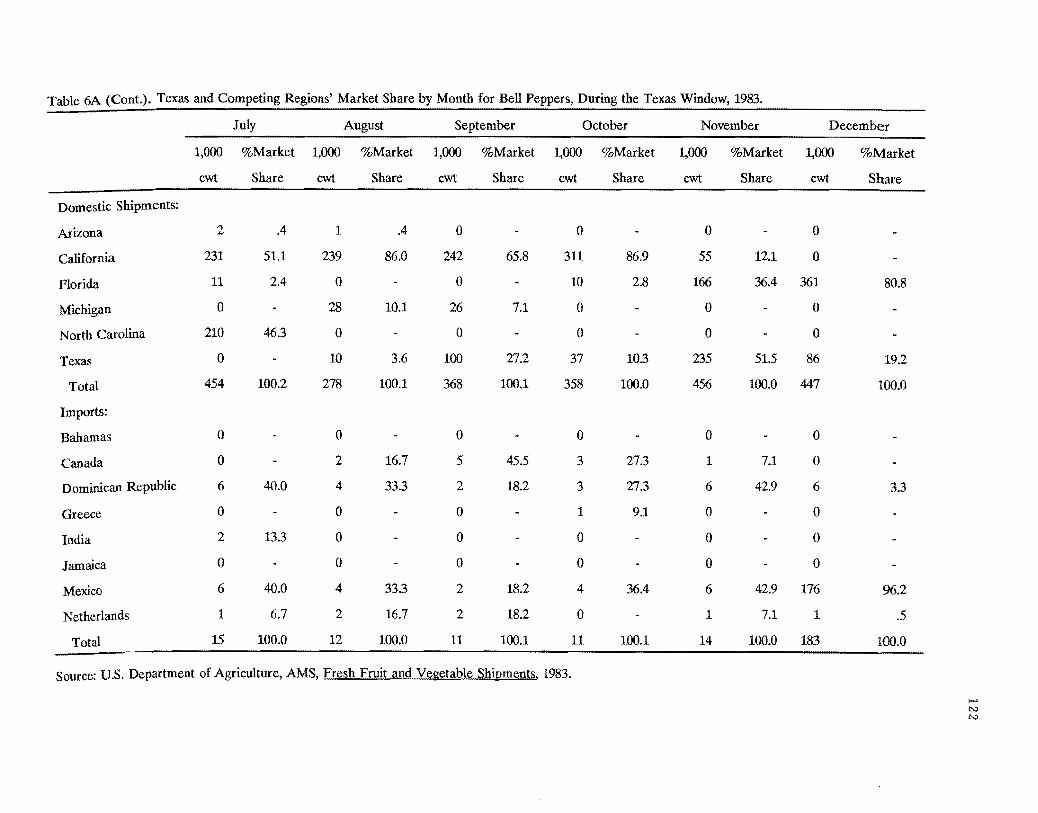
Table 6A (Cont.). Texas and Competing Regions' Market Share by Month for Bell Peppers, During the Texas Window, 1983.
July August September October November December
1,000 %Market 1,000 %Market 1,000 %Market 1,000 %Market 1,000 %Market 1,000 %Market
cwt Share cwt Share cwt Share cwt Share cwt Share cwt Share
Domestic Shipments:
Arizona 2 .4 1 .4 0 0 0 0
California 231 51.1 239 86.0 242 65.8 311 86.9 55 12.1 0
Florida 11 2.4 0 0 10 2.8 166 36.4 361 80.8
Michigan 0 28 10.1 26 7.1 0 0 0
North Carolina 210 46.3 0 0 0 0 0
Texas 0 10 3.6 100 27.2 37 10.3 235 51.5 86 19.2
Total 454 100.2 278 100.1 368 100.1 358 100.0 456 100.0 447 100.0
Imports:
Bahamas 0 0 0 0 0 0
Canada 0 2 16.7 5 45.5 3 27.3 1 7.1 0
Dominican Republic 6 40.0 4 33.3 2 18.2 3 27.3 6 42.9 6 3.3
Greece 0 0 0 1 9.1 0 0
India 2 13.3 0 0 0 0 0
Jamaica 0 0 0 0 0 0
Mexico 6 40.0 4 33.3 2 18.2 4 36.4 6 42.9 176 %.2
Netherlands 1 6.7 2 16.7 2 18.2 0 1 7.1 1 .5
Total 15 100.0 12 100.0 11 100.1 11 100.1 14 100.0 183 100.0
Source: U.S. Department of Agriculture, AMS, Fresh Fruit and Vegetable Shipments, 1983.
i-' N N
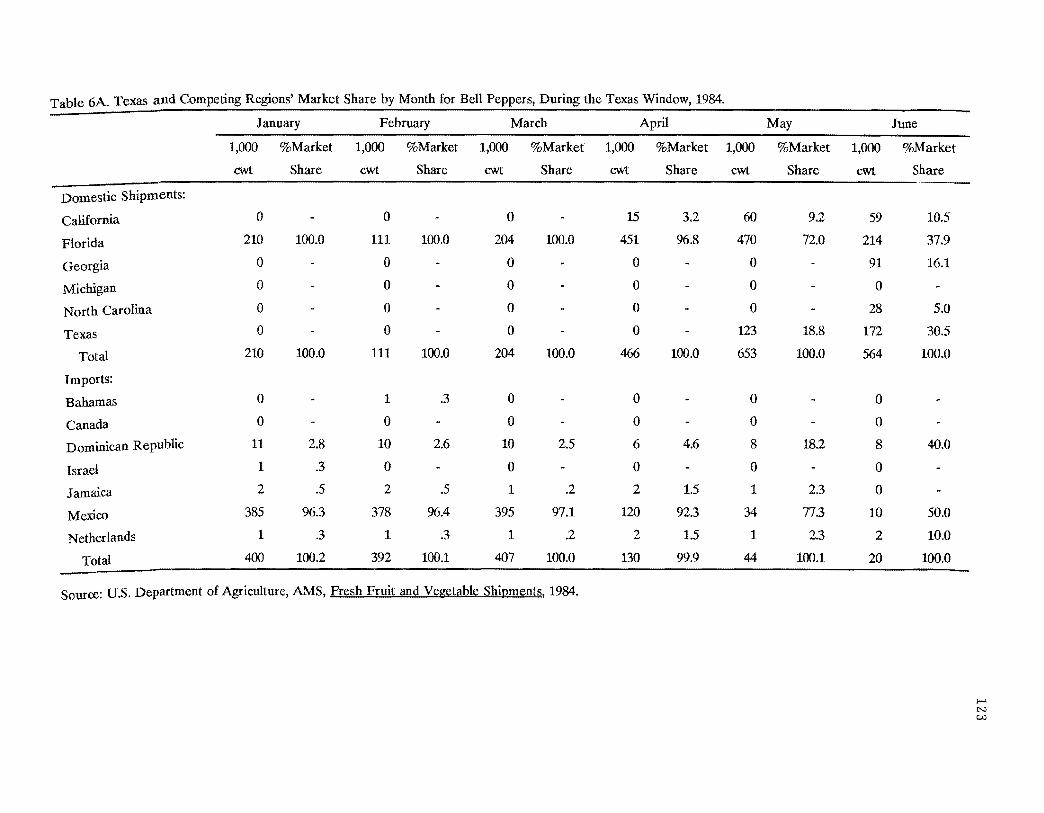
Table 6A. Texas and Competing Regions' Market Share by Month for Bell Peppers, During the Texas Window, 1984.
January February March April May June
1,000 %Market 1,000 %Market 1,000 %Market 1,000 %Market 1,000 %Market 1,000 %Market
cwt Share cwt Share cwt Share cwt Share cwt Share cwt Share
Domestic Shipments:
California 0 0 0 15 3.2 60 9.2 59 10.5
Florida 210 100.0 111 100.0 204 100.0 451 96.8 470 72.0 214 37.9
Georgia 0 0 0 0 0 91 16.1
Michigan ° 0 0 0 0 0
North Carolina 0 0 0 0 0 28 5.0
Texas 0 0 0 0 123 18.8 172 30.5
Total 210 100.0 111 100.0 204 100.0 466 100.0 653 100.0 564 100.0
Imports:
Bahamas 0 1 .3 0 0 0 0
Canada 0 0 0 0 0 0
Dominican Republic 11 2.8 10 2.6 10 2.5 6 4.6 8 18.2 8 40.0
Israel 1 .3 0 0 0 0 0
Jamaica 2 .5 2 .5 1 .2 2 1.5 1 2.3 0
Mexico 385 96.3 378 %.4 395 97.1 120 92.3 34 77.3 10 50.0
Netherlands 1 .3 1 .3 1 .2 2 1.5 1 2.3 2 10.0
Total 400 100.2 392 100.1 407 100.0 130 99.9 44 100.1 20 100.0
Source: U.S. Department of Agriculture, AMS, Fresh Fruit and Vegetable Shipments, 1984.
I-' N c:....J
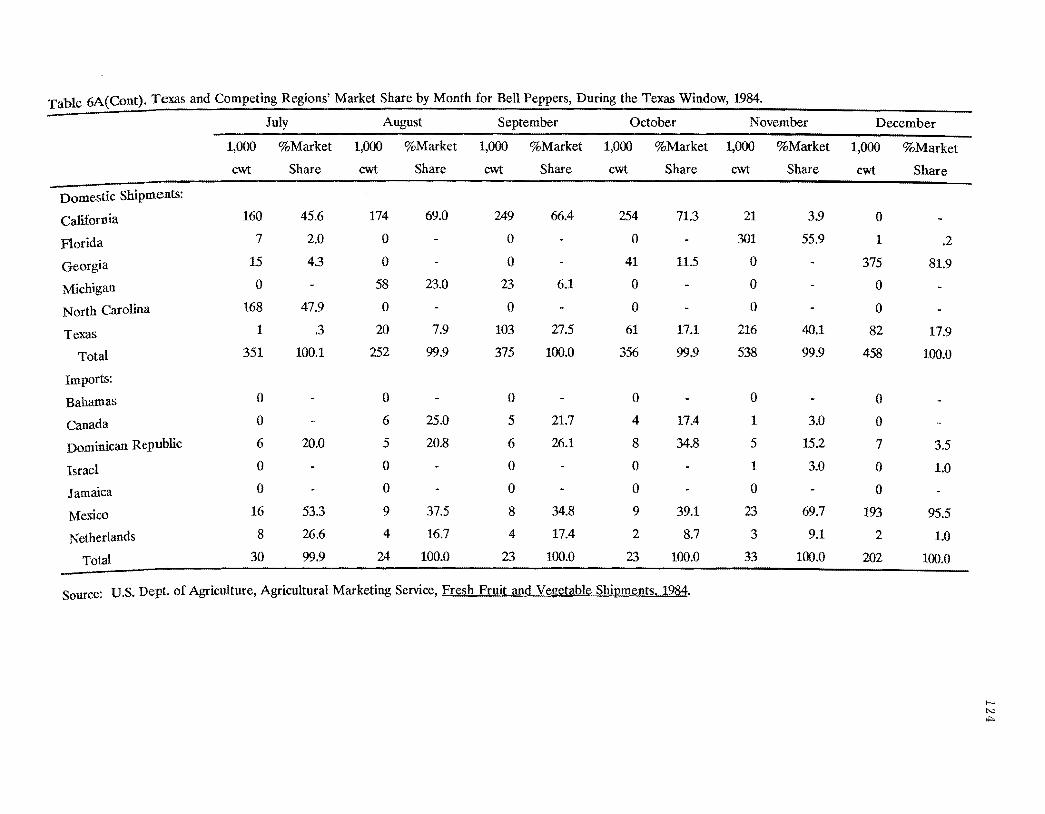
Table 6A(Cont). Texas and Competing Regions' Market Share by Month for Bell Peppers, During the Texas Window, 1984.
July August September October November December
1,000 %Market 1,000 %Market 1,000 %Market 1,000 %Market 1,000 %Market 1,000 %Market
cwt Share cwt Share cwt Share ewt Share ewt Share ewt Share
Domestic Shipments:
California 160 45.6 174 69.0 249 66.4 254 713 21 3.9 0
Florida 7 2.0 0 0 0 301 55.9 1 .2
Georgia 15 4.3 0 0 41 11.5 0 375 81.9
Michigan 0 58 23.0 23 6.1 0 0 0
North Carolina 168 47.9 0 0 0 0 0
Texas 1 .3 20 7.9 103 27.5 61 17.1 216 40.1 82 17.9
Total 351 100.1 252 99.9 375 100.0 356 99.9 538 99.9 458 100.0
Imports:
Bahamas 0 0 0 0 0 0
Canada 0 6 25.0 5 21.7 4 17.4 1 3.0 0
Dominican Republic 6 20.0 5 20.8 6 26.1 8 34.8 5 15.2 7 3.5
Israel 0 0 0 0 1 3.0 0 1.0
Jamaica 0 0 0 0 0 0
Mexico 16 533 9 37.5 8 34.8 9 39.1 23 69.7 193 95.5
Netherlands 8 26.6 4 16.7 4 17.4 2 8.7 3 9.1 2 1.0
Total 30 99.9 24 100.0 23 100.0 23 100.0 33 100.0 202 100.0
Source: U.S. Dept. of Agriculture, Agricultural Marketing Service, Fresh Fruit and Vefretable Shiuments. 1984.
f--< N ....

Table 6A. Texas and Competing Regions' Market Share by Month for Bell Peppers, During the Texas Window, 1985.
January February March April May June
1,000 %Market 1,000 %Market 1,000 %Market 1,000 %Market 1,000 %Market 1,000 %Market
cwt Share cwt Share cwt Share cwt Share cwt Share cwt Share
-Domestic Shipments:
California 0 0 0 0 44 5.9 89 15.2
Florida 346 96.9 54 100.0 47 100.0 479 100.0 657 88.0 160 27.4
Georgia 0 0 0 0 3 .4 116 19.9
Michigan 0 0 0 0 0 0
New Mexico 0 0 0 0 0 0
North Carolina 0 0 0 0 0 87 14.9
Texas 11 3.1 0 0 0 43 5.8 132 22.6
Total 357 100.0 54 100.0 47 100.0 479 100.0 747 100.1 584 100.0
ImportS:
Bahamas 0 1 .2 0 0 0 0
Belgium 0 0 0 1 .8 1 2.3 1 3.1
Canada 0 0 0 0 0 0
Dominican Republic 7 1.9 3 .6 6 1.1 3 23 24 55.8 11 34.4
France 0 0 1 .2 0 0 0
Greece 0 0 0 0 0 0
Israel 0 2 ,4 0 0 0 0
Jamaica 0 2 .4 11 1.9 13 9.8 3 7.0 0
Mexico 367 97.6 457 98.3 546 96.6 110 82.7 7 16.3 12 37.5
Netherlands 2 .5 0 1 .2 6 4.5 8 18.6 8 25.0
Total 376 100.0 465 99.9 565 100.0 133 100.1 43 100.0 32 100.0
Source: U.s. Department of Agriculture, AMS, Fresh Fruit and Vegetable Shipments, 1985. f-" N en
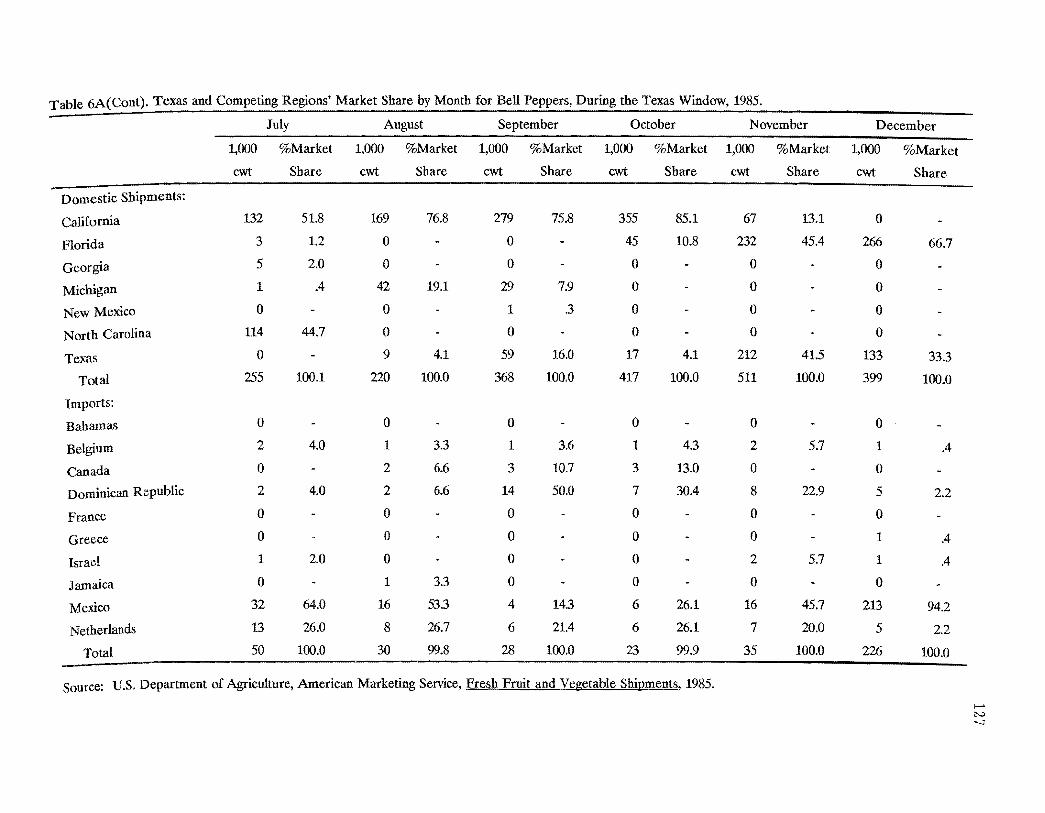
Table 6A(Cont). Texas and Competing Regions' Market Share by Month for Bell Peppers, During the Texas Window, 1985.
July August September October November December
1,000 %Market 1,000 %Market 1,000 %Market 1,000 %Market 1,000 %Market 1,000 %Market
cwt Share cwt Share cwt Share cwt Share cwt Share cwt Share
Domestic Shipments:
California 132 51.8 169 76.8 279 75.8 355 85.1 67 13.1 0
Florida 3 1.2 0 0 45 10.8 232 45.4 266 66.7
Georgia 5 2.0 0 0 0 0 0
Michigan 1 .4 42 19.1 29 7.9 0 0 0
New Mexico 0 0 1 .3 0 0 0
North Carolina 114 44.7 0 0 0 0 0
Texas 0 9 4.1 59 16.0 17 4.1 212 41.5 133 33.3
Total 255 100.1 220 100.0 368 100.0 417 100.0 511 100.0 399 100.0
Imports:
Bahamas 0 0 0 0 0 0
Belgium 2 4.0 1 3.3 1 3.6 1 4.3 2 5.7 1 .4
Canada 0 2 6.6 3 10.7 3 13.0 0 0
Dominican Republic 2 4.0 2 6.6 14 50.0 7 30.4 8 22.9 5 2.2
France 0 0 0 0 0 0
Greece 0 0 0 0 0 1 .4
Israel 1 2.0 0 0 0 2 5.7 1 .4
Jamaica 0 1 3.3 0 0 0 0
Mexico 32 64.0 16 53.3 4 14.3 6 26.1 16 45.7 213 94.2
Netherlands 13 26.0 8 26.7 6 21.4 6 26.1 7 20.0 5 2.2
Total 50 100.0 30 99.8 28 100.0 23 99.9 35 100.0 226 100.0
Source: U.S. Department of Agriculture, American Marketing Service, Fresh Fruit and Vegetable Shipments, 1985.
i--' N -...:J
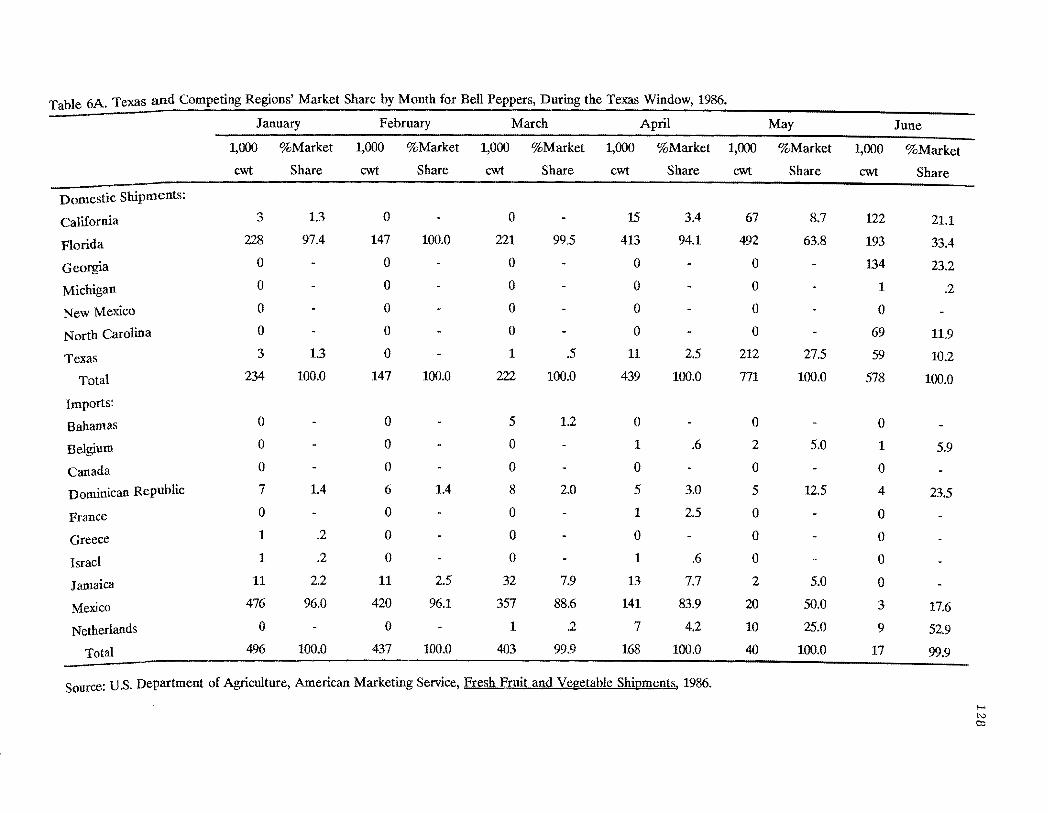
Table 6A. Texas and Competing Regions' Market Share by Month for Bell Peppers, During the Texas Window, 1986.
January February March April May June
1,000 %Market 1,000 %Market 1,000 %Market 1,000 %Market 1,000 %Market 1,000 %Market
cwt Share cwt Share cwt Share cwt Share cwt Share cwt Share
Domestic Shipments:
California 3 1.3 0 0 15 3.4 67 8.7 122 21.1
Florida 228 97.4 147 100.0 221 99.5 413 94.1 492 63.8 193 33.4
Georgia 0 0 0 0 0 134 23.2
Michigan 0 0 0 0 0 1 .2
New Mexico 0 0 0 0 0 0
North Carolina 0 0 0 0 0 69 11.9
Texas 3 1.3 0 1 .5 11 2.5 212 27.5 59 10.2
Total 234 100.0 147 100.0 222 100.0 439 100.0 771 100.0 578 100.0
Imports:
Bahamas 0 0 5 1.2 0 0 0
Belgium 0 0 0 1 .6 2 5.0 1 5.9
Canada 0 0 0 0 0 0
Dominican Republic 7 1.4 6 1.4 8 2.0 5 3.0 5 12.5 4 23.5
France 0 0 0 1 2.5 0 0
Greece 1 .2 0 0 0 0 0
Israel 1 .2 0 0 1 .6 0 0
Jamaica 11 2.2 11 2.5 32 7.9 13 7.7 2 5.0 0
Mexico 476 96.0 420 96.1 357 88.6 141 83.9 20 50.0 3 17.6
Netherlands 0 0 1 .2 7 4.2 10 25.0 9 52.9
Total 496 100.0 437 100.0 403 99.9 168 100.0 40 100.0 17 99.9
Source: U.S. Department of Agriculture, American Marketing Service, Fresh Fruit and Vegetable Shipments, 1986.
N'""" Q:)
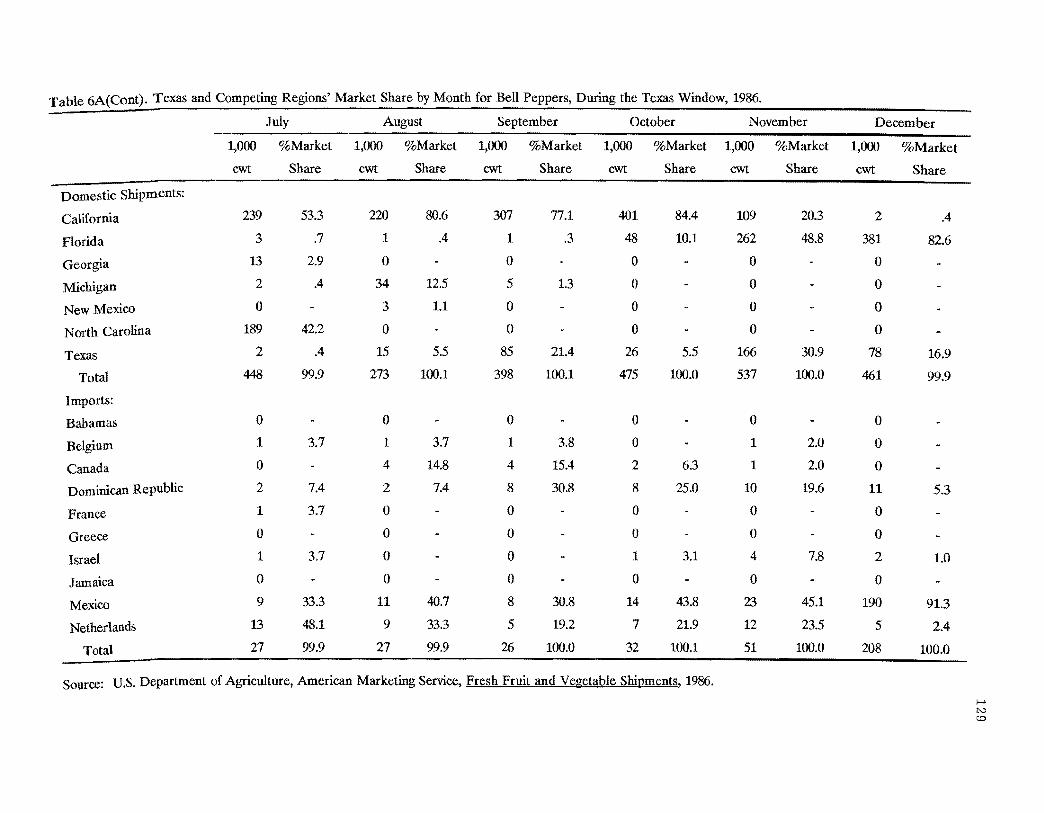
Table 6A(Cont). Texas and Competing Regions' Market Share by Month for Bell Peppers, During the Texas Window, 1986.
July August September October November December
1,000 %Market 1,000 %Market 1,000 %Market 1,000 %Market 1,000 %Market 1,000 %Market
cwt Share cwt Share cwt Share cwt Share cwt Share cwt Share
Domestic Shipments:
California 239 53.3 220 80.6 307 77.1 401 84.4 109 20.3 2 .4
Florida 3 .7 1 .4 1 .3 48 10.1 262 48.8 381 82.6
Georgia 13 2.9 0 0 0 0 0
Michigan 2 .4 34 12.5 5 1.3 0 0 0
New Mexico 0 3 1.1 0 0 0 0
North Carolina 189 42.2 0 0 0 0 0
Texas 2 .4 15 5.5 85 21.4 26 5.5 166 30.9 78 16.9
Total 448 99.9 273 100.1 398 100.1 475 100.0 537 100.0 461 99.9
Imports:
Bahamas 0 0 0 0 0 0
Belgium 1 3.7 1 3.7 1 3.8 0 1 2.0 0
Canada 0 4 14.8 4 15.4 2 6.3 1 2.0 0
Dominican Republic 2 7.4 2 7.4 8 30.8 8 25.0 10 19.6 11 5.3
France 1 3.7 0 0 0 0 0
Greece 0 0 0 0 0 0
Israel 1 3.7 0 0 1 3.1 4 7.8 2 1.0
Jamaica 0 0 0 0 0 0
Mexico 9 33.3 11 40.7 8 30.8 14 43.8 23 45.1 190 91.3
Netherlands 13 48.1 9 33.3 5 19.2 7 21.9 12 23.5 5 2.4
Total 27 99.9 27 99.9 26 100.0 32 100.1 51 100.0 208 100.0
Source: U.s. Department of Agriculture, American Marketing Service, Fresh Fruit and Vegetable Shipments, 1986.
..... N co
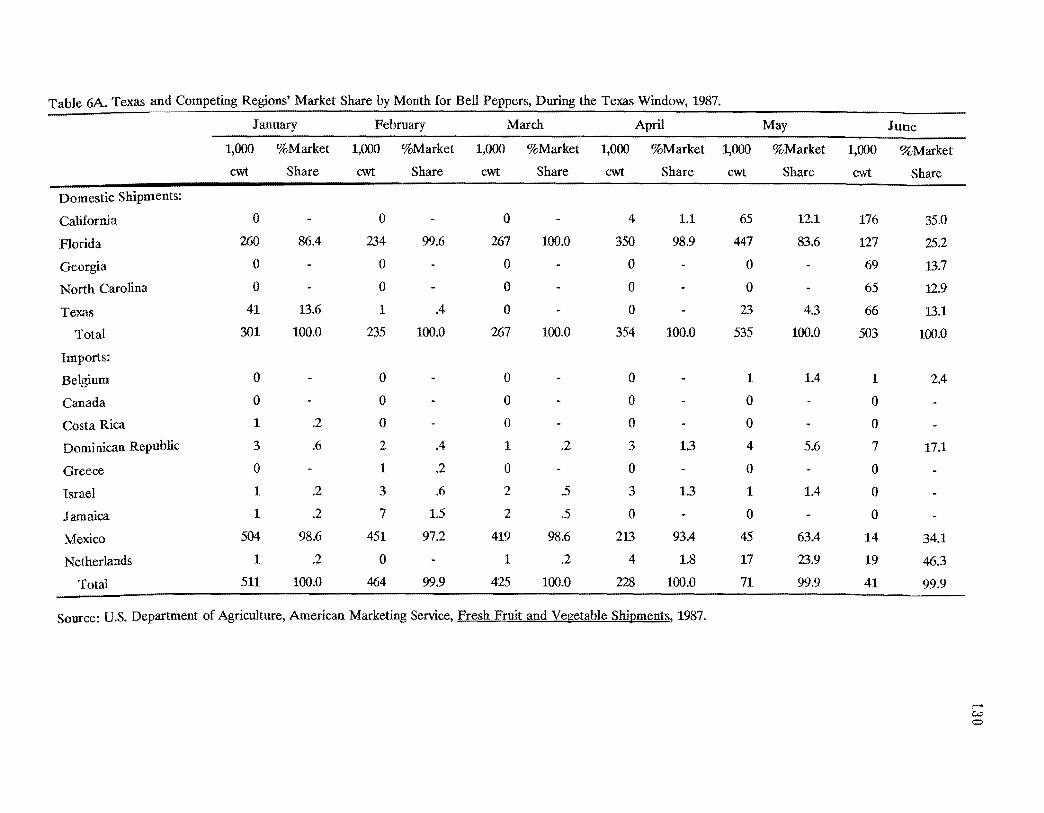
Table 6A. Texas and Competing Regions' Market Share by Month for Bell Peppers, During the Texas Window, 1987.
January February March April May June
1,000 %Market 1,000 %Market 1,000 %Market 1,000 %Market 1,000 %Market 1,000 %Market
cwt Share cwt Share cwt Share cwt Share cwt Share cwt Share
Domestic Shipments:
California 0 0 0 4 1.1 65 12.1 176 35.0
Florida 260 86.4 234 99.6 267 100.0 350 98.9 447 83.6 127 25.2
Georgia 0 0 0 0 0 69 13.7
North Carolina 0 0 0 0 0 65 12.9
Texas 41 13.6 1 .4 0 0 23 4.3 66 13.1
Total 301 100.0 235 100.0 267 100.0 354 100.0 535 100.0 503 100.0
Imports:
Belgium 0 0 0 0 1 1.4 1 2.4
Canada 0 0 0 0 0 0
Costa Rica 1 .2 0 0 0 0 0
Dominican Republic 3 .6 2 .4 1 .2 3 1.3 4 5.6 7 17.1
Greece 0 1 .2 0 0 0 0
Israel 1 .2 3 .6 2 .5 3 1.3 1 1.4 0
Jamaica 1 .2 7 1.5 2 .5 0 0 0
Mexico 504 98.6 451 97.2 419 98.6 213 93.4 45 63.4 14 34.1
Netherlands 1 .2 0 1 .2 4 1.8 17 23.9 19 46.3
Total 511 100.0 464 99.9 425 100.0 228 100.0 71 99.9 41 99.9
Source: U.S. Department of Agriculture, American Marketing Service, Fresh Fruit and Vegetable Shipments, 1987.
f-' W o
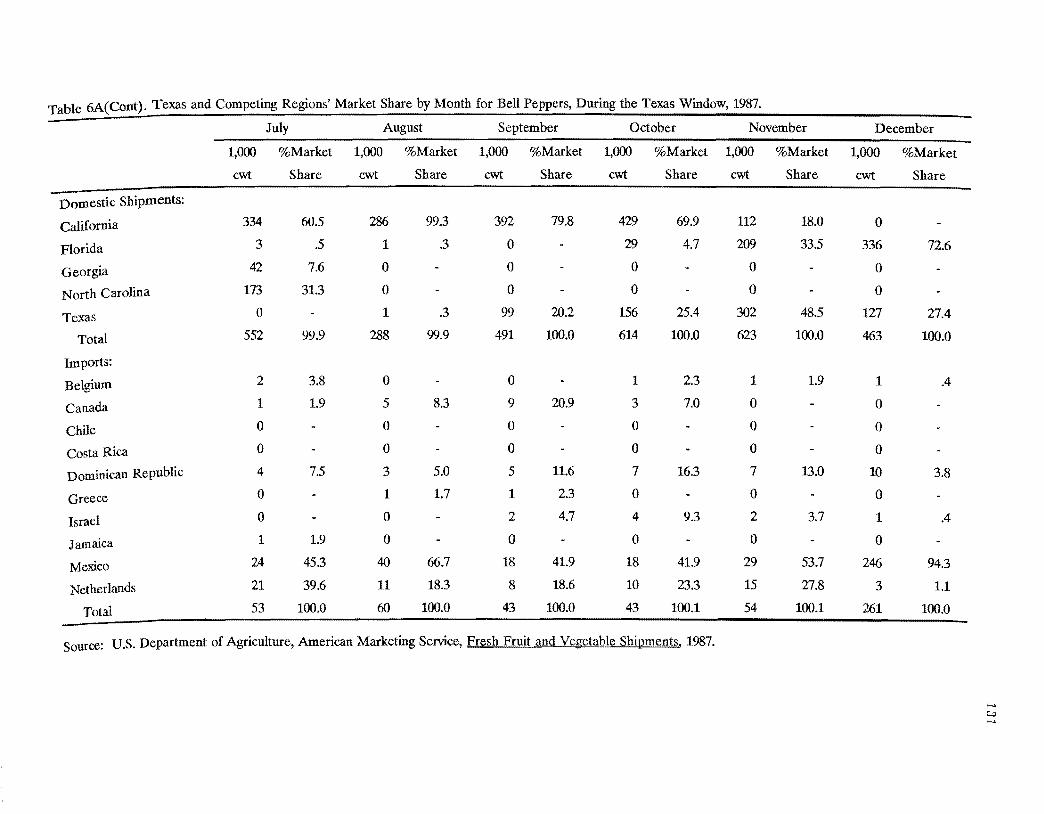
Table 6A(Cont). Texas and Competing Regions' Market Share by Month for Bell Peppers, During the Texas Window, 1987.
July August September October November December
1,000 %Market 1,000 %Market 1,000 %Market 1,000 %Market 1,000 %Market 1,000 %Market
cwt Share cwt Share cwt Share cwt Share cwt Share cwt Share
Domestic Shipments:
California 334 60.5 286 99.3 392 79.8 429 69.9 112 18.0 0
Florida 3 .5 1 .3 0 29 4.7 209 33.5 336 72.6
Georgia 42 7.6 0 0 0 0 0
North Carolina 173 31.3 0 0 0 0 0
Texas 0 1 .3 99 20.2 156 25.4 302 48.5 127 27.4
Total 552 99.9 288 99.9 491 100.0 614 100.0 623 100.0 463
Imports:
Belgium 2 3.8 0 0 1 2.3 1 1.9 1 .4
Canada 1 1.9 5 8.3 9 20.9 3 7.0 0 0
Chile 0 0 0 0 0 0
Costa Rica 0 0 0 0 0 0
Dominican Republic 4 7.5 3 5.0 5 11.6 7 16.3 7 13.0 10 3.8
Greece 0 1 1.7 1 2.3 0 0 0
Israel 0 0 2 4.7 4 9.3 2 3.7 1 .4
Jamaica 1 1.9 0 0 0 0 0
Mexico 24 45.3 40 66.7 18 41.9 18 41.9 29 53.7 246 94.3
Netherlands 21 39.6 11 18.3 8 18.6 10 23.3 15 27.8 3 1.1
Total 53 100.0 60 100.0 43 100.0 43 100.1 54 100.1 261 100.0
Source: U.S. Department of Agriculture, American Marketing Service, Fresh Fruit and Vegetable Shipments, 1987.
f-.>. Coo J-..>.
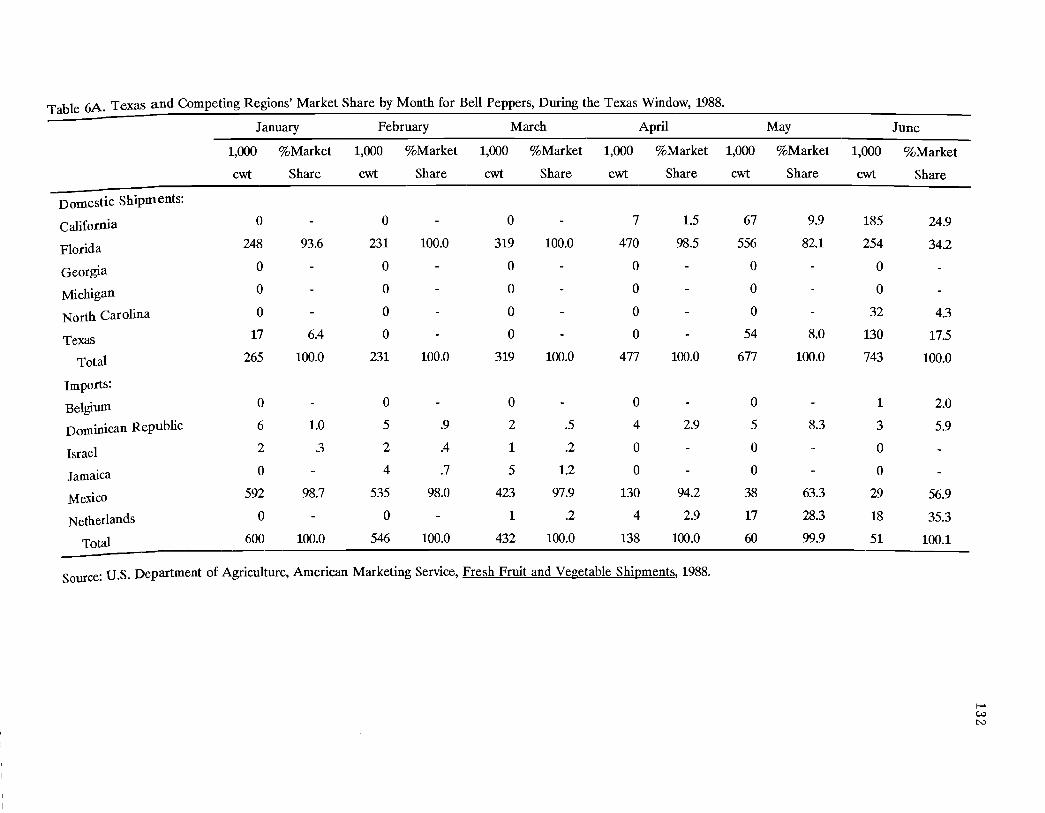
Table 6A. Texas and Competing Regions' Market Share by Month for Bell Peppers, During the Texas Window, 1988.
January February March April May June
1,000 %Market 1,000 %Market 1,000 %Market 1,000 %Market 1,000 %Market 1,000 %Market
cwt Share ewt Share cwt Share ewt Share cwt Share ewt Share
Domestic Shipments:
California 0 0 0 7 1.5 67 9.9 185 24.9
Florida 248 93.6 231 100.0 319 100.0 470 98.5 556 82.1 254 34.2
Georgia 0 0 0 0 0 0
Michigan 0 0 0 0 0 0
North Carolina 0 0 0 0 0 32 4.3
Texas 17 6.4 0 0 0 54 8.0 130 17.5
Total 265 100.0 231 100.0 319 100.0 477 100.0 677 100.0 743 100.0
Imports:
Belgium 0 0 0 0 0 1 2.0
Dominican Republic 6 1.0 5 .9 2 .5 4 2.9 5 8.3 3 5.9
Israel 2 .3 2 .4 1 .2 0 0 0
Jamaica 0 4 .7 5 1.2 0 0 0
Mexico 592 98.7 535 98.0 423 97.9 130 94.2 38 63.3 29 56.9
Netherlands 0 0 1 .2 4 2.9 17 28.3 18 35.3
Total 600 100.0 546 100.0 432 100.0 138 100.0 60 99.9 51 100.1
Source: U.S. Department of Agriculture, American Marketing Service, Fresh Fruit and Vegetable Shipments, 1988.
f-' W N
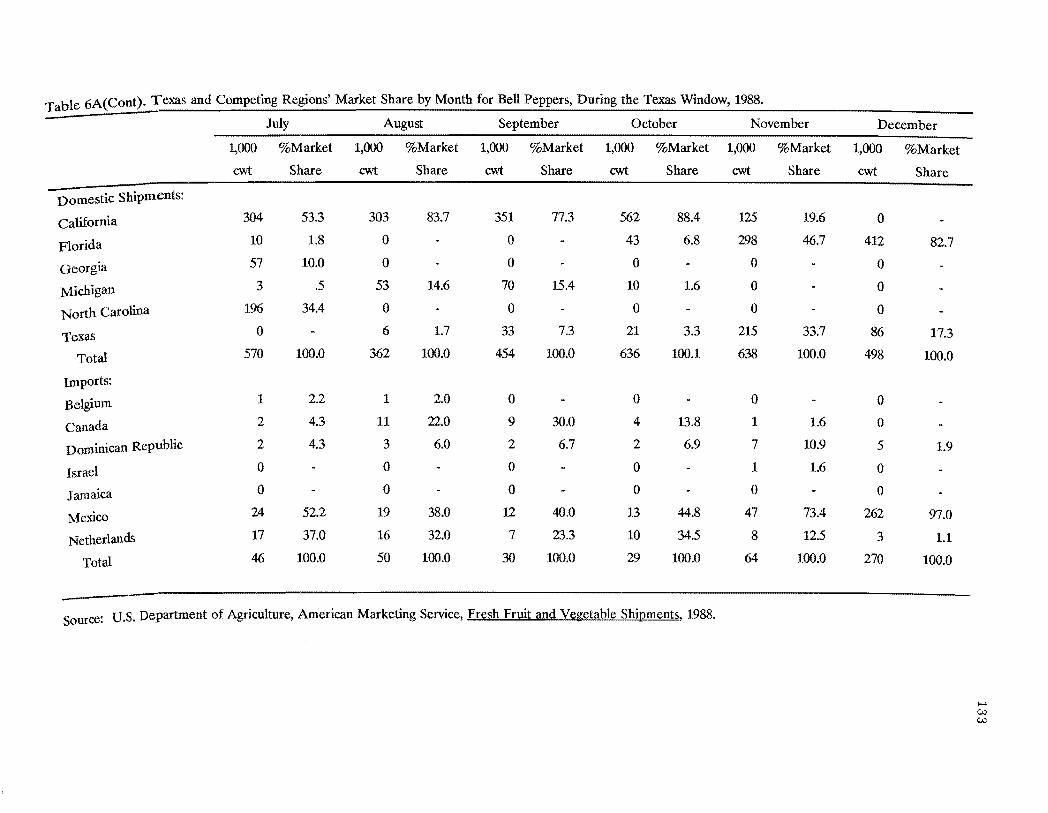
Table 6A(Cont). Texas and Competing Regions' Market Share by Month for Bell Peppers, During the Texas Window, 1988.
July August September October November December
1,000 %Market 1,000 %Market 1,000 %Market 1,000 %Market 1,000 %Market 1,000 %Market
cwt Share cwt Share cwt Share cwt Share cwt Share cwt Share
Domestic Shipments:
California 304 53.3 303 83.7 351 77.3 562 88.4 125 19.6 a Florida 10 1.8 0 0 43 6.8 298 46.7 412 82.7
Georgia 57 10.0 a a a 0 a Michigan 3 .5 53 14.6 70 15.4 10 1.6 a 0
North Carolina 196 34.4 a a 0 0 0
Texas 0 6 1.7 33 7.3 21 3.3 215 33.7 86 17.3
Total 570 100.0 362 100.0 454 100.0 636 100.1 638 100.0 498 100.0
Imports:
Belgium 1 2.2 1 2.0 0 0 0 0
Canada 2 4.3 11 22.0 9 30.0 4 13.8 1 1.6 0
Dominican Republic 2 4.3 3 6.0 2 6.7 2 6.9 7 10.9 5 1.9
Israel 0 0 0 0 1 1.6 0
Jamaica 0 0 0 0 a 0
Mexico 24 52.2 19 38.0 12 40.0 13 44.8 47 73.4 262 97.0
Netherlands 17 37.0 16 32.0 7 23.3 10 34.5 8 12.5 3 1.1
Total 46 100.0 50 100.0 30 100.0 29 100.0 64 100.0 270 100.0
Source: U.S. Department of Agriculture, American Marketing Service, Fresh Fruit and Vegetable Shipments, 1988.
I--' c.o c.o

Table 7A. Texas and Competing Regions' Market Share by Month for Dry Onions, During the Texas Window, 1983.
March April May June July August September
1,000 %Market 1,000 %Market 1,000 %Market 1,000 %Market 1,000 %Market 1,000 %Market 1,000 %Market Share cwt Share cwt Share cwt Share cwt Share cwt Share cwtcWt Share
Domestic Shipments" Arizona 0 0 211 8.3 258 14.8 29 1.2 34 1.6 13 .5 California 21 .12 17 .8 625 24.7 969 40.1 933 40.7 394 18.5 241 9.9
colorado 117 6.8 0 0 0 0 184 8.7 634 26.0
Florida 0 0 4 .2 0 0 0 0 .
Georgta Idaho
0
139 68.0 3 1
.2
.1 225
0 8.9 179
0 7.4 0
0 0
62 2.9 0
296 12.1
Michigan New Mexico
119 0
6.9 0 0
0 2 .1
0 340 14.1
0 429 18.8
11 401
.5 18.9
209 53
8.5 2.2
New York 435 25.1 251 12.8 0 0 0 69 3.2 234 9.6
Oregon Texas
425 295
24.6 17.1
100 1,551
5.0 78.6
15 1,444
.6 57.4
1 521
.1 21.6
3 657
.1 28.7
115 665
5.4 31.3
393 119
16.1 4.9
Washington Total
179 1,730
10.3 100.0
50 1,973
2.5 100.0
0 2,526 100.0
45 2,413
1.9 100.0
240 2,291
10.5 100.0
190 2,125
8.9 99.9
247 2,443
10.1 99.9
Imports: Belgium Canada
0 27 5.7
0 33 12.6
0 10 17.3
0 4 12.1
1 1
20.0 20.0
1 2
20.0 40.0
1 43
2.1 91.5
Chile France
0 2 .5
0 2 .8
0 1 1.7
0 2 8.0
0 1 20.0
0 0
0 1 2.1
Guatemala 0 1 .4 0 0 0 0 0
Italy Mexico
0 410 93.2
0 224 85.8
0 46 79.3
1 25
3.0 75.8
1 1
20.0 20.0
1 0
20.0 1 0
2.1
Netherlands 1 .2 0 0 0 0 0 1 2.1
New Zealand 0 1 .4 1 1.7 1 3.0 0 1 20.0 0
Spain Total
0 440 99.6
0 261 100.0
0 58 100.0
0 33 99.9
0 5 100.0
0 5 100.0
0 47 99.9
'Domestic shipments include those bound for export.
S ceo US Department of Agriculture, Agricultural Marketing Service, Fresh Fruit and Vegetable Shipments. 1984. our . .' ;..... w """
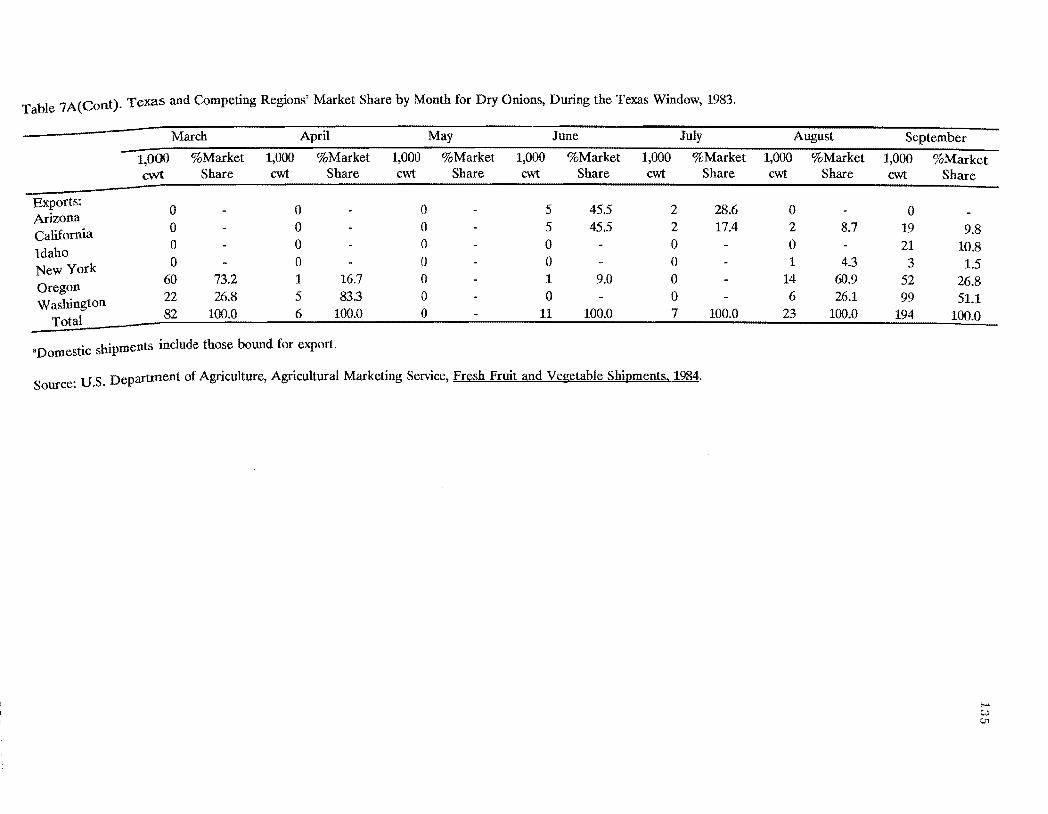
Table 7A(Cont). Texas and Competing Regions' Market Share by Month for Dry Onions, During the Texas Window, 1983.
March April May June July August September
1,000 %Market 1,000 %Market 1,000 %Market 1,000 %Market 1,000 %Market 1,000 %Market 1,000 %Market cwt Share cwt Share cwt Share cwt Share cwt Share cwt Share cwt Share
Exports: Arizona California Idaho New York Oregon Washington
Total
0 0 ()
0 60 22 82
73.2 26.8
100.0
0 0 0 ()
1 5 6
16.7 833
100.0
0 0 ()
()
()
()
0
5 5 0 0 1 0
11
45.5 45.5
9.0
100.0
2 2 0 0 0 0 7
28.6 17.4
100.0
0 2 0 1
14 6
23
8.7
4.3 60.9 26.1
100.0
0 19 21 3
52 99
194
9.8 10.8 1.5
26.8 51.1
100.0
aDomestic shipments include those bound for export.
. U S Department of Agriculture, Agricultural Marketing Service, Fresh Fruit and Vegetable Shipments, 1984.Source. .'
f-' W CJl
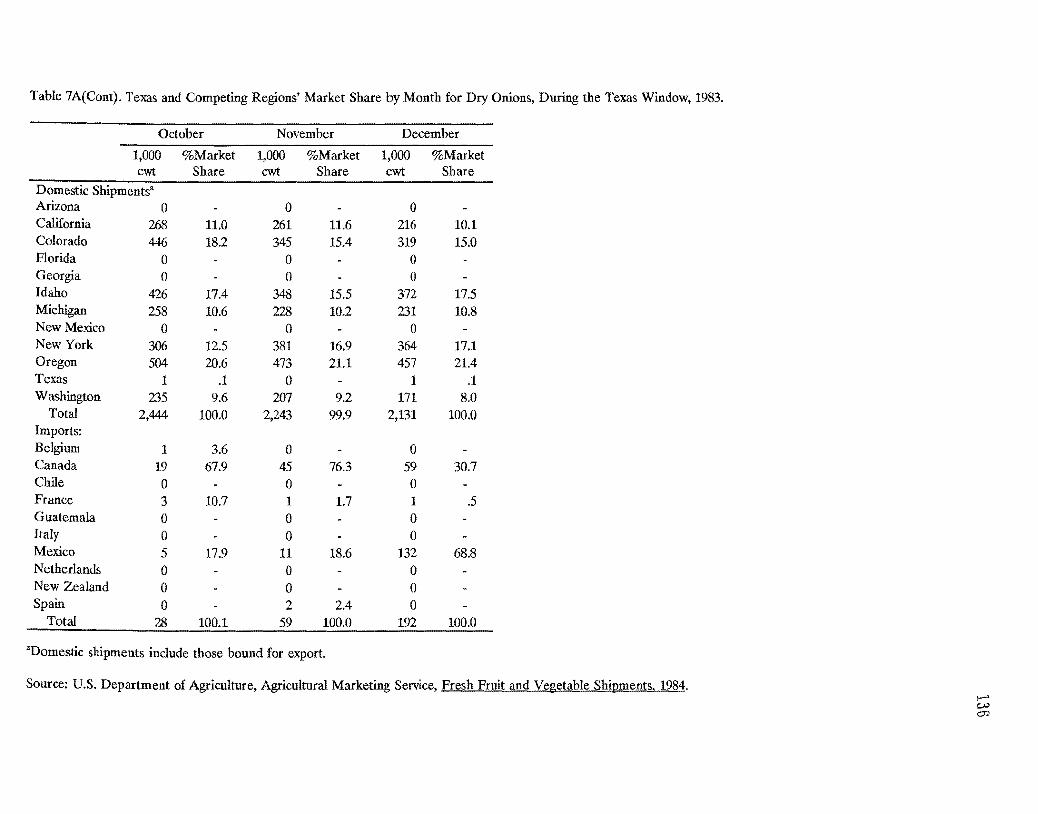
Table 7A(Cont). Texas and Competing Regions' Market Share by Month for Dry Onions, Dming the Texas Window, 1983.
October November December
1,000 %Market 1,000 %Market 1,000 %Market cwt Share cwt Share cwt Share
Domestic Shipments' Arizona 0 0 0 California 268 11.0 261 11.6 216 10.1 Colorado 446 18.2 345 15.4 319 15.0 Florida 0 0 0 Georgia 0 0 0 Idaho 426 17.4 348 15.5 372 17.5 Michigan 258 10.6 228 10.2 231 10.8 New Mexico 0 0 0 New York 306 12.5 381 16.9 364 17.1 Oregon 504 20.6 473 21.1 457 21.4 Texas 1 .1 0 1 .1 Washington 235 9.6 207 9.2 171 8.0
Total 2,444 100.0 2,243 99.9 2,131 100.0 Imports: Belgium 1 3.6 0 0 Canada 19 67.9 45 76.3 59 30.7 Chile 0 0 0 France 3 10.7 1 1.7 1 .5 Guatemala 0 0 0 Italy 0 0 0 Mexico 5 17.9 11 18.6 132 68.8 Netherlands 0 0 0 New Zealand 0 0 0 Spain 0 2 2.4 0
Total 28 100.1 59 100.0 192 100.0
"Domestic shipments include those bound for export.
Source: U.S. Department of Agriculture, Agricultmal Marketing Service, Fresh Fruit and Vegetable Shipments, 1984. t-' c:..:> 0:>
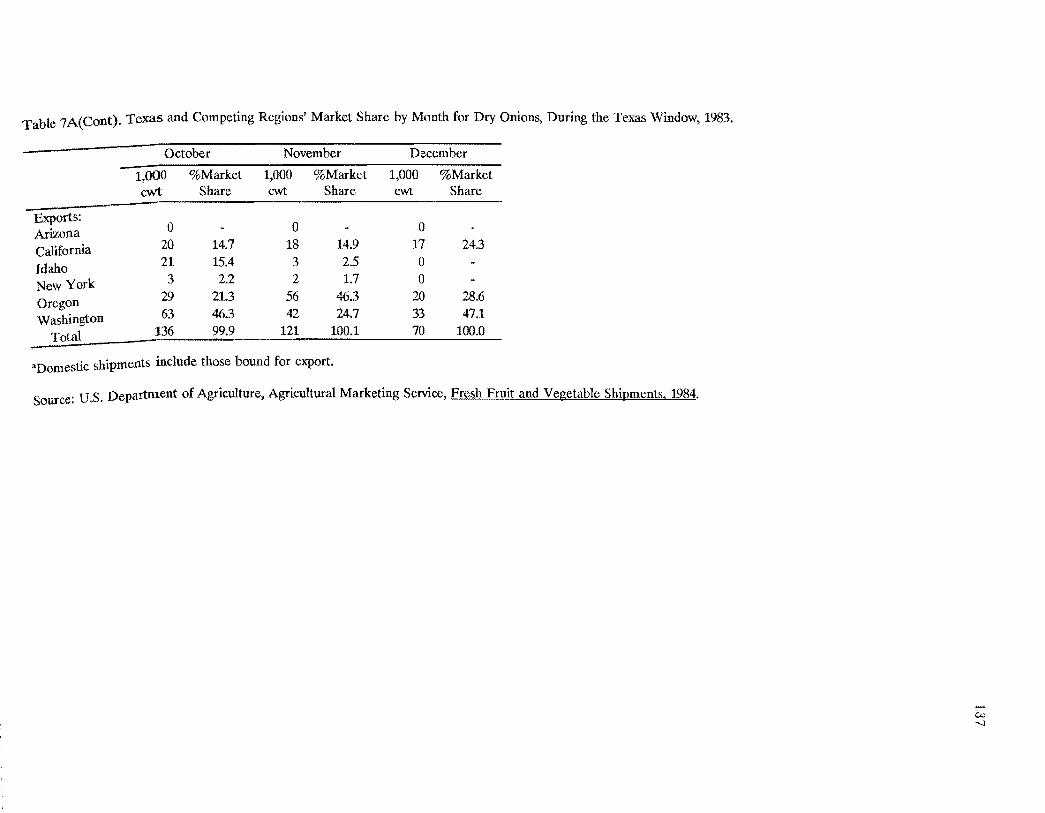
Table 7A(Cont). Texas and Competing Regions' Market Share by Month for Dry Onions, During the Texas Window, 1983.
October November December
1,000 %Market 1,000 %Market 1,000 %Market cwt Share cwt Share cwt Share
Exports: Arizona 0 0 0
California 20 14.7 18 14.9 17 24.3
Idaho 21 15.4 3 2.5 0
New York 3 2.2 2 1.7 0
Oregon Washington
29 63
136
21.3 46.3 99.9
56 42
121
46.3 24.7
100.1
20 33 70
28.6 47.1
100.0Total
aDomestic shipments include those bound for export
Source: U.S. Department of Agriculture, Agricultural Marketing Service, Fresh Fruit and Vegetable Shipments, 1984.
l-' co '-l
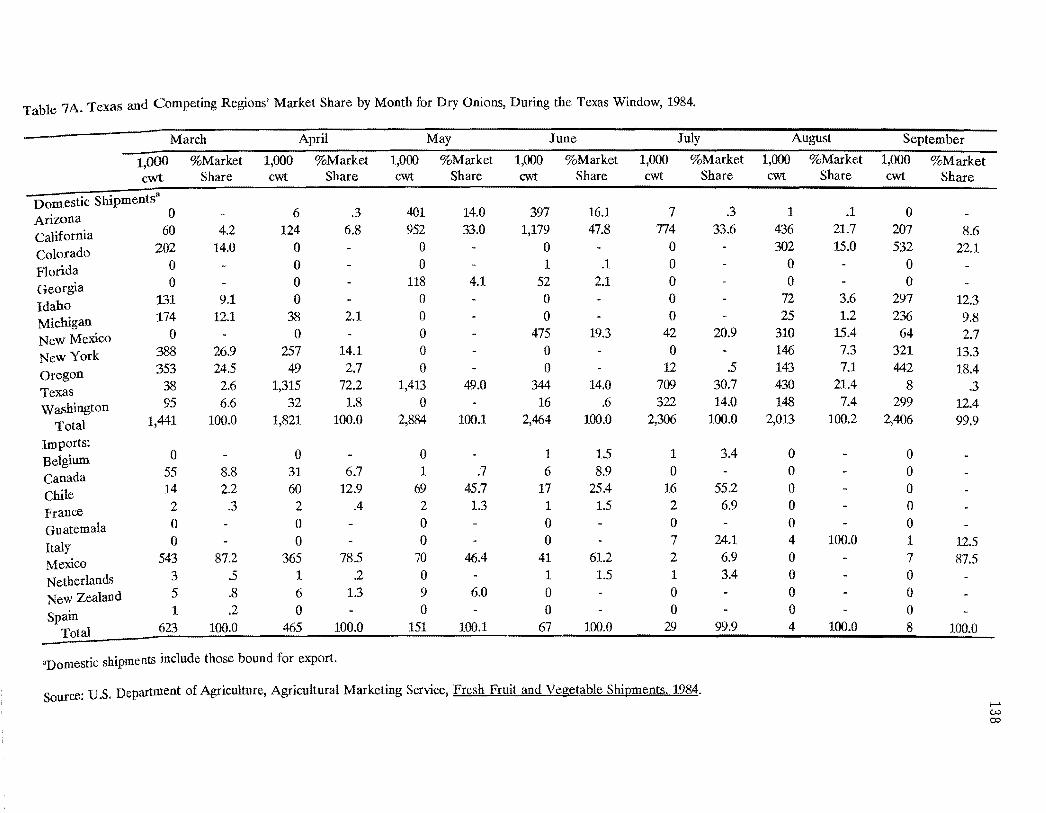
Table 7A. Texas and Competing Regions' Market Share by Month for Dry Onions, During the Texas Window, 1984.
March April May June July August September
1,000 cwt
%Market Share
1,000 cwt
%Market Share
1,000 cwt
%Market Share
1,000 cwt
%Market Share
1,000 cwt
%Market Share
1,000 cwt
%Market Share
1,000 cwt
%Market Share
Domestic Shipments" Araona 0 California 60
colorado 202
Florida 0
Georgia 0
Idaho 131
Michigan 174
New Mexico 0
New York 388
Oregon 353
Texas 38
Washington 95
Total 1,441
4.2 1.4.0
9.1 12.1
26.9 24.5 2.6 6.6
100.0
6 1.24
0 0 0 0
38 0
257 49
1,31.5 32
1,821
.3 6.8
2.1
1.4.1 2.7
72.2 1..8
100.0
401 952
0 0
118 0 0
°0 0
1,413
°2,884
14.0 33.0
4.1
49.0
100.1
397 1,179
0 1
52 0
°475
° °344 1.6
2,464
16.1 47.8
.1 2.1
19.3
1.4.0 .6
1.00.0
7 774
0
°0 0 0
42 0
12 709 322
2,306
.3 33.6
20.9
.5 30.7 14.0
1.00.0
1 436 302
0
°72 25
310 146 143 430 1.48
2,013
.1 21..7 1.5.0
3.6 1.2
15.4 7.3 7.1
21..4 7.4
100.2
0 207 532
0 0
297 236
64 321 442
8 299
2,406
8.6 22.1
12.3 9.8 2.7
13.3 18.4
.3 12.4 99.9
Imports: Belgium Canada Chile France Guatemala
Italy Mexico Netherlands New Zealand
Spain Total
0 55 14 2 0 0
543 3 5 1
623
8.8 2.2
.3
87.2 .5 .8 .2
100.0
°31 60
2
°0 365
1 6
°465
6.7 12.9
.4
78.5 .2
1..3
100.0
0 1
69 2 0 0
70 0 9
°151
.7 45.7
1..3
46.4
6.0
100.1
1 6
17 1 0 0
41 1. 0
°67
1.5 8.9
25.4 1.5
61.2 1.5
100.0
1.
°16 2 0 7 2 1. 0 0
29
3.4
55.2 6.9
24.1 6.9 3.4
99.9
0 0 0 0 0 4 0 0
°0 4
100.0
100.0
0 0 0 0
°1 7 0 0
°8
12.5 87.5
100.0
"Domestic shipments include those bound for export.
Source: U.S. Department of Agriculture, Agricultural Marketing Service, Fresh Fruit and Vegetable Shipments. 1.984. f-' w co
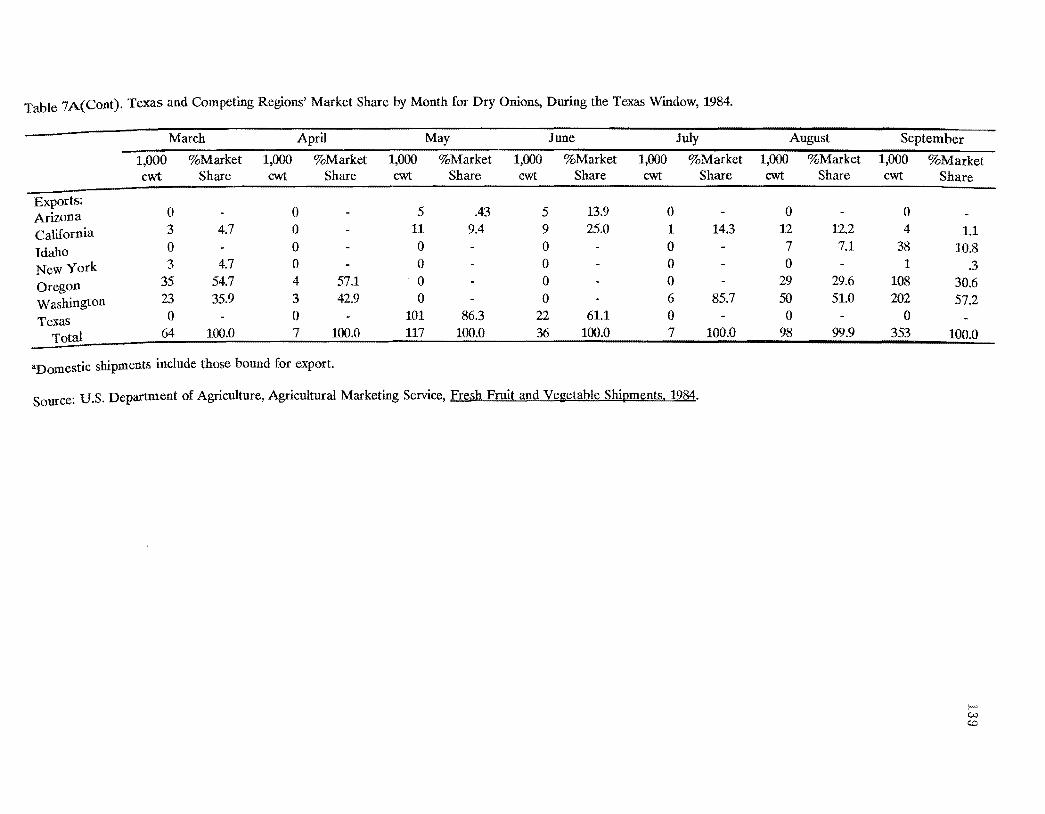
Table 7A(Cont). Texas and Competing Regions' Market Share by Month for Dry Onions, During the Texas Window, 1984.
March April May Juue July August September
1,000 %Market 1,000 %Market 1,000 %Market 1,000 %Market 1,000 %Market 1,000 %Market 1,000 %Market cwt Share cwt Share cwt Share cwt Share cwt Share cwt Share cwt Share
Exports: Arizona California
Idaho New York Oregon Washington Texas
Total
0 3 0 3
35 23 0
64
4.7
4.7 54.7 35.9
100.0
0 0 0 0 4 3 0 7
57.1 42.9
100.0
5 11 0 0 0 0
101 117
.43 9.4
86.3 100.0
5 9 0 0 0 0
22 36
13.9 25.0
61.1 100.0
0 1 0 0 0 6 0 7
14.3
85.7
100.0
0 12 7 0
29 50 0
98
12.2 7.1
29.6 51.0
99.9
0 4
38 1
108 202
0 353
1.1 10.8
.3 30.6 57.2
100.0
aDomestic shipments include those bouud for export.
Source: U.S. Department of Agriculture, Agricultural Marketing Service, Fresh Fruit and Vegetable Shipments. 1984.
I-' c..o co

Table 7A. Texas and Competing Regions' Market Share by Month for Dry Onions, During the Texas Window, 1985.
March April May June July August September
1,000 %Market 1,000 %Market 1,000 %Market 1,000 %Market 1,000 %Market 1,000 %Market 1,000 %Market cwt Share cwt Share cwt Share cwt Share cwt Share cwt Share cwt Share
Domestic Shipmentsa
Arizona o o 260 8.9 270 11.7 24 1.1 o o California 26 1.5 73 4.0 1,207 41.3 1,122 48.8 1,037 48.4 462 22.1 179 7.7
Colorado 279 16.3 175 9.5 o o 21 1.0 392 18.8 556 24.0
Florida 1 .1 1 .1 2 .1 o o o o Georgia Idaho
o 230 13.4
o 40 2.2
128 o
4.4 37 o
1.6 o o
o 195 9.3
o 252 10.9
Michigan New Mexico
252 o
14.7 82 o
4.5 o 22 .8
o 601 26.1
o 381 17.8
23 255
1.1 12.2
195 59
8.4 2.5
New York 254 14.8 207 11.3 o o 8 .4 37 1.8 441 19.0
Oregon Texas
407 98
23.7 5.7
115 1,044
6.3 56.8
35 1,270
1.2 43.4
o 233 10.1
16 414
.7 19.3
283 326
13.6 15.6
410 13
17.7 .6
Washington
Utah
158 11
9.2 .6
o 101 5.5
o o
o 38 1.7
o 240 11.2
1 114
.1 5.5
70 144
3.1 6.2
Total 1,716 100.0 1,838 100.2 2,924 100.1 2,301 100.0 2,141 99.9 2,088 100.1 2,319 100.1
Imports; Belgium Canada
o 27 5.2
1 28
.4 9.9
1 22
.6 12.4
1 40
1.2 48.2
o 47 49.0
o 28 46.7
1 9
6.7 60.0
Chile 10 1.9 7 2.5 8 4.5 o 1 1.0 o o France 5 1.0 4 1.4 2 1.1 2 2.4 1 1.0 1 1.7 2 13.3
Guatemala o o o o o o o Italy Mexico
o 466 90.0
o 237 83.7
o 140 79.1
1 36
1.2 43.4
1 46
1.0 48.0
1 17
1.7 28.3
1 o
6.7
Netherlands 1 .2 o o o o 1 o New Zealand 9 1.7 6 2.1 4 2.3 2 2.4 o 1 1.7 o Spain Israel
o o
o o
o o
o 1 1.2
o o
11 o
1.7 18.3
2 o
13.3
Total 518 100.0 283 100.0 177 100.0 83 100.0 96 100.0 60 100.1 15 100.0
'Domestic shipments include those bound for export.
Source: U.S. Department of Agriculture, Agricultural Marketing Service, Fresh Fruit and Vegetable Shipments. 1985. ,...,.,. o

Table 7A(Cont). Texas and Competing Regions' Market Share by Month for Dry Onions, During the Texas Window, 1985.
March April May June July August September
1,000 %Market 1,000 %Market 1,000 %Market 1,000 %Market 1,000 %Market 1,000 %Market 1,000 %Market cwt Share cwt Share cwt Share cwt Share cwt Share cwt Share cwt Share
Exports: Arizona California
Idaho New York
Oregon Texas Washington
Total
0 0 0 0
29 0
30 59
49.2
50.8 100.0
0 0
0 0 2
9 22 33
6.1 27.3 66.6
100.0
0 0 0 0 0
67 0
67
100.0
100.0
0 0 0 0 1 1 0 2
50.0 50.0
100.0
0 0 0 0 0 0 0 0
0 0 0 1
14 0
21 36
2.7 38.9
58.3 99.9
0 0
0 0 9 0
28 37
24.3
75.7 100.0
aDomestic shipments include those bound for export.
Source: U.S. Department of Agriculture, Agricultural Marketing Service, Fresh Fruit and Vegetable Shioments. 1985.
...... I->"'"

Table 7A. Texas and Competing Regions' Market Share by Month for Dry Onions, During the Texas Window, 1986.
February March April May June July August
1,000 %Market 1,000 %Market 1,000 %Market 1,000 %Market 1,000 %Market 1,000 %Market 1,000 %Market cwt Share cwt Share cwt Share cwt Share cwt Share cwt Share cwt Share
Domestic Shipments" Arizona 0 California 83
Colorado 255
Georgia 0
Idaho 322
Michigan 187
New Mexico 0
New York 308
Oregon 645
Texas 3
Utah 73
Washington 171
Total 2,047
4.1 12.5
15.7 9.1
15.0 31.5
.1 3.6 8.4
100.0
0 73
211 0
319 190
0 343 392 263
16 133
1,940
3.8 10.9
16.4 9.8
17.7 20.2 13.5
.8 6.9
100.0
0 236 38 13 66 38
0 252 113
1,730 0
45 2,531
9.3 1.5
.5 2.6 1.5
9.9 4.5
68.4
1.8 100.0
401 1,032
0 218
0 0
25 0 0
1,137 0 8
2,821
14.2 36.6
7.7
.9
40.3
.3 100.0
136 1,058
0 49 0 0
635 0 1
458 0
34 2,371
5.7 44.6
2.1
26.8
.1 19.3
1.4 100.0
0 1,066
34 0 0 0
576 4
15 912
0 196
2,803
38.0 1.2
20.5 .1 .5
32.5
7.0 99.8
1 529 423
0 109 37
373 264 251 327
1 157
2,472
.1 21.4 17.1
4.4 1.5
15.1 10.7 10.2 13.2
.1 6.4
100.2
Imports: Belgium Canada Chile France Guatemala Israel Mexico Netherlands New Zealand Others
Total
84 0 6 0 0 0
170 1 0 0
261
32.2
2.3
65.1 .4
100.0
74 1 2 0 0 0
452 1
10 0
540
13.7 .2 .4
83.7 .2
1.9
100.1
44 2 2 0 0 0
138 0 1 0
187
23.5 1.1 1.1
73.8
.5
100.0
12 0 1 1 0 0
87 1 0 0
102
11.8
1.0 1.0
85.3 1.0
100.1
10 0 0 1 0 0
37 0 0 1
49
20.4
2.0
75.5
2.0 99.9
9 6 1 1 1 2
18 0 0 1
39
23.1 15.4 2.6 2.6 2.6 5.1
46.2
2.6 100.2
12 0 2 2 1 1 0 2 0 1
21
57.1
9.5 9.5 4.8 4.8
9.5
4.8 100.0
'Domestic shipments include those bound for export.
source: U,S, Department of Agriculture, Agricultural Marketing Service, Fresh Fruit and Vegetable Shipments. 1986.
f
*'"N

Table 7A(Cont). Texas and Competing Regions' Market Share by Month for Dry Onions, During the Texas Window, 1986.
February March April May June July August
1,000 %Market 1,000 %Market 1,000 %Market 1,000 %Market 1,000 %Market 1,000 %Market 1,000 %Market cwt ShareShare cwt Share cwt Share cwt Share cwt Share cwt Share cwt
Exports: California
Idaho New York
Oregon Texas Washington
Total
2
8 0
147 0
58 215
.9 3.7
68.4
27.0 100.0
a 0 0
43 0
27 70
61.4
38.6 100.0
a 0 0 2
27 17 46
4.3 58.7 37.0
100.0
7 0 a 0
78 2
87
8.0
89.7 2.3
100.0
1
0 0 0 0 0 1
100.0
100.0
53 0 0 1 0
20 74
71.6
1.4
27.0 100.0
47 3 0
27 0
32 109
43.1 2.8
24.8
29.3 100.0
"Domestic shipments include those bound for export.
Source: U.S. Department of Agriculture, Agriultural Marketing Service, Fresh Fruit and Vegetable Shioments. 1986.
..... CI,) "'"

Table 7A. Texa~and Competing Regions' Market Share by Month for Dry Onions, During the Texas Window, 1987.
March April May June July August
1,000 %Market 1,000 %Market 1,000 %Market 1,000 %Market 1,000 %Market 1,000 %Market cwt Share cwt Share cwt Share cwt Share cwt Share cwt Share
Domestic Shipmentsa 0 0 351 11.6 175 6.7 4 .2 0Arizona
130 7.7 224 12.5 1,151 37.9 1,189 45.2 1,255 47.2 534 21.2California 16 1.0 0 0 0 58 2.2 500 19.9Colorado 0 8 .4 1 .1 0 0 0Florida 0 28 1.6 279 9.2 62 2.4 0 0Georgia
236 14.0 40 2.2 0 0 2 .1 137 5.4Idaho 105 6.2 0 0 0 0 105 4.2Michigan
0 0 3 .1 695 26.4 527 19.8 337 13.4New Mexico 343 20.5 140 7.8 0 0 3 .1 179 7.1New York 622 37.1 69 3.9 0 15 .6 44 1.6 344 13.7Oregon 78 4.7 1,267 70.7 1,253 41.2 320 12.2 440 16.5 207 8.2Texas 0 0 0 0 0 4 2Utah
147 8.8 16 .9 0 174 6.6 328 12.3 170 6.8Washington 1,677 100.0 1,792 100.0 3,038 100.1 2,630 100.1 2,661 100.0 2,517 100.1Total
Imports: 1 .1 1 .1 0 0 1 2.8 1 5.6Belgium
46 5.3 26 3.9 0 0 1 2.8 12 66.6Canada 35 4.1 143 21.4 28 32.9 0 0 0Chile
1 .1 0 0 0 0 0Dominican Republic 4 .5 2 .3 1 1.2 1 1.6 1 2.8 3 16.6France 2 .2 2 3 2 2.4 2 3.2 1 2.8 1 5.6Guatemala 0 0 0 0 0 0Israel
759 88.3 482 72.3 49 57.6 59 93.7 31 86.1 0Mexico 1 .1 2 3 2 2.4 1 1.6 1 2.8 1 5.6Netherlands 9 1.0 7 1.0 3 3.5 a 0 0New Zealand 1 .1 1 .1 0 0 0 0Spain 1 .1 1 .1 0 0 0 0Taiwan
860 99.9 667 99.8 85 100.0 63 100.1 36 100.1 18 100.0Total
"Domestic shipments include those bound for export. I->
Source: U.S. Department of Agriculture, Agricultural Marketing Service, FreslLFruit and VJ.<geJ:able Shipments. 1987. """ """

Table 7A(Cont). Texas and Competing Regions' Market Share by Month for Dry Onions, During the Texas Window, 1987. - March April May June July August
1,000 %Market 1,000 %Market 1,000 %Market 1,000 %Market 1,000 %Market 1,000 %Market ewt Share cwt Share cwt Share cwt Share ewt Share ewt Share
Exports: California Idaho New York Oregon Washington
Total
6 0 0
21 17 44
13.6
47.7 38.6 99.9
0 0 0 3 2 5
60.0 40.0
100.0
6 0 0 0 0 6
100.0
100.0
5 0 0 6 8
19
26.3
31.6 42.1
100.0
4 0 0 2
18 24
16.7
8.3 75.0
100.0
2 o o
19 18 39
5.1
48.7 46.2
100.0
"Domestic shipments include those bound for export.
S . U S Department of Agriculture, Agricultural Marketing Service, Fresh Fruit and Ve2.etable Shipments. 1987. ource. .'
..... ~ Q1

Table 7A. Texas and Competing Regions' Market Share by Month for Dry Onions, During the Texas Window, 1988.
March April May June July August
1,000 %Market 1,000 %Market 1,000 %Market 1,000 %Market 1,000 %Market 1,000 %Market cwt Share cwt Share cwt Share cwt Share cwt Share cwt Share
Domestic Shipmentsa
Arizona 0 0 264 8.9 227 8.5 12 .5 0
California 47 2.5 249 12.0 1,027 34.8 1,206 45.0 1,142 45.0 646 23.9
Colorado 87 4.6 0 0 0 30 1.2 629 23.2
Florida 0 1 .1 2 .1 0 0 0
Georgia Idaho
0 274 14.5
94 27
4.5 1.3
322 0
10.9 50 0
1.9 0 0
0 95 3.5
Michigan New Mexico
120 0
6.3 1 0
.1 0 5 .2
0 696 26.0
0 608 24.0
23 484
.9 17.9
New York 372 19.7 180 8.7 0 0 0 130 4.8
Oregon Texas
646 169
34.1 8.9
65 1,394
3.1 67.1
0 1,332 45.1
0 408 15.2
11 383
.4 15.1
289 310
10.7 11.5
Utah 0 0 0 0 0 1 .1
Washington 178 9.4 66 3.2 0 92 3.4 348 13.7 98 3.6
Total 1,893 100.0 2,077 100.1 2,952 100.0 2,679 100.0 2,534 99.9 2,704 100.1
Imports: Belgium Canada
1 67
.1 6.4
0 18 2.4
0 1 .8
1 2
3.1 6.2
1 3
9.1 27.3
1 7
6.7 46.7
Chile 11 1.1 34 4.5 28 23.5 0 0 0
France 4 .4 3 .4 2 1.7 1 3.1 1 9.1 3 20.0
Guatemala 2 .2 2 .3 2 1.7 3 9.4 1 9.1 2 13.3
Mexico 951 90.8 689 91.6 84 70.6 24 75.0 4 36.4 a Netherlands 2 .2 0 1 .8 1 3.1 1 9.1 2 13.3
New Zealand 9 .9 6 .8 1 .8 0 a 0
Total 1,047 100.1 752 100.0 119 99.9 32 100.0 11 100.1 15 100.0
Exports: California 0 0 0 0 0 12 10.3
Colorado 0 0 0 0 0 20 17.2
Oregon Washington
28 14
66.7 33.3
8 6
57.1 42.9
0 0
0 2 100.0
1 29
3.3 96.7
49 35
42.2 30.2
Total 42 100.0 14 100.0 0 2 100.0 30 100.0 116 99.9 I-"
""'" "Domestic shipments include those bound for export. OJ
Source: U.S. Department of Agriculture, Agricultural Marketing Service, Eresh Fruit and Vegetable Shipments. 1988.

Table SA. Texas and Competing Regions' Market Share by Month for Tomatoes, During the Texas Window, 1983.
January February April May June November December
1,000 %Market 1,000 %Market 1,000 %Market 1,000 %Market 1,000 %Market 1,000 %Market 1,000 %Marke t
cwt Share cwt Share cwt Share cwt Share cwt Share cwt Share cwt Share
Domestic Shipments·
California 18 1.2 0 0 158 7.5 372 14.6 417 22.6 92 5.0
Florida 1,489 98.1 1,103 99.7 1,155 99.7 1,872 89.3 1,746 68.9 1,407 76.1 1,722 92.8
Georgia 0 0 0 0 66 2.6 0 0
Michigan 0 0 0 0 0 0 0
North Carolina 0 0 0 0 0 0 0
South Carolina 0 0 0 0 311 12.3 0 0
Texas 11 .7 3 .3 1 .1 67 3.2 40 1.6 25 1.3 41 2.2
Puerto Rico 0 0 2 .2 0 0 0 0
Total 1,518 100.0 1,106 100.0 1,158 100.0 2,097 100.0 2,535 100.0 1,849 100.0 1,855 100.0
Exports:
California 0 0 0 0 2 100.0 2 100.0 0
Imports:
Canada 0 0 0 2 .2 1 .4 0 0
Dominican Republic 0 1 .1 2 .1 3 .4 0 0 0
Israel 0 0 1 .1 0 0 0 0
Jamaica 0 0 1 .1 3 .4 1 .4 0 0
Mexico 728 100.0 806 99.9 1,442 99.7 807 99.9 226 99.2 303 100.0 173 100.0
Total 728 100.0 807 100.0 1,446 100.0 815 100.0 228 100.0 303 100.0 173 100.0 f-'
*'"'-l
"Domestic shipments include those bound for export.
Source: U.S. Department of Agriculture, Agricultural Marketing Service, Fresh FJuit and Vegetable Shipments. 1983.
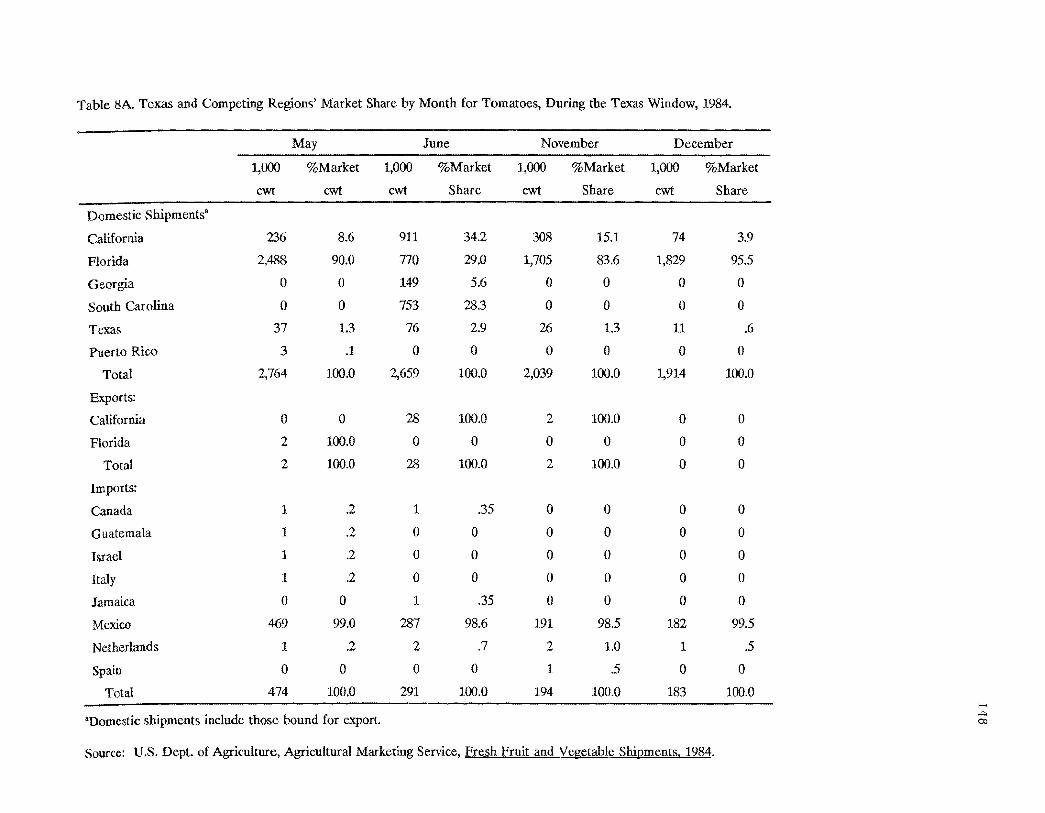
Table 8A. Texas and Competing Regions' Market Share by Month for Tomatoes, During the Texas Window, 1984.
May June November December
1,000 %Market 1,000 %Market 1,000 %Market 1,000 %Market
cwt cwt cwt Share cwt Share cwt Share
Domestic Shipments'
California 236 8.6 911 34.2 308 15.1 74 3.9
Florida 2,488 90.0 770 29.0 1,705 83.6 1,829 95.5
Georgia 0 0 149 5.6 0 0 0 0
South Carolina 0 0 753 28.3 0 0 0 0
Texas 37 1.3 76 2.9 26 1.3 11 .6
Puerto Rico 3 .1 0 0 0 0 0 0
Total 2,764 100.0 2,659 100.0 2,039 100.0 1,914 100.0
Exports:
California 0 0 28 100.0 2 100.0 0 0
Florida 2 100.0 0 0 0 0 0 0
Total 2 100.0 28 100.0 2 100.0 0 0
Imports:
Canada 1 .2 1 .35 0 0 0 0
Guatemala 1 .2 0 0 0 0 0 0
Israel 1 .2 0 0 0 0 0 0
Italy 1 .2 0 0 0 0 0 0
Jamaica 0 0 1 .35 0 0 0 0
Mexico 469 99.0 287 98.6 191 98.5 182 99.5
Netherlands 1 .2 2 .7 2 1.0 1 .5
Spain 0 0 0 0 1 .5 0 0
Total 474 100.0 291 100.0 194 100.0 183 100.0 i-"
"Domestic shipments include those bound for export. >-I:> co
Source: U.S. Dept. of Agriculture, Agricultural Marketing Service, Fre_sh Fruit and Vegetable Shipments. 1984.

Table SA. Texas and Competing Regions' Market Share by Month for Tomatoes, During the Texas Window 1985.
May June November December
1,000 %Market 1,000 %Market 1,000 %Market 1,000 %Market
cwt cwt cwt Share cwt Share cwt Share
Domestic Shipmentsa
California 26 .8 593 22.6 496 25.5 87 5.9
Florida 3,284 98.6 1,020 38.9 1,423 73.1 1,353 91.4
Georgia 2 .1 138 5.2 0 0 0 0
South Carolina 0 0 818 31.2 0 0 0 ° Texas 17 .5 55 2.1 27 1.4 41 2.7
Total 3,329 100.0 2,624 100.0 1,946 100.0 1,481 100.0
Exports:
California 0 0 27 100.0 9 100.0 0 0
Imports:
Belgium 0 0 0 0 1 .3 0 0
Canada 2 .7 6 2.6 0 0 0 0
Dominican Republic 18 6.4 3 1.3 0 0 0 0
Israel 2 .7 0 0 0 0 1 .3
Italy 0 0 0 0 2 .5 0 0
Mexico 259 91.5 219 94.8 359 98.4 389 99.2
Netherlands 2 .7 3 .1 3 .8 2 .5
Total 283 100.0 231 100.0 365 100.0 392 100.0
aDomestic shipments include those bound for export.
Source: U.S. Dept. of Agriculture, Agricultural Marketing Service, Fresh Fruit and Vegetable Shipments. 1985.
,... "'" co

Table 8A. Texas and Competing Regions' Market Share by Month for Tomatoes, During the Texas Window, 1986.
January April May June November December
1,000 %Market 1,000 %Market 1,000 %Market 1,000 %Market 1,000 %Market 1,000 %Market
cwt Share cwt Share cwt Share cwt Share cwt Share cwt Share
Domestic Shiprnentsa
California 14 1.1 0 163 5.2 417 15.0 515 27.5 66 3.1
Florida 1,318 97.8 1,835 99.2 2,888 91.5 1,551 55.8 1,346 71.7 2,067 95.9
Georgia 0 0 0 166 6.0 0 0
Michigan 0 0 0 5 .2 0 0
South Carolina 0 0 0 621 22.4 0 0
Texas 15 1.1 7 .4 105 3.3 16 .6 15 .8 22 1.0
Puerto Rico 0 7 .4 0 0 0 0
Total 1,347 100.0 1,849 100.0 3,156 100.0 2,776 100.0 1,876 100.0 2,155 100.0
Imports:
Belgium 0 1 .1 0 0 0 0
Canada 0 1 .1 3 .9 10 3.8 1 .2 0
Dominican Republic 1 .1 72 5.6 21 6.5 13 4.9 2 .35 1 .3
France 0 1 .1 1 .3 0 0 0
Israel 4 .2 2 .7 0 0 0 0
Italy 1 .1 0 0 1 .4 2 .35 0
Malaysia 0 0 0 0 0 0
Mexico 1,566 99.5 1,200 93.7 298 91.4 238 89.4 556 98.9 316 99.4
Netherlands 1 .1 2 .2 3 .9 4 1.5 1 .2 1 .3
Venezuela 0 1 .1 0 0 0 0
Total 1,573 100.0 1,280 100.1 326 100.0 266 100.0 562 100.0 318 100.0
"Domestic shipments include those bound for export.
Source: U.S. Dept. of Agriculture, Agricultural Marketing Service, Fresh Fruit and Vegetable Shipments, 1986. ;..... c.n 0

Table SA. Texas and Competing Regions' Market Share by Month for Tomatoes, During the Texas Window, 1987.
January February May June November December
1,000 %Market 1,000 %Market 1,000 %Market 1,000 %Market 1,000 %Market 1,000 %Market
cwt Share cwt Share cwt Share cwt Share cwt Share ewt Share
Domestic Shiprnents·
California 7 .5 0 90 3.0 673 25.5 398 22.7 17 .8
Florida
South Carolina
1,495
0
98.2 959
0
99.9 2,877
0
96.0 1,385
549
52.4
20.8
1,270
0
72.5 2,022
0
96.5
Texas
Total
20
1,522
1.3
100.0
1
960
.1
100.0
29
2,9%
1.0
100.0
35
2,642
1.3
100.0
84
1,752
4.8
100.0
57
2,096
2.7
100.0
Exports:
California 0 0 0 40 100.0 8 100.0 0
Imports:
Belgium
Canada
Dominican Republic
Israel
Italy
Mexico
Netherlands
0
0
1
1
1
1,271
0
.1
.1
.1
99.7
0
0
35
4
1
1,516
0
2.2
.3
.1
97.4
0
10
0
1
0
436
3
2.2
.2
96.9
.7
0
13
0
1
0
370
5
3.3
.3
95.1
1.3
1
1
0
2
0
384
3
.3
.3
.5
98.2
.7
0
0
0
2
1
262
2
.75
.4
98.1
.75
Spain
Total
0
1,274 100.0
1
1,557
.1
100.1
0
450 100.0
0
389 100.0
0
391 100.0
0
267 100.0
"Domestic shipmcnts include those bound for cxport.
Source: U.S. Dept. of Agriculture, Agricultural Marketing Service, Fresh FruiLand Vegetable Shipments. 1987.
..... (J1
.....
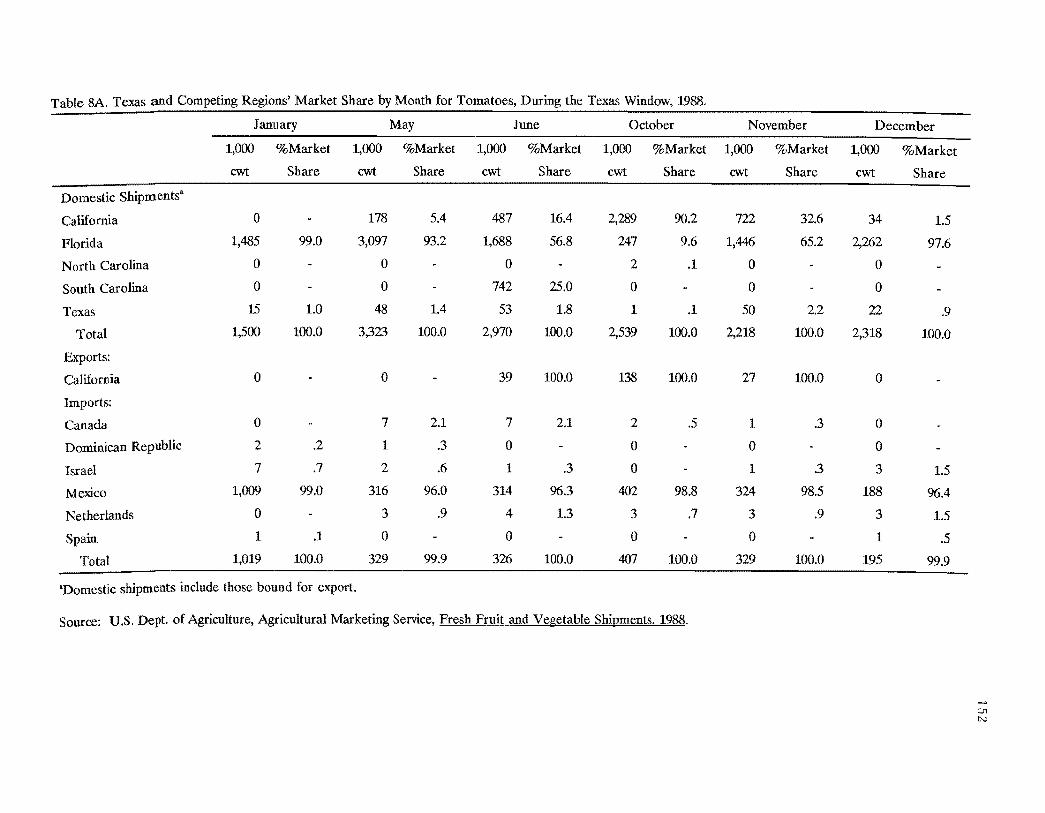
Table 8A. Texas and Competing Regions' Market Share by Month for Tomatoes, During the Texas Window, 1988.
January May June October November December
1,000 %Market 1,000 %Market 1,000 %Market 1,000 %Market 1,000 %Market 1,000 %Market
cwt Share cwt Share cwt Share cwt Share cwt Share cwt Share
Domestic Shipmentsa
California 0 178 5.4 487 16.4 2,289 90.2 722 32.6 34 1.5
Florida 1,485 99.0 3,097 93.2 1,688 56.8 247 9.6 1,446 65.2 2,262 97.6
North Carolina 0 0 0 2 .1 0 0
South Carolina 0 0 742 25.0 0 0 0
Texas 15 1.0 48 1.4 53 1.8 1 .1 50 2.2 22 .9
Total 1,500 100.0 3,323 100.0 2,970 100.0 2,539 100.0 2,218 100.0 2,318 100.0
Exports:
California 0 0 39 100.0 138 100.0 27 100.0 0
Imports:
Canada 0 7 2.1 7 2.1 2 .5 1 .3 0
Dominican Republic 2 .2 1 .3 0 0 0 0
Israel 7 .7 2 .6 1 .3 0 1 .3 3 1.5
Mexico 1,009 99.0 316 96.0 314 %.3 402 98.8 324 98.5 188 %.4
Netherlands 0 3 .9 4 1.3 3 .7 3 .9 3 1.5
Spain 1 .1 0 0 0 0 1 .5
Total 1,019 100.0 329 99.9 326 100.0 407 100.0 329 100.0 195 99.9
for export.
Source: U.s. Dept. of Agriculture, Agricultural Marketing Service, Fresh Fruit and Vegetable Shiornents. 1988.
f-> c.n w

Table 9A. Texas and Competing Regions' Market Share by Month for Cantaloupes, During the Texas Window, 1983.
May June July August September October November
1,000 %Market 1,000 %Market 1,000 %Market 1,000 %Market 1,000 %Market 1,000 %Market 1,000 %Market
cwt Share cwt Share cwt Share cwt Share cwt Share cwt Share cwt Share
Domestic Shipments
Arizona
California
3
94
.57
17.94
406
1,705
11.46
48.12
628
2,162
19.57
67.44
31
2,651
1.08
92.08
24
1,776
1.30
96.00
89
667
11.77
88.23
5
202
2.42
97.58
Colorado 0 0 0 111 3.86 29 1.56 0 0
Florida 0 0 0 0 0 a 0
Texas
Total
427
524
81.49
100.0
1,432
3,543
40.42
100.0
417
3,209
12.99
100.0
86
2,879
2.98
100.0
21
1,850
1.14
100.0
0
756 100.0
a 207 100.0
Imports:
Chile
Costa Rica
Dominican Republic
Honduras
0
a 38
a 3.75
0
a 1
a 3.13
0
a a 0
0
a 0
0
a a 0
0
a 0
0
a
0
1
0
0
4.76
Mexico 974 96.25 31 96.87 10 100 a 1 100 1 100 20 95.24
Total 1,012 100.0 32 100.0 10 100.0 a 1 100.0 1 100.0 21 100.0
Exports:
Arizona 0 1 4.00 1 2.33 0 a 0 a
California 1 100.0 24 96.00 42 97.67 48 100.0 18 100.0 1 100.0 1 100.0
Total 1 100.0 25 100.0 43 100.0 48 100.0 18 100.0 1 100.0 1 100.0
Source: U.S. Department of Agriculture, Agricultural Marketing Service, Fresh Fruit and Vegetable Shipments, 1983. l-" <:.n w
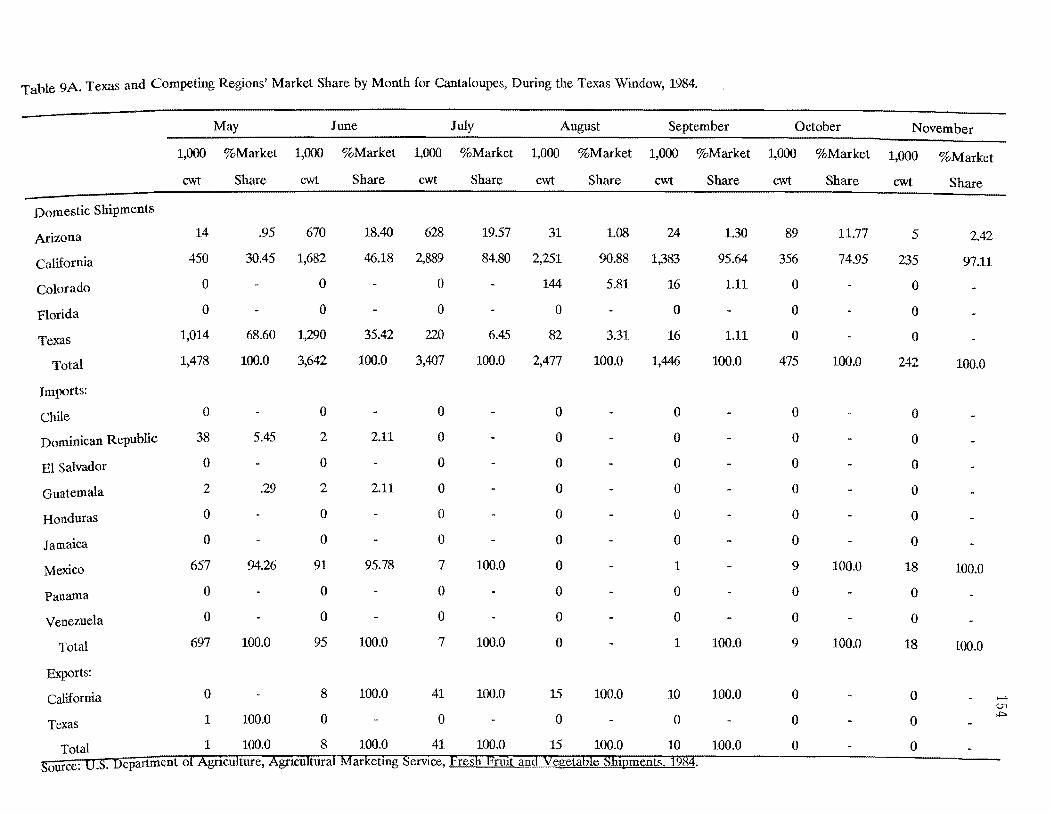
Table 9A. Texas and Competing Regions' Market Share by Month for Cantaloupes, During the Texas Window, 1984.
May June July August September October November
1,000 %Market 1,000 %Market 1,000 %Market 1,000 %Market 1,000 %Market 1,000 %Market 1,000 %Market
cwt Share cwt Share cwt Share cwt Share cwt Share cwt Share cwt Share
Domestic Shipments
Arizona 14 .95 670 18.40 628 19.57 31 1.08 24 1.30 89 11.77 5 2.42
California 450 30.45 1,682 46.18 2,889 84.80 2,251 90.88 1,383 95.64 356 74.95 235 97.11
Colorado 0 0 0 144 5.81 16 1.11 0 0
Florida 0 0 0 0 0 0 0
Texas 1,014 68.60 1,290 35.42 220 6.45 82 3.31 16 1.11 0 0
Total 1,478 100.0 3,642 100.0 3,407 100.0 2,477 100.0 1,446 100.0 475 100.0 242 100.0
Imports:
Chile 0 0 0 0 0 0 0
Dominican Republic 38 5.45 2 2.11 0 0 0 0 0
El Salvador 0 0 0 0 0 0 0
Guatemala 2 .29 2 2.11 0 0 0 0 0
Honduras 0 0 0 0 0 0 0
Jamaica 0 0 0 0 0 0 0
Mexico 657 94.26 91 95.78 7 100.0 0 1 9 100.0 18 100.0
Panama 0 0 0 0 0 0 0
Venezuela 0 0 0 a 0 0 0
Total 697 100.0 95 100.0 7 100.0 0 1 100.0 9 100.0 18 100.0
Exports:
California 0 8 100.0 41 100.0 15 100.0 10 100.0 0 0 f-' tTl
Texas 1 100.0 0 0 0 0 0 0 0+::>
Total 1 100.0 8 100.0 41 100.0 15 100.0 10 100.0 0 0 Source: O.S. Department of Agnculture, Agncultural MarketIng SefVIce, Fresh FrUIt and Vegetable ShIpments. 1984.
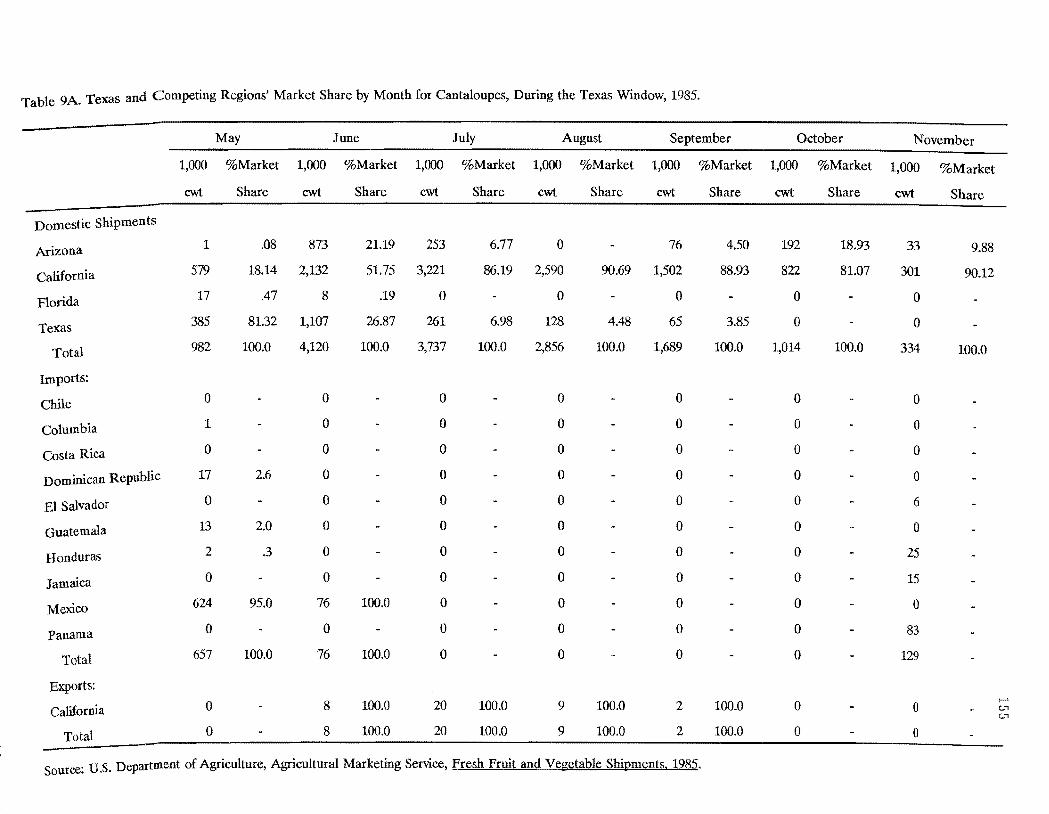
Table 9A. Texas and Competing Regions' Market Share by Month for Cantaloupes, During the Texas Window, 1985.
May June July August September October November
1,000 %Market 1,000 %Market 1,000 %Market 1,000 %Market 1,000 %Market 1,000 %Market 1,000 %Market
cwt Share eM Share cwt Share cwt Share eM Share eM Share cwt Share
Domestic Shipments
Arizona 1 .08 873 21.19 253 6.77 0 76 4.50 192 18.93 33 9.88
California 579 18.14 2,132 51.75 3,221 86.19 2,590 90.69 1,502 88.93 822 81.07 301 90.12
Florida 17 .47 8 .19 ° 0 0 0 0
Texas 385 81.32 1,107 26.87 261 6.98 128 4.48 65 3.85 0 0
Total 982 100.0 4,120 100.0 3,737 100.0 2,856 100.0 1,689 100.0 1,014 100.0 334 100.0
Imports:
Chile 0 0 ° 0 0 0 0
Columbia 1 0 0 0 0 0 0
Costa Rica 0 0 ° 0 0 a 0
Dominican Republic 17 2.6 0 0 0 a 0 0
EI Salvador ° a a a 0 0 6
Guatemala 13 2.0 0 0 0 0 0 0
Honduras 2 .3 0 0 0 0 a 25
Jamaica 0 0 0 0 0 0 15
Mexico 624 95.0 76 100.0 0 0 0 0 0
Panama 0 0 0 0 a a 83
Total 657 100.0 76 100.0 a a a a 129
Exports:
California ° 8 100.0 20 100.0 9 100.0 2 100.0 a 0 f-' c.n c.n
Total ° 8 100.0 20 100.0 9 100.0 2 100.0 a 0
Source: U.S. Department of Agriculture, Agricultural Marketing Service, Fresh Fruit and Vegetable Shioments. 1985.
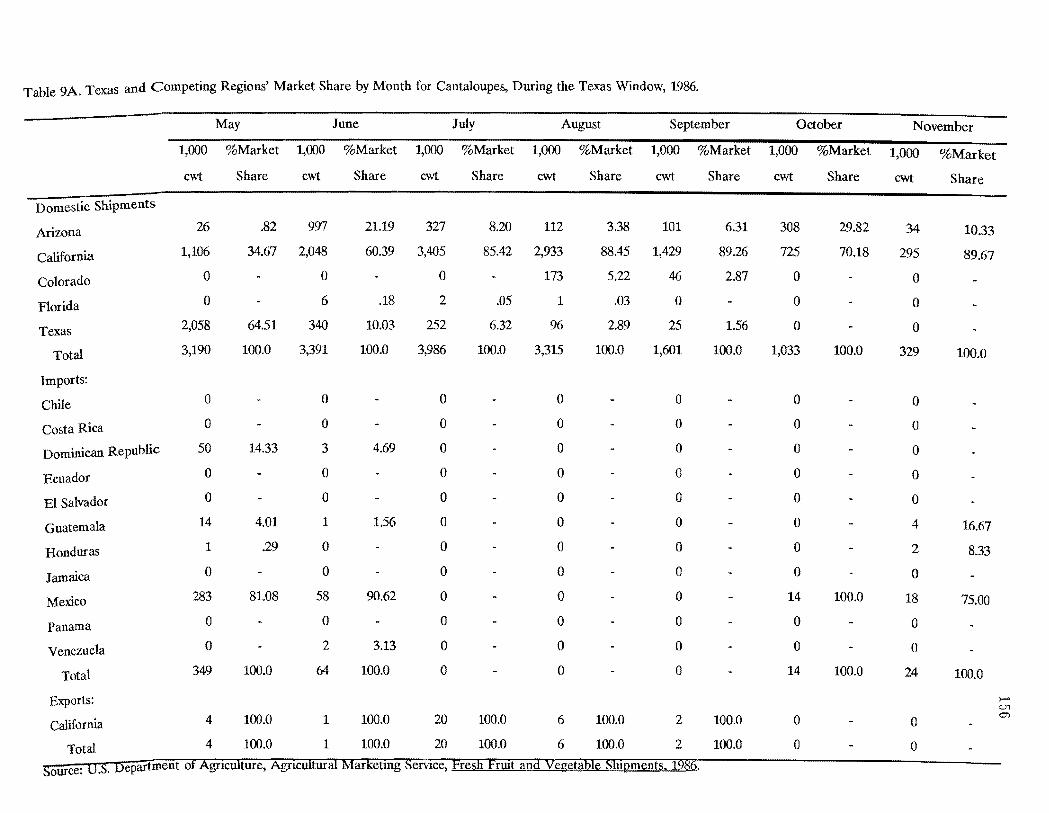
Table 9A. Texas and Competing Regions' Market Share by Month for Cantaloupes, During the Texas Window, 1986.
May June July August September October November
1,000 %Market 1,000 %Market 1,000 %Market 1,000 %Market 1,000 %Market 1,000 %Market 1,000 %Market
cwt Share ewt Share cwt Share cwt Share cwt Share cwt Share cwt Share
Domestic Shipments
Arizona 26 .82 997 21.19 327 8.20 112 3.38 101 6.31 308 29.82 34 10.33
California 1,106 34.67 2,048 60.39 3,405 85.42 2,933 88.45 1,429 89.26 725 70.18 295 89.67
Colorado 0 0 0 173 5.22 46 2.87 0 0
Florida 0 6 .18 2 .05 1 .03 0 0 0
Texas 2,058 64.51 340 10.03 252 6.32 96 2.89 25 1.56 0 0
Total 3,190 100.0 3,391 100.0 3,986 100.0 3,315 100.0 1,601 100.0 1,033 100.0 329 100.0
Imports:
Chile 0 0 0 0 0 0 0
Costa Rica 0 0 0 0 0 0 0
Dominican Republic 50 14.33 3 4.69 0 0 0 0 0
Ecuador 0 0 0 0 0 0 0
EI Salvador 0 0 0 0 0 0 0
Guatemala 14 4.01 1 1.56 0 0 0 0 4 16.67
Honduras 1 .29 0 0 0 0 0 2 8.33
Jamaica 0 0 0 0 0 0 0
Mexico 283 81.08 58 90.62 0 0 0 14 100.0 18 75.00
Panama 0 0 0 0 0 0 0
Venezuela 0 2 3.13 0 0 0 0 0
Total 349 100.0 64 100.0 0 0 0 14 100.0 24 100.0
Exports: ...... Ul
California 4 100.0 1 100.0 20 100.0 6 100.0 2 100.0 0 0 C:r.l
Total 4 100.0 1 100.0 20 100.0 6 100.0 2 100.0 0 0
Source: O.S, Department of Agncukure, AgncUIturru Marketmg ServIce, Fresh FrUit and Vegetable ShIpments, 1986.
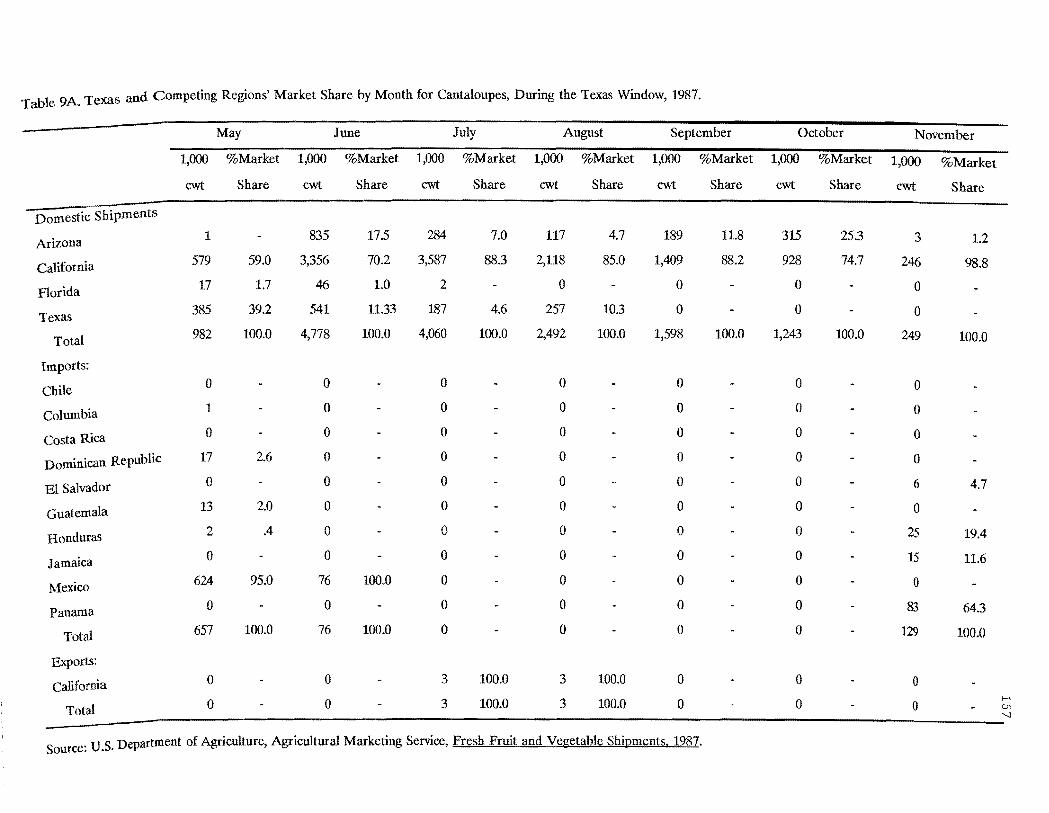
Table 9A. Texas and Competing Regions' Market Share by Month for Cantaloupes, During the Texas Window, 1987.
May June July August September October November
1,000 %Market 1,000 %Market 1,000 %Market 1,000 %Market 1,000 %Market 1,000 %Market 1,000 %Market
cwt ewt ShareShare cwt Share cwt Share cwt Share ewt Share cwt Share
Domestic Shipments
Arizona 1 835 17.5 284 7.0 117 4.7 189 11.8 315 25.3 3 1.2
California 579 59.0 3,356 70.2 3,587 88.3 2,118 85.0 1,409 88.2 928 74.7 246 98.8
Florida 17 1.7 46 1.0 2 0 0 0 0
Texas 385 39.2 541 11.33 187 4.6 257 10.3 0 0 0
Total 982 100.0 4,778 100.0 4,060 100.0 2,492 100.0 1,598 100.0 1,243 100.0 249 100.0
Imports:
Chile 0 0 0 0 0 0 0
Columbia 1 0 0 0 0 0 0
Costa Rica 0 0 0 0 0 0 0
Dominican Republic 17 2.6 0 0 0 0 0 0
El Salvador 0 0 0 0 0 0 6 4.7
Guatemala 13 2.0 0 0 0 0 0 0
Honduras 2 .4 0 (\ v 0 0 0 25 19.4
Jamaica 0 0 0 0 0 0 15 11.6
Mexico 624 95.0 76 100.0 0 0 0 0 0
Panarna 0 0 0 0 0 0 83 64.3
Total 657 100.0 76 100.0 0 0 0 0 129 100.0
Exports:
California 0 0 3 100.0 3 100.0 0 0 0
Total 0 0 3 100.0 3 100.0 0 0 0 I-' C.l1 'l
S ce' U S Department of Agriculture, Agricultural Marketing Service, Eres~Fruitand Vegetable Shipments. 1987. our . "

Table 9A. Texas and Competing Regions' Market Share by Month for Cantaloupes, During the Texas Window, 1988.
May June July August September October November
1,000 %Market 1,000 %Market 1,000 %Market 1,000 %Market 1,000 %Market 1,000 %Market 1,000 %Market
cwt Share cwt Share cwt Share cwt Share cwt Share cwt Share cwt Share
Domestic Shipments
Arizona 1 .06 481 13.02 373 14.78 154 4.71 94 4.96 187 16.11 49 9.92
California 554 35.95 1,582 42.83 2,889 82.80 2,953 90.25 1,786 94.14 974 83.89 445 90.08
Colorado 0 0 0 165 5.04 17 .90 0 0
Florida 14 .91 36 .97 1 .04 0 0 0 0
Texas 972 63.08 1,595 43.18 60 2.38 0 ° 0 0
Total 1,541 100.0 3,694 100.0 2,532 100.0 3,272 100.0 1,897 100.0 1,161 100.0 494 100.0
Imports:
Chile 0 ° 0 0 ° 0 0
Costa Rica 12 2.75 0 0 0 0 0 0
Dominican Republic 24 5.49 3 2.88 0 0 0 0 2 1.45
EI Salvador 4 .92 0 0 0 0 0 0
Guatemala 7 1.60 0 0 0 0 0 25 18.12
Honduras 30 6.86 0 0 0 0 0 1 .73
Mexico 360 82.38 101 97.12 17 100.0 0 0 0 106 76.81
Panama 0 0 0 0 0 0 2 2.90
Total 437 100.0 104 100.0 17 100.0 0 0 0 135 100.0
Exports:
California 0 0 0 0 0 0 0
Total 0 0 0 0 0 0 0 i-' (.J1
0:>
Source: U.S. Department of Agriculture, Agricultural Marketing Service, Fresh Fruit and~egetableShipments. 1988.

Table lOA. Texas and competing Regions' Market Share by Month for Honeydews, During the Texas Window, 1983.
May June July August September October November
1,000 %Market 1,000 %Market 1,000 %Market 1,000 %Market 1,000 %Market 1,000 %Market 1,000 %Market
cwt Share cwt Share cwt Share cwt Share cwt Share cwt Share cwt Share
Domestic Shipments
Arizona
California
Texas
Total
0
0
229
229
100.0
100.0
65
84
495
644
10.9
13.04
76.86
100.0
149
511
101
761
19.58
67.15
13.27
100.0
6
839
11
856
.70
98.01
1.29
100.0
0
751
15
766
98.04
1.96
100.0
35
410
1
446
7.85
91.93
.22
100.0
5
200
0
205
2.44
97.56
100.0
Imports:
Mexico
Total
119
86
0
0
0
0
0
0
0
0
0
0
0
0
Exports:
Arizona
California
Texas
Total
0
0
1
1
100.0
100.0
0
1
1
2
50.0
50.0
100.0
0
1
0
1
100.0
100.0
1
15
0
16
6.25
93.75
100.0
0
3
0
3
100.0
100.0
1
4
0
5
20.0
80.0
100.0
1
0
0
1
100.0
100.0
Source: U.S. Department of Agriculture, Agricultural Marketing Service, Fresh Fruit an.!lYeltetable Shipments. 1983.
i-' U1 co
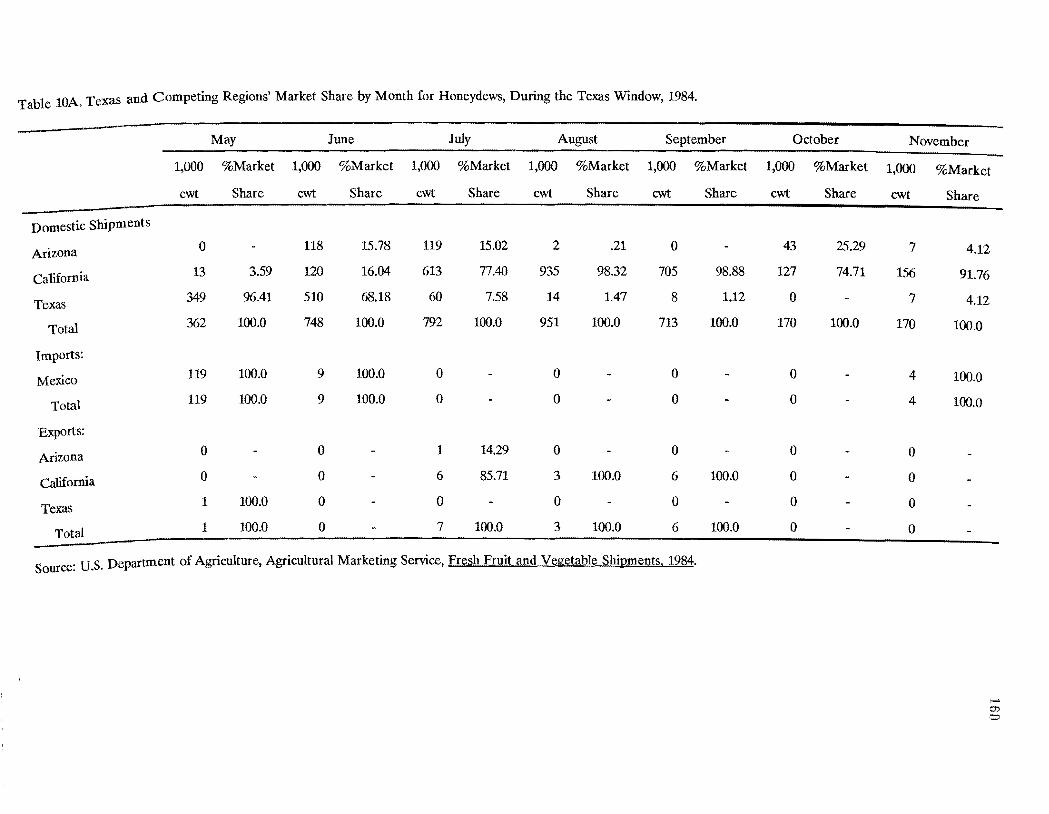
Table lOA. Texas and Competing Regions' Market Share by Month for Honeydews, During the Texas Window, 1984.
May June July August September October November
1,000 %Market 1,000 %Market 1,000 %Market 1,000 %Market 1,000 %Market 1,000 %Market 1,000 %Market
cwt Share cwt Share cwt Share cwt Share cwt Share cwt Share cwt Share
Domestic Shipments
Arizona
California
Texas
Total
0
13
349
362
3.59
96.41
100.0
118
120
510
748
15.78
16.04
68.18
100.0
119
613
60
792
15.02
77.40
7.58
100.0
2
935
14
951
.21
98.32
1.47
100.0
0
705
8
713
98.88
1.12
100.0
43
127
0
170
25.29
74.71
100.0
7
156
7
170
4.12
91.76
4.12
100.0
Imports:
Mexico
Total
119
119
100.0
100.0
9
9
100.0
100.0
0
0
0
0
0
0
0
0
4
4
100.0
100.0
Exports:
Arizona
California
Texas
Total
0
0
1
1
100.0
100.0
0
0
0
0
1
6
0
7
14.29
85.71
100.0
0
3
0
3
100.0
100.0
0
6
0
6
100.0
100.0
0
0
0
0
0
0
0
0
Source: U.S. Department of Agriculture, Agricultural Marketing Service, FI'e~h F1uitand Ye~etable_Shipments. 1984.
f-' 0')
o
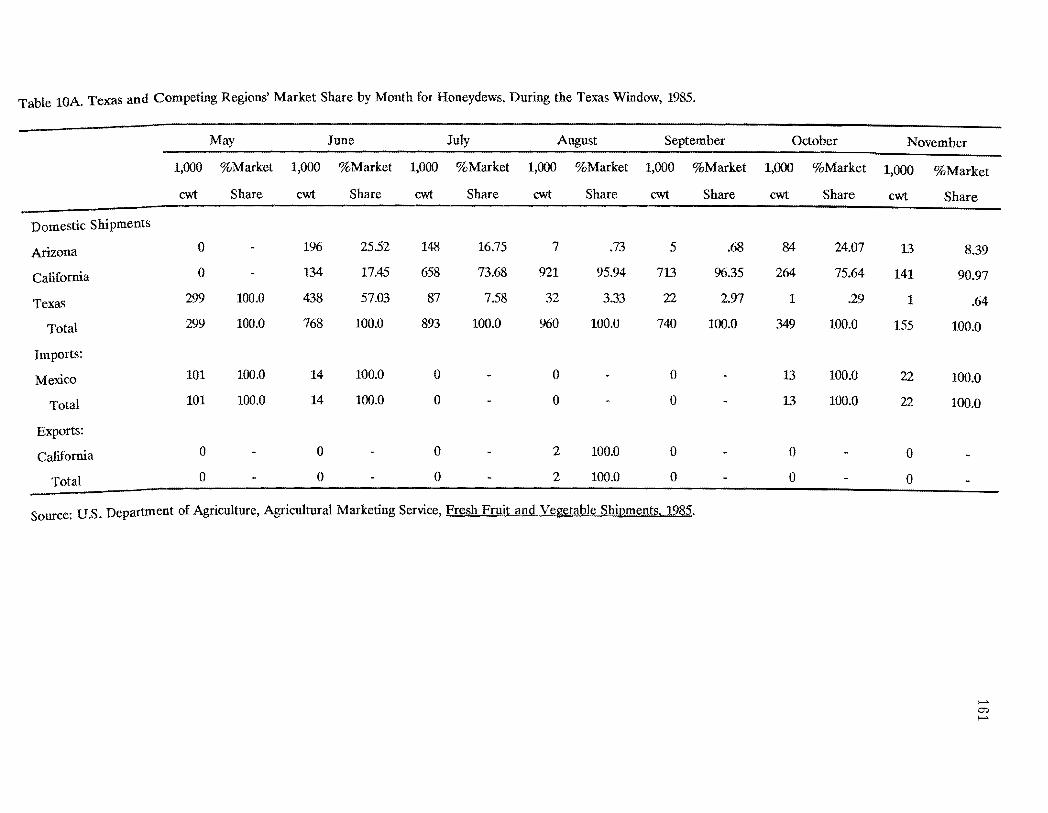
Table lOA. Texas and Competing Regions' Market Share by Month for Honeydews, During the Texas Window, 1985.
May June July August September October November
1,000 %Market 1,000 %Market 1,000 %Market 1,000 %Market 1,000 %Market 1,000 %Market 1,000 %Market
cwt Share cwt Share cwt Share cwt Share cwt Share Sharecwt cwt Share
Domestic Shipments
Arizona
California
Texas
Total
0
° 299
299
100.0
100.0
196
134
438
768
25.52
17.45
57.03
100.0
148
658
87
893
16.75
73.68
7.58
100.0
7
921
32
%0
.73
95.94
3.33
100.0
5
713
22
740
.68
%.35
2.97
100.0
84
264
1
349
24.07
75.64
.29
100.0
13
141
1
155
8.39
90.97
.64
100.0
Imports:
Mexico
Total
101
101
100.0
100.0
14
14
100.0
100.0
0
0
0
° 0
0
13
13
100.0
100.0
22
22
100.0
100.0
Exports:
California 0 0 0 2 100.0 0 0 0
Total 0 0 ° 2 100.0 0 0 0
Source: U.S. Department of Agriculture, Agricultural Marketing Service, Fresh_Fruit and Vegetable Shipments. 1985.
I-' 0)
I-'

Table lOA. Texas and Competing Regions' Market Share by Month for Honeydews, During the Texas Window, 1986.
May June July August September October November
1,000 %Market 1,000 %Market 1,000 %Market 1,000 %Market 1,000 %Market 1,000 %Market 1,000 %Market
cwt Share cwt Share cwt Share cwt Share cwt Share cwt Share cwt Share
Domestic Shipments
Arizona
California
Texas
Total
2
12
516
530
.38
2.26
97.36
100.0
213
876
347
859
24.80
86.90
40.40
100.0
107
1,143
25
1,008
10.62
97.69
2.48
100.0
14
799
13
1,170
1.20
96.38
1.11
100.0
15
799
15
829
1.81
96.38
1.81
100.0
97
285
0
382
25.39
74.61
100.0
20
112
0
132
15.15
84.85
100.0
Imports:
Mexico
Total
113
113
100.0
100.0
10
10
100.0
100.0
0
0
0
0
0
0
5
5
100.0
100.0
23
23
100.0
100.0
Exports:
California 0 0 8 100.0 81 100.0 78 100.0 2 100.0 0
Total 0 0 8 100.0 81 100.0 78 100.0 2 100.0 0
Source: U.S. Department of Agriculture, Agricultural Marketing Service, fresh Fruit and_Vegetable Shipments. 1986.
f-' en N
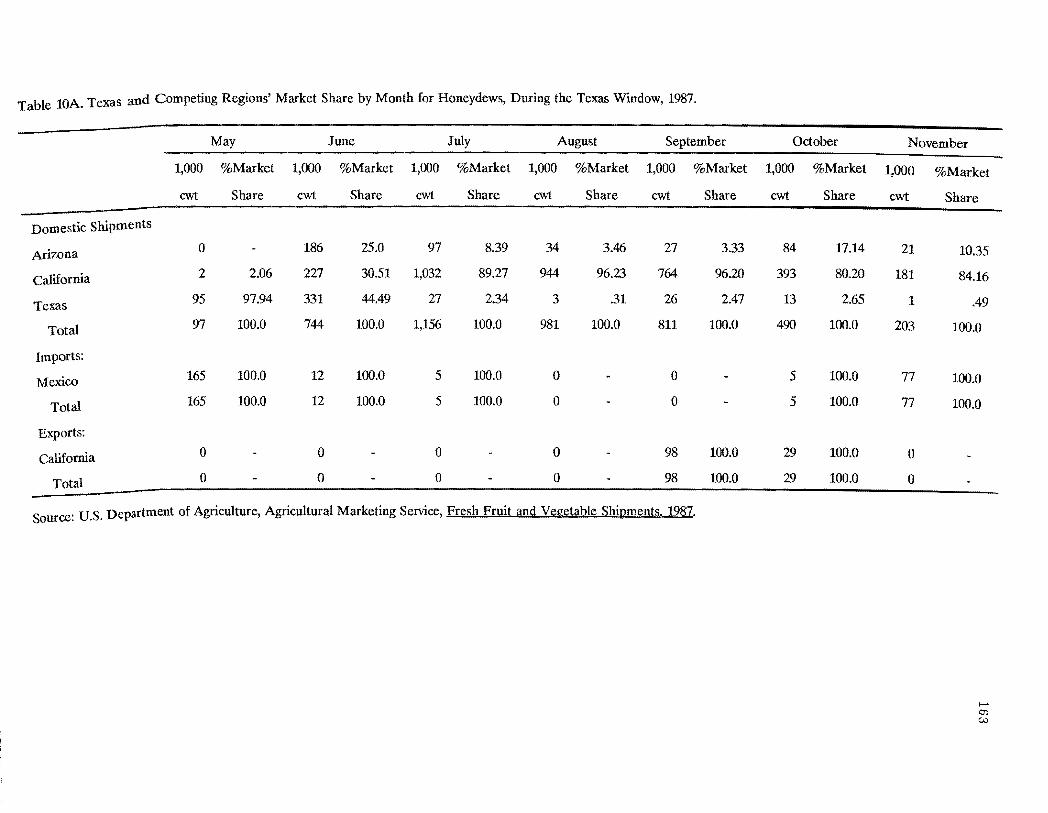
Table lOA. Texas and Competing Regions' Market Share by Month for Honeydews, During the Texas Window, 1987.
May June July August September October November
1,000 %Market 1,000 %Market 1,000 %Market 1,000 %Market 1,000 %Market 1,000 %Market 1,000 %Market
cwt Share cwt Share cwt Share cwt Share cwt Share cwt Share cwt Share
Domestic Shipments
Arizona
California
Texas
Total
0
2
95
97
2.06
97.94
100.0
186
227
331
744
25.0
30.51
44.49
100.0
97
1,032
27
1,156
8.39
89.27
2.34
100.0
34
944
3
981
3.46
96.23
.31
100.0
27
764
26
811
3.33
96.20
2.47
100.0
84
393
13
490
17.14
80.20
2.65
100.0
21
181
1
203
10.35
84.16
.49
100.0
Imports:
Mexico
Total
165
165
100.0
100.0
12
12
100.0
100.0
5
5
100.0
100.0
0
0
0
0
5
5
100.0
100.0
77
77
100.0
100.0
Exports:
California
Total
0
0
0
0
0
0
0
0
98
98
100.0
100.0
29
29
100.0
100.0
0
0
Source: U.S. Department of Agriculture, Agricultural Marketing Service, FI'eshFruit and Vegetable Shipments. 1987.
f-' 0)
c..:.

Table lOA Texas and Competing Regions' Market Share by Month for Honeydews, During the Texas Window, 1988.
May June July August September October November
1,000 %Market 1,000 %Market 1,000 %Market 1,000 %Market 1,000 %Market 1,000 %Market 1,000 %Market
cwt Share cwt Share cwt Share cwt Share cwt Share cwt Share cwt Share
Domestic Shipments
Arizona 1 .28 117 10.37 104 13.60 27 2.60 20 2.10 79 18.94 16 10.19
California 24 6.78 178 15.78 653 85.36 1,011 97.40 932 97.90 338 81.06 141 89.81
Texas 329 92.94 833 73.85 8 1.04 0 0 0 0
Total 354 100.0 1,128 100.0 765 100.0 1,038 100.0 952 100.0 417 100.0 157 100.0
Imports:
Mexico 204 100.0 14 100.0 8 100.0 0 0 2 100.0 88 100.0
Total 204 100.0 14 100.0 8 100.0 0 0 2 100.0 88 100.0
Exports:
California 0 0 1 100.0 71 100.0 120 100.0 12 100.0 0
Total 0 0 1 100.0 71 100.0 120 100.0 12 100.0 0
Source: U.S. Department of Agriculture, Agricultural Marketing Service, Fresh Fruit and Vegetable Shipments. 1988.
I-' 0)
.."

Table 11A. Texas and Competing Regions' Market Share by Month for Grapefruit, During the Texas Window, 1984.
January (Freeze)
1,000 %Market
cwt Share
Domestic Shipmentsa
1 .1Ariwna
3 .2California
1,476 99.2Florida
8 .5Texas
1,488 100.0Total
Exports:
500 99.6Florida
2 .4Texas
502 100.0Total
Imports:
8 100.0Mexico
aOomestic shipments include those bound for export.
Source: U.S. Department of Agriculture, Agricultural Marketing Service, Fresh Fruit and Vegetable Shipments. 1984.
f-' O"l Ul
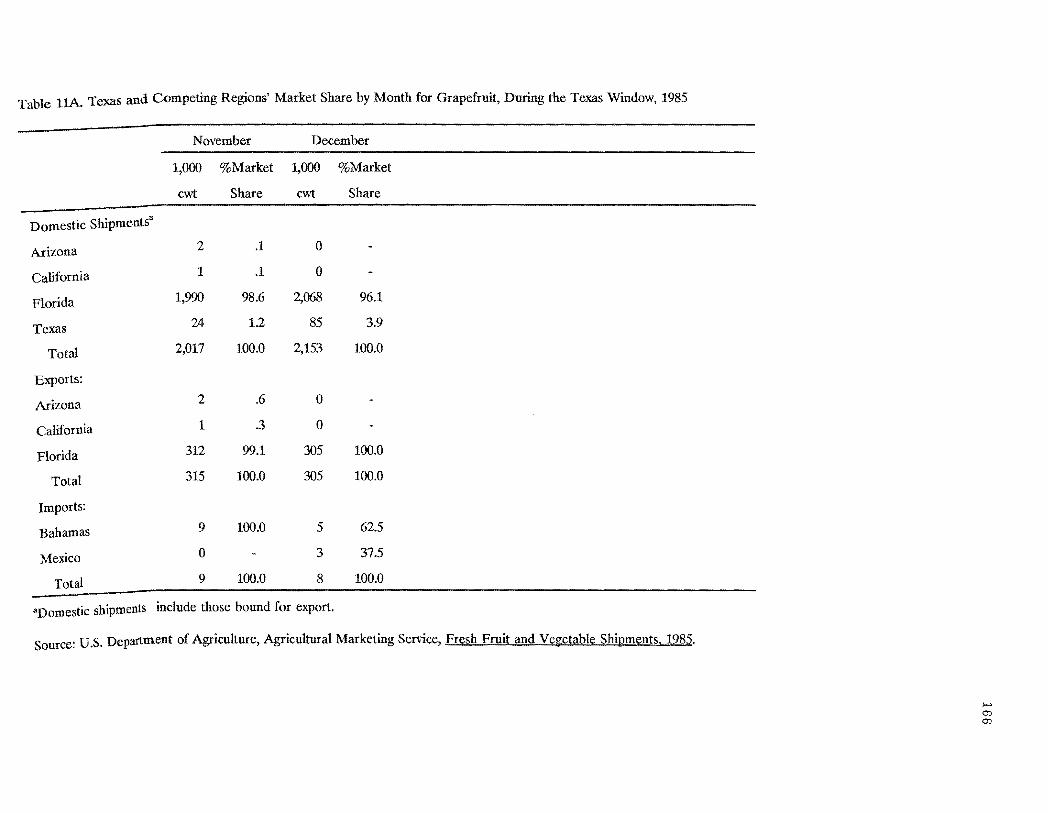
Table 1tA. Texas and Competing Regions' Market Share by Month for Grapefruit, During the Texas Window, 1985
November December
1,000 %Market 1,000 %Market
ewt Share cwt Share
Domestic Shipmentsa
Arizona
California
Florida
Texas
Total
2
1
1,990
24
2,017
.1
.1
98.6
1.2
100.0
0
0
2,068
85
2,153
96.1
3.9
100.0
Exports:
Arizona 2 .6 0
California 1 .3 0
Florida
Total
312
315
99.1
100.0
305
305
100.0
100.0
Imports:
Bahamas 9 100.0 5 62.5
Mexico 0 3 37.5
Total 9 100.0 8 100.0
3Domestic shipments include those bound for export.
Source: U.S. Department of Agriculture, Agricultural Marketing Service, Fresh Fruit and Vegetable Shipments, 1985.
,..., 0:> 0:>
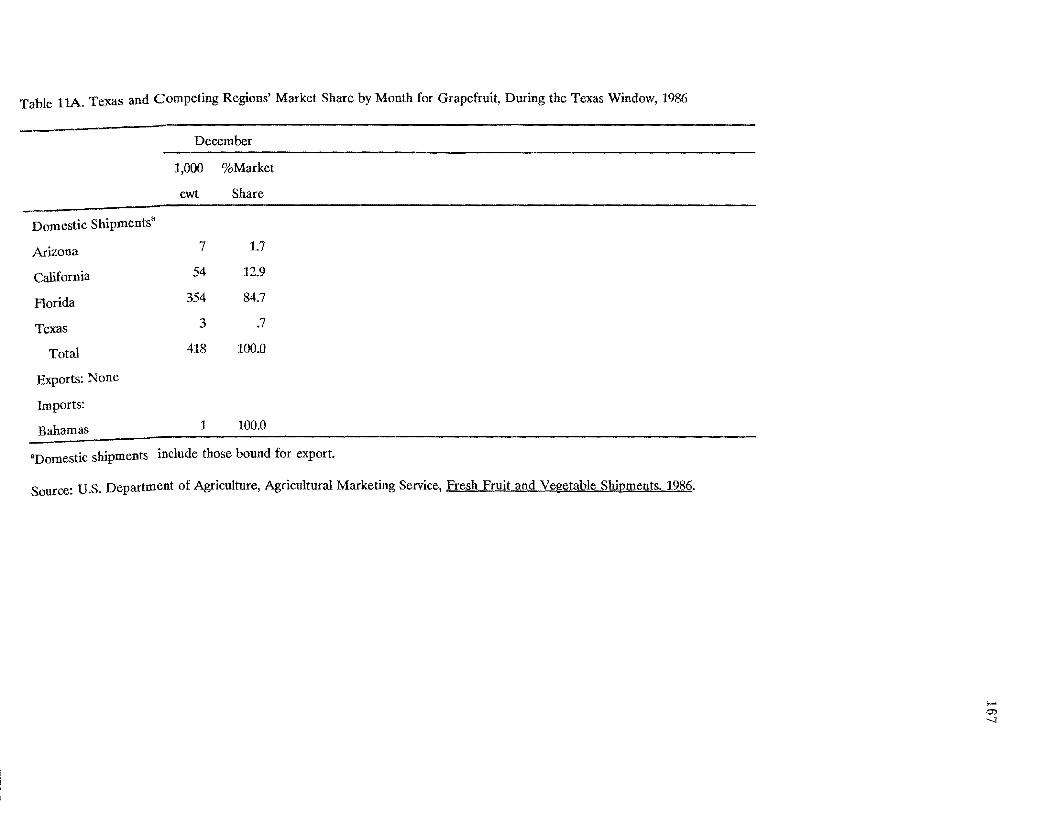
Table 1lA. Texas and Competing Regions' Market Share by Month for Grapefruit, During the Texas Window, 1986
December
J,000 %Market
cwt Share
Dornestic Shiprnentsa
Arizona 7 1.7
California 54 12.9
Florida 354 84.7
Texas 3 .7
Total 418 100.0
Exports: None
Imports:
Bahamas 1 100.0
"Domestic shipments include those bound for export.
Source: U.S. Department of Agriculture, Agricultural Marketing Service, Fresh Fruit and Vegetable Shipments, 1986.
I-"" O? '-.J
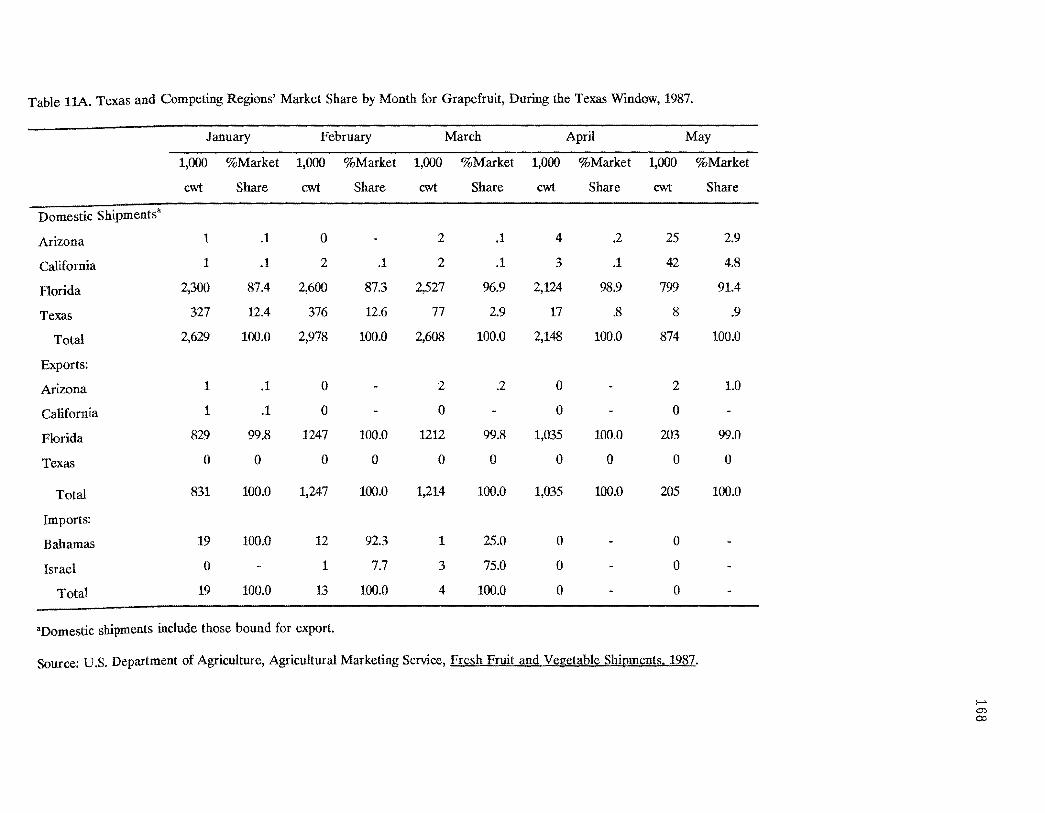
Table 11A. Texas and Competing Regions' Market Share by Month for Grapefruit, During the Texas Window, 1987.
January February March April May
1,000 %Market 1,000 %Market 1,000 %Market 1,000 %Market 1,000 %Market
cwt Share cwt Share cwt Share cwt Share cwt Share
Domestic Shipmentsa
Arizona
California
Florida
Texas
Total
1
1
2,300
327
2,629
.1
.1
87.4
12.4
100.0
a 2
2,600
376
2,978
.1
87.3
12.6
100.0
2
2
2,527
77
2,608
.1
.1
96.9
2.9
100.0
4
3
2,124
17
2,148
.2
.1
98.9
.8
100.0
25
42
799
8
874
2.9
4.8
91.4
.9
100.0
Exports:
Arizona
California
Florida
Texas
1
1
829
0
.1
.1
99.8
0
0
a 1247
0
100.0
0
2
a 1212
0
.2
99.8
0
0
a 1,035
0
100.0
0
2
0
203
0
1.0
99.0
0
Total 831 100.0 1,247 100.0 1,214 100.0 1,035 100.0 205 100.0
Imports:
Bahamas
Israel
Total
19
a 19
100.0
100.0
12
1
13
92.3
7.7
100.0
1
3
4
25.0
75.0
100.0
0
0
0
0
0
0
aDomestic shipments include those bound for export.
Source: U.S. Department of Agriculture, Agricultural Marketing Service, Fresh Fruit and Vegetable Shipments. 1987.
f--' 0":> 0:>

Table IIA (Cont). Texas and Competing Regions' Market Share by Month for Grapefruits, During the Texas Window, 1987.
October November December
1,000 %Market 1,000 %Market 1,000 %Market
cwt Share cwt Share cwt Share
Domestic Shipments'
Arizona 0 0 0
California 3 .2 0 0
Florida 1,181 95.8 1,792 87.1 2,189 85.8
Texas 49 4.0 265 12.9 361 14.2
Total 1,233 100.0 2,057 100.0 2,550 100.0
Exports:
Arizona 0 0 0
California 0 0 0
Florida 472 99.2 624 94.8 591 99.7
Texas 4 .8 34 5.2 2 .3
Total 476 100.0 658 100.0 593 100.0
Imports:
Bahamas 100.0 13 100.0 24 96.0
Israel 0 0 4.0
Total I 100.0 13 100.0 25 100.0
"Domestic shipments include those bound for export.
Source: U.S. Department of Agriculture, Agricultural Marketing Service, Fresh Fruit and Vegetable Shipments. 1987.
I-' O"l W
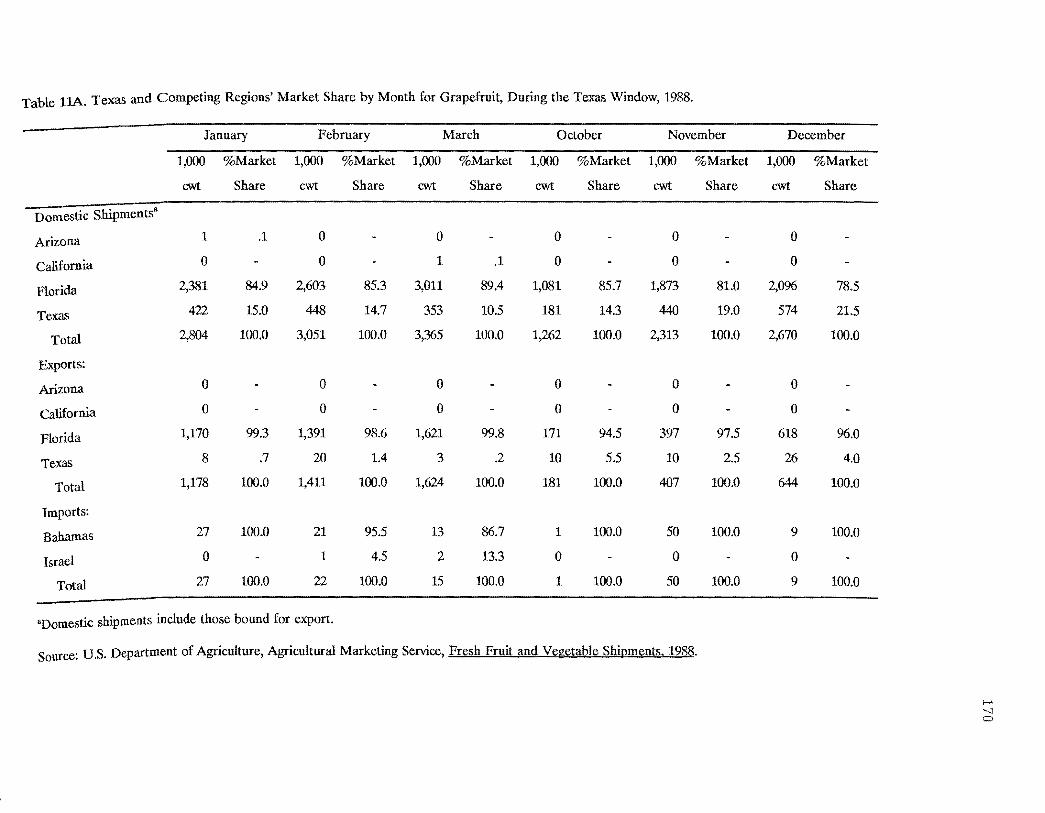
Table llA. Texas and Competing Regions' Market Share by Month for Grapefruit, During the Texas Window, 1988.
January February March October November December
1,000 %Market 1,000 %Market 1,000 %Market 1,000 %Market 1,000 %Market 1,000 %Market
cwt Share cwt Share cwt Share cwt Share cwt Share cwt Share
Domestic Shipments·
Arizona
California
Florida
Texas
Total
1
0
2,381
422
2,804
.1
84.9
15.0
100.0
0
0
2,603
448
3,051
85.3
14.7
100.0
0
1
3,011
353
3,365
.1
89.4
10.5
100.0
0
0
1,081
181
1,262
85.7
14.3
100.0
0
0
1,873
440
2,313
81.0
19.0
100.0
0
0
2,096
574
2,670
78.5
21.5
100.0
Exports:
Arizona
California
Florida
Texas
Total
0
0
1,170
8
1,178
99.3
.7
100.0
0
0
1,391
20
1,411
98.6
1.4
100.0
0
0
1,621
3
1,624
99.8
.2
100.0
0
0
171
10
181
94.5
5.5
100.0
0
0
397
10
407
97.5
2.5
100.0
0
0
618
26
644
%.0
4.0
100.0
Imports:
Bahamas
Israel
Total
27
0
27
100.0
100.0
21
1
22
95.5
4.5
100.0
13
2
15
86.7
13.3
100.0
1
0
1
100.0
100.0
50
0
50
100.0
100.0
9
0
9
100.0
100.0
"Domestic shipments include those bound for export.
Source: U.S. Department of Agriculture, Agricultural Marketing Service, Fresh Fruit and Vegetable Shipments. 1988.
1-' '-.J 0
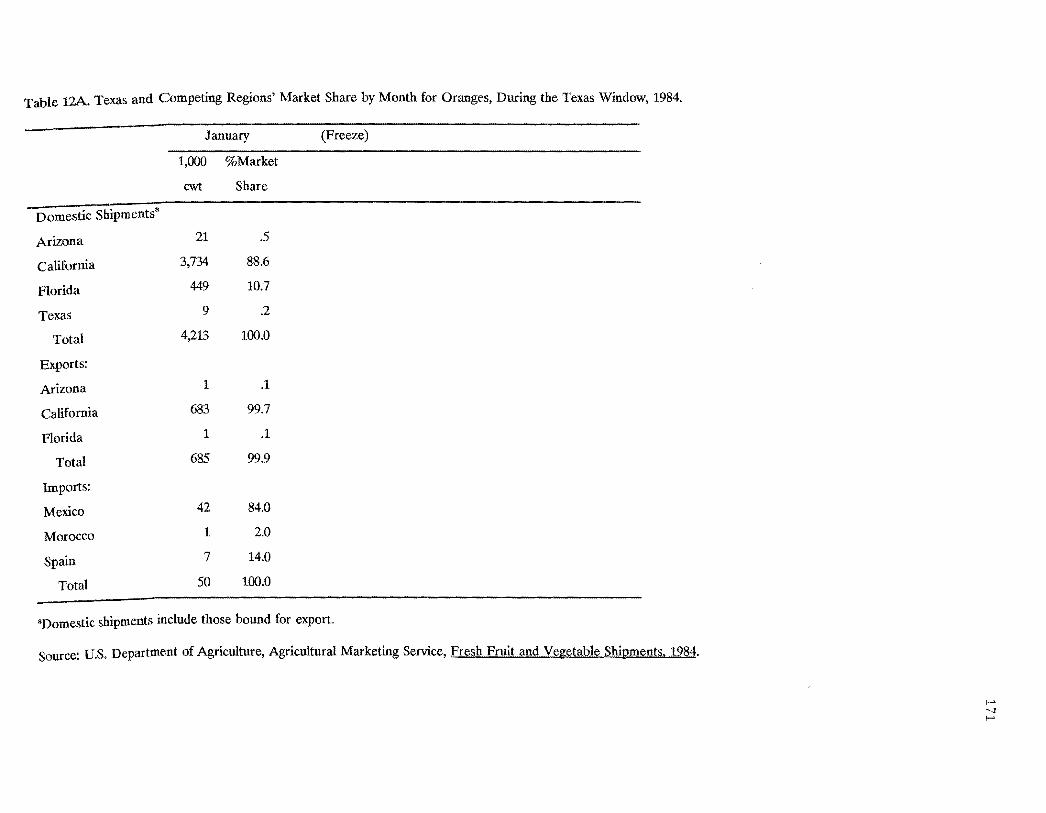
Table 12A. Texas and Competing Regions' Market Share by Month for Oranges, During the Texas Window, 1984.
January (Freeze)
1,000 %Market
cwt Share
Domestic Shipments8
21 .5Arizona
3,734 88.6California
449 10.7Florida
9 .2Texas
4,213 100.0Total
Exports:
1 .1Arizona
683 99.7California
1 .1Florida
685 99.9Total
Imports:
42 84.0Mexico
1 2.0Morocco
7 14.0Spain
50 100.0Total
8Domestic shipments include those bound for export.
Source: U.S. Department of Agriculture, Agricultural Marketing Service, Fresh Fruit and Vegetable Shipments, 1984.
l-' "-l l-'

Table 12A. Texas and Competing Regions' Market Share by Month for Oranges, During the Texas Window, 1985.
November December
1,000 %Market 1,000 %Market
cwt Share cwt Share
Domestic Shipmentsa
Arizona 93 2.2 149 2.9
California 3,229 75.0 3,070 59.0
Florida 954 22.2 1,891 36.4
Texas 28 .6 89 1.7
Total 4,304 100.0 5,199 100.0
Exports:
Arizona 0 6 1.5
California 470 100.0 405 98.5
Total 470 100.0 411 100.0
Imports:
Dominican Republic 4 80.0 0
Jamaica 1 20.0 3 2.7
Mexico 0 8 7.3
Spain 0 99 90.0
Total 5 100.0 110 100.0
"Domestic shipments include those bound for export.
Source: U.S. Department of Agriculture, Agricultural Marketing Service, Fresh Fruit and Vegetable Shipments, 1985.
,..... -J N

Table 12A. Texas and Competing Regions' Market Share by Month for Oranges, During the Texas Window, 1986.
November December
1,000 %Market 1,000 %Market
cwt Share cwt Share
Domestic Shipmentsa
Arizona 10 1.0 14 .9
California 762 76.7 1,181 77.8
Florida 220 22.2 309 20.4
Texas 1 .1 14 .9
Total 993 100.0 1,518 100.0
Exports: None
Imports:
Mexico 0 1 100.0
"Domestic shipments include those bound for export.
Source: U.S. Department of Agriculture, Agricultural Marketing Service, Fresh Fruit and Vegetable Shipments, 1986.
I-" -....J (J.1
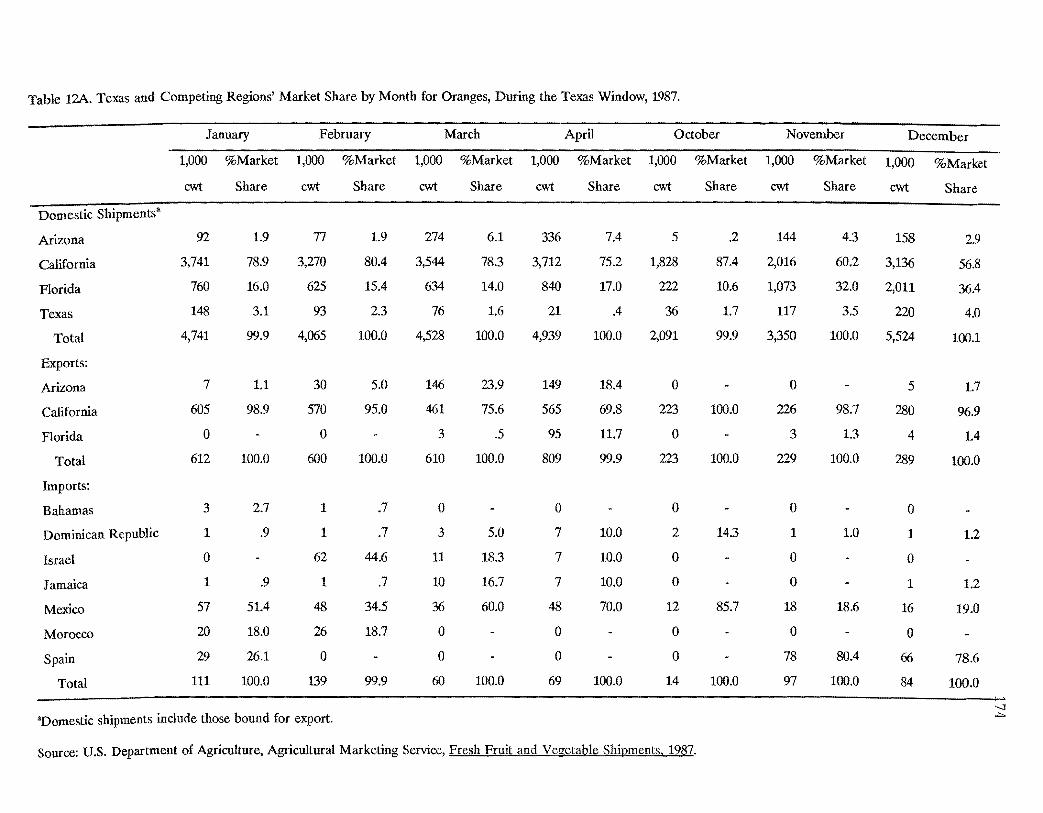
Table 12A. Texas and Competing Regions' Market Share by Month for Oranges, During the Texas Window, 1987.
January February March April October November December
1,000 %Market 1,000 %Market 1,000 %Market 1,000 %Market 1,000 %Market 1,000 %Market 1,000 %Market
eM Share eM Share eM Share eM Share eM Share cwt Share cwt Share
Domestic Shipmentsa
Arizona 92 1.9 77 1.9 274 6.1 336 7.4 5 .2 144 4.3 158 2.9
California 3,741 78.9 3,270 80.4 3,544 78.3 3,712 75.2 1,828 87.4 2,016 60.2 3,136 56.8
Florida 760 16.0 625 15.4 634 14.0 840 17.0 222 10.6 1,073 32.0 2,011 36.4
Texas 148 3.1 93 2.3 76 1.6 21 .4 36 1.7 117 3.5 220 4.0
Total 4,741 99.9 4,065 100.0 4,528 100.0 4,939 100.0 2,091 99.9 3,350 100.0 5,524 100.1
Exports:
Arizona 7 1.1 30 5.0 146 23.9 149 18.4 o o 5 1.7
California 605 98.9 570 95.0 461 75.6 565 69.8 223 100.0 226 98.7 280 96.9
Florida o o 3 .5 95 11.7 o 3 1.3 4 1.4
Total 612 100.0 600 100.0 610 100.0 809 99.9 223 100.0 229 100.0 289 100.0
Imports:
Bahamas 3 2.7 1 .7 o o o o o Dominican Republic 1 .9 1 .7 3 5.0 7 10.0 2 14.3 1 1.0 1 1.2
Israel o 62 44.6 11 18.3 7 10.0 o o o Jamaica 1 .9 1 .7 10 16.7 7 10.0 o o 1 1.2
Mexico 57 51.4 48 34.5 36 60.0 48 70.0 12 85.7 18 18.6 16 19.0
Morocco 20 18.0 26 18.7 o o o o o Spain 29 26.1 o o o o 78 80.4 66 78.6
Total 111 100.0 139 99.9 60 100.0 69 100.0 14 100.0 97 100.0 84 100.0
'I ,..".'Domestic shipments include those bound for export.
Source: U.S. Department of Agriculture, Agricultural Marketing Service, Fresh Fruit and Vegetable Shipments, 1987.
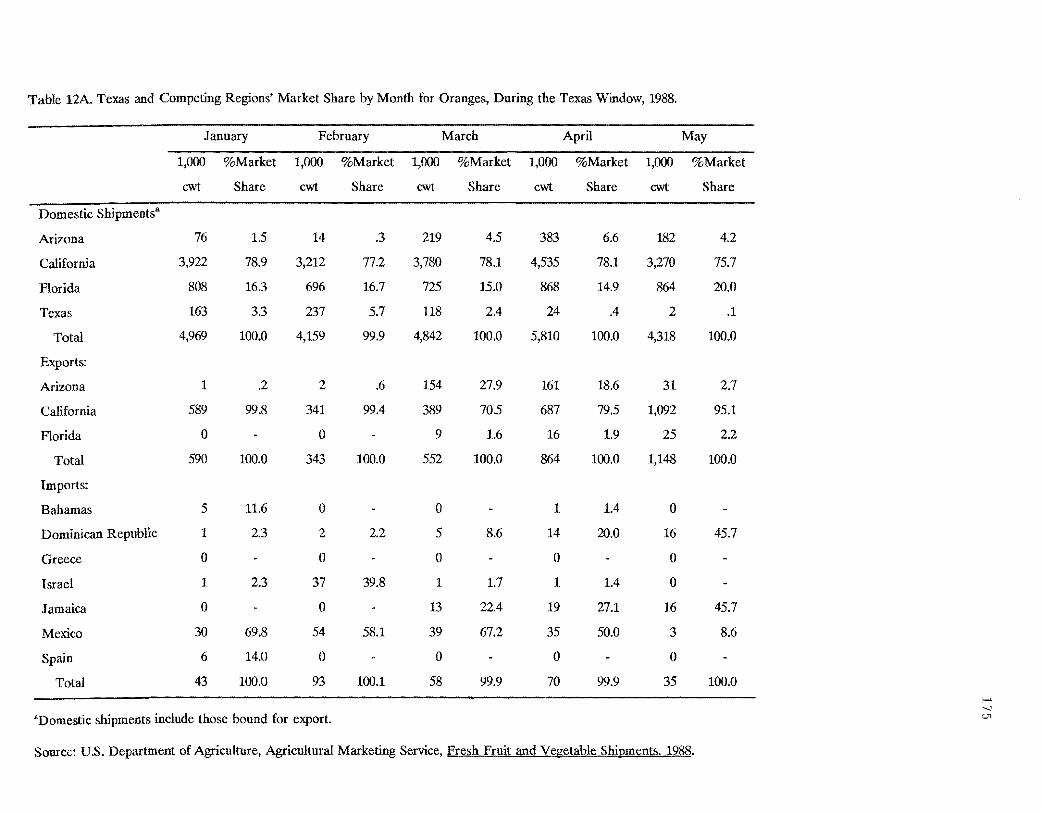
Table 12A. Texas and Competing Regions' Market Share by Month for Oranges, During the Texas Window, 1988.
January February March April May
1,000 %Market 1,000 %Market 1,000 %Market 1,000 %Market 1,000 %Market
cwt Share cwt Share cwt Share cwt Share cwt Share
Domestic Shipmentsa
Arizona 76 1.5 14 .3 219 4.5 383 6.6 182 4.2
California 3,922 78.9 3,212 77.2 3,780 78.1 4,535 78.1 3,270 75.7
Florida 808 16.3 696 16.7 725 15.0 868 14.9 864 20.0
Texas 163 3.3 237 5.7 118 2.4 24 .4 2 .1
Total 4,969 100.0 4,159 99.9 4,842 100.0 5,810 100.0 4,318 100.0
Exports:
Arizona 1 .2 2 .6 154 27.9 161 18.6 31 2.7
California 589 99.8 341 99.4 389 70.5 687 79.5 1,092 95.1
Florida 0 0 9 1.6 16 1.9 25 2.2
Total 590 100.0 343 100.0 552 100.0 864 100.0 1,148 100.0
Imports:
Bahamas 5 11.6 0 ° 1 1.4 0
Dominican Republic 1 2.3 2 2.2 5 8.6 14 20.0 16 45.7
Greece 0 0 ° ° 0
Israel 1 2.3 37 39.8 1 1.7 1 1.4 0
Jamaica 0 0 13 22.4 19 27.1 16 45.7
Mexico 30 69.8 54 58.1 39 67.2 35 50.0 3 8.6
Spain 6 14.0 ° 0 0 0
Total 43 100.0 93 100.1 58 99.9 70 99.9 35 100.0 ,..... "-J
"Domestic shipments include those bound for export. C.n
Source: U.S. Department of Agriculture, Agricultural Marketing Service, Eresh_Fruit and Vegetable Shipments. 1988.
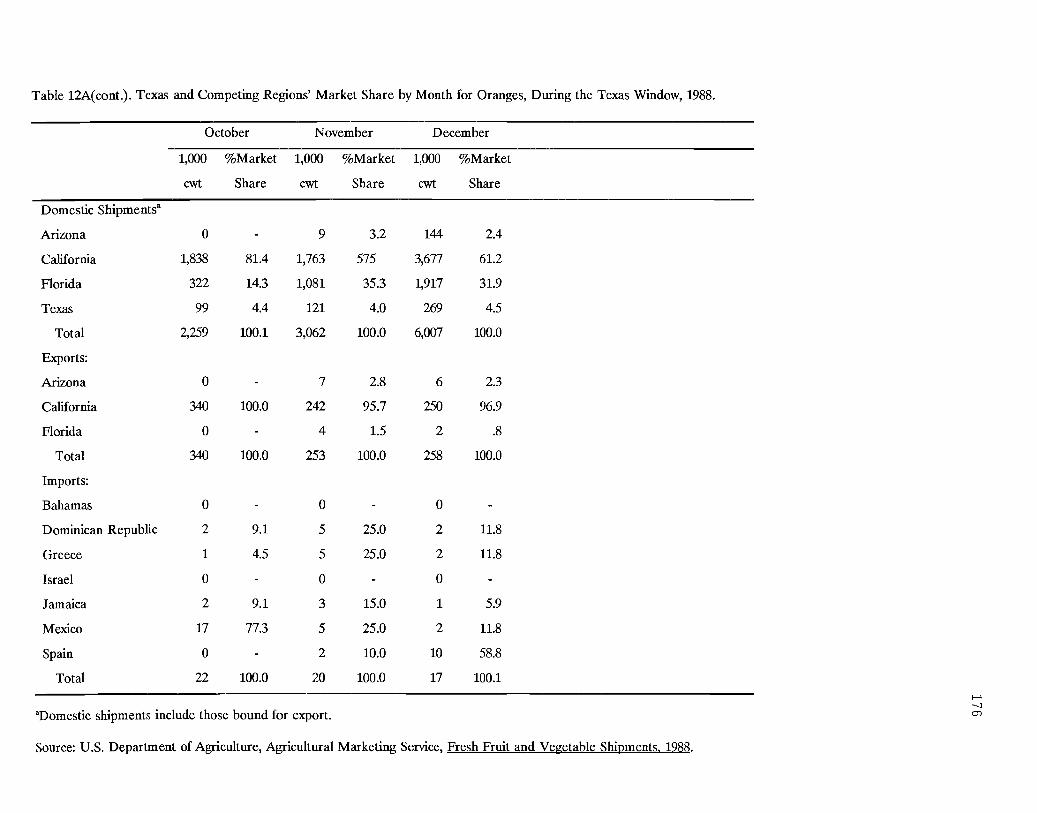
Table 12A( cont.). Texas and Competing Regions' Market Share by Month for Oranges, During the Texas Window, 1988.
October November December
1,000 %Market 1,000 %Market 1,000 %Market
cwt Share cwt Share ewt Share
Domestic Shipments"
Arizona 0 9 3.2 144 2.4
California 1,838 81.4 1,763 575 3,677 61.2
Florida 322 14.3 1,081 35.3 1,917 31.9
Texas 99 4.4 121 4.0 269 4.5
Total 2,259 100.1 3,062 100.0 6,007 100.0
Exports:
Arizona 0 7 2.8 6 2.3
California 340 100.0 242 95.7 250 96.9
Florida 0 4 1.5 2 .8
Total 340 100.0 253 100.0 258 100.0
Imports:
Bahamas 0 0 0
Dominican Republic 2 9.1 5 25.0 2 11.8
Greece 1 4.5 5 25.0 2 11.8
Israel 0 0 0
Jamaica 2 9.1 3 15.0 1 5.9
Mexico 17 77.3 5 25.0 2 11.8
Spain 0 2 10.0 10 58.8
Total 22 100.0 20 100.0 17 100.1 f-' -...]
"Domestic shipments include those bound for export. 0)
Source: U.S. Department of Agriculture, Agricultural Marketing Service, Fresh Fruit and Vegetable Shivments. 1988.