
Analysis of Scale Effect in Ice Flexural Strength
108
Analysis of Scale Effect in Ice Flexural Strength By ©Mohamed Aly, B.Eng A Thesis submitted to the School of Graduate Studies In partial fulfillment of the requirements for the degree of Master of Engineering Faculty of Engineering and Applied Science Memorial University of Newfoundland October 2018 St. John’s, Newfoundland and Labrador, Canada
Transcript of Analysis of Scale Effect in Ice Flexural Strength

Analysis of Scale Effect in Ice Flexural
Strength
By
©Mohamed Aly, B.Eng
A Thesis submitted to the
School of Graduate Studies
In partial fulfillment of the requirements for the degree of
Master of Engineering
Faculty of Engineering and Applied Science
Memorial University of Newfoundland
October 2018
St. John’s, Newfoundland and Labrador, Canada

This page is intentionally left blank

i
ABSTRACT
Ice flexural strength is an important parameter in the assessment of ice loads on the hulls
of ice-class ships, sloped offshore structures, or sloped bridge piers. While scale effects in
compressive ice strength are well known, scale effects in ice flexural strength are not
proven. To investigate scale effects during flexural failure of both freshwater and saline
ice, a comprehensive up-to-date database of beam flexural strength measurements has been
compiled. The database includes 2073 freshwater ice beam tests between 0.00016 to 2.197
m3 volumes, and 2843 sea-ice beam tests between 0.00048 to 59.87 m3 volumes. The data
show a considerable decrease in flexural strength as the specimen size increases, when
examined over a large range of scales. Empirical models of freshwater ice flexural strength
as a function of beam volume, and of saline ice as function of beam and brine volumes
have been developed using regression analysis. For freshwater ice, the scale-dependent
flexural strength is given as: σ𝑓 = 839(𝑉 𝑉1⁄ )−0.13. For sea ice, the dependence of flexural
strength is embedded in: 𝜎 = 1324 (𝑉
𝑉1)−0.054𝑒−4.969 √𝑣𝑏. To facilitate probabilistic ice
load modeling an analysis of the residuals was completed, and probability distributions
were fitted to these data. These results have important implications for design, since scale
effects can result in significantly lower strength for large-scale interactions as compared to
strength values reported for small laboratory specimens.
KEY WORDS
Sea Ice, Freshwater Ice, Flexural Strength; Scale Effects

ii
ACKNOWLEDGEMENT
I would like to express my sincere gratitude to my supervisors, Dr. Rocky Taylor, Dr. Ian
Turnbull, and Dr. Eleanor Bailey, for their continuous support, guidance, friendly help, and
feedback throughout the program, as successful completion of this work would not have
happened without them.
I am thankful to Dr. Paul Barrette and the National Research Council (NRC) for supplying
copies of NRC Reports; and work term student Thabiso Mthethwa for his help in compiling
the database. In addition; I gratefully acknowledge the funding of School of Graduate
Studies (SGS) at Memorial University of Newfoundland, Hibernia Management and
Development Company, Ltd. (HMDC), and Innovate NL.
Many thanks to Ridwan Hossain for his continuous advice both technically and personally.
And big thanks to the rest of my colleagues and friends at C-CORE, Hamid Shayanfar, Igor
Gribanov, Soroosh Mohammadfzali, Marjan Taghi Boroojerdi, Pranav Birajdar, Reza
Zeinali for their friendly help during the program.
Finally, a special thanks to my mom for loving, encouraging and supporting me. I am also
grateful to my father Mohsen Abdrabo Aly who passed away for loving and raising me, to
him I dedicate this thesis.

iii
TABLE OF CONTENTS
NOMENCLATURE ............................................................................................................ i
1 Introduction.................................................................................................................. 1
1.1 Overview .............................................................................................................. 1
1.2 Purpose ................................................................................................................. 1
1.3 Outline of thesis ................................................................................................... 3
2 Literature review .......................................................................................................... 4
2.1 Background .......................................................................................................... 4
2.2 Flexural Strength Measurements .......................................................................... 5
2.2.1 Cantilever beam tests .................................................................................... 8
2.2.2 Three- and four-point bending tests ............................................................ 10
2.3 Scale Effects in Ice Mechanics ........................................................................... 13
2.3.1 Theoretical Basis for Scale Effects in Ice ................................................... 13
2.3.2 Scale Effect in Compressive Strength ......................................................... 23
2.3.3 Past Work on Scale Effect in Flexural Strength ......................................... 26
2.4 Summary ............................................................................................................ 31
3 Freshwater Ice Flexural Strength ............................................................................... 33
3.1 Freshwater Flexural Strength Database .............................................................. 33
3.2 Flexural Strength Dependencies ......................................................................... 35
3.3 Scale Effects ....................................................................................................... 39
3.4 Residuals Analysis ............................................................................................. 46
3.5 Summary ............................................................................................................ 48
4 Sea Ice Flexural Strength ........................................................................................... 50
4.1 Sea Ice Flexural Strength Database .................................................................... 50
4.2 Flexural Strength Dependencies ......................................................................... 54
4.3 Brine Volume ..................................................................................................... 59
4.4 Scale Effects ....................................................................................................... 63
4.5 Residuals Analysis ............................................................................................. 71
4.6 Summary ............................................................................................................ 73

iv
5 Conclusions and Recommendations .......................................................................... 75
5.1 Conclusions and Discussion ............................................................................... 75
5.2 Recommendations for future research ................................................................ 79
REFERENCES ................................................................................................................. 82
Appendix A: Conference Paper ........................................................................................ 90

v
LIST OF TABLES
Table 3.1. Summary of Freshwater Ice Data .................................................................... 34
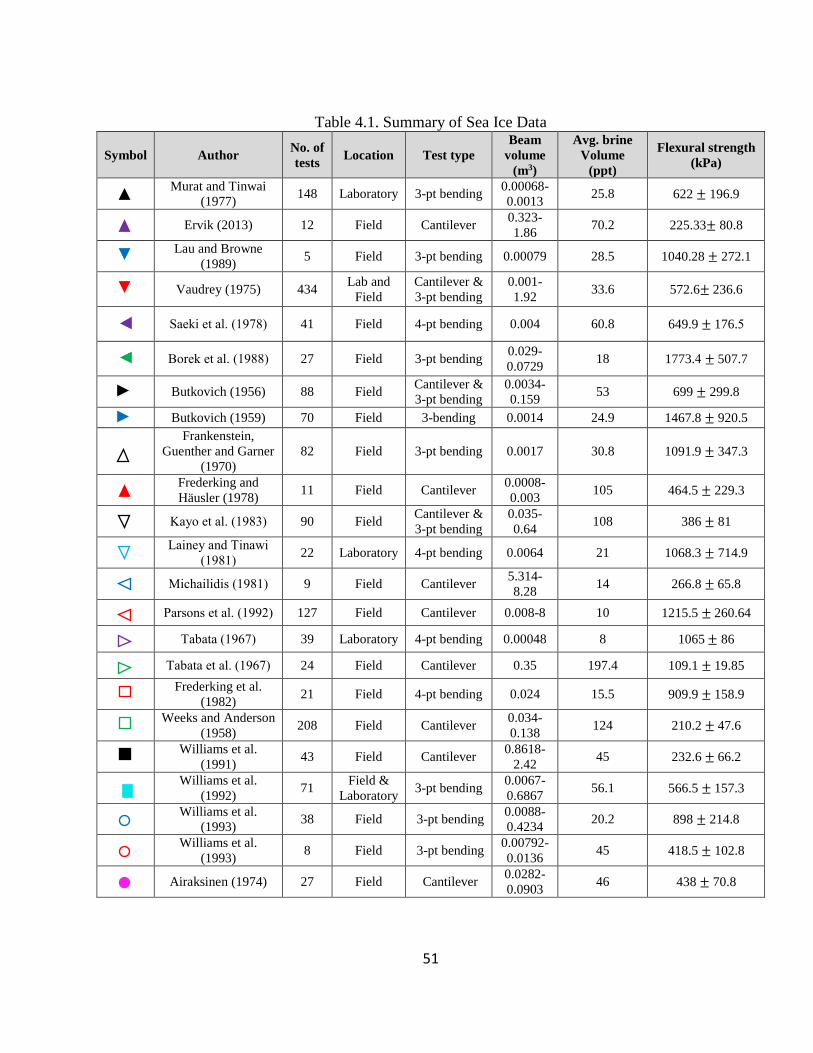
Table 4.1. Summary of Sea Ice Data ................................................................................ 51
LIST OF FIGURES
Figure 2.1. (a) Radial cracking (b) Circumferential cracking (c) Spalling ......................... 4 Figure 2.2. Force-deflection curve for saline ice (Schwarz, 1975). .................................... 7 Figure 2.3. Cantilever beam test. ........................................................................................ 8
Figure 2.4. Cantilever beam shear force and bending moment diagrams. ........................ 10 Figure 2.5. Three-point bending test. ................................................................................ 10 Figure 2.6. Four-point bending beam test. ........................................................................ 11
Figure 2.7. Three-point bending tests shear force and bending moment diagrams. ......... 11 Figure 2.8. Four-point bending tests shear force and bending moment diagrams. ........... 12
Figure 2.9. Weibull fit of four out of thirteen flexural strength experimental datasets
(Parsons and Lal, 1991). ................................................................................................... 14 Figure 2.10. Weibull plot for small specimen size data (Tozawa and Taguchi, 1986)..... 14
Figure 2.11. Weibull plot for medium specimen size data (Tozawa and Taguchi, 1986). 15 Figure 2.12. Weibull plot for large specimen size data (Tozawa and Taguchi, 1986). .... 15
Figure 2.13. Specimen in tension; failure results in total loss of strength (Taylor and
Jordaan, 2015). .................................................................................................................. 16
Figure 2.14. Critical flaws distributed through samples (Taylor, 2010). .......................... 21 Figure 2.15. Comparing test results with Weibull model estimations (Tozawa and
Taguchi, 1986). ................................................................................................................. 22
Figure 2.16. Scale effect in freshwater ice (Jordaan et al., 2007). .................................... 23 Figure 2.17. Ice pressure vs. area from combined data (Masterson et al., 2007). ............ 24
Figure 2.18. Weibull fit of compressive ice failure data showing scale effects (Taylor,
2010). ................................................................................................................................ 24 Figure 2.19. Data from the STRICE project (Jordaan et al., 2007). ................................. 25
Figure 2.20. Measured and model flexural strength vs beam size for sea ice beams near
𝑣𝑏 = 0.03 (Williams and Parsons, 1994). ........................................................................ 27 Figure 2.21. Measured and model flexural strength vs beam size for simple freshwater
beams (Williams and Parsons, 1994). ............................................................................... 28
Figure 2.22. Flexural strength dependence on beam size for freshwater ice and sea ice of
different brine volumes (Williams and Parsons, 1994)..................................................... 28 Figure 2.23. Flexural strength normalized to a 1 knot (kt) ramming speed as a function of
floe thickness (Edge breaking mode) (Frederking and Sudom, 2013). ............................ 29 Figure 2.24. Flexural strength normalized to a 1 kt ramming speed as a function of floe
thickness (Continuous icebreaking mode) (Frederking,and Sudom, 2013). ..................... 30 Figure 3.1. Freshwater ice flexural strength vs. beam size. .............................................. 35 Figure 3.2. Freshwater ice flexural strength vs. ice temperature measured using simple
beam tests (Timco and O'Brien, 1994). ............................................................................ 36

vi
Figure 3.3. Freshwater ice flexural strength vs. ice temperature measured using cantilever
beam tests (Timco and O'Brien, 1994). ............................................................................ 36 Figure 3.4. Freshwater ice flexural strength vs. ice temperature. ..................................... 37 Figure 3.5. Freshwater ice flexural strength vs. beam volume using average values of
strength for all tests with same beam volume. .................................................................. 40
Figure 3.6. Plot of all freshwater ice flexural strength vs. beam volume data grouped to
indicate test location as either field or laboratory. ............................................................ 41 Figure 3.7. Plot of all freshwater ice flexural strength vs. beam volume data grouped
according to test type. ....................................................................................................... 41 Figure 3.8. Plot of freshwater ice flexural strength tests vs. beam volume grouped by test
type (field data only). ........................................................................................................ 43
Figure 3.9. Freshwater ice beam flexural strength vs. beam volume for all field tests
including corrected cantilever test data. ............................................................................ 44 Figure 3.10. Probability plot of residuals for three-parameter Weibull distribution. ....... 46 Figure 3.11.Weibull distribution histogram of residuals for freshwater ice. .................... 47 Figure 4.1. Sea ice flexural strength vs. beam size. .......................................................... 53
Figure 4.2. Flexural strength-stress rate relationship (modified after Ji et al., 2011). ...... 54 Figure 4.3. Flexural strength vs. depth (Timco and Frederking, 1982). ........................... 56 Figure 4.4. Flexural strength vs temperature for sea ice (Timco and O'Brien, 1994). ..... 57
Figure 4.5. Flexural strength vs square root of brine volume (Timco and O'Brien, 1994).
........................................................................................................................................... 59
Figure 4.6. Flexural strength vs square root of brine volume. .......................................... 61 Figure 4.7. Flexural strength vs square root of brine volume grouped to indicate test
location as either field or laboratory. ................................................................................ 62
Figure 4.8. Flexural strength vs square root of brine volume grouped according to test
type. ................................................................................................................................... 62 Figure 4.9. Multi-year sea ice and freshwater ice flexural strength vs. beam size. .......... 64 Figure 4.10. Brackish and sea ice flexural strength vs. beam size. ................................... 65
Figure 4.11. Plot of all sea ice flexural strength vs. beam volume data grouped to indicate
test location as either field or laboratory. .......................................................................... 66 Figure 4.12. Plot of all sea ice flexural strength vs. beam volume data grouped according
to test type. ........................................................................................................................ 66 Figure 4.13. Plot of field sea ice flexural strength vs. beam volume data grouped
according to test type. ....................................................................................................... 67
Figure 4.14. Plot of normalized field sea ice flexural strength vs. beam volume. ............ 70 Figure 4.15. Probability plot of residuals for normal distribution. ................................... 71
Figure 4.16. Normal distribution histogram of residuals for sea ice................................. 72 Figure 5.1. Comparison between normalized sea ice and freshwater ice models. ............ 79

i
NOMENCLATURE
𝜎𝑓𝑙𝑒𝑥𝑢𝑟𝑎𝑙 Flexural strength
F Peak load at failure
L Beam length
b Beam width
ℎ Beam thickness
V1 Reference volume
c Distance from the loading pin to the end support
𝑇𝑖 Strength of the ith element
𝑅 Strength of the whole beam
r Strength of an element
FT(t) Distribution function FT(t) for each element
FR(r) Failure probability of the beam
𝑛 Number of elements
𝜈 Beam volume
𝜈0 Volume of each element
m(r) Weibull material function
𝑟1 Weibull distribution scale parameters
𝑟0 Lower limit for strength.
𝛼 Weibull distribution shape parameter
𝑥 General three-parameter strength of an element
𝛾 General three-parameter lower limit for strength (location parameter)
𝛽 General three-parameter Weibull distribution scale parameters
𝜈∗ Reduced volume
ΔVi Elemental volume
σ(xi) Elemental stress
xi Center coordinates of the element
𝜙(𝑥𝑖) Elemental stress as function of position

ii
y Distance from the neutral axis
M Moment’s magnitude
𝑉 Beam volume
V1 Reference volume
𝑣𝑏 Brine volume
𝜎𝑁𝑜𝑟𝑚𝑎𝑙𝑖𝑧𝑒𝑑 Normalized Strength
𝜎𝑐𝑎𝑙𝑐𝑢𝑙𝑎𝑡𝑒𝑑,𝑣𝑏 Strength calculated at measured brine
𝜎𝑅𝑒𝑓𝑣𝑏,𝑅𝑒𝑓 Strength at reference brine volume
𝑣𝑏,𝑅𝑒𝑓 Brine volume at reference ice conditions
r Residuals
T Temperature
S Salinity

1
1 Introduction
1.1 Overview
For ships and offshore structures operating in ice environments, ice loads are a dominant
consideration for design (Gudmestad et al., 2007). Ice loads depend on the failure mode of
the ice, which can include crushing, bending, buckling, or mixed mode. Ice flexural
strength is an important parameter in the assessment of ice loads on the hulls of ice-class
ships, offshore structures with sloped water line geometry, bridge piers, or lighthouses.
Moreover, flexural strength is essential in the study of ice ridging and rafting phenomena,
and for calculating the bearing capacity of ice cover, which is critical in the design of winter
roads, as well as other on-ice operations.
Ships or structures that break the ice in bending typically experience much lower loads than
what are associated with other types of failure, such as crushing. Vaudrey (1983) estimated
that the flexural strength of ice is around 10% to 50% of its compressive strength. This
highlights the opportunity to take advantage of flexural strength in design, and reinforces
the need for more investigation of ice flexural strength in general.
1.2 Purpose
Ice, as a geophysical material, contains many flaws and cracks, so it is expected that the
probability of encountering such flaws increases with increasing specimen size, which
would cause a decrease in strength (Sanderson, 1988; Tozawa and Taguchi, 1986). For
example, in the case of compressive ice strength there is strong evidence supporting why

2
such scale effects would be expected (e.g. Taylor and Jordaan, 2015; Jordaan et al., 2012;
Sanderson, 1988).
While ISO19906 does recommend that full-scale tests be carried out if possible and it does
acknowledged that scale effect in flexural strength should be considered, this standard does
not provide an equation for flexural strength that accounts for scale. Similarly scale effects
for flexural strength are not currently considered in the International Association of
Classification Societies (IACS) Polar Class ship rules. The practical implications of
accounting for such scale effects are important. For example, Williams and Parsons (1994)
suggested that the flexural strength encountered by a specific icebreaker or offshore
platform when failing in bending in reality is around 50% of the measured flexural strength
from small-scale beam tests. The last extensive study on the subject was carried out by
Williams and Parson (1994) and since then a wealth of new data have been collected or
made public. All of these factors highlight the need for a more updated investigation of
scale effects in ice flexural strength, which is the goal of this thesis.
The main objective of this thesis is to investigate and understand the effects of scale on ice
flexural strength for both freshwater ice and sea ice. The effects of other important
parameters such as temperature and brine volume on flexural strength are also explored.
The scope of this research can be categorized as follows:
Review theoretical and statistical theories for ice flexural strength, and
measurement methodologies used in laboratory and field testing.

3
Review relevant literature and previous studies on scale effects in ice mechanics.
Compile a comprehensive up-to-date database of ice beam flexural strength
measurements for freshwater ice and sea ice.
Examine the effect of beam size on ice flexural strength measurements collected.
Develop an empirical model for ice flexural strength that can be used in offshore
structures and ice-class ship design applications for freshwater ice and sea ice.
Investigate the influence of other important parameters on flexural strength such as
brine volume and temperature.
Propose conclusions and recommendations for future research.
1.3 Outline of thesis
In Chapter 2, a literature review was conducted on ice flexural strength and scale effects
associated with it. In Chapter 3, the database of freshwater ice flexural strength
measurements is introduced, and the analysis that has been done for scale effects in
freshwater ice flexural strength is discussed. Similarly, Chapter 4 describes the database of
sea-ice flexural strength measurements and the analysis of scale effects in sea-ice flexural
strength. Finally, Chapter 5 includes a discussion, summary of main conclusions and future
research ideas.

4
2 Literature review
In this chapter, the available literature on ice flexural strength and scale effects associated
with it, are reviewed. In Section 2.1, ice failure modes are defined, emphasizing flexural
loading. Ice flexural strength testing methodologies are reviewed (Section 2.2). The
theoretical basis of scale effects in ice mechanics are discussed, and then previous studies
that have been carried out to investigate scale effects in flexural strength are reviewed in
detail (Section 2.3). Finally, a summary of the chapter is given in Section 2.4.
2.1 Background
Ice can fail in different modes when it interacts with structures: creep, buckling, crushing,
spalling, radial cracking, circumferential cracking, or mixed mode (Figure 2.1).
(a) (b) (c)
(d) (e) (f)
Figure 2.1. (a) Radial cracking (b) Circumferential cracking (c) Spalling
(d) Buckling (e) Creep (f) Crushing (Sanderson, 1988).
If the ice is moving slowly, creep loading takes place (Figure 2.1e). This usually happens
when land fast ice is subjected to thermal and/or wind stresses (Palmer and Croasdale,

5
2013). If the ice is thin, it buckles (Figure 2.1d) due to eccentricities in ice loads because
of irregularities in ice shape or thickness (Taylor, 2010). When thicker ice meets a vertical-
walled structure, it experiences compressive ice failure. Then, it may crush (Figure 2.1f)
generating fine-grained particles or spalls due to local edge fractures that run to the top and
bottom surfaces (Sanderson, 1988). Also, radial cracking can happen, fracturing the ice
floe into pieces (Figure 2.1a).
Circumferential cracks (Figure 2.1b) usually happen when ice is interacting with sloped
walled structures, particularly after radial cracks initiate which divides the sheet into
segments that fail more easily in flexure. Flexural strength is defined as the ice strength
capacity, when the failure mode is bending (Ervik, 2013). It is an important design input
for inclined faced structures and ice-class ship design. However, flexural strength tests are
indirect because it is not accounting for all factors, and the effects of different conditions
such ice and test conditions on flexural strength should be considered.
2.2 Flexural Strength Measurements
Due to the variability in ice associated with variation in distributions of flaw size,
temperature, brine pockets and channels and test conditions, flexural strength tests data
should be analyzed using a statistical approach. Ideally, the number of repetitions of a
certain test should be chosen to get a high confidence level. However, tests are often costly
and time consuming to conduct, and there are practical limits to the number of repeats that
can be done. Adding data, particularly field-scale helps our understanding of ice flexural
failure. For flexural strength testing, some considerations should be taken into account; the

6
beam length should be between 7 to 10 times the ice thicknesses. The beam width should
be between 1 to 2 times the ice thickness, and for freshwater ice, should be at least 10 times
the ice crystals’ diameter in order to avoid the grain size effect (Schwarz et al., 1981).
These recommendations are to avoid shear effects in short beams, and plate behavior in
long beams, where the beam will have biaxial stresses or rotation around the root for
cantilever tests (Frederking and Häusler, 1978; Lavrov, 1971). In addition, the loading rate
should be high enough to allow the beam to deform elastically (Tatinclaux and Hirayama,
1982).
Flexural strength is usually calculated using simple beam theory. The main disadvantages
of using this theory, are the assumptions associated with it. First, plane sections are
assumed to remain plane. Second, deflections are very small compared to the beam
thickness. Third, linear elastic behavior is assumed (Schwarz and Weeks, 1977). Fourth,
ice is assumed homogeneous and isotropic. In addition, the loading is assumed to remain
quasi-static. All are assumed to simplify the calculation. However, ice properties may vary
significantly across the thickness of the ice cover (Ervik, 2013). Ice is in fact an
inhomogeneous, anisotropic and viscoelastic material (Schwarz and Weeks, 1977). In
addition, for anisotropic materials, shear deformations should be accounted for, which to
date has not been accounted for by researchers (Lainey and Tinawi, 1981). What is more,
existing flaws and air inclusions are not inherent in simple beam theory (ITTC, 2014).
In simple beam theory, the neutral axis is assumed to be located at the center of the
specimen, but in reality, it is shifted to the compressed side (ITTC, 2014; Schwarz, 1975).

7
The neutral axis shifts to the stiffer side in order to make the tension and compression
forces equal, due to ice, like many brittle materials, not having the same properties in
tension and compression. Moreover, flexural strength tests usually cause non-uniform
stress fields over the depth of the ice sample, which is not taken into consideration ( Timco
and Weeks, 2010; Schwarz and Weeks, 1977). Furthermore, tests usually do not cause a
constant bending moment along the whole beam length (Lainey and Tinawi, 1981).
However, despite these complexities and all of the simplifying assumptions, the load versus
deflection curves for flexural strength tests are typically linear (see Figure 2.2) which
suggests the assumptions are sufficiently valid to permit the use of simple beam theory
(Tatinclaux and Wu, 1978; Schwarz, 1975). Therefore, the results of these tests will be
good approximate values that can be used as an index of strength (Gow, 1977).
Nonetheless, there are many factors that influence the flexural strength of ice and as such,
considerable variation is expected in measurements, and analysis of the data using
statistical methods to account for such variability is recommended.
Figure 2.2. Force-deflection curve for saline ice (Schwarz, 1975).

8
The main approaches that have been used to measure ice flexural strength are cantilever
beam, three-point and four-point bending tests; these are discussed in detail below.
2.2.1 Cantilever beam tests
Cantilever tests are usually done in situ, and are easy to perform on large beams. Like all
in situ tests, they have the advantage of maintaining the temperature gradient and variation
through the thickness of ice cover by utilizing its full thickness (Ji et al., 2011; Blanchet et
al., 1997). The general technique for obtaining ice flexural strength using cantilever tests
is as follows: First a U-shaped channel is cut in the ice. This channel isolates an in-place
cantilever ice beam with one end attached to the sheet. Both pull-up and push-down tests
can be performed on these beams using a vertical load applied to the free end of the ice
beam until it fails; see Figure 2.3.
Figure 2.3. Cantilever beam test.

9
As discussed in more detail later, an important consideration for cantilever tests, is whether
or not the beam fails at the root due to stress concentrations. This results in lower strength
values than typically obtained in three- and four-point tests (Timco and O’Brien, 1994;
Frederking and Häusler, 1978). This effect is more pronounced in freshwater ice, as it is
more brittle than sea ice (Timco and O’Brien, 1994). To minimize stress concentrations,
circular cuts should be made at the root of the beam. The radius of these circles is suggested
to be 1/15th of the beam width (Schwarz et al., 1981). Svec et al.(1985) suggested relieving
the stress concentration by drilling holes of a similar radius as a better solution.
For cantilever tests, the flexural strength is calculated using simple elastic beam theory,
σ𝑓 =6𝐹𝐿
𝑏ℎ2 ,
(2.1)
where F is the maximum force required to break the beam, L is the beam length, b is the
beam width, h is the beam thickness. Shear force and bending moment diagrams of
cantilever beam tests are shown in Figure 2.4.
Figure 2.4. Cantilever beam shear force and bending moment diagrams.

10
2.2.2 Three- and four-point bending tests
For three- and four-point bending, the ice beam is completely cut free from the ice sheet.
The ends of this beam are supported, and load is applied at the center in case of three-point
bending, and at two equidistant points in case of four-point bending, as is shown in
Figure 2.5 and Figure 2.6, respectively.
For three-point bending tests, the flexural strength is calculated as,
σ𝑓 =3𝐹𝐿
2𝑏ℎ2 .
(2.2)
Shear force and bending moment diagrams of three-point bending beam tests are shown in
Figure 2.7.
Figure 2.5. Three-point bending test.

11
Figure 2.6. Four-point bending beam test.
Figure 2.7. Three-point bending tests shear force and bending moment diagrams.
For four-point bending tests, the flexural strength is calculated as,

12
σ𝑓 =3𝐹c
𝑏ℎ2 ,
(2.3)
where c is the distance from the loading pin to the end support. Shear force and bending
moment diagrams of four-point bending beam tests are shown in Figure 2.8.
Figure 2.8. Four-point bending tests shear force and bending moment diagrams.
The disadvantage of three-point bending tests is that the beam usually fails at the center,
where the maximum moment takes place, preventing the beam from failing at its weakest
point. Four-point bending tests result in a large central region of constant moment and zero
shear between the loading points allowing the beam to fail at its weakest point, which is
generally recommended for brittle materials.
Local indentation effects at the loading and supporting points can be cause for concern in
three- and four-point bending. The test apparatus should have round supports to avoid stress
concentration or local indentations at these points (ITTC, 2014). The actual point for

13
deflection measurements should be about 10 cm from the center of the beam for 3-point
bending tests, to avoid local deformation effects (Gow, 1977).
2.3 Scale Effects in Ice Mechanics
2.3.1 Theoretical Basis for Scale Effects in Ice
Theoretical statistical and probabilistic theories of fracture have been applied to many other
brittle materials, such as ceramics (Batdorf and Heinisch, 1978; Evans, 1978), glass (Reid,
1991) and concrete (Bazant, 1998; Mier, 1997) as discussed by (Taylor, 2010). Ice failure
can be modeled by Weibull weakest-link theory, where the failure exhibited by a system is
governed by the failure of its weakest element. The famously known Weibull three-
parameter probability distribution is based on this theory. Parsons and Lal (1991)
demonstrated the goodness of fit of Weibull distributions to sea-ice flexural strength data.
They concluded this by examining Weibull fit for thirteen experimental datasets
(Figure 2.9). Likewise, Tozawa and Taguchi (1986) got the same conclusion for freshwater
ice. They conducted three-point bending tests for different specimen sizes, and then
evaluated Weibull fit for the tests’ results (Figure 2.10, Figure 2.11 and Figure 2.12).

14
Figure 2.9. Weibull fit of four out of thirteen flexural strength experimental datasets
(Parsons and Lal, 1991).
Figure 2.10. Weibull plot for small specimen size data (Tozawa and Taguchi, 1986).

15
\
Figure 2.11. Weibull plot for medium specimen size data (Tozawa and Taguchi, 1986).
Figure 2.12. Weibull plot for large specimen size data (Tozawa and Taguchi, 1986).
Weibull assumes that the maximum capacity of the system is the minimum of system
elements’ capacities. Thus, when the demand increases, the system will not fail until the

16
capacity of the limiting weakest element is exceeded. This can be interpreted as the
distribution of the minimum of a set of random strengths of system elements (Taylor,
2010). Hence, when an ice beam is subjected to pressure, failure will not occur unless at
some location, the stress (demand) exceeds ice strength (capacity of the system). If no
failure occurs for a given pressure, the pressure will continue to increase until ice fails at
some location (Figure 2.13).
Figure 2.13. Specimen in tension; failure results in total loss of strength (Taylor and
Jordaan, 2015).
Weibull weakest-link theory will be discussed below in the context of ice statistical
fracture and failure modeling for both homogeneous, and inhomogeneous stress states
where stress varies across the beam.
2.3.1.1 Weibull Theory and Associated Scale Effects
Jordaan (2005) described the Weibull (1951) weakest-link model as a chain of elements. If
this chain is composed of a series of n elements, the chain will fail if one of its elements
fails. If Ti is the strength of the ith element, and the strengths of the elements are

17
independent and identically distributed (iid), which have a distribution function FT(t) for
each element i = 1,2,3,.., n. Then, an ice beam fails when its weakest element fails. We
denote the strength of the whole beam as R. Thus, R = min (T1,T2,T3,..,Ti,..,Tn) or R=
minn 𝑇𝑖, and the failure probability of the beam FR(r) can be expressed by,
FR(r) = 1 − [1 − FT(r)]n. (2.4)
This also can be written using exponential and natural logarithm functions as,
FR(r) = 1 – exp{n ln[1 − FT(r)]}. (2.5)
For an ice beam of volume 𝑉 composed of elements each of volume 𝜈0, then n = 𝜈/𝜈0
elements, and Equation 2.5 can be written as,
𝐹𝑅(𝑟) = 1 − 𝑒𝑥𝑝 {𝑉
𝜈0ln[1 − 𝐹𝑇(𝑟)]}.
(2.6)
Weibull suggested using a power-law material function m(r), which is an empirical function
to replace the term {ln[1 FT (r)]} where,
𝑚(𝑟) = (𝑟−𝑟0
𝑟1)
𝛼
. (2.7)
In this expression, α and 𝑟1 are constants representing the distribution shape and scale
parameters respectively. The constant 𝑟0 represents the lower limit for ice strength. By
substituting Equation 2.7 into Equation 2.6 we get,
𝐹𝑅(𝑟) = 1 − 𝑒𝑥𝑝 {−𝑉
𝜈0(
𝑟 − 𝑟0
𝑟1)
𝛼
}. (2.8)
If this is compared with the standard general three-parameter Weibull distribution,

18
𝐹𝑋(𝑥) = 1 − 𝑒𝑥𝑝 {− (𝑥−𝛾
𝛽)
𝛼
}, (2.9)
we get r ≡ x, (𝑣0
𝑉)
1
𝛼 𝑟1 ≡ 𝛽 and 𝑟0 ≡ 𝛾. In most cases, 𝑟0 is assumed to be zero since this is
a natural limit for strength, which simplifies the expression for Equation 2.9 to,
𝐹𝑅(𝑟) = 1 − 𝑒𝑥𝑝 {−𝑉
𝜈0(
𝑟
𝑟1)
𝛼
}. (2.10)
2.3.1.2 Inhomogeneous Stress State
Jordaan (2005) suggested a way to modify Weibull theory to account for inhomogeneous
stress case. Taylor (2010) simplified this method, so an ice beam having an inhomogeneous
state of stress is approximated to contain n homogeneously stressed elemental volumes
ΔVi, where i= 1,2,3,⋯, n. For the small volume ΔVi, the center coordinates of the element
are given by 𝑥𝑖, and the elements have stresses σ(xi) at positions 𝑥𝑖.
In order to represent the stress at each element σ(𝑥𝑖), we use the formula,
𝜎(𝑥𝑖) = 𝑟𝜙(𝑥𝑖), (2.11)
where r represents a reference value, usually the maximum value in the body. The
parameter 𝜙(𝑥𝑖) is a function of position, which represents the variation of stress across
the body due to inhomogeneity.
Using Equation 2.5 again, but replacing r by 𝜎(𝑥𝑖), and the volume 𝜐 is divided into n small
elements each with volume ΔVi , where i =1,2,3,⋯, n.

19
Then the failure probability of the specimen is,
𝐹𝑅(𝜎) = 1 − exp [1
𝜈0∑ (Δ𝑉𝑖ln {1 − 𝐹𝑇(𝜎(𝑥𝑖)))𝑛
𝑖=1 ], (2.12)
and by substituting 𝜎(𝑥𝑖 ) = r𝜙(𝑥𝑖),
𝐹𝑅(𝜎) = 1 − exp [1
𝜈0∑ (Δ𝑉𝑖ln {1 − 𝐹𝑇(𝑟𝜙(𝑥𝑖)))𝑛
𝑖=1 ]. (2.13)
If the sum is replaced by an integral, the expression will be,
𝐹𝑅(𝑟) = 1 − exp [1
𝜈0∫ ln{1 − 𝐹𝑇(𝑟𝜙(𝑥𝑖))} 𝑑𝜈
𝑉] . (2.14)
By using the power-law material function,
𝑚(𝑟) = (𝑟𝜙(𝑥𝑖)−𝑟0
𝑟1)
𝛼
, (2.15)
suggested by Weibull instead of the term {ln[1 FT (𝜎(𝑥𝑖))]} as before, we get,
𝐹𝑅(𝑟) = 1 − 𝑒𝑥𝑝 [1
𝜈0∫ (
𝑟𝜙(𝑥𝑖)−𝑟0
𝑟1)
𝛼
𝑑𝜈𝑉
] . (2.16)
By simplification and setting 𝑟0= 0 as suggested before,
𝐹𝑅(𝑟) = 1 − 𝑒𝑥𝑝 [1
𝜈0(
𝑟
𝑟1)
𝛼
∫ 𝜙𝛼(𝑥𝑖) 𝑑𝜈𝑉
]. (2.17)
The integral in this equation is called “reduced volume” and can be found by,
𝑣∗ = ∫ 𝜙𝛼(𝑥𝑖) 𝑑𝜈.
𝑉
(2.18)
Then,
𝐹𝑅(𝑟) = 1 − 𝑒𝑥𝑝 [𝜈∗
𝜈0(
𝑟
𝑟1)
𝛼
] . (2.19)
The value 𝜈0 is a reference volume, such as that of a standard test specimen (Bolotin, 1969).

20
Equations 2.10 and 2.19 are the same except Equation 2.19 uses the ‘reduced volume’
concept 𝜈∗ due to the inhomogeneous stress state. Note that the ‘reduced volume’ is usually
less than the total volume of the body, which means that only a portion of the body is
subjected to tensile stress, hence the terminology.
Weibull theory accounts only for tensile strength, as it does not account for negative values
of compression stress. This is because it is assumed that cracks only grow when subjected
to tension. This is a problem for the study of compressive strength failure; however,
Parsons and Lal (1991) suggest that this will not matter in case of flexural failure. This due
to the fact that when a beam fails in flexure, the crack begins on the tensile surface of the
beam, and then propagates causing failure. Therefore, the Weibull model is expected to
provide good approximation of flexural strength.
Ice has many flaws and cracks, as the specimen size increases, the probability of
encountering such flaws increases leading to a decrease in the strength (Sanderson. 1988;
Tozawa and Taguchi, 1986). The statistical distribution of flaws and the probability of
critical ones becoming unstable is the dominant factor in ice failure. Larger ice samples
have a higher probability of containing critical flaws, so it is probable that these larger
specimens would fail at lower stress levels as shown in Figure 2.14 (Taylor, 2010).

21
Figure 2.14. Critical flaws distributed through samples (Taylor, 2010).
From Weibull theory (Jordaan, 2005), the mean value of Equation 2.10 is,
⟨𝑅⟩ = 𝑟0 + 𝑟1 (𝑉
𝜈0)
−1
𝛼 Γ (1 +
1
𝛼 ), (2.20)
where the lower limit value of strength 𝑟0 equals zero, and Γ() is the gamma function.
By dividing the means of strengths of the two volumes 𝑉1 and 𝑉2 as,
⟨𝑅⟩1
⟨𝑅⟩2=
𝑟0+𝑟1(𝑉1𝜈0
)
−1𝛼 𝛤(1+
1
𝛼 )
𝑟0+𝑟1(𝑉2𝜈0
)
−1𝛼 𝛤(1+
1
𝛼 )
, (2.21)
then,
⟨𝑅⟩1
⟨𝑅⟩2= (
𝑉2
𝑉1)
1𝛼
. (2.22)
From the relation in (2.22), we can conclude that statistically, ice strength is inversely
proportional to the power of beam volume . The same relation applies for reduced volumes.

22
Weibull scale effects model can be used to theoretically compare average strengths ⟨𝑅⟩ of
two volumes 𝜈1 and 𝜈2.
Tozawa and Taguchi (1986) confirmed the validity of Weibull model for describing scale
effects in ice flexural strength. They found that the mean flexural strength values from
three-point bending tests on freshwater ice specimens were in agreement with the ones
predicted from Weibull for different beam volumes (see Figure 2.15). Jordaan et al. (2007)
also fitted flexural strength datasets of freshwater ice in Figure 2.16, and found that Weibull
scaling relationship gives a good estimation of flexural strength with varying beam volume.
Figure 2.15. Comparing test results with Weibull model estimations (Tozawa and
Taguchi, 1986).

23
[
G
ra
b
y
o
ur
re
ad
er
’s
at
te
nt
io
n
w
it
h
a
gr
ea
t
q
u
ot
e
fr
o
m
th
e
d
oc
u
m
Figure 2.16. Scale effect in freshwater ice (Jordaan et al., 2007).
2.3.2 Scale Effect in Compressive Strength
For compressive ice strength there is general agreement on the existence of scale effects
(e.g. Taylor and Jordaan, 2015; Jordaan et al., 2012; Sanderson, 1988). Where ice
compressive ice is the limit stress, the estimation of ice loads depends on the presence of a
scale effect. The average pressure on the structure decreases with increasing contact area
(Sanderson, 1988); see Figure 2.17 and Figure 2.18. Measurements from the STRICE
project in the Baltic Sea done by Kärnä and Qu (2006) in Figure 2.19, showed a decrease
in average pressure with increasing ice thickness. For ice that is loaded in compression, the
occurrence of fracture under shear (wing cracks) and under tension (lateral tension cracks)
both contribute to local edge failure (Taylor, 2010). Consequently, local ice fracture
(m3)

24
processes are proven to be scale dependent, since larger beam volumes would be expected
to contain a larger flaw and would fail at a lower nominal stress.
Figure 2.17. Ice pressure vs. area from combined data (Masterson et al., 2007).
Figure 2.18. Weibull fit of compressive ice failure data showing scale effects (Taylor,
2010).

25
Figure 2.19. Data from the STRICE project (Jordaan et al., 2007).
Scale effects in ice compressive failure are attributed to two main reasons: ice fracture and
probabilistic averaging. Ice fracture depends on the probability of encountering flaws and
cracks which increases with increasing specimen size. On the other hand, probabilistic
averaging happens where the local pressures on local areas are averaged out to lower global
pressures (Taylor, 2010). For flexural strength, fracture mechanisms are expected to
dominate scale effects in beam failure. This is because the localized failure processes which
are responsible for probabilistic averaging are not typically present. In short, flexural
strength is detrmined by first crack, where compressive strength is determined from local
failure process. In the present analysis, the effects of localized compressive failure at the
point of local application are assumed to be negligible for beam tests. No further
consideration of compressive failure is given in this thesis. For full-scale scenarios,
consideration of the non-simultaneous nature of point loads that occur at the ice-structure
interface for ice failing in flexure against a sloped structure should also be considered.

26
2.3.3 Past Work on Scale Effect in Flexural Strength
Williams and Parsons (1994) found a clear trend of decreasing ice flexural strength with
increasing specimen size for both sea ice and freshwater ice. They concluded for sea ice
that, after brine volume, specimen size will have the second greatest influence on flexural
strength. For freshwater ice, specimen size has the strongest influence. They based their
conclusion on statistical correlation analyses for five ice flexural strength parameters: brine
volume, beam volume, grain diameter, temperature, and strain rate. They implemented
their analyses on a database compiled of 1771 sea ice and 650 freshwater flexural strength
measurements.
In their analysis, the authors excluded all freshwater ice cantilever tests from their database
due to the stress concentrations phenomena, which has been suggested to lower the flexural
strength of ice through the presence of stress raisers at the root of the beam. Using
regression analysis on their database, they developed an empirical two-parameter model of
sea-ice flexural strength as a function of brine and beam volumes as follows,
σ𝑓 = 1760(𝑒−5.395√𝑣𝑏)(𝑉
𝑉1)−0.057 , (2.23)
(see Figure 2.20 and Figure 2.22). For freshwater ice, only beam volume was considered
as the main factor controlling flexural strength,
σ𝑓 = 1629(𝑉
𝑉1)−0.084, (2.24)
where σ𝑓 is in kPa, 𝑉1 is a reference volume (it was suggested to be 0.01 m3), and 𝑉 is the
beam volume in m3 (Figure 2.21 and Figure 2.22).

27
Figure 2.20. Measured and model flexural strength vs beam size for sea-ice beams near
𝑣𝑏 = 0.03 (Williams and Parsons, 1994).

28
Figure 2.21. Measured and model flexural strength vs beam size for simple freshwater
beams (Williams and Parsons, 1994).
Figure 2.22. Flexural strength dependence on beam size for freshwater ice and sea ice of
different brine volumes (Williams and Parsons, 1994).
Lau et al. (2001) added their data to that of Williams and Parsons (1994) for both sea and
freshwater ice during a study on how to take scale effects in ice strength into consideration
during centrifuge model testing; they came to the same conclusion. Lavrov (1971) also
found from experiments that sea ice and freshwater ice flexural strength decreases as beam
thickness increases. Maattanen (1975) attributed observed scale effect behavior to the
stress field across the beam. He suggested that stress field converts to two dimensions as
beam size increases. As a result, it will be easier for fracture to take place between ice
crystals, causing the beam to fail under lower loads.

29
Frederking and Sudom (2013) also found that the flexural strength of multi-year sea ice
decreases as the specimen size increases. They found this result by analyzing simple beam
(three and four-point) test data for large and small beams cut from a multi-year sea-ice
ridge. They also analyzed ship ram data that was taken when traversing through multi-year
sea-ice floes, and found that flexural strength decreased as the thicknesses of the ice cover
increased (see Figure 2.23 and Figure 2.24).
Figure 2.23. Flexural strength normalized to a 1 knot (kt) ramming speed as a function of
floe thickness (Edge breaking mode) (Frederking and Sudom, 2013).
Several researchers disagree with, or have neglected the presence of a scale effect in the
flexural failure of ice. Timco and O'Brien (1994) developed a correlation between flexural
strength and brine volume using a database compiled of 2495 tests (1556 freshwater and
933 sea ice). They found that strength at times fluctuated by an order of magnitude for the
same brine volume. For freshwater ice, their analysis showed strong scatter in the data at

30
exact or close ice temperatures for the same test type. This suggests that there are other
factors that strongly affect the flexural strength. However, they attributed that larger beams
generally had lower strengths than smaller ice beams due to that large beam volumes
contain larger brine volume.
Figure 2.24. Flexural strength normalized to a 1 kt ramming speed as a function of floe
thickness (Continuous icebreaking mode) (Frederking,and Sudom, 2013).
Parsons and Lal (1991) did not observe significant a scale effect in their analysis of 13
datasets to check the goodness-of-fit of the Weibull and double exponential distributions
for sea and freshwater ice flexural strength data. Parsons et al. (1992) found that for the
relatively small dataset they considered for first-year sea ice, the influence of specimen size
was not strongly evident. Using regressing analysis on experimental results from three-
point bending tests, they observed that sea-ice flexural strength depended only weakly on
beam volume for their data, according to the relation σ𝑓𝛼 𝑉−1/12. As for freshwater ice,

31
the dataset they considered showed less decrease in flexural strength with increasing
volume, and the authors suggested that scale effect can be completely neglected. Their
dataset included 127 sea-ice tests between 0.008 to 8 m3 volumes, and 80 freshwater tests
between 0.027 to 2.197 m3 volumes.
It is important to note that given the high scatter inherent in ice data, this is not surprising
since sufficiently large ranges and number of data are needed to see trends more distinctly.
2.4 Summary
As reviewed in previous sections, there is both strong theoretical basis for why scale effects
are expected, and strong empirical evidence that they exist, but yet current ice flexural
strength models do not account for their presence. An ice beam will not fail until the
strength at some location is exceeded. When a beam fails in flexure, the crack begins on
the tensile surface. On this basis, from Weibull theory, we would expect scale effects in ice
flexural strength to exist.
The main methods for measuring ice flexural strength are cantilever beam, three-point and
four-point bending tests. Ideally one should use four-point bending tests since they produce
a state of pure bending with constant moment and zero shear in the region between the two
applied forces. This allows the beam to fail at its weakest point, rather than the loading
point, which is desirable to provide more representative flexural strength measurements.
Moreover, given the small amount of such data available, all test types should be

32
considered, given appropriate assessment of the effects of other factors such as temperature
and stress concentrations.
Frederking and Sudom (2013), Lau et al.(2001), Williams and Parsons (1994), Maattanen
(1975) and Lavrov (1971) found a clear trend of decreasing ice flexural strength with
increasing specimen size for both sea ice and freshwater ice. Prior analysis that did report
significant scale effects (Parsons et al., 1992, Parsons and Lal, 1991) focused on small
datasets over a limited range. To provide an updated treatment of scale effects, and help
clarify issues associated with use of data from multiple sources, a detailed review and
analysis of ice flexural strength data for freshwater ice are presented in Chapter 3, and for
sea ice in Chapter 4.
33
3 Freshwater Ice Flexural Strength
The absence of brine in freshwater ice leads to distinct differences from sea ice.
Consequently, this chapter only considers freshwater ice behavior; sea ice is considered in
Chapter 4. Freshwater ice flexural strength depends on physical parameters such as grain
size, crystal orientation and type (granular, columnar, discontinuous columnar or frazil),
temperature and specimen size. In addition to external parameters, such as test conditions
(cantilever, three-point or four-point bending), loading direction and loading rate will affect
the strength properties of ice in flexure (Timco and O'Brien, 1994). In Section 3.1, the
database of freshwater ice flexural strength measurements is introduced. Flexural strength
dependencies are then reviewed (Section 3.2). The analysis that has been done for scale
effects in freshwater ice flexural strength is discussed in Section 3.3. In Section 3.4, a
residual analysis was conducted to model variability in these data. Finally, a summary of
the chapter is given in Section 3.5. The work included in this chapter was also presented in
a paper entitled ‘Scale Effect in Freshwater Ice Flexural Strength’ at the ASME 37th
International Conference on Ocean, Offshore & Arctic Engineering in Madrid, Spain (see
Appendix A for details).
3.1 Freshwater Flexural Strength Database
To thoroughly examine flexural failure of freshwater ice, an updated database has been
compiled, which includes data from 2073 freshwater ice beam tests between 1.6 x 10⁻⁵ to
2.197 m3, making this database the most comprehensive, to the best of the author’s
knowledge. The data were obtained from 16 papers from the literature as summarized in

34
Table 3.1. The table lists information about each source, including the authors, test type,
number of tests, location (field or laboratory), beam volume, ice temperature and flexural
strength. Flexural strength measurements are plotted in Figure 3.1 against beam volume;
both are on logarithmic scale. Data points are given symbols according to their sources
listed in Table 3.1.
Table 3.1. Summary of Freshwater Ice Data
Symbol Author No. of
tests Location Test type
Beam
volume
(m3)
Temperature
(℃)
Flexural strength
(kPa)
Parsons et al. (1992) 80 Laboratory 3-pt bending 0.027 -
2.197 -4.8,-5.5,-0.5 1805.9 ± 97
Frederking and
Timco (1983) 67 Field Cantilever
0.00092-
0.01593 -3 790.1 ± 205.8
Lavrov (1971) 180 Field
Cantilever
and 3-pt
bending
0.00029 -
0.102 -5.5 to -0.5 1645 ± 555.4
Dempsey et al.
(1988) 15 Laboratory 4-pt bending
0.00092 -
1.012 -10 2169.3 ± 999.6
Barrette (2011) 56 Laboratory 4-pt bending 0.001 -9,-5.5,-0.5 1254.7 ± 561.8
Tatinclaux and Wu
(1978) 15 Laboratory
3 and 4-pt
bending 0.00053 -5 2025.9 ± 444.2
Tozawa and Taguchi
(1986) 112 Laboratory 3-pt bending
0.00016-
0.00281 -2 2047 ± 486.6
Tabata (1967) 40 Laboratory 4-pt bending 0.00024 -15,-55 2810.5 ± 1347.5
Frankenstein (1959) 228 Field Cantilever 0.0296-
0.899 -9.7 to 0 496.9 ± 175.9
Gow and Langston
(1975) 123 Field Cantilever
1.219-
0.0133 - 531.3 ± 369.7
Gow et al. (1978) 62 Field
Cantilever
and 3-pt
bending
0.532-
1.38 -1,-3.5 756.8 ± 267.9
Gow et al. (1988) 706 Laboratory
Cantilever
and 3-pt
bending
0.00259-
0.00117 -19 to -1 1226.6 ± 486.9
Timco and
Frederking (1983) 28 Laboratory 4-pt bending 0.0026 -3 867.9 ± 129.3
Frederking and
Sudom (2013) 6 Field 3-pt bending 0.0018 -21 2327
Drouin and Michel
(1972) 331 Laboratory 4-pt bending
0.00457-
0.724 -15, -1 1411.5 ± 479.5
Williams (1990) 22 Laboratory 3-pt bending 0.0355 -20 1715.1 ± 340.4

35
Figure 3.1. Freshwater ice flexural strength vs. beam size.
Specimen volume in this database was chosen to be represented by beam volume as has
been used by many researchers as an appropriate way to study scale effects. Williams and
Parsons (1994) also suggested using beam volume to represent specimen size, mainly
because there are not enough details over the range of data in the literature to study the
effect of each beam dimension separately. The same approach has been used in the present
analysis.
3.2 Flexural Strength Dependencies
For temperature, Timco and O'Brien (1994) and Tatinclaux and Wu (1978) found no
significant effect on flexural strength as shown in Figure 3.2 and Figure 3.3.

36
Figure 3.2. Freshwater ice flexural strength vs. ice temperature measured using simple
beam tests (Timco and O'Brien, 1994).
Figure 3.3. Freshwater ice flexural strength vs. ice temperature measured using cantilever
beam tests (Timco and O'Brien, 1994).

37
From the collected database in this study, the flexural strength of each test was plotted
against ice temperature in Figure 3.4. Based on these observations, it is evident that for
freshwater ice, there is a high degree of variability over the entire temperature range, and
flexural strength does not depend significantly on ice temperature over the range typically
of interest for engineering applications. This result is consistent with the work of Timco
and O'Brien (1994) and Tatinclaux and Wu (1976). On this basis temperature was
neglected as a factor in the regression analysis.
Figure 3.4. Freshwater ice flexural strength vs. ice temperature.
Loading rate is reported inconsistently or not at all in many cases. Some researchers
reported stress rate where others reported strain rate, and the relationship between them is
38
not well determined for ice (Timco and Weeks, 2010; Timco and O'Brien, 1994). Timco
and Frederking (1983) found that the effect of stress rate is limited for flexural strength.
When strain rate was measured, Maattanen (1975), Tabata et al. (1975) and Tabata (1967)
showed that for a broad range of strain rates, sea-ice flexural strength generally increases
with increasing strain rate. At very low strain rates, viscous behavior usually takes place,
while at high strain rates, beam inertia, shear and water or wave effects (water
displacement) appear (Ervik, 2013). To get accurate values of flexural strength,
independent of the loading rate, it has been recommended to use a fixed test time of about
1 second (Timco and Weeks, 2010; Schwarz, 1981).
The most pronounced effects of strain rate occur where they result in a change in failure
behavior (for example, for compression ductile failure is prominent for 𝜀 < 10-3, and brittle
behaviour at higher rates). Here it is assumed that if the beams are failing in a brittle
manner, then this is sufficient for inclusion in the present analysis since ice drifts over a
wide range of speeds in nature and an overall approach which capture the scatter over the
brittle domain is deemed a reasonable approach.
Ice can be loaded in either upward, downward or sideways orientations. In general, flexural
strength represents the tensile strength of the extreme fiber, which is in the cold upper part
in case of push-down, and of the warm bottom in case of pull-up configuration. The loading
direction is usually vertical to stimulate the reaction of ice to loading from an icebreaker
or a structure with inclined faces. For freshwater ice, Gow et al. (1978) concluded that
loading direction has no effect on flexural strength. However, it is worth mentioning that
39
Tatinclaux and Wu (1978) found that the loading direction has a significant effect. This
was attributed to the difference of crystal size between the upper and bottom surfaces of
the beam.
Other parameters are considered to have less influence on ice flexural strength. Based on
the above considerations, the effects of ice microstructure, loading direction, temperature
and loading rate are not considered further here. Emphasis here is placed on the effect of
specimen size.
3.3 Scale Effects
In Figure 3.1, where all measurements are plotted, there is a general trend of decrease in
freshwater ice flexural strength with increasing beam volume. Williams and Parsons (1994)
suggested that strengths should be averaged for tests that have the same beam volume (and
similar tests conditions) to avoid biasing the data towards small-scale strength
measurements, which are represented in significantly more reported tests than larger-scale
measurements.
To be consistent with this approach, the average strength values are given in Figure 3.5,
along with the best fit line suggested by Williams and Parsons (1994). The figure shows
that while there is a general scale effect, the Williams and Parsons (1994) model line does
not fully capture the scale effects trend, suggesting that further analysis is needed.

40
Figure 3.5. Freshwater ice flexural strength vs. beam volume using average values of
strength for all tests with same beam volume.
Test location (field or laboratory) and test type (cantilever, three-point or four-point
bending) have an influence on flexural strength and the scale effects associated with it. To
examine this, freshwater ice flexural strength measurements were plotted against beam
volume whilst differentiating between test location in Figure 3.6 and test type in Figure 3.7.

41
Figure 3.6. Plot of all freshwater ice flexural strength vs. beam volume data grouped to
indicate test location as either field or laboratory.
Figure 3.7. Plot of all freshwater ice flexural strength vs. beam volume data grouped
according to test type.
15cm
30cm
E-bracket
Sidewall

42
Differentiating between test locations (Figure 3.6) is of interest here because field data
correspond to ice that is more representative of ice in full-scale applications. Ice in the field
has many naturally occurring flaws that are not present in laboratory ice. Laboratory test
specimens are usually selected to ensure they have minimal flaws. Furthermore, they have
smaller volumes which may not be large enough to account for large grain sizes found in
some ice environments.
By comparing Figure 3.6 and Figure 3.7, it may be observed that the field tests were mainly
done using the cantilever technique, while most of the three- and four-point bending tests
were conducted in the lab. For freshwater ice, cantilever beam tests are generally believed
to yield lower strength values than other measurement methodologies. This was confirmed
by plotting the flexural strength field data against beam size while differentiating between
cantilever beam tests and those for the three-point and four-point bending tests, as shown
in Figure 3.8. This is mainly attributed to stress concentrations formed at the root of the
beam. This behavior was studied and confirmed by several researchers, including Svec et
al. (1985), Svec and Frederking (1981) and Schwarz and Weeks (1977).
To avoid excluding the cantilever tests from this analysis, as was done by Williams and
Parsons (1994), a correction factor was instead used to account for reduction in strength in
cantilever field tests. This was done by first fitting lines of best fit to the log-log plots
(Figure 3.8), using least-squares regression method for the cantilever and grouped three-
and four-point test field data, respectively.

43
Figure 3.8. Plot of freshwater ice flexural strength tests vs. beam volume grouped by test
type (field data only).
This produced the flexural strength equation for field cantilever tests:
σ𝑓 𝐶𝑎𝑛𝑡𝑖𝑙𝑒𝑣𝑒𝑟 = 400(𝑉 𝑉1⁄ )−0.13. (3.1)
Similarly, a flexural strength equation for the grouped field three- and four-point bending
tests was obtained,
𝜎𝑓 3−4 𝑃𝑜𝑖𝑛𝑡 = 828(𝑉 𝑉1⁄ )−0.13 , (3.2)
where σ𝑓 is the flexural strength in kpa, 𝑉 is the beam volume in m3 and 𝑉1 is a reference
volume (1 m3). The exponents in the previous equations were rounded from -0.1296 and
50cm
Water
frozen
in hole

44
-0.1311 respectively to -0.13 to simplify calculations. Taking a ratio of Equation 3.2 to
Equation 3.1 yields a correction factor of about 2. This is consistent with Gow (1977), who
conducted a number of cantilever and three-point bending tests to explore this difference,
and found correction factors in the range of 1.2 to 2. The corrected cantilever beam field
datasets have been combined with the three-point and four-point field data sets and plotted
in Figure 3.9.
Figure 3.9. Freshwater ice beam flexural strength vs. beam volume for all field tests
including corrected cantilever test data.

45
Using the same fitting method, the combined and corrected field data were fit by the
relationship,
σ𝑓 = 839(𝑉 𝑉1⁄ )−0.13. (3.3)
By implementing a statistical t-test for the linear regression of freshwater ice data in Figure
3.9, it can be noted that the p-values for the coefficients are less than 0.005. This indicates
that the fitted line slope is significantly different from zero. Thus the observed scale effects
have a significant statistical basis, and are not just based on visual conclusion. This
expression can be used to assess how such scale effects may influence ice loads on ships
and structures under different conditions, leading to potential opportunities for refinement
of current design methodology.

46
3.4 Residuals Analysis
The model developed in Section 3.3 can be used for estimating the mean freshwater ice
strength values that would be expected. However, there is also a need to capture the scatter
and variability that usually exist in ice strength data. Therefore, a residual analysis was
implemented, and the residuals were calculated, and based on the values of the same
volumes predicted by Equation 3.3. These Log values were fitted by a three-parameter
Weibull distribution as best fit (scale parameter 𝜂 = 3.622, shape parameter 𝛽 = 13.02,
location parameter 𝛾 = -3.484); see Figure 3.10 and Figure 3.11. It noted here that, as
discussed by Neter et al. (1996) and Minitab (2017), as long as n > 40, the regression
analysis is valid and not sensitive to the normality of the residuals.
Figure 3.10. Probability plot of residuals for three-parameter Weibull distribution.

47
Figure 3.11.Weibull distribution histogram of residuals for freshwater ice.
As shown in Figure 3.10, the probability plot of residuals for the three-parameter Weibull
distribution shows a good fit to the extreme strength values, which of an interest to design,
and also to the mean values for operational use. Consequently, a probabilistic model based
on the empirical relationship in Equation 3.3, and accounting for contribution of residuals
is givens as,
σ𝑓 = 840(𝑉 𝑉1⁄ )−0.13 ∙ 𝑒𝑟 , (3.4)

48
where 𝑟 is the residual, which can be sampled from the stated Weibull distribution. This
model can be used to enhance probabilistic calculations and Monte Carlo simulations for
ice loads where freshwater ice flexural strength is an input.
3.5 Summary
For freshwater ice, ice temperature was observed to have a limited effect on flexural
strength. Other factors, such as ice microstructure, loading direction, temperature and
loading rate, were not found to have a significant effect, and were not considered. The data
show a considerable decrease in flexural strength as specimen size increases. When
examined over a large size range, scale effects were observed to be a dominant factor
affecting flexural strength. When considered separately, laboratory test data for ice flexural
strength are observed to contain higher values and exhibit less pronounced scale effects
than are expected in natural ice at full-scale. This is due to the smaller beam size and
exclusion of specimens containing flaws from laboratory test programs, since the presence
of natural flaws ice is an important consideration to scale effects.
In the field, for freshwater ice cantilever beam tests may give lower flexural strength
values compared to other testing techniques due to stress concentrations at the root of the
beam. However, these results should be corrected to avoid excluding them since they are
highly important in representing large-scale beams of ice formed under natural conditions.
A correction factor of about 2 was observed when field data for cantilever and three- and
four-point tests were compared.

49
Based on the analysis presented in this chapter, a new empirical relationship given by
Equation 3.3 above was developed to account for the effect of specimen volume on
freshwater ice flexural strength. In addition, a probabilistic model based on the empirical
equation was developed based on an analysis of the residuals, given by Equation 3.4.

50
4 Sea Ice Flexural Strength
For sea ice, brine volume is also an important parameter influencing flexural strength in
addition to specimen size, grain size, crystal orientation and type (granular, columnar,
discontinuous columnar or frazil), temperature, salinity, test conditions (cantilever, three-
point or four-point bending), loading direction and loading rate (Timco and O'Brien, 1994).
The compiled database of sea-ice flexural strength measurements is presented in
Section 4.1. In Section 4.2, the parameters affecting sea-ice flexural strength are discussed.
Brine volume influence is covered in Section 4.3. Scale effects in sea-ice flexural strength
are examined in Section 4.4. In Section 4.5, a residual analysis is implemented to capture
the scatter in sea-ice strength data. Finally, a summary of the chapter is given in Section
4.6.
4.1 Sea Ice Flexural Strength Database
To thoroughly examine flexural failure in case of sea ice, an updated database has been
compiled, which includes data from 2843 sea-ice beam tests between 0.00048 to 59.87 m3,
making this database the most comprehensive to date for sea-ice flexural strength
measurements, to the best of the author’s knowledge. The data were obtained from 36
papers from the literature as summarized in Table 4.1. The table lists information about
each source, including the authors, test type, number of tests, location (field or laboratory),
beam volume, ice temperature and flexural strength. Flexural strength measurements are
plotted in Figure 4.1 against beam volume; both are on logarithmic scale. Data points are
given symbols according to their sources listed in Table 4.1.
51
Table 4.1. Summary of Sea Ice Data
Symbol Author No. of
tests Location Test type
Beam
volume
(m3)
Avg. brine
Volume
(ppt)
Flexural strength
(kPa)
Murat and Tinwai
(1977) 148 Laboratory 3-pt bending
0.00068-
0.0013 25.8 622 ± 196.9
Ervik (2013) 12 Field Cantilever 0.323-
1.86 70.2 225.33± 80.8
Lau and Browne
(1989) 5 Field 3-pt bending 0.00079 28.5 1040.28 ± 272.1
Vaudrey (1975) 434 Lab and
Field
Cantilever &
3-pt bending
0.001-
1.92 33.6 572.6± 236.6
Saeki et al. (1978) 41 Field 4-pt bending 0.004 60.8 649.9 ± 176.5
Borek et al. (1988) 27 Field 3-pt bending 0.029-
0.0729 18 1773.4 ± 507.7
Butkovich (1956) 88 Field Cantilever &
3-pt bending
0.0034-
0.159 53 699 ± 299.8
Butkovich (1959) 70 Field 3-bending 0.0014 24.9 1467.8 ± 920.5
Frankenstein,
Guenther and Garner
(1970)
82 Field 3-pt bending 0.0017 30.8 1091.9 ± 347.3
Frederking and
Häusler (1978) 11 Field Cantilever
0.0008-
0.003 105 464.5 ± 229.3
Kayo et al. (1983) 90 Field
Cantilever &
3-pt bending
0.035-
0.64 108 386 ± 81
Lainey and Tinawi
(1981) 22 Laboratory 4-pt bending 0.0064 21 1068.3 ± 714.9
Michailidis (1981) 9 Field Cantilever
5.314-
8.28 14 266.8 ± 65.8
Parsons et al. (1992) 127 Field Cantilever 0.008-8 10 1215.5 ± 260.64
Tabata (1967) 39 Laboratory 4-pt bending 0.00048 8 1065 ± 86
Tabata et al. (1967) 24 Field Cantilever 0.35 197.4 109.1 ± 19.85
Frederking et al.
(1982) 21 Field 4-pt bending 0.024 15.5 909.9 ± 158.9
Weeks and Anderson
(1958) 208 Field Cantilever
0.034-
0.138 124 210.2 ± 47.6
Williams et al.
(1991) 43 Field Cantilever
0.8618-
2.42 45 232.6 ± 66.2
Williams et al.
(1992) 71
Field &
Laboratory 3-pt bending
0.0067-
0.6867 56.1 566.5 ± 157.3
Williams et al.
(1993) 38 Field 3-pt bending
0.0088-
0.4234 20.2 898 ± 214.8
Williams et al.
(1993) 8 Field 3-pt bending
0.00792-
0.0136 45 418.5 ± 102.8
Airaksinen (1974) 27 Field Cantilever 0.0282-
0.0903 46 438 ± 70.8

52
Saeki et al. (1981) 31 Field 3-pt bending 0.006-
0.1851 49.4 539 ± 208
Dykins (1971) 285 Field and
Laboratory
3-pt & 4-pt
bending
0.001- 59.87
71.5 406.5 ± 149
Marchenko (2017) 2 Laboratory Cantilever 0.0079 104 112.6 ± 21.2
Dykins (1968) 37 Laboratory 3-pt bending 0.0011 8.7 1150.3 ± 41.9
Kujala et al. (1990) 34 Field 4-pt bending 0.495-
0.7189 45.1 571.4 ± 116.2
Blanchet et al.
(1997) 41 Field Cantilever 0.0037-6 22.6 937.4 ± 235.7
Butkovich (1959) 100 Field 3-pt bending 0.0014 - 2172.2 ± 108.6
Ji et al. (2011) 153 Field 3-pt bending 0.0039 84.5 861.9 ± 478.4
Christensen (1986) 6 Field 3-pt bending 0.079-
0.0956 14.3 598.3 ± 199
Tatinclaux and Wu
(1978) 13 Laboratory 4-pt bending 0.0005 16.9 347.9 ± 382.6
X Shapiro and Weeks
(1995) 137 Field 4-pt bending - 0.0011 509.4 ± 117.2
X C-CORE 7 Field 4-pt bending - 0.7-3.85 346 ± 145.6
X Frederking and
Sudom (2013) 10 Field 3-pt bending -
0.0018-
0.0281 686.8 ± 14.3

53
Figure 4.1. Sea ice flexural strength vs. beam size.
Similar to the case of freshwater ice, specimen volume in the sea-ice database was chosen
to correspond to beam volume as has been used by many researchers as a representative
way to study scale effects. Williams and Parsons (1994) suggested representing specimen
size by beam volume, mainly because there are not enough details over the range of data
in the literature to study the effect of each beam dimension separately. The same approach
has been used in the present analysis.

54
4.2 Flexural Strength Dependencies
Loading rate, as mentioned before, is reported inconsistently or not at all in many cases.
Timco and Weeks (2010) and Timco and O'Brien (1994) stated that there are not enough
studies to give accurate facts. However, for sea ice Blanchet et al. (1997) found that the
stress rate has very little effect on flexural strength. Ji et al. (2011), Tabata et al. (1975) and
Gagnon and Gammon (1995) suggested that the average flexural strength slightly increases
with increasing stress rate (see Figure 4.2). However, the maximum values of flexural
strength show a decreasing trend with stress rate, and a clear trend is not evident in the
data.
Figure 4.2. Flexural strength-stress rate relationship (modified after Ji et al., 2011).
At very low strain rates, viscous behavior usually takes place, while at high strain rates,
beam inertia, shear and water or wave effects (water displacement) appear (Ervik, 2013).
To get accurate values of flexural strength index, independent of the loading rate, tests

55
should be done at test time of around 1 second (Timco and Weeks, 2010; Schwarz et al.,
1981) or a correction factor should be added to account for the beam mass and the
hydrodynamic effect of water (Maattanen, 1975). Insufficient information is currently
available for hydrodynamic effects, so this has not been considered further here.
Regarding ice microstructure, if ice samples are taken from different positions through
thickness of ice cover, Timco and Frederking (1982) found that sea-ice flexural strength is
higher in the upper region where ice is granular, and lower in the lower region where the
ice is columnar (see Figure 4.3). When there is evidence of c-axis alignment, sea-ice
flexural strength is higher along the hard-fail direction (perpendicular to c-axis) than easy-
fail direction (parallel to c-axis) by about 50%. In addition, beams cut vertically from the
ice sheet have 2-5 times higher strength than horizontal ones (Kayo et al., 1983). Due to
the lack of reporting in the data, further treatment of the effects of ice microstructure are
beyond the scope of this work.
The loading direction (upward/downward) for sea-ice cantilever beam tests has been found
to have little effect on sea-ice flexural strength (Timco and O'Brien, 1994; Weeks and
Assur, 1967; Brown and Kingery, 1963; Weeks and Anderson, 1958). On this basis,
loading direction is not considered further here.

56
Figure 4.3. Flexural strength vs. depth (Timco and Frederking, 1982).
Unlike in freshwater ice, temperature has a major influence on sea-ice flexural strength. As
the temperature decreases the flexural strength increases; see Figure 4.4 (Blanchet et al.,
1997; Timco and O'Brien, 1994; Weeks and Anderson, 1958). This is attributed to two
reasons. First, the decrease in temperature causes the stress required to activate dislocation
motion to increase exponentially, which causes the ice to become more brittle with
decreasing temperature (Goodman et al., 1981). Second, as temperature decreases, the
brine volume (and porosity) decreases. This increases the ice-to-ice contacts leading to
stronger ice (Timco and O'Brien, 1994).

57
Figure 4.4. Flexural strength vs temperature for sea ice (Timco and O'Brien, 1994).
Frankenstein and Garner (1967) suggested the following formula to calculate brine volume
between the temperatures -0.5°C and -22.9°C as function of salinity 𝑆 (in ppt) and
temperature 𝑇 (in °C),
𝑣𝑏 = 𝑆 (49.185
𝑇+ 0.532),
(4.1)
which assumes a constant density of 0.926 Mgm-3 for sea ice. Timco and Frederking (1996)
pointed out that density of sea ice is not constant and ranges from 0.84-0.94 Mgm-3. Cox
and Weeks (1983) developed the following equations to calculate the total ice porosity
(brine volume plus the volume occupied by air),
𝑣𝑏 =𝜌𝑠𝑖 𝑆
𝐹1(𝑇),
(4.2)

58
𝑣𝑎 = 1 −𝜌𝑠𝑖
𝜌𝑖+ 𝜌𝑠𝑖𝑆
𝐹2(𝑇)
𝐹1(𝑇),
(4.3)
where 𝜌𝑠𝑖 is the sea-ice density (in Mgm-3), 𝑆 is ice salinity (in ppt), 𝜌𝑖 is the density of
pure ice (in ppt), and 𝐹1(𝑇) and 𝐹2(𝑇) are functions for the temperature dependence of
density and salinity on brine and solid salt content (Cox and Weeks, 1983). However, ice
density is rarely reported, making it harder to calculate total porosity (Timco and Weeks,
2010). The relation between ice flexural strength and air porosity should be investigated
more in the future, but is beyond the scope of the current analysis.
A number of researchers including Barrette et al. (1999), Blanchet et al. (1997), Timco and
O'Brien (1994), Borek et al. (1988), Schwarz and Weeks (1977), Frankenstein, Guenther
and Garner (1970) and Weeks and Assur (1969) confirmed from experimental results for
sea ice that flexural strength decreases as brine volume increases. Timco and O’Brien
(1994) summarized 2495 flexural strength test points for both freshwater and sea ice, and
concluded that flexural strength has a negative exponential relationship to the square root
of brine volume (see Figure 4.5).

59
Figure 4.5. Flexural strength vs square root of brine volume (Timco and O'Brien, 1994).
This relation has a correlation coefficient 𝑟2 = 0.77 between the flexural strength and brine
volume as follows,
σ𝑓 = 1.76𝑒−5.88√𝑣𝑏, (4.4)
where σ𝑓 is flexural strength in MPa and 𝑣𝑏 is brine volume. The 1.76 MPa for zero brine
volume is close to the average strength of freshwater ice, which supports the usage of this
relation.
4.3 Brine Volume
From the database collected in this chapter, the flexural strength of each test was plotted
against brine volume in Figure 4.6. It is observed that flexural strength decreases as brine

60
volume increases, and has a negative exponential relationship to the square root of brine
volume as follows,
σ𝑓 = 1.73𝑒−4.89√𝑣𝑏 . (4.5)
From the freshwater ice measurements database, all data for temperatures below -4.5°C
have been averaged to give a value of 1.7 ± 0.6 MPa. In Figure 4.6, this range of the
average value plus and minus one standard deviation is indicated by a solid bar on the zero
brine volume axis. The strength value for zero brine volume from the model agrees with
the average value determined from the freshwater ice database. This indicates that the
model gives good approximation to sea-ice flexural strength as a function of brine volume.
The same approach was used by Timco and O'Brien (1994) to check the validity of the
brine volume model. Figure 4.6 and Equation 4.5 show good agreement between the new
model and the Timco and O'Brien (1994) model. However, the new model is recommended
for use to estimate flexural strength as function of brine volume only, because it is based
on more updated and comprehensive database. Flexural strength was plotted against brine
volume whilst differentiating between test location in Figure 4.7 and test type in Figure 4.8.
However, it is difficult to form any conclusion about the effect of test type or location due
to the influence of beam size from these plots. These effects are examined in more detail
in the next section.

61
Figure 4.6. Flexural strength vs square root of brine volume.

62
Figure 4.7. Flexural strength vs square root of brine volume grouped to indicate test
location as either field or laboratory.
Figure 4.8. Flexural strength vs square root of brine volume grouped according to test type.

63
4.4 Scale Effects
Figure 4.1, where all measurements are plotted, shows a decrease in sea-ice flexural
strength with increasing beam volume. However, brine volume should be considered
before developing a regression equation. This suggests that further detailed analysis is
needed. From the available literature, few tests were done on multi-year sea ice (Frederking
and Sudom, 2013; Gladwell, 1977). Flexural strength of multi-year ice is much higher than
first-year sea ice, because of brine drainage. Accordingly, multi-year ice tests were added
to freshwater ice tests (Figure 4.9), since they are more comparable. From this figure, it is
observed that multi-year data fit well within the range of the freshwater ice data. Use of the
freshwater data may be more appropriate for modelling multi-year ice; however, more data
for very large volumes of interest in multi-year interactions are needed to validate the
applicability of this freshwater ice curve for multi year ice load models.
For first-year ice, few tests were done in locations where ice is brackish (low salinity ice).
These tests were plotted with the rest of sea-ice flexural strength tests in Figure 4.10. As
expected, there is generally good agreement between brackish ice and first-year ice, but for
consistency brackish ice tests have been excluded from the rest of the analysis.

64
Figure 4.9. Multi-year sea ice and freshwater ice flexural strength vs. beam size.

65
Figure 4.10. Brackish and sea-ice flexural strength vs. beam size.
Test location (field or laboratory) and test type (cantilever, three-point or four-point
bending) have an influence on flexural strength and the scale effects associated with it. To
examine this, sea-ice flexural strength measurements were plotted against beam volume
whilst differentiating between test location in Figure 4.11, and test type in Figure 4.12.

66
Figure 4.11. Plot of all sea-ice flexural strength vs. beam volume data grouped to indicate
test location as either field or laboratory.
Figure 4.12. Plot of all sea-ice flexural strength vs. beam volume data grouped according
to test type.

67
As shown in Figure 4.11, laboratory data mostly have small volumes, which makes them
not representative of full-scale ice applications. Furthermore, their volumes may not be
large enough to account for grain size effects. In addition, laboratory test specimens are
selected to ensure they have minimal flaws, where ice in the field has many naturally
occurring flaws. Consequently, the focus of this analysis will be on field tests. By
differentiating between test types for all data (Figure 4.12) and considering only field tests
(Figure 4.13), it is observed that cantilever tests sometimes have lower strength values than
other measurement methodologies. However, this mainly attributed to scale, because
cantilever tests are usually done in field, and have larger volumes.
Figure 4.13. Plot of field sea-ice flexural strength vs. beam volume data grouped
according to test type.

68
It is believed that stress concentrations have very limited effect on sea-ice beams (Williams
and Parsons, 1994; Timco and O'Brien, 1994; Schwarz, et al., 1981; Schwarz and Weeks,
1977; Maattanen, 1975; Frankenstein, 1966). This mainly due to sea ice being more ductile
than freshwater ice, which relieves stress concentrations ( Schwarz and Weeks, 1977;
Frankenstein, 1966). Schwarz and Weeks (1977) and Maattanen (1975) stated that sea-ice
microstructure also contribute to less stress concentration effects. As a result, sea-ice
cantilever tests are not corrected in this analysis as they were for the case of freshwater ice
analysis.
To investigate influence of scale effects in sea-ice flexural strength without the influence
of brine volume, all flexural strength measurements were normalized against a reference
value. A reference value of 744.7 kPa was chosen based on a typical ice temperature of -10
℃ and salinity of 5 ppt using Equations 4.1 and 4.5. The formula used for the normalization
is as follows,
𝜎𝑁𝑜𝑟𝑚𝑎𝑙𝑖𝑧𝑒𝑑 = 𝜎𝑣𝑏 ×
𝜎𝑅𝑒𝑓𝑣𝑏,𝑅𝑒𝑓
𝜎𝑐𝑎𝑙𝑐𝑢𝑙𝑎𝑡𝑒𝑑,𝑣𝑏
, (4.6)
where 𝜎𝑁𝑜𝑟𝑚𝑎𝑙𝑖𝑧𝑒𝑑 is strength corrected to a reference brine volume, 𝜎𝑣𝑏 is the strength at
certain measured brine volume, 𝜎𝑐𝑎𝑙𝑐𝑢𝑙𝑎𝑡𝑒𝑑,𝑣𝑏= 1.73𝑒−4.89√𝑣𝑏 is the strength calculated at
the measured brine and 𝜎𝑅𝑒𝑓𝑣𝑏,𝑅𝑒𝑓= 1.73𝑒−4.89√𝑣𝑏,𝑅𝑒𝑓 is the strength at reference brine
volume, where 𝑣𝑏,𝑅𝑒𝑓 = S (49.185
𝑇+ 0.532) is the reference brine volume calculated using
an ice temperature 𝑇 = −10 ℃ and salinity 𝑆 = 5 𝑝𝑝𝑡.

69
The normalized flexural strength values were plotted against beam volume in Figure 4.14.
The figure shows that even when the data has been normalised to same brine volume, a
decrease in flexural strength with increasing volume is still evident. In addition, by
implementing a statistical t-test for the linear regression of sea-ice data in Figure 4.14, it
can be noted that the p-values for the coefficients are less than 0.005, which indicates that
the fitted line slope is significantly different from zero. This supports the observation that
scale effects are real and based on statistical rationale, not just visual conclusion. Since
brine volume and beam volume are the dominant parameters controlling flexural strength
of sea ice, a two-parameter model was developed using least-squares regression method,
𝜎𝑓 = 1324(𝑉
𝑉1)−0.054𝑒−4.969 √𝑣𝑏. (4.7)
This relationship can be used to enhance ships and structures design methodologies by
evaluating scale effects in flexural strength for ice load calculations in case of sea ice.

70
Figure 4.14. Plot of normalized field sea-ice flexural strength vs. beam volume.

71
4.5 Residuals Analysis
The model developed in Section 4.4 can be used to evaluate the mean trend of flexural
strength in case of sea ice. Nonetheless, to model the variability that usually exist in ice
strength data, an analysis of residuals was conducted by fitting the residuals of the fitted
line in Log values by normal distribution as best fit (mean µ = 0, standard deviation σ =
0.4934) in Figure 4.15 and Figure 4.16. The residuals appear randomly scattered around
the zero-mean indicating that the linear model is a good fit. Since the normal distribution
is unbounded, an upper bound residual limit of +1.68 is recommended based on the data.
Figure 4.15. Probability plot of residuals for normal distribution.
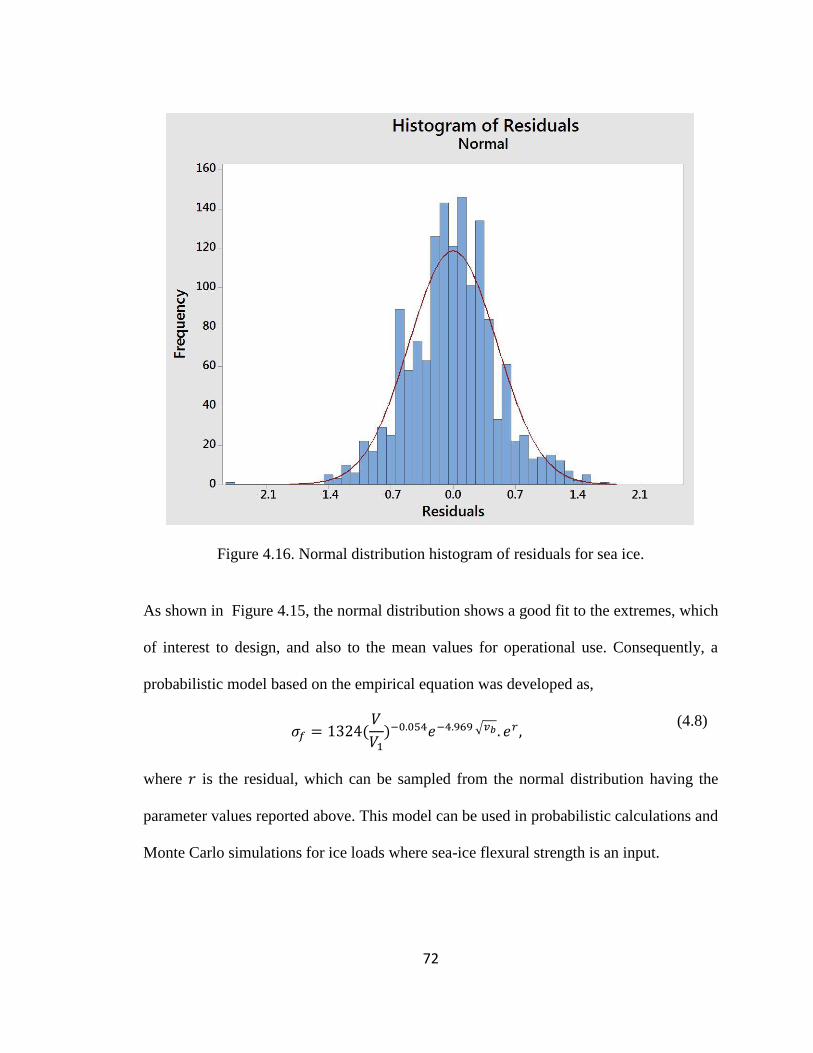
72
Figure 4.16. Normal distribution histogram of residuals for sea ice.
As shown in Figure 4.15, the normal distribution shows a good fit to the extremes, which
of interest to design, and also to the mean values for operational use. Consequently, a
probabilistic model based on the empirical equation was developed as,
𝜎𝑓 = 1324(𝑉
𝑉1)−0.054𝑒−4.969 √𝑣𝑏 . 𝑒𝑟 ,
(4.8)
where 𝑟 is the residual, which can be sampled from the normal distribution having the
parameter values reported above. This model can be used in probabilistic calculations and
Monte Carlo simulations for ice loads where sea-ice flexural strength is an input.

73
4.6 Summary
For sea ice, brine volume and beam volume were observed to have the greatest influence
on flexural strength. The data confirmed that flexural strength decreases as brine volume
increases. A negative exponential relationship of flexural strength to the square root of
brine volume was developed. This relationship is similar to the Timco and O'Brien (1994)
equation, but the relationship developed here is recommended for use since it is based on
a more updated and comprehensive database, and indicates a somewhat higher strength
values than Timco and O'Brien (1994) over part of the range of brine volumes.
Flexural strength of multi-year ice was found to be much higher than first-year sea ice, and
more comparable to freshwater ice. On this basis, the freshwater curve may be more
appropriate for multi-year ice although data are needed for larger beam volumes of interest
in multi-year ice interactions. Brackish ice data were excluded from this flexural strength
analysis, but may be estimated using Equation 4.7 using an adjusted salinity value.
Field data are more representative of full-scale ice applications, due to their larger volumes
and naturally occurring flaws. While the sea-ice cantilever tests have somewhat lower
strength values than other measurement methodologies. This has been mainly attributed to
the fact that they have larger volumes, not to stress concentrations. It is believed that stress
concentrations have more limited effect on sea-ice beams, because sea ice is more ductile,
which relieves stress concentrations. A two-parameter empirical relationship was
developed to account for the effect of specimen volume on sea-ice flexural strength as a
function of brine volume and specimen volume (Equation 4.7). In addition, a probabilistic

74
model based on the empirical relationship that was modified to account for the distribution
of residuals was established (Equation 4.8).

75
5 Conclusions and Recommendations
5.1 Conclusions and Discussion
There is both strong theoretical basis for why scale effects are expected, and strong
empirical evidence that they exist, but yet current ice flexural strength models do not
account for their presence. The main methods to measure ice flexural strength are cantilever
beam, three-point and four-point bending tests. Ideally one should use four-point bending
tests since they produce a state of pure bending with constant moment and zero shear in
the region between the two applied forces. This allows the beam to fail at its weakest point,
rather than the loading point, which is desirable to provide more representative flexural
strength measurements. Frederking and Sudom (2013), Lau et al. (2001), Williams and
Parsons (1994), Maattanen (1975) and Lavrov (1971) found a clear trend of decreasing ice
flexural strength with increasing specimen size for both sea ice and freshwater ice.
An updated, comprehensive study of scale effects in flexural strength was completed as
major part of this thesis using a new database compiled for this study which contains 2073
freshwater ice and 2843 sea-ice flexural strength measurements. For freshwater ice, the
data show a considerable decrease in flexural strength as specimen size increases. When
examined over a large size range, scale effects were observed to be a dominant factor
affecting flexural strength. When considered separately, laboratory test data for ice flexural
strength are observed to contain higher values and exhibit less pronounced scale effects
than are expected in natural ice at full-scale. This is due to the smaller beam size and
exclusion of specimens containing flaws from laboratory test programs. In the field,

76
freshwater ice cantilever beam tests usually give lower flexural strength values compared
to other testing techniques due to stress concentrations at the root of the beam. However,
these results should be corrected to avoid excluding them since they are highly important
in representing large-scale beams of ice formed under natural conditions. A correction
factor of about 2 was observed when field data for cantilever and three- and four-point tests
were compared. A new empirical relationship given by,
σ𝑓 = 839(𝑉 𝑉1⁄ )−0.13, (5.1)
to account for the effect of specimen volume on freshwater ice flexural strength, where 𝑉1
is a reference volume of 1 m3.
For sea ice, brine volume and beam volume were observed to have the greatest influence
on flexural strength.
The data confirmed that flexural strength decreases strongly as brine volume increases. A
negative exponential relationship of flexural strength to the square root of brine volume
was developed,
σ𝑓 = 1.73𝑒−4.89√𝑣𝑏 . (5.2)
This relationship is close to the Timco and O'Brien (1994); however, the new relationship
is based on more updated and comprehensive database. Emphasis here has been placed on
field data since they are more representative of full-scale ice applications, due to its larger
volumes and naturally occurring flaws. It may be noted that sea-ice cantilever tests may
have lower strength values than other measurement methodologies, but this is mainly
attributed to their larger volumes rather than stress concentrations. Scale effects appeared

77
to be more significant when sea-ice flexural strength measurements were normalized
against a reference strength value calculated at reference ice conditions. Using these data,
a two-parameter empirical relationship was developed,
𝜎 = 1324(𝑉
𝑉1)−0.054𝑒−4.969 √𝑣𝑏 ,
(5.3)
to account for the effect of specimen volume on sea-ice flexural strength as a function of
brine volume 𝑣𝑏 and specimen volume 𝑉, where 𝑉1 is a reference volume of 1 m3.
These models can be used to assess how such scale effects may influence ice loads on ships
and structures under different conditions, leading to potential opportunities for refinement
of current design methods. It should be noted that these models have an upper limit for the
validity of their usage as strength will not decrease to reach zero value. Extrapolation of
these models outside the range of the database should be done with care, as such models
can be invalid outside this range. Probabilistic ice strength models based on the empirical
equations and incorporating an analysis of residuals were developed. For freshwater ice,
σ𝑓 = 840(𝑉 𝑉1⁄ )−0.13 ∙ 𝑒𝑟 , (5.4)
and for sea ice,
𝜎𝑓 = 1324(𝑉
𝑉1)−0.054𝑒−4.969 √𝑣𝑏 . 𝑒𝑟 ,
(5.5)
where 𝑟 is the residual, which can be sampled from the Weibull distribution (scale
parameter 𝜂 = 3.622, shape parameter 𝛽 = 13.02, location parameter 𝛾 = -3.484) in case of
freshwater ice, and normal distribution (mean µ = 0, standard deviation σ = 0.4934 with an

78
upper limit of 1.68) in case of sea ice. These models can be used to enhance probabilistic
calculations and Monte Carlo simulations for ice loads where ice flexural strength is an
input.
Comparing the fitted lines for mean freshwater ice and normalized sea-ice flexural strength
(Figure 5.1), it may be observed that the scale effects in freshwater ice are more
pronounced. This mainly attributed to the dominance of the brine volume effect in sea ice.
Moreover, brine inclusions in sea ice causes it to always exhibits lower strength values than
freshwater ice. It is interesting to note that at large beam volumes freshwater flexural
strengths approach those of sea ice, possibly suggesting that, for sea ice, flaws and cracks
may dominate failure mechanisms at large scales and that the brine volume effect becomes
less dominant in terms of governing the strength of sea ice for very large scales. Further
work to explore these effects and the practical implications for design are recommended.
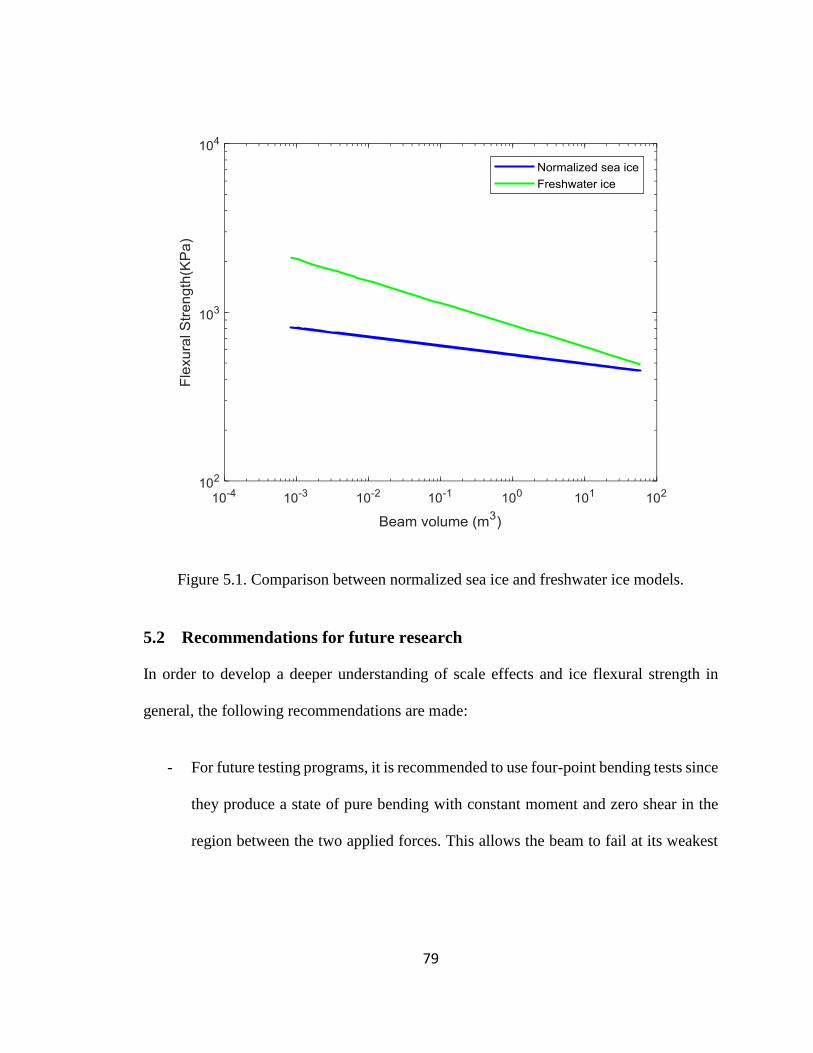
79
Figure 5.1. Comparison between normalized sea ice and freshwater ice models.
5.2 Recommendations for future research
In order to develop a deeper understanding of scale effects and ice flexural strength in
general, the following recommendations are made:
- For future testing programs, it is recommended to use four-point bending tests since
they produce a state of pure bending with constant moment and zero shear in the
region between the two applied forces. This allows the beam to fail at its weakest

80
point, rather than the loading point, which is desirable to provide more
representative flexural strength measurements;
- To have a consistently reported database, and get accurate values of flexural
strength index, further tests should be done at a test time of around 1 second (Timco
and Weeks, 2010; Schwarz, 1981). This will standardize testing, and eliminate the
effects of differing beam mass and hydrodynamic effect of water.
- The relation between ice flexural strength and air porosity should be investigated
more in the future. Ice total porosity is a more significant and inclusive parameter
than brine volume.
- Expand models to include other parameters as needed, should these parameters
become more consistently reported (e.g. loading rate and direction, and grain size).
- Additional data are needed to help improve the database, particularly for large field-
scale tests. For these data, loading rate and loading direction should be reported.
- Other more robust methods for normalizing flexural strength against brine content
can be examined if new methods became available.
- Weibull modelling and associated scaling relationships should be more thoroughly
examined for modelling ice flexural strength data. Further analysis is needed to
explore how parameters relate to microstructure, temperature, salinity, volume, and
loading rate.
- Further analysis to evaluate scale effects as a function of cross-sectional area and
also considering effective volumes are recommended.

81
- More detailed consideration for design are recommended in future work to extend
and apply this work to account for the effects of water acting as an elastic
foundation, as well as the interplay between radial and circumferential cracks that
result in flexural failure. The effects of surrounding ice cover on this process for
first-year and multi-year ridges, as well as the relationship between breaking loads
associated with flexural strength and other forces present during rubble formation
and accumulation should be studied in further detail.
- Further investigation for how the empirical and probabilistic models could
incorporated into methodology used in ice-class ship and structures design codes is
needed. The interpretation of beam volume to be a function of the structure
dimensions and the thickness of ice sheet needs to be studied, to allow incorporation
into the design methodology used in existing codes and standards.
In summary, ice flexural strength was observed to exhibit clear scale effects for the case of
both freshwater and sea ice. Through the application of more representative ice flexural
strength models, such as these proposed in this research, improvements to engineering
design methodologies may be possible.

82
REFERENCES
Airaksinen, K. (1974). Free beam tests and friction tests at pond inlet, NWT.
Polarforschung, 44(1), 71-75.
Aly, M., Taylor, R., Dudley, E., & Turnbull, I. (2018). Scale effect in freshwater ice
flexural strength. Paper presented at the 31th International Conference on Ocean,
Offshore & Arctic Engineering, 17-22 June 2018, Madrid, Spain.
Barrette, P. D. (2011). A laboratory study on the flexural strength of white ice and clear
ice from the rideau canal skateway. Canadian Journal of Civil Engineering, 38(12),
1435-1439.
Barrette, P., Phillips, R., Clark, J., Crocker, G., & Jones, S. (1999). Flexural behavior of
model sea ice in a centrifuge. Journal of Cold Regions Engineering, 13(3), 122-138.
Batdorf, S. B., & Heinisch, H. L. (1978). Weakest link theory reformulated for arbitrary
fracture criterion. Journal of the American Ceramic Society, 61(7), 355-358.
Bazant, Z.,P. (1998). Fracture and size effect in concrete and other quasibrittle
materials. Boca Raton, FL: CRC Press.
Blanchet, D., Abdelnour, R., & Comfort, G. (1997). Mechanical properties of first-year
sea ice at tarsiut island. Journal of Cold Regions Engineering, 11(1), 59-83.
Borek, M., Parsons, B.,L., & Hill, B. (1988). Simple beam tests on type S3 sea ice. Paper
presented at the 7th International Conference on Offshore Mechanics and Arctic
Engineering, Houston, TX. 63-68.
Brown, J. H., & Kingery, W. D. (1963). Elasticity and strength of sea ice. Cambridge,
Massachusetts, USA: M.I.T. Press.
Butkovich, T. R. (1959). On the mechanical properties of sea ice, thule, greenland, 1957.
(No. 54). Hanover, NH: U.S. Army CRREL.
Butkovich, T. R. (1959). Some physical properties of ice from the TUTO tunnel and
ramp, thule, greenland. (No. 47). Hanover, NH: U.S. Army CRREL.
Butkovich, T. R. (1956). Strength studies of sea ice.Wilmette, IL: Snow Ice and
Permafrost Research Establishment, Corps of Engineers, U.S. Army.

83
Christensen, F. (1986). Sea ice strength measurements from the inner danish waters in
early 1985. Paper presented at the Ice technology; 1st International Conference, 247-
253.
Dempsey, J. P., Nigam, D., Cole, D. M., Dempsey, J. P., Nigam, D., Cole, D. M., . . .
Sinha, N. K. (1988). The flexure and fracture of macrocrystalline S1 type freshwater
ice. Paper presented at the 7th International Conference on Offshore Mechanics and
Arctic Engineering, Houston, TX. 39-46.
Drouin, M., & Michel, B. (1972). La resistance en flexion de la glace du st-laurent
détermiée en nature. Laboratoire de Mécanique des Glaces, Département de Génie
Civil, Faculté des Sciences, Université Laval.
Dykins, J. (1968). Tensile and flexural properties of saline ice. Paper presented at the
International Symposium on Physics of Ice, 251-270.
Dykins, J. (1971). Ice engineering--material properties of saline ice for a limited range of
conditions. Port Hueneme, CA: U.S. Naval Civil Engineering Laboratory.
Ervik, Å. (2013). Experimental and numerical investigations of cantilever beam tests in
floating ice covers. (Master’s thesis).
Evans, A. G. (1978). A general approach for the statistical analysis of multiaxial fracture.
Journal of the American Ceramic Society, 61(7), 302-308.
Frankenstein, G., & Garner, R. (1970). Dynamic young's modulus and flexural strength
of sea ice. U.S. Army Cold Regions Research and Engineering Laboratory.
Frankenstein, G. E. (1959). Strength data on lake ice. Wilmette, IL.: U.S. Army Snow Ice
and Permafrost Research Establishment, Corps of Engineers.
Frankenstein, G. E. (1966). Strength of ice sheets. Hanover, N. H: U.S. CRREL.
Frankenstein, G., & Garner, R. (1967). Equations for determining the brine volume of sea
ice from −0.5° to −22.9°C. Journal of Glaciology, 6(48), 943-944.
Frederking, R., & Sudom, D. (2013). Review of flexural strength of multi-year ice. Paper
presented at the 23th International Offshore and Polar Engineering Conference.
Frederking, R. M. W., & Häusler, F. U. (1978). Flexural behaviour of ice from in situ
cantilever beams tests. Paper presented at the IAHR Symposium on Ice Problems,
Luleå, Sweden. 197-215.

84
Frederking, R. M. W., & Timco, G. W. (1983). On measuring flexural properties of ice
using cantilever beams. Annals of Glaciology, 4, 58-65.
Frederking, R. M. W., Timco, G. W., Gulf, R. C., Dome, P. L., & Canada Oil and
Gas,Lands Administration. (1982). NRC ice property measurements at tarsiut island,
beaufort sea, winter 1981-82. National Research Council of Canada.
Gagnon, R. E., & Gammon, P. H. (1995). Characterization and flexural strength of
iceberg and glacier ice. Journal of Glaciology, 41(137), 103-111.
Gladwell, R. (1977). Field studies of the strength and physical properties of a multi-year
ice pressure ridge in the southern beaufort sea. Calgary, Canada: Arctic Petroleum
Operators' Association.
Gow, A. J. (1977). Flexural strength of ice on temperate lakes. Journal of Glaciology,
19(81), 247-256.
Gow, A. J., & Langston, D. (1975). Flexural strength of lake ice in relation to its growth
structure and thermal history. (No. CRREL-RR-349). Hanover, NH: U.S. Army
Cold Regions Research and Engineering Laboratory.
Gow, A. J., Ueda, H. T., Govoni, J. W., & Kalafut, J. (1988). Temperature and structure
dependence of the flexural strength and modulus of freshwater model ice. (No.
CRREL-88-6). Hanover, NH: U.S. Army Cold Regions Research and Engineering
Laboratory.
Gow, A. J., Ueda, H. T., & Ricard, J. A. (1978). Flexural strength of ice on temperate
lakes: Comparative tests of large cantilever and simply supported beams. (No.
CRREL-78-9). Hanover, NH: U.S. Army Cold Regions Research and Engineering
Laboratory.
Gudmestad, O., Alhimenko, A., Løset, S., Shkhinek, K., Tørum, A., & Jensen, A. (2007).
Engineering aspects related to arctic offshore developments. Student’s Book for
Institutes of Higher Education.
International Association of Classifications Societies (IACS). (2006). Polar class ships
rules.
ISO 19906. (2010). International standard for arctic offshore structure.
ITTC. (2014). Test methods for model ice properties. Paper presented at the International
Towing Tank Conference.

85
Ji, S., Wang, A., Su, J., & Yue, Q. (2011). Experimental studies on elastic modulus and
flexural strength of sea ice in the bohai sea. Journal of Cold Regions Engineering,
25(4), 182-195.
Jordaan, I., Taylor, R., & Derradji-Aouat, A. (2012). Scaling of flexural and compressive
ice failure. Paper presented at the 31st International Conference on Ocean, Offshore
and Arctic Engineering, 589-595.
Jordaan, I., Taylor, R., & Reid, S. (2007). Fracture, probabilistic averaging and the scale
effect in ice-structure interaction. Paper presented at the International Conference on
Port and Ocean Engineering under Arctic Conditions.
Jordaan, I. J. (2005). Decisions under uncertainty: Probabilistic analysis for engineering
decisions. Cambridge; New York: Cambridge University Press.
Kärnä, T., & Qu, Y. (2006). Analysis of the size effect in ice crushing. (No. RTEU50-IR-
6/2005).VTT Technical Research Centre of Finland.
Kayo, Y., Kawasaki, T., Minami, T., Tozawa, S., Tanaka, A., & Abdelnour, R. (1983).
Field study on mechanical strength of sea ice at east coast of hokkaido. Paper
presented at the The 7th International Conference on Port and Ocean Engineering
under Arctic Conditions, Espoo, Finland. , 27 109-118.
Kujala, P., Riska, K., Varsta, P., Koskivaara, R., & Nyman, T. (1990). Results from in
situ four point bending tests with baltic sea ice. Paper presented at the IAHR
Symposium on Ice Problems, Helsinki, Finland. 261-278.
Lainey, L., & Tinawi, R. (1981). Parametric studies of sea ice beams under short and long
term loadings. Paper presented at the IAHR International Symposium on Ice,
Québec, Canada. 607-619.
Lau, M., Phillips, R., McKenna, R., & Jones, S. (2001). Size effect on the flexural
strength of ice in model testing. Paper presented at the 16th International Conference
on Port and Ocean Engineering under Arctic Conditions, 12-17 August 2001,
Ottawa, ON. , 3 1413-1421.
Lau, P., & Browne, C. (1989). Bending and compression properties of young sea ice.
Paper presented at the Oceans'89, Seattle, WA. , 4 1292-1296.
Lavrov, V. V. (1971). DEFORMATION AND STRENGTH OF ICE [deformatsiya i
prochnost' l' da] (english).

86
Maattanen, M. (1975). On the flexural strength of brackish water ice by in-situ tests.
Paper presented at the Port and Ocean Engineering under Arctic Condition, Alaska,
USA. , 75 349-359.
Marchenko A., Karulina M., Karulin E., Chistyakov P., & Sakharov A. (2017). Flexural
strength of ice reconstructed from field tests with cantilever beams and laboratory
tests with beams and disks. Paper presented at the International Conference on Port
and Ocean Engineering Under Arctic Conditions, Busan, Korea., 1 1-10.
Masterson, D., Frederking, R., Wright, B., Kärnä, T., & Maddock, W. (2007). A revised
ice pressure-area curve. Paper presented at the 19th International Conferencce on
Port and Ocean Engineering Under Arctic Conditions, 1 305-314.
Michailidis, M. (1981). M.V. arctic probe into lake melville labrador. (No. LTR -SH-
301). Arctic Vessel and Marine Research Institute (AVMRI).
Mier, J. G. M. (1997). Fracture processes of concrete: Assesment of material parameters
for fracture models. Boca Raton, FL: CRC Press.
Murat, J. R., & Tinwai, R. (1977). Sea ice testing in flexure. Paper presented at the POAC
77. International Conference on Port and Ocean Engineering Under Arctic
Conditions, St. John's, NL. , 2 638-653.
Neter, J., Kutner, M.H., Nachtsheim, C.J., & Wasserman, W. (1996). Applied linear
statistical models. Chicago: Irwin.
Palmer, A., & Croasdale, K. (2013). In Croasdale K., ProQuest (Firm) (Eds.), Arctic
offshore engineering. World Scientific Publications.
Parsons, B. L., Lal, M., Williams, F. M., Dempsey, J. P., Snellen, J. B., Everard, J., . . .
Wllliams, J. (1992). The influence of beam size on the flexural strength of sea ice,
freshwater ice and iceberg ice. Philosophical Magazine A, 66(6), 1017-1036.
Parsons, B. L., & Lal, M. (1991). Distribution parameters for flexural strength of ice.
Cold Regions Science and Technology, 19(3), 285-293.
Reid, S. (1991). Flaws in the failure prediction model of glass strength. Paper presented
at the 6th International Conference on Applications of Statistics and Probability in
Civil Engineering (ICASP6), Mexico City, Mexico. 111-117.
Saeki, H., Nomura, T., & Ozaki, A. (1978). Experimental study on the testing methods of
strength and mechanical properties for sea ice. Paper presented at the 4th IAHR
Symposium on Ice, Lulea, Sweden. , 1 135-149.

87
Saeki, H., Ozaki, A., & Kubo, Y. (1981). Experimental study on flexural strength and
elastic modulus of sea ice. Paper presented at the 6th International Conference on
Port and Ocean Engineering Under Arctic Conditions, Quebec, Canada. , 2 536-547.
Sanderson, T. J. (1988). Ice mechanics and risks to offshore structures. Norwell, MA:
Kluwer Academic Publishers.
Schwarz, J. (1975). On the flexural strength and elasticity of saline ice. Paper presented at
the 3rd International Symposium on Ice Problems, Committee on Ice Problems,
Hanover, NH. 373-385.
Schwarz, J. N. (1981). Sea ice investigation in the weddell sea. Polarforschung, 51(1),
21-37.
Schwarz, J., Frederking, R., Gavrillo, V., Petrov, I. G., Hirayama, K. I., Mellor, M., . . .
Vaudrey, K. D. (1981). Standardized testing methods for measuring mechanical
properties of ice. Cold Regions Science and Technology, 4(3), 245-253.
Schwarz, J., & Weeks, W. F. (1977). Engineering properties of sea ice. Journal of
Glaciology, 19(81), 499-531.
Shapiro, L., & Weeks, W. (1995). Controls on the flexural strength of small plates and
beams of first-year sea ice. ASME Applied Mechanics Division (AMD), 207, 179-
179.
Svec, O. J., & Frederking, R. (1981). Cantilever beam tests in an ice cover: Influence of
plate effects at the root. Cold Regions Science and Technology, 4(2), 93-101.
Svec, O. J., Thompson, J., & Frederking, R. (1985). Stress concentrations in the root of
an ice cover cantilever: Model tests and theory. Cold Regions Science and
Technology, 11(1), 63-73.
Tabata, T., Suzuki, Y., & Aota, M. (1975). Ice study in the gulf of bothnia: II.
measurement of flexural strength. Low Temperature Science, 33, 199-206.
Tabata, T., Fujino, K., & Aota, M. (1967). Studies of the mechanical properties of sea ice
ⅩⅠ: The flexural strength of sea ice in situ. Paper presented at the International
Conference on Low Temp Science; Physics of Snow and ice, Sapporo, Japan. , 1(1)
539-550.
Tabata, T. (1967). Studies of the mechanical properties of sea ice X. the flexural strength
of small sea ice beams. Paper presented at the International Conference on Low
Temp Science; Physics of Snow and ice, Sapporo, Japan. 481-497.

88
Tatinclaux, J., & Hirayama, K. (1982). Determination of the flexural strength and elastic
modulus of ice from in situ cantilever-beam tests. Cold Regions Science and
Technology, 6(1), 37-47.
Tatinclaux, J., & Wu, C. (1976). Laboratory study of the flexural strength and elastic
modulus of freshwater and saline ice. Iowa City, IA: Iowa Institute of Hydraulic
Research, University of Iowa.
Tatinclaux, J. C., & Wu, C. Y. (1978). On flexural strength of freshwater and saline ice.
Paper presented at the Conference on Applied Techniques for Cold Environments,
Anchorage, Alaska. , 1 295-306.
Taylor, R. S. (2010). Analysis of scale effect in compressive ice failure and implications
for design. (PhD thesis).
Taylor, R., & Jordaan, I. (2015). Probabilistic fracture mechanics analysis of spalling
during edge indentation in ice. Engineering Fracture Mechanics, 134, 242-266.
Timco, G. W., & Frederking, R. (1982). Comparative strengths of fresh water ice. Cold
Regions Science and Technology, 6(1), 21-27.
Timco, G. W., & Frederking, R. M. W. (1983). Flexural strength and fracture toughness
of sea ice. Cold Regions Science and Technology, 8(1), 35-41.
Timco, G. W., & O.'Brien, S. (1994). Flexural strength equation for sea ice. Cold Regions
Science and Technology, 22(3), 285-298.
Timco, G. W., & Weeks, W. F. (2010). A review of the engineering properties of sea ice.
Cold Regions Science and Technology, 60(2), 107-129.
Tozawa, S., & Taguchi, Y. (1986). A preliminary study of scale effect on flexural
strength of ice specimen. Paper presented at the 5th International Offshore
Mechanics and Arctic Engineering, 4 336-340.
Vaudrey, K. (1975). Ice engineering: Elastic property studies on compressive and
flexural sea ice specimens. Port Hueneme, CA: U.S. Naval Construction Battalion
Center.
Vaudrey, K. D. (1983). Characterization of offshore and coastal ice conditions. New
York, United States: American Society of Civil Engineers.
Weeks, W. F., & Assur, A. (1969). Fracture of lake and sea ice. Hanover, NH: U.S.
Army Cold Regions Research and Engineering.

89
Weeks, W. F., & Assur, A. (1967). Mechanical properties of sea ice. Cold Regions
Research and Engineering Laborator.
Weeks, W. F., & Anderson, D. L. (1958). An experimental study of strength of young sea
ice. American Geophysical Union, 39(4), 641-647.
Weibull, W. (1951). Wide applicability. Journal of Applied Mechanics, 103(730), 293-
297.
Williams, F., Crocker, G., & Butt, S. (1993). Northumberland strait ice properties
measurements. (No. TR-1993-06). St. John's, Canada: National Research Council,
Institute for Marine Dynamic.
Williams, F., Everard, J., & Butt, S. (1992). Ice and snow measurements in support of the
operational evaluation of the nathanial B. palmer in the antarctic winter
environment. (No. TR-1992-14). St. John's, NL: National Research Council Canada.
Institute for Marine Dynamics.
Williams, F., Spencer, D., Parsons, B., Hackett, P., Gagnon, R., Everard, J., & Butt, S.
(1991). Full-scale ice breaker trials CCGS sir john franklin indian arm/little burnt
bay 1991. (No. TR-1991-03). St. John's, NL: National Research Council Canada.
Institute for Marine Dynamics.
Williams, J. L. (1990). Three point loading of freshwater ice beams. (No. LM-1990-13).
St. John's, NL: National Research Council Canada. Institute for Marine Dynamics.
Williams, F. M., Kirby, C., & Slade, T. (1993). Strength and fracture toughness of first
year arctic sea ice. (No. TR-1993-12). St. John's, NL: NRC Institute for Ocean
Technology; National Research Council Canada.
Williams, F. M., & Parsons, B. L. (1994). Size effect in the flexural strength of ice. Paper
presented at the International Conference on Offshore Mechanics and Arctic
Engineering, 13th, Houston, Texas. 15-22.

90
Appendix A: Conference Paper
Proceedings of the ASME 37th International Conference on Ocean, Offshore & Arctic Engineering OMAE2018
June 17-22, 2018, Madrid, Spain
OMAE2018-77314
SCALE EFFECT IN FRESHWATER ICE FLEXURAL STRENGTH
Mohamed Aly Memorial University of
Newfoundland, St. John’s, NL, Canada
Rocky Taylor C-CORE’s Centre for Arctic Resource Development &
Memorial University of Newfoundland, St. John’s, NL,
Canada
Eleanor Bailey Dudley C-CORE’s Centre for Arctic
Resource Development, St. John’s, NL, Canada
Ian Turnbull C-CORE’s Centre for Arctic Resource
Development, St. John’s, NL, Canada
ABSTRACT Ice flexural strength is an important parameter in the
assessment of ice loads on the hulls of ice-class ships, sloped
offshore structures or sloped bridge piers. While scale effects are
well known for compressive ice strength, there has been debate
as to whether or not scale effects in ice flexural strength exist. To
investigate scale effects during flexural failure of freshwater ice,
a comprehensive up-to-date database of beam flexural strength
measurements has been compiled. The data show a considerable
decrease in flexural strength as the specimen size increases,
when examined over a large range of scales. An empirical model
of freshwater ice flexural strength as a function of beam volume
has been developed using regression analysis.
INTRODUCTION Ice loads are a key design consideration for ship and
offshore structure design for the ice-prone waters. Ice loads
depend on the failure mode of the ice, which can include
crushing, bending, buckling, or mixed mode. Ice flexural
strength is an important parameter in the bending failure mode,
and the assessment of ice loads on the hulls of ice-class ships,
sloped offshore structures, or sloped bridge piers and
lighthouses. Moreover, flexural strength is essential in the study
of ice ridging and rafting phenomena, and for calculating the
bearing capacity of ice cover, which is critical in the design of
winter roads, as well as other on-ice operations. Ships or
structures that break the ice in bending typically exhibit much
lower loads than others where ice fails in crushing. For example
Vaudrey (1983) concluded that the flexural strength of ice is
around 10 % to 50% of its compressive strength. This reinforces
the need for more investigation of ice flexural strength in
general.
The flexural strength of ice depends on physical parameters
such as total porosity, specimen size, grain size, crystal
orientation and type (granular, columnar, discontinuous
columnar or frazil), and in the case of sea ice, also on temperature
and salinity. In addition, test conditions (cantilever, three-point
or four-point bending), loading direction and loading rate will

`
91 Copyright © 2018 by ASME
affect the strength properties of ice in flexure (Timco & O'Brien,
1994).
Timco & Weeks (2010) suggested that the total porosity is
the most significant parameter influencing flexural strength,
particularly for sea ice. A number of researchers including
Barrette et al. (1999); Blanchet et al. (1997); Borek et al. (1988);
Frankenstein and Garner (1970); Schwarz and Weeks (1977);
Tatinclaux and Wu (1978); Weeks and Assur (1969); Weeks and
Assur (1967); Timco and O'Brien (1994) confirmed from
experimental results for sea ice that flexural strength decreases
as brine volume increases, which is a function of temperature and
salinity of the ice. However, when Timco and O'Brien (1994)
developed a correlation between flexural strength and brine
volume in a compiled database of 2495 tests of sea and
freshwater ice, strength at times fluctuated by an order of
magnitude at the same brine volume value. For freshwater ice,
their analysis showed strong scatter in the data at exact or close
ice temperatures for the same test type. This suggests that there
are other parameters that strongly affect the flexural strength.
Ice, as a geophysical material, contains many flaws and
cracks, so it is expected that the probability of encountering such
flaws increases with increasing specimen size, which would
cause a decrease in strength (Tozawa and Taguchi, 1986). For
compressive ice strength there is general agreement on such
scale effects (e.g., Taylor and Jordaan, 2015; Jordaan et al.,
2012).
Williams and Parsons (1994) found a clear trend of
decreasing ice flexural strength with increasing specimen size
for both sea ice and freshwater ice. They concluded that, after
brine volume, specimen size will have the second greatest
influence on flexural strength. They based their conclusion on
statistical correlation analyses for five ice flexural strength
parameters: brine volume, beam volume, grain diameter,
temperature, and strain rate. They implemented their analyses on
a database compiled of 1771 sea ice and 650 freshwater flexural
strength measurements. They excluded all cantilever tests from
their database due to the stress concentrations phenomena, which
has been suggested to lower the flexural strength of ice through
the presence of stress risers at the root of the beam. Using
regression analysis on their database, they developed an
empirical two-parameter model of sea ice flexural strength as a
function of brine and beam volume. For freshwater ice, only
beam volume was considered as the main factor controlling
flexural strength as shown below:
σ𝑓 = 1629(𝑉
𝑉1)−0.084 (1)
where σ𝑓 is in kPa, 𝑉1 is a reference volume (it was suggested to
be 0.01 m3) and 𝑉 is the beam volume in m3. Lau et al. (2001)
added their data to Williams and Parsons (1994) for both sea and
freshwater ice during a study on how to take scale effects in ice
strength into consideration during centrifuge model testing; they
came to the same conclusion. Lavrov (1971) also found from
experiments that sea ice and freshwater ice flexural strength
decreases as beam thickness increases.
Frederking and Sudom (2013) also found that the flexural
strength of multi-year sea ice decreases as the specimen size
increases. They found this result by analyzing simple beam
(three and four-point) test data for large and small beams
quarried from a multi-year sea ice ridge. They also analyzed ship
ram data that was taken when traversing through multi-year sea
ice floes and found that flexural strength decreased as the
thicknesses of the ice cover increased.
Maattanen (1975) attributed the scale effect behavior to the
stress field across the beam, which he suggested converts to two
dimensions as beam size increases. As a result, it will be easier
for fracture to take place between ice crystals, causing the beam
to fail under lower loads.
Several researchers disagree with, or have neglected the
presence of a scale effect in the flexural failure of ice. For
instance, scale effects for flexural strength are not currently
considered in the International Association of Classification
Societies (IACS) Polar Class ships rules and the International
Standard for Arctic Offshore Structures (ISO 19906). Parsons
and Lal (1991) did not find a scale effect when they analyzed 13
datasets to check the goodness-of-fit of the Weibull and double
exponential distributions for sea and freshwater ice flexural
strength data. Parsons et al. (1992) found that for first-year sea
ice, the influence of specimen size is very limited. Using
regressing analysis on experimental results from three-point
bending tests, they determined that sea ice flexural strength
depends very weakly on beam volume, according to the
relation σ𝑓𝛼 𝑉−1/12. As for freshwater ice, the specimens
showed less decrease in flexural strength with increasing
volume, and the authors suggested that scale effect can be
completely neglected. Timco and O'Brien (1994) found that
larger beams generally had lower strengths than smaller ice
beams, yet they attributed this result to the larger brine volume
in large beam volumes and not to the beam size.
It is clear from the above that there is still much debate as to
whether a scale effect should be considered for ice failing in
flexure, which is surprising considering the importance of this
parameter for ice-class ships and offshore structure design.
Williams and Parsons (1994) suggested that the flexural strength
encountered by a specific icebreaker or offshore platform when
failing in bending is probably 50% of the measured flexural
strength from small-scale beam tests. The last extensive study on
the subject was carried out by Williams and Parsons (1994) and
since then a wealth of new data has been collected or made
public. All of this necessitates a more updated investigation of
scale effects, which is the goal of this study.
To thoroughly examine scale effects in ice flexural failure,
an updated database has been compiled, which includes data
from 2073 freshwater ice beam tests, making this database the
most comprehensive to the authors knowledge. Similar work on
scale effects in sea ice flexural strength measurements is
ongoing. This paper considers only scale effects in flexural
strength of freshwater ice; sea ice will be considered in future
publications.
DATA SOURCES The data were obtained from 16 papers from the literature
as summarized in Table 1. The table lists information about each

`
92 Copyright © 2018 by ASME
source, including the authors, test type, number of tests, location
(field or laboratory), beam volume, ice temperature and flexural
strength. Flexural strength measurements are plotted in Figure 1
against beam volume; both are on logarithmic scale. Data points
are given symbols according to their sources listed in Table 1.
Specimen volume in this database was chosen to be
represented by beam volume as has been used by many
researchers as a comprehensive way to study scale effects.
Williams and Parsons (1994) also suggested representing
specimen size by beam volume, mainly because there are not
enough details over the range of data in the literature to study the
effect of each beam dimension separately. The same approach
has been used in the present analysis.
The main approaches that have been used to measure ice
flexural strength are cantilever beam, three-point and four-point
bending tests. Cantilever tests are usually done in situ, and are
easy to perform on large beams. They have the advantage of
maintaining the temperature gradient and variation through the
thickness of ice cover by utilizing its full thickness (Blanchet et
al., 1997; Ji et al., 2011).
Table 1: Summary of Data

`
93 Copyright © 2018 by ASME
Figure 1. Freshwater ice flexural strength vs. beam size
The general technique for obtaining ice flexural strength
using cantilever tests is as follows: First a U-shaped channel is
cut in the ice. This channel isolates an in-place cantilever ice
beam with one end attached to the sheet. Both pull-up and push-
down tests can be performed on these beams using a vertical load
applied to the free end of the ice beam until it fails; see Figure 2.
As is discussed below, an important consideration for cantilever
tests is that failure of the beam occurs at the root of the beam due
to stress concentrations, which results in lower strength values
than are typically obtained for three- and four-point tests
(Frederking and Hausler, 1978; Timco and O'Brien, 1994).
Figure 2: Cantilever beam test
For three- and four-point bending, the ice beam is
completely cut free from the ice sheet. The ends of this beam are
supported and load is applied at the center in case of three-point
bending, and at two equidistant points in case of four-point
bending, as is shown in Figure 3 and Figure 4, respectively.
Three-point bending tests have the disadvantage that the beam
usually fails at the center where the maximum moment takes
place, preventing the beam from failing at its weakest point.
Four-point bending tests result in a large central region of
constant moment and zero shear between the loading points,
which is generally recommended for brittle materials.
Figure 3: Three-point bending test
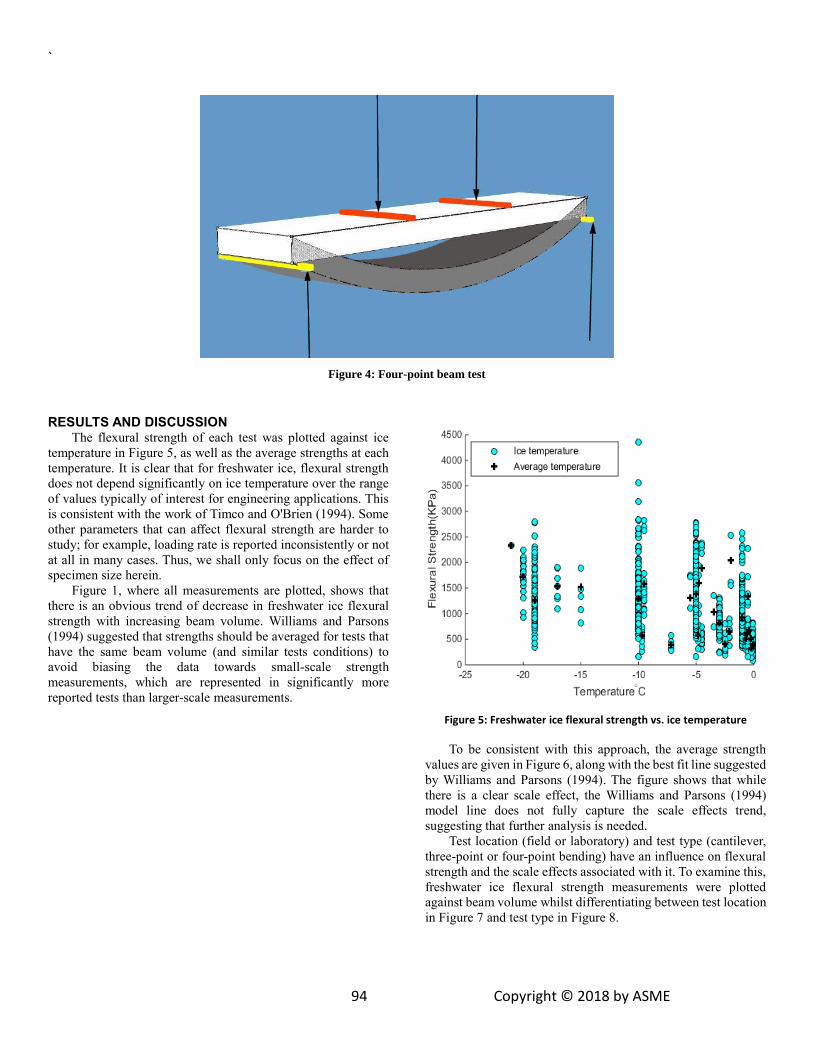
`
94 Copyright © 2018 by ASME
Figure 4: Four-point beam test
RESULTS AND DISCUSSION The flexural strength of each test was plotted against ice
temperature in Figure 5, as well as the average strengths at each
temperature. It is clear that for freshwater ice, flexural strength
does not depend significantly on ice temperature over the range
of values typically of interest for engineering applications. This
is consistent with the work of Timco and O'Brien (1994). Some
other parameters that can affect flexural strength are harder to
study; for example, loading rate is reported inconsistently or not
at all in many cases. Thus, we shall only focus on the effect of
specimen size herein.
Figure 1, where all measurements are plotted, shows that
there is an obvious trend of decrease in freshwater ice flexural
strength with increasing beam volume. Williams and Parsons
(1994) suggested that strengths should be averaged for tests that
have the same beam volume (and similar tests conditions) to
avoid biasing the data towards small-scale strength
measurements, which are represented in significantly more
reported tests than larger-scale measurements.
Figure 5: Freshwater ice flexural strength vs. ice temperature
To be consistent with this approach, the average strength
values are given in Figure 6, along with the best fit line suggested
by Williams and Parsons (1994). The figure shows that while
there is a clear scale effect, the Williams and Parsons (1994)
model line does not fully capture the scale effects trend,
suggesting that further analysis is needed.
Test location (field or laboratory) and test type (cantilever,
three-point or four-point bending) have an influence on flexural
strength and the scale effects associated with it. To examine this,
freshwater ice flexural strength measurements were plotted
against beam volume whilst differentiating between test location
in Figure 7 and test type in Figure 8.

`
95 Copyright © 2018 by ASME
Figure 6: Freshwater ice flexural strength vs. beam volume using average values of strength for all tests with same beam volume
Differentiating between test locations (Figure 7) is of interest
here because field data correspond to ice that is more
representative of ice in full-scale applications. Ice in the field has
many naturally occurring flaws that are not present in laboratory
ice. Laboratory test specimens are usually selected to ensure they
have minimal flaws. Furthermore, they have smaller volumes
which may not be large enough to account for large grain sizes
found in some ice environments.
Figure 7: Plot of all freshwater ice flexural strength vs. beam volume
data grouped to indicate test location as either field or laboratory
Figure 8: Plot of all freshwater ice flexural strength vs. beam volume
data grouped according to test type
By comparing Figure 7 and Figure 8, it may be observed that
that the field tests were mainly done using the cantilever
technique, while most of the three- and four-point bending tests
were conducted in the lab. As previously discussed, cantilever
beam tests are generally believed to yield lower strength values
than other measurement methodologies. This was confirmed by
plotting the flexural strength field data against beam size while
differentiating between cantilever beam tests and those for the
three-point and four-point bending tests, as shown in Figure 9.
This is mainly attributed to stress concentrations formed at the
root of the beam. This behavior was studied and confirmed by
several researchers, including Schwarz and Weeks (1977), Svec
and Frederking (1981) and Svec et al. (1985).
To avoid excluding the cantilever tests from this analysis,
as was done by Williams and Parsons (1994), a correction factor
was used to account for reduction in strength in cantilever field
tests. This was done by first fitting lines of best fit to the log-log
plots (Figure 9), using non-linear least-squares regression
method for the cantilever and grouped three- and four-point test
field data, respectively. This produced the flexural strength
equation for field cantilever tests:
σ𝑓 𝐶𝑎𝑛𝑡𝑖𝑙𝑒𝑣𝑒𝑟 = 400(𝑉 𝑉1⁄ )−0.13 (2)
Similarly, a flexural strength equation for the grouped field three-
and four-point bending tests was obtained:
𝜎𝑓 3−4 𝑃𝑜𝑖𝑛𝑡 = 828(𝑉 𝑉1⁄ )−0.13 (3)
where σ𝑓 is the flexural strength in kPa, 𝑉 is the beam volume in
m3 and 𝑉1 is a reference volume (1 m3). The exponents in the
previous equations were rounded from -0.1296 and -0.1311
respectively to -0.13 to simplify calculations. Taking a ratio of
Eq. (3) to Eq. (2) yields a correction factor of about 2. This is
consistent with Gow (1977), who conducted a number of
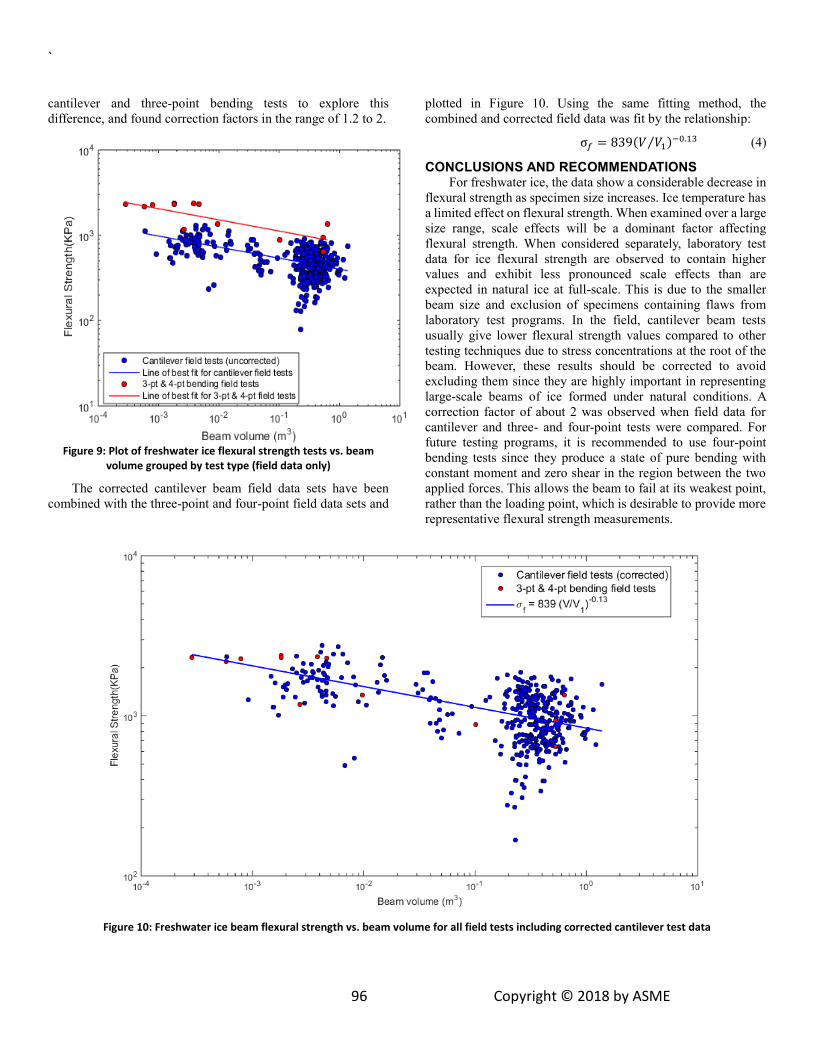
`
96 Copyright © 2018 by ASME
cantilever and three-point bending tests to explore this
difference, and found correction factors in the range of 1.2 to 2.
Figure 9: Plot of freshwater ice flexural strength tests vs. beam
volume grouped by test type (field data only)
The corrected cantilever beam field data sets have been
combined with the three-point and four-point field data sets and
plotted in Figure 10. Using the same fitting method, the
combined and corrected field data was fit by the relationship:
σ𝑓 = 839(𝑉 𝑉1⁄ )−0.13 (4)
CONCLUSIONS AND RECOMMENDATIONS For freshwater ice, the data show a considerable decrease in
flexural strength as specimen size increases. Ice temperature has
a limited effect on flexural strength. When examined over a large
size range, scale effects will be a dominant factor affecting
flexural strength. When considered separately, laboratory test
data for ice flexural strength are observed to contain higher
values and exhibit less pronounced scale effects than are
expected in natural ice at full-scale. This is due to the smaller
beam size and exclusion of specimens containing flaws from
laboratory test programs. In the field, cantilever beam tests
usually give lower flexural strength values compared to other
testing techniques due to stress concentrations at the root of the
beam. However, these results should be corrected to avoid
excluding them since they are highly important in representing
large-scale beams of ice formed under natural conditions. A
correction factor of about 2 was observed when field data for
cantilever and three- and four-point tests were compared. For
future testing programs, it is recommended to use four-point
bending tests since they produce a state of pure bending with
constant moment and zero shear in the region between the two
applied forces. This allows the beam to fail at its weakest point,
rather than the loading point, which is desirable to provide more
representative flexural strength measurements.
Figure 10: Freshwater ice beam flexural strength vs. beam volume for all field tests including corrected cantilever test data

`
97 Copyright © 2018 by ASME
Based on the analysis presented in this paper, a new
empirical relationship given by Eq. (4) above was developed to
account for the effect of specimen volume on freshwater ice
flexural strength. This expression can be used to assess how such
scale effects may influence ice loads on ships and structures
under different conditions, leading to potential opportunities for
refinement of current design methodology. Similar analysis on a
sea ice measurements database is taking place to get more
understanding and insights into scale effects in ice flexural
strength.
ACKNOWLEDGMENTS The authors are thankful to Dr. Paul Barrette and the
National Research Council (NRC) for supplying copies of NRC
Reports; and work term student Thabiso Mthethwa for his help
in compiling the database. In addition; we gratefully
acknowledge the funding of Hibernia Management and
Development Company, Ltd. (HMDC) and the Research and
Development Corporation (RDC) of Newfoundland and
Labrador.
REFERENCES
Barrette, P. D. (2011). "A Laboratory Study on the Flexural
Strength of White Ice and Clear Ice from the Rideau Canal
Skateway." Canadian Journal of Civil Engineering, 38(12),
1435-1439.
Barrette, P., Phillips, R., Clark, J., Crocker, G., Jones, S.
(1999). "Flexural Behavior of Model Sea Ice in a Centrifuge."
Journal of Cold Regions Engineering, 13(3), 122-138.
Blanchet, D., Abdelnour, R., Comfort, G. (1997). "Mechanical
Properties of First-Year Sea Ice at Tarsiut Island." Journal of
Cold Regions Engineering, 11(1), 59-83.
Borek, M., Parsons, B.,L., Hill, B. (1988). "Simple beam tests
on type S3 sea ice." Proceedings of the 7th International
Conference on Offshore Mechanics and Arctic Engineering,
Houston, TX.
Dempsey, J. P., Nigam, D., Cole, D. M., Dempsey, J. P.,
Nigam, D., Cole, D. M., Sodhi, D. S., Luk, C. H., Sinha, N. K.
(1988). "The flexure and fracture of macrocrystalline S1 type
freshwater ice." Proceedings of the 7th International
Conference on Offshore Mechanics and Arctic Engineering,
Houston, Texas, 39-46.
Drouin, M., and Michel, B. (1972). La Resistance En Flexion
De La Glace Du St-Laurent Détermiée En Nature, Laboratoire
de Mécanique des Glaces, Département de Génie Civil, Faculté
des Sciences, Université Laval,
Frankenstein, G., and Garner, R. (1970). "Dynamic Young's
Modulus and Flexural Strength of Sea Ice." Cold Regions
Research and Engineering Lab.
Frankenstein, G. E. (1959). Strength Data on Lake Ice, U.S.
Army Snow Ice and Permafrost Research Establishment, Corps
of Engineers, Wilmette, IL.
Frederking, R., and Sudom, D. (2013). "Review of flexural
strength of multi-year ice." Proceedings of the Twenty-Third
International Offshore and Polar Engineering Conference,
International Society of Offshore and Polar Engineers.
Frederking, R. M. W., and Timco, G. W. (1983). "On
Measuring Flexural Properties of Ice using Cantilever Beams."
Annals of Glaciology, 4, 58-65.
Frederking, R.M.W., and Häusler, F.U. (1978). "Flexural
behaviour of ice from in situ cantilever beams tests."
Proceedings of the IAHR Symposium on Ice Problems, Luleå,
Sweden, 197-215.
Gow, A.J., Ueda, H.T., Govoni, J.W., Kalafut, J. (1988).
"Temperature and Structure Dependence of the Flexural
Strength and Modulus of Freshwater Model Ice." Cold Regions
Research and Engineering Lab.
Gow, A.J. (1977). "Flexural Strength of Ice on Temperate
Lakes." Journal of Glaciology, 19(81), 247-256.
Gow, A.J., and Langston, D. (1975). "Flexural Strength of Lake
Ice in Relation to its Growth Structure and Thermal History."
Cold Regions Research and Engineering Lab.
Gow, A.J., Ueda, H.T., Ricard, J.A. (1978). "Flexural Strength
of Ice on Temperate Lakes: Comparative Tests of Large
Cantilever and Simply Supported Beams." Cold Regions
Research and Engineering Lab.
Ji, S., Wang, A., Su, J., Yue, Q. (2011). "Experimental Studies
on Elastic Modulus and Flexural Strength of Sea Ice in the
Bohai Sea." Journal of Cold Regions Engineering, 25(4), 182-
195.
Jordaan, I.J., Taylor, R.S., and Derradji-Aouat, A., (2012).
“Scaling of Flexural and Compressive Ice Failure.”
Proceedings of OMAE 2012, Rio de Janeiro, Brazil.
Lau, M., Phillips, R., McKenna, R., Jones, S. (2001). "Size
effect on the flexural strength of ice in model testing."
Proceedings of the 16th International Conference on Port and
Ocean Engineering Under Arctic Conditions, 12-17 August
2001, Ottawa, ON.

`
98 Copyright © 2018 by ASME
Lavrov, V. V. (1971). "DEFORMATION AND STRENGTH
OF ICE [Deformatsiya i Prochnost' L' Da] (English)."
DEFORMATION AND STRENGTH OF ICE [Deformatsiya i
Prochnost' L' Da].
Maattanen, M. (1975). "On the flexural strength of brackish
water ice by in-situ tests." Proceedings of the 3rd International
Conference on Port and Ocean Engineering Under Arctic
Conditions (POAC), 349-359.
Parsons, B.L., Lal, M., Williams, F.M., Dempsey, J.P., Snellen,
J.B., Everard, J., Slade, T., Wllliams, J. (1992). "The Influence
of Beam Size on the Flexural Strength of Sea Ice, Freshwater
Ice and Iceberg Ice." Philosophical Magazine. A, 66(6), 1017-
1036.
Parsons, B. L., and Lal, M. (1991). "Distribution Parameters for
Flexural Strength of Ice." Cold Regions Science and
Technology, 19(3), 285-293.
Schwarz, J., and Weeks, W. F. (1977). "Engineering Properties
of Sea Ice." Journal of Glaciology, 19(81), 499-531.
Svec, O. J., Thompson, J., Frederking, R. (1985). "Stress
Concentrations in the Root of an Ice Cover Cantilever: Model
Tests and Theory." Cold Regions Science and Technology,
11(1), 63-73.
Svec, O.J., and Frederking, R. (1981). "Cantilever Beam Tests
in an Ice Cover: Influence of Plate Effects at the Root." Cold
Cold Regions Science and Technology, 4(2), 93-101.
Tabata, T. (1967). "Studies of the Mechanical Properties of Sea
Ice X. the Flexural Strength of Small Sea Ice Beams." Studies
of the Mechanical Properties of Sea Ice X. the Flexural
Strength of Small Sea Ice Beams, 481-497.
Tatinclaux, J. C., and Wu, C. Y. (1978). "On flexural strength
of freshwater and saline ice." Proceedings of the Conference on
Applied Techniques for Cold Environments, Anchorage, Alask,
295-306.
Taylor, R.S., Jordaan, I.J., (2015). “Probabilistic fracture
mechanics analysis of spalling during edge indentation in ice.”
Engineering Fracture Mechanics, 134 (2015) 242-266.
Timco, G.W., and Weeks, W.F. (2010). "A Review of the
Engineering Properties of Sea Ice." Cold Regions Science and
Technology, 60(2), 107-129.
Timco, G.W., and O’Brien, S. (1994). "Flexural Strength
Equation for Sea Ice." Cold Regions Science and Technology,
22(3), 285-298.
Timco, G.W., and Frederking, R.M.W. (1983). "Flexural
Strength and Fracture Toughness of Sea Ice." Cold Regions
Science and Technology, 8(1), 35-41.
Tozawa, S., and Taguchi, Y. (1986). "A preliminary study of
scale effect on flexural strength of ice specimen." Proceedings
of the Fifth International Offshore Mechanics and Arctic
Engineering Symposium, American Society of Mechanical
Engineers, 336-340.
Vaudrey, K.D. (1983). "Characterization of offshore and
coastal ice conditions." Proceedings of Design for Ice Forces,
ASCE, 3-16.
Weeks, W.F., and Assur, A. (1969). "Fracture of Lake and Sea
Ice." Cold Regions Research and Engineering Lab.
Weeks, W. F., and Assur, A. (1967). "Mechanical Properties of
Sea Ice." Cold Regions Research and Engineering Laboratory.
Williams, J. L. (1990). Three Point Loading of Freshwater Ice
Beams, National Research Council Canada. Institute for Marine
Dynamics, St. John's, NL.
Williams, F. M., and Parsons, B. L. (1994). "Size effect in the
flexural strength of ice." Proceedings of the 13th International
Conference on Offshore Mechanics and Arctic
Engineering, Houston, Texas, 15-22.


