Analysis of Rainfall Data YearRainfallIntensity 143.301154.492158.71 253.021247.382242.96...
12
Analysis of Rainfall Analysis of Rainfall Data Data Year Year Rainfal Rainfal l l Intensi Intensi ty ty 1 1 43.30 43.30 11 11 54.49 54.49 21 21 58.71 58.71 2 2 53.02 53.02 12 12 47.38 47.38 22 22 42.96 42.96 3 3 63.52 63.52 13 13 40.78 40.78 23 23 55.77 55.77 4 4 45.93 45.93 14 14 45.05 45.05 24 24 41.31 41.31 5 5 48.26 48.26 15 15 50.37 50.37 25 25 58.83 58.83 6 6 50.51 50.51 16 16 54.91 54.91 26 26 48.21 48.21 7 7 49.57 49.57 17 17 51.28 51.28 27 27 44.67 44.67 8 8 43.93 43.93 18 18 39.91 39.91 28 28 67.72 67.72
-
date post
20-Dec-2015 -
Category
Documents
-
view
215 -
download
1
Transcript of Analysis of Rainfall Data YearRainfallIntensity 143.301154.492158.71 253.021247.382242.96...

Analysis of Rainfall DataAnalysis of Rainfall DataYearYear Rainfall Rainfall
IntensityIntensity
11 43.3043.30 1111 54.4954.49 2121 58.7158.71
22 53.0253.02 1212 47.3847.38 2222 42.9642.96
33 63.5263.52 1313 40.7840.78 2323 55.7755.77
44 45.9345.93 1414 45.0545.05 2424 41.3141.31
55 48.2648.26 1515 50.3750.37 2525 58.8358.83
66 50.5150.51 1616 54.9154.91 2626 48.2148.21
77 49.5749.57 1717 51.2851.28 2727 44.6744.67
88 43.9343.93 1818 39.9139.91 2828 67.7267.72
99 46.7746.77 1919 53.2953.29 2929 43.1143.11
1010 59.1259.12 2020 67.5967.59
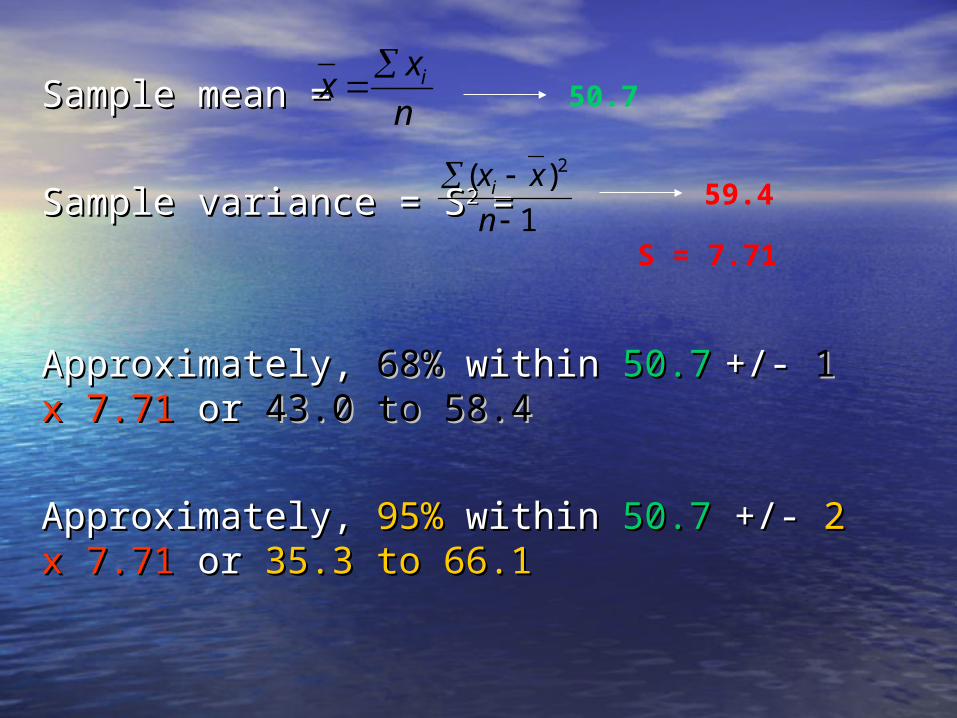
Sample mean =Sample mean =
Sample variance = SSample variance = S2 2 ==
Approximately, Approximately, 68%68% within within 50.750.7 +/- +/- 11 xx 7.717.71 or or 43.0 to 58.443.0 to 58.4
Approximately, Approximately, 95%95% within within 50.750.7 +/- +/- 22 x 7.71 x 7.71 or or 35.3 to 66.135.3 to 66.1
n
xx i 50.7
1
)( 2
n
xxi 59.4
S = 7.71
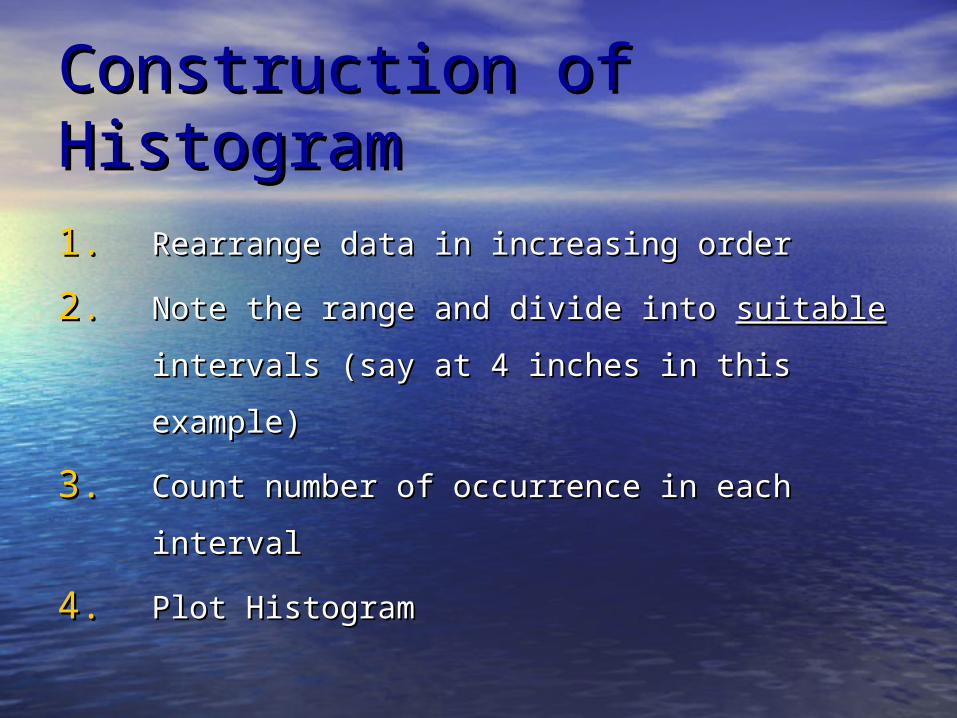
Construction of HistogramConstruction of Histogram
1.1. Rearrange data in increasing orderRearrange data in increasing order
2.2. Note the range and divide into Note the range and divide into suitablesuitable
intervals (say at 4 inches in this example)intervals (say at 4 inches in this example)
3.3. Count number of occurrence in each Count number of occurrence in each
intervalinterval
4.4. Plot HistogramPlot Histogram

HISTOGRAM
FREQUENCY DIAGRAM
Total Area = 116
Total Area = 1.0
3/116 = 0.026
or 2.6%
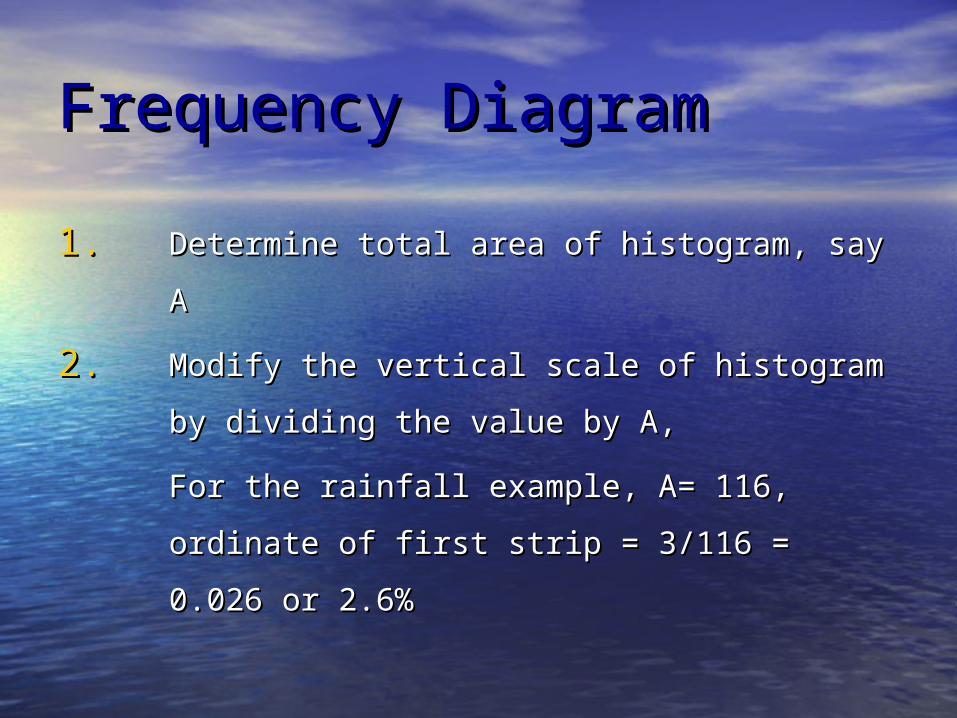
Frequency DiagramFrequency Diagram
1.1. Determine total area of histogram, say ADetermine total area of histogram, say A
2.2. Modify the vertical scale of histogram by Modify the vertical scale of histogram by
dividing the value by A, dividing the value by A,
For the rainfall example, A= 116, For the rainfall example, A= 116,
ordinate of first strip = 3/116 = 0.026 or ordinate of first strip = 3/116 = 0.026 or
2.6%2.6%

Model
Area = 0.152
FREQUENCY DIAGRAM
Statistics of Sustained Live Statistics of Sustained Live LoadLoad
Floor Load Intensity (lb/ftFloor Load Intensity (lb/ft22) – ) –
National Bureau of Standard Report National Bureau of Standard Report
19521952
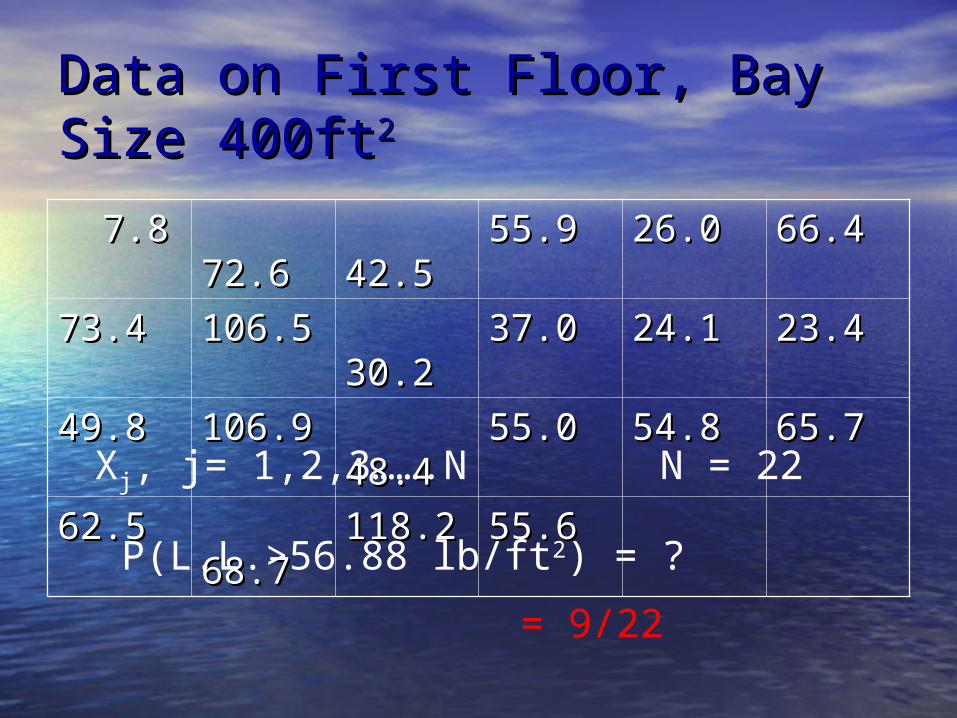
Data on First Floor, Bay Size Data on First Floor, Bay Size 400ft400ft22
7.87.8 72.672.6 42.542.5 55.955.9 26.026.0 66.466.4
73.473.4 106.5106.5 30.230.2 37.037.0 24.124.1 23.423.4
49.849.8 106.9106.9 48.448.4 55.055.0 54.854.8 65.765.7
62.562.5 68.768.7 118.2118.2 55.655.6
Xj, j= 1,2,3…….N N = 22
P(L.L.>56.88 lb/ft2) = ?
= 9/22

HistogramHistogram
1.1. Select interval, ∆X (e.g. ∆X=25 lb/ftSelect interval, ∆X (e.g. ∆X=25 lb/ft22))
2.2. Count no. observations within each iCount no. observations within each interval according to nterval according to
a < Xa < Xjj ≤ b ≤ b say nsay nii

HistogramHistogram3.3. Plot the resultsPlot the results
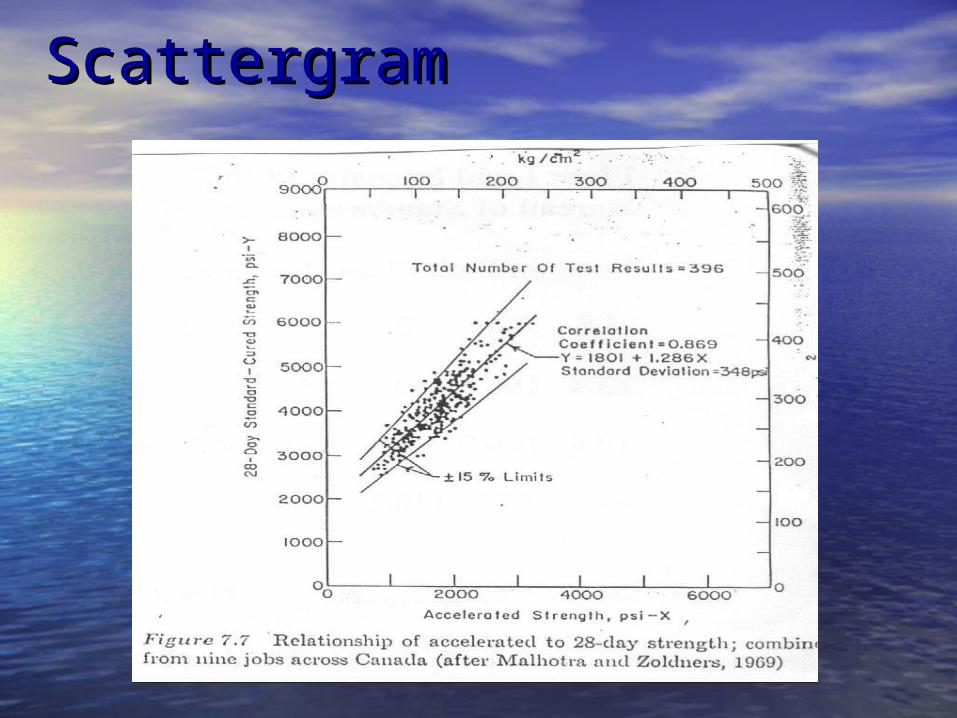
ScattergramScattergram