Analysis of national and regional agricultural trade in ... · Analysis of national and regional...
52
i Commissioned by Trócaire, the Irish Catholic Agency for Overseas Development A focus on Rwanda Analysis of national and regional agricultural trade in maize, soybeans and wheat: KIGALI, FEBRUARY 2014 G2231 A Focus on Rwanda Final_Layout 1 07/05/2014 09:34 Page i
Transcript of Analysis of national and regional agricultural trade in ... · Analysis of national and regional...

i
Commissioned by Trócaire, the Irish Catholic Agency for Overseas Development
A focus on Rwanda
Analysis of national andregional agricultural trade inmaize, soybeans and wheat:
KIGALI, FEBRUARY 2014
G2231 A Focus on Rwanda Final_Layout 1 07/05/2014 09:34 Page i

Trócaire EAC Trade Flow Analysis
ii
TABLE OF CONTENTS
EXECUTIVE SUMMARY v
LIST OF ACRONYMS vii
LIST OF FIGURES ix
LIST OF TABLES x
1. INTRODUCTION 1
1.1. Introduction 1
1.2. Objectives 2
1.3. Methodology 2
1.4. Study limitations 2
1.5. Structure of the report 2
2. SITUATION OF PRODUCTION AND PROCESSING OF MAIZE, SOYBEANS AND WHEAT 4
2.1. Production of maize, wheat and soybean 4
2.1.1. Production of maize 4
2.1.2. Production of wheat 5
2.1.3. Production of soybean 6
2.2. Processing of maize, wheat and soybean 8
2.2.1. Maize processing 8
2.2.2. Wheat processing 10
2.2.3. Soybean processing 10
2.3. Contribution of maize, soybean and wheat to food security and household’s income 11
2.4. Main challenges and constraints in producing and processing of maize, wheat and soybean 13
G2231 A Focus on Rwanda Final_Layout 1 07/05/2014 09:34 Page ii

Table of Contents
iii
3. MARKET ANALYSIS FOR MAIZE, WHEAT AND SOYBEAN PRODUCTS 17
3.1. Introduction 17
3.2. National marketing of soybean, maize and wheat products 21
3.2.1. Marketing of maize 21
3.2.2. Marketing of wheat 23
3.2.3. Marketing of soybean 24
3.3. Regional agricultural trade flows for soybean, maize and wheat products 25
3.3.1. Intra EAC flows for soybean, maize and wheat products 25
3.3.2. Rwanda in the context of EAC regional flows 27
3.4. Marketing and trade barriers for soybeans, maize and wheat processed products 32
3.5. Marketing opportunities and possible solutions to overcoming trade barriers 33
4. AGRICULTURE TRADE ENABLING ENVIRONMENT 36
4.1. Relevant national policies, institutions and strategies for soybeans, maize and wheat
processed produce trade 36
4.2. Relevant EAC policies, institutions and strategies for soybeans, maize and wheat
processed products trade 37
4.3. Recommendation on policies, institutions and strategies 39
5. CONCLUSIONS AND RECOMMENDATIONS 40
REFERENCES 42
G2231 A Focus on Rwanda Final_Layout 1 07/05/2014 09:34 Page iii

iv
Speciose Mukagasigwa from Nyarubaka with her son, David, and daughter, Sophir. Speciose is a member of a local cooperative supported by Trócaire.
G2231 A Focus on Rwanda Final_Layout 1 07/05/2014 09:34 Page iv

EXECUTIVE SUMMARYThe focus of this study is the trade in maize, soybeans and wheat and their derived products within
Rwanda and between Rwanda and the East African Community (EAC). In particular, the study analyses the
agricultural trade flows for maize, soybeans and wheat at national and regional levels, paying attention to
opportunities and threats for a competitive market for raw and processed products originating from
Rwanda. It also describes and analyses the enabling environment including regulations, policies, strategies
and institutions that govern production, processing and trade flows of maize, soybean and wheat grains and
processed products. Finally, it identifies opportunities for policy and strategic reforms as well as the
necessary measures to facilitate those reforms.
The findings of the study provide Trócaire, her partners and other development stakeholders with important
information which can be used to support the development of maize, wheat and soybean markets in Rwanda
and the East Africa region. The findings will assist small scale farmers to improve the competitiveness of their
maize, wheat and soybean products and hence increase their access to domestic and regional markets. The
information included in this report comes from an extensive review of current information available on maize,
soybean and wheat market chains in Rwanda. In addition, interviews were also held with maize, soybean and
wheat producers and processors and other key informants. The recommendations made are based on
analysis of all the data gathered.
Key Findings
• Most small scale farmers do not sell their produce in national or regional grain markets.
Instead, they sell the majority of their grains to rural traders who usually offer prices well below the
prevailing market rate;
• At a farmer level, the market is working against individual farmers who are vulnerable to pricefluctuations and usually sell their grains at low prices. As they have a stronger negotiation
position with buyers, farmers who are members of cooperatives benefit from relatively betterprices than individual farmers;
• Domestic production of grains is low and not sufficient to meet market demand withinRwanda. Grain produced often fails to meet quality requirements. As a result, processors are
required to import grains in a raw form from inside and outside the EAC. Imports of maize and wheat
grain are estimated to be roughly 20% of domestic consumption, with maize and soybean grains
coming mainly from Kenya, Tanzania and Uganda and wheat from non-EAC countries. Grain-based
processed products (maize flour, wheat flour and soybean oil) are also imported from inside and
outside the EAC.
• Grain processors in Rwanda are working well below their capacity. Only 30% of grainprocessed in Rwanda is of domestic origin. Overall, there is a negative trade balance for maize,soybean and wheat grains within the EAC, as well as for derived products such as maize and wheat
flour and soybean oil. Therefore, there is an opportunity for Rwandan producers and processorsto increase their share of the local market and to export to EAC markets;
• There is a favourable environment for the trade of maize, wheat and soybean products at anational and EAC level. The Government of Rwanda has a taken a number of measures which
promote the production, processing and trade of maize, soybean and wheat products. At the EAC
level, since 2010, all internal tariffs have been removed and the remaining non-tariff barriers are
currently being reviewed.
v
Executive Summary
G2231 A Focus on Rwanda Final_Layout 1 07/05/2014 09:34 Page v

Recommendations
For Trócaire and other stakeholders (private and public institutions)
Based on the findings of the study, Trócaire and stakeholders within the maize, soybean and wheatmarkets, such as small farmers, local and international NGOs, commercial organisations, donors, local and
national government organisations and other development partners, are urged to work together to ensure the
following measures are undertaken to improve the functioning of primary markets:
1. Establish a market information system, which grain producers can access easily to obtain timely
information from major markets within the country;
2. Increase producers’ awareness of the benefits of formal agricultural marketing systems to
ensure the sustainability of the market, for example, through introducing price guarantees and
purchase agreement contracts;
3. Establish an insurance system, which provides farmers with compensation for any losses incurred
in case of natural disasters affecting crop production;
4. Ensure the provision of increased funding for the construction and improvement of rural roads andmarkets;
5. Provide support to enable farmers and cooperatives to improve the processing and post-harvestfacilities, for wheat and soybean in particular;
6. Provide training for cooperatives in management and price negotiation, particularly for those
involved in wheat.
More broadly, in order to contribute to the development of maize, soybean and wheat markets, Trócaire andstakeholders should put an emphasis on activities aimed at improving the production and processingof grains. Such activities include:
• Promoting the use of improved good quality inputs;
• Conducting research on seeds in order to find varieties that are high yielding and suitable for local
soils;
• Promoting production processes that increase the nutritional value of processed products; and
• Developing models for the integration of small-scale production and processing stages which include
options for farmers’ cooperatives to buy shares in industrial processing.
The survey has found that the EAC trade environment is conducive to the expansion of maize, soybeanand wheat products. This is due to the removal of tariffs within the EAC area and the establishment of
institutions such as the Eastern Africa Farmers Federation (EAFF) and the Eastern African Grain Council-
Regional Agricultural Trade Intelligence (EAGC-RATIN), which deal with the promotion of the maize, soybean
and wheat products trade. However, there are still non-tariff trade barriers (NTBs) such as technical
regulations and sanitary and phytosanitary requirements which are not harmonised within the region and still
inhibit trade within the area. In order to further promote EAC trade, Trócaire and other stakeholders should put
pressure on EAC members to:
• Move beyond simply identifying and discussing NTBs to implementing regulatory reforms andreducing measures that restrict trade. A legally binding mechanism with sanctions for
noncompliance would help to fully exploit economies of scale related to economic integration.
Trócaire EAC Trade Flow Analysis
vi
G2231 A Focus on Rwanda Final_Layout 1 07/05/2014 09:34 Page vi

LIST OF ACRONYMSARDI Association Rwandaise pour la promotion du Développement Intégré
BAIR Bureau d’Appui aux Initiatives Rurales
BGM Bakhresa Grain Milling
BRALIRWA Brasserie et Limonaderie du Rwanda
CATALIST Catalyze - Accelerated Agricultural Intensification for Social and Environmental
Stability in Africa’s Great Lakes Region
CIMMYT International Maize and Wheat Improvement Center
CIP Crop Intensification Programme
COAMV Coopérative des Agriculteurs de Maïs dans la région des Volcans
COCOF Conseil Consultatif des Femmes
COMPETE Competitiveness and Trade Expansion
CRS Catholic Relief Services
CSB Corn Soya Blend
DRC Democratic Republic of the Congo
DUHAMIC ADRI Duharanira Amajyambere y’Icyaro
EAC East African Community
EAFF Eastern Africa Farmers Federation
EAGC-RATIN Eastern African Grain Council-Regional Agricultural Trade Intelligence
EDPRS Economic Development and Poverty reduction Strategy
ENAS Nkubili Enterprise Nkubili Alfred & Sons
FAO Food and Agriculture Organization
GoR Government of Rwanda
GIZ German Agency for International Technical Cooperation
IFDC International Fertilizer Development Center
IMF International Monetary Fund
IPFG Initiative pour la Promotion de la Famille et du Genre
ISAR Institut des Sciences Agronomiques du Rwanda
MINAGRI Ministry of Agriculture and Animal Resources
MINECOFIN Ministry of Economic Planning and Finance
MINIMEX Minoteries – Import – Export
NAP National Agricultural Policy
List of Acronyms
vii
G2231 A Focus on Rwanda Final_Layout 1 07/05/2014 09:34 Page vii

NGOs Non-Government Organizations
NMCs National Monitoring Committees
NTBs Non-Tariffs Barriers
PRSP Poverty Reduction Strategy Paper
RAB Rwanda Agricultural Board
RADA Rwanda Agricultural Development Authority
RDI Rwanda Development Investment
RGCC Rwanda Grain and Cereal Council
ROPARWA Réseau des Organisations Paysannes du Rwanda
SOPAR Société Production Aliment Rubilizi
SOSOMA Soya, Sorghum et Maize
SOTIRU Société des Travaux Industriels du Rwanda
UNICOBLE Union des Coopératives des Blés
UNICOOPAGI Union des Coopératives Agricoles Intégrées
USA United States of America
USAID United States Agency for International Development
WFP World Food Programme
WTO World Trade Organization
Trócaire EAC Trade Flow Analysis
viii
Maize planting season is approaching in Rwanda and farmers at a communal farm prepare the land.
G2231 A Focus on Rwanda Final_Layout 1 07/05/2014 09:34 Page viii

LIST OF FIGURESFigure 1: Zones with high potential for maize production 4
Figure 2: Zones with high potential for wheat production 5
Figure 3: Zones with high potential for soybean production 7
Figure 4: Forecasted Rwandan demand for maize, wheat and soybean grains 2011-2020 19
Figure 5: EAC annual average of exports and imports of wheat, soybean oil, maize,
wheat flour, maize flour and soybeans (tonnes) 26
Figure 6: EAC total imports and production of wheat (tonnes) 26
Figure 7: Total Rwanda imports from the EAC community 2005-2010 (tonnes) 28
Figure 8: Rwanda maize production and imports (tonnes) 29
Figure 9: Rwanda maize exports 2005-2010 (tonnes) 30
Figure 10: Rwanda wheat production and imports (tonnes) 31
Figure 11: Rwandan exports of wheat flour 2005 - 2010 (tonnes) 32
List of Figures
ix
G2231 A Focus on Rwanda Final_Layout 1 07/05/2014 09:34 Page ix

LIST OF TABLESTable 1: Trends in maize production 2005-2011 5
Table 2: Trends in wheat production 2005 - 2011 6
Table 3: Trend in soybean production 2005 - 2011 7
Table 4: Major actors in maize processing in Rwanda 8
Table 5: Major actors in wheat processing in Rwanda 10
Table 6: Gross margins for maize, soybean and wheat production 12
Table 7: Rwandan production and imports of wheat, maize and soybean grains (tonnes) 17
Table 8: Rwandan exports of wheat, maize and soybean grains and their derived
products (tonnes) 18
Table 9: Situation of EAC production and imports of maize, wheat and soybean (tonnes) 20
Table 10: Total intra-EAC trade and EAC imports of wheat, maize and soybean derived
products (tonnes) 20
Table 11: Main sources and quantities of Rwandan maize grains imports (tonnes) 22
Table 12: Main sources and quantities of Rwandan maize flour imports (tonnes) 22
Table 13: Main sources and quantities of Rwandan wheat grain imports (tonnes) 23
Table 14: Main sources and quantities of Rwandan wheat flour imports (tonnes) 23
Table 15: Estimated annual average of imports of maize grain and maize flour (tonnes) 28
Table 16: Estimated annual average of imports of wheat grain and wheat flour (tonnes) 30
Trócaire EAC Trade Flow Analysis
x
G2231 A Focus on Rwanda Final_Layout 1 07/05/2014 09:34 Page x

1
1. INTRODUCTION 1.1. BACKGROUND CONTEXT
In 2000, Rwanda adopted a long-term development vision called “Vision 2020”, which aims to transformRwanda into a middle income country by 2020. This vision establishes Rwanda’s development objectives
based on the pillars of good governance, transformation and modernisation of the agriculture sector,
development of human resources, private sector and infrastructure, promotion of regional and international
economic integration, gender equality, environmental protection and sustainable management of natural
resources, science and technology (MINECOFIN, 2000). It is envisaged that the implementation of this
programme will promote macroeconomic stability and wealth creation in order to reduce the country’s
dependency on aid (MINECOFIN 2000).
The Economic Development and Poverty Reduction Strategy 2 (EDPRS2) for Rwanda and its predecessors,
the Economic Development and Poverty Reduction Strategy 1 (EDPRS1) and the Poverty Reduction Strategy
Paper (PRSP), stress the importance of the agricultural sector in the growth of the economy. The
evaluation of the progress achieved under the PRSP strategy showed that the agricultural sector provided on
average 36.4 % of GDP and employed on average 80 % of the working population (MINECOFIN 2007).
Agriculture is therefore seen as the engine of economic growth and is being transformed with the aim of
equipping Rwanda with a modern and commercial agricultural sector. It is hoped that, over time, a strong
agricultural sector will stimulate growth in other sectors of the economy. According to the strategic plan for
the Ministry of Agriculture and Animal Resources (MINAGRI), the sector needs to develop agricultural value
chains, which complement the natural environment in Rwanda’s different agricultural regions. By exploiting
comparative advantages, Rwandan farmers will be well placed to maximize opportunities in domestic,
regional and international markets, leading to growth in the agricultural economy which will in turn stimulate
growth elsewhere in the economy (MINAGRI, 2004).
Within the above context, the MINAGRI strategic plan promotes the intensification of agriculture and
increase of land and crop productivity through greater use of inputs (such as improved seed varieties, organic
and mineral fertilisers, pesticides etc.) and improved agricultural techniques with an emphasis on improving
water management and conservation (irrigation, harvesting run off, etc.). Crops identified as a priority include
maize, soybeans and wheat. Therefore, this study aims to assess the trade patterns, trends, market dynamics
and competitiveness for Rwandan maize, soybeans and wheat and their derived products (wheat flour, maize
flour and soybean flour).
The study will focus on the national and the East African Community (EAC) markets, with some analysis
of the market outside of the EAC. The EAC is an organisation of East African countries which facilitates trade
between its members. It was founded in 1999 by Kenya, Tanzania and Uganda. Rwanda and Burundi both
joined in 2007. The EAC comprises a market of approximately 120 million people, of whom between 70 to
90% earn their living either directly or indirectly from the agricultural sector (EAC Secretariat, 2006).
G2231 A Focus on Rwanda Final_Layout 1 07/05/2014 09:34 Page 1

Trócaire EAC Trade Flow Analysis
2
1.2. OBJECTIVES
This study examines information on trade patterns, trends, market dynamics and competitiveness for maize,
wheat and soybean raw and processed products at local, national and regional (EAC) levels. It is hoped that the
information and data contained in this report will help small scale farmers, local and international NGOs and
other development stakeholders involved in the maize, wheat and soybean markets to improve their activities.
Specifically, the study
(i) analyses agricultural trade flows for maize, soybeans and wheat at a national level in Rwanda and
a regional level within the EAC, with a focus on opportunities and threats for a competitive market for
raw and processed products originating from Rwanda;
(ii) describes and analyses the enabling environment, including regulations, policies, strategies and
institutions that govern production, processing and trade flows and identify opportunities for policy
and strategic reforms as well as necessary measures to facilitate those reforms; and
(iii) provides insight and key recommendations for development agencies such as Trócaire, her
partners and other development stakeholders in order to assist smallholder farmers, as well as the
sector more broadly, to improve the competitiveness of their products and hence increase their
access to domestic and regional markets, thus boosting pro-poor agricultural trade growth.
1.3. METHODOLOGY
The following methods were used to conduct this study:
(i) An in-depth review of existing literature and data on agriculture policies and strategies for maize,
soybean and wheat value chains in Rwanda and the EAC with a focus on trade flows in maize,
soybean and wheat products;
(ii) Semi structured interviews with Trócaire partners and other key stakeholders such as researchers,
farmers, agronomists and traders involved in wheat, maize and soybean production and processing;
and,
(iii) Statistical analysis of the information and data gathered.
1.4. STUDY LIMITATIONS
The study was limited by the shortage of available data on the trade environment for maize, wheat and
soybean products at local and national levels. Most farmers and traders do not keep information on trade
flows and therefore the study had to rely to a large extent on data gathered through semi structured
interviews and other secondary sources.
1.5. STRUCTURE OF THE REPORT
This report is structured into five chapters. The first chapter is the introduction explaining the scope of thestudy; the second chapter describes the situation of maize, wheat and soybean production and processingin Rwanda; the third chapter analyses the market for maize, wheat and soybean products and the fourth
chapter describes the enabling environment for trade in maize, wheat and soybean products. The fifth
chapter gives the conclusions drawn from the study and recommendations.
G2231 A Focus on Rwanda Final_Layout 1 07/05/2014 09:34 Page 2

3
Venuste Mukeshimana in the soybeans store at SOSOMA Industries Ltd., Kigali, Rwanda.
G2231 A Focus on Rwanda Final_Layout 1 07/05/2014 09:34 Page 3

2. PRODUCTION ANDPROCESSING OF MAIZE,SOYBEANS AND WHEAT2.1. PRODUCTION OF MAIZE, SOYBEANS AND WHEAT
2.1.1. Maize production
Maize is grown throughout Rwanda. However, production is greatest in Nyagatare, Gatsibo, Kirehe and
Bugesera Districts of the Eastern Province and in Gicumbi District of the Northern Province, where growing
conditions are most favourable (USAID, 2009). The main maize varieties grown include RHM 102, ISAR M 104,
ISAR M 102, ZM 607, KH 500-46A, KH 500-31A and RHM 103 known as Kagega (MINAGRI, 2012). The main
diseases affecting the maize crop in Rwanda are tarcicum leaf blight, polysora rust and strigaspp (RADA, 2008).
Maize growers include individual small scale farmers, small farmers' cooperatives, big cooperatives such as
Cooperatives des Agriculteurs de Mais dans la region des Volcans (COAMV) Akanyaru River Valley. There are
also some big companies producing maize like ENAS Nkubili and Maizerie de Mukamira. Some initiatives are
supported by NGOs and others are purely private.
4
Figure 1: High potentiality zones (in light green colour) for maize production
G2231 A Focus on Rwanda Final_Layout 1 07/05/2014 09:34 Page 4

5
The Government of Rwanda’s Crop Intensification Programme (CIP) which began in 2007 has resulted in
significant increases in the national production of maize. The CIP’s main goals are to increase agricultural
productivity in high-potential food crops and to ensure food security and self-sufficiency through increasing
access to productive inputs (fertilisers and seeds), improved water use (improvement of irrigation) and
increasing the area under cultivation (marshland development). CIP implementation enabled the maize yieldto quadruple to 2.3 tonnes per ha by 2010 (IFDC, 2010) and the area under maize production toincrease by 30%, as highlighted in Table 1. However, there is scope to increase the current yield of maize as
it has not yet reached the maximum potential yield, estimated at 5 tonnes/ha (RADA, 2008).
2.1.2. Wheat Production
Wheat was introduced to Rwanda at the beginning of the nineteenth century by European missionaries.
Conditions are most favourable for wheat production in Musanze, Gicumbi and Rurindo Districts in the
Northern Province, Nyabihu District in the Western Province, and, Nyamagabe and Nyaruguru Districts in the
Southern Province (USAID, 2009).
Figure 2: High potentiality zones (in light green colour) for wheat production
Section 2 Production and Processing of Maize, Soybeans and Wheat
Table 1: Trends of maize production for 2005-2011period
Maize 2005 2006 2007 2008 2009 2010 2011
Production (tonnes) 97,251 91,813 102,000 167,000 286,946 432,404 525,679
Area harvested (ha) 109,400 114,836 141,168 144,896 147,129 184,658 256,000
Yield (kg/ha) 889 800 723 1,153 1,950 2,342 2534
Source: FAOSTAT(2012) and MINAGRI(2010)
G2231 A Focus on Rwanda Final_Layout 1 07/05/2014 09:34 Page 5

Currently the wheat varieties grown include EN161, KS Mwamba, EN48 and Musama. The Musama variety is
most prevalent, whilst the popularity of the other varieties is slowly growing. All wheat is produced by small
scale farmers, either individually or grouped in cooperatives. Almost all cooperatives are assisted by local
NGOs such as Bureau d’Appui aux Initiatives Rurales (BAIR), Union des Cooperatives Agricoles de Gikongoro
(UNICOOPAGI), Union des Coopératives des Blés (UNICOBLE), Réseau des Organisations Paysannes du
Rwanda (ROPARWA), Caritas, etc. The main diseases affecting wheat include yellow rust, stem rust, powdery
mildew and chnootribasimilis (RADA, 2008).
Efforts aimed at promoting wheat production in Rwanda started three decades ago. Since then, the area
dedicated to wheat cultivation has increased significantly to over 44,000 ha in 2011. However, wheat
production remains modest at just over 90,000 tonnes in 2011, given the potential market for the crop. Thenear quadrupling of wheat production, since the introduction of the CIP in 2007 has been mostly driven
by production activity, rather than as a response to any particular new or emerging market development. The
current yield, which is estimated at around 2 tonnes per ha is below the potential yield which is estimated
at between 3 to 4 tonnes/ha (RADA, 2008).
2.1.3. Soybean production
Soybean was introduced into Rwanda in 1930
(Mujawamariya, 2012). The areas most
suitable for soybean production are Nyagatare,
Gatsibo, Kirehe and Bugesera Districts in the
Eastern Province and Gicumbi District in the
Northern Province (USAID, 2009).
Currently, the soybean varieties cultivated are
Peka 6, Bossier, Ogden, Duiker, 449/16,
Soprosoy, Yezumutima, Buki and 1740-2E
(Mujawamariya, 2012). The main diseases
affecting soybean are lamprosema and
pyrenochaetaglycines (RADA, 2008).
Trócaire EAC Trade Flow Analysis
6
Immaculée Mukobwujaha filtering soya at SOSOMA Industries Ltd., Kigali, Rwanda.
Table 2: Trends in wheat production (2005 – 2011)
Wheat 2005 2006 2007 2008 2009 2010 2011
Production (tons) 21,942 19,549 24,633 67,869 72,479 77,193 90,684
Area harvested (ha) 24,157 22,972 27,528 52,336 42,438 49,386 44,284
Yield (kg/ha) 908 851 895 1,297 1,708 1,563 2,049
Source: Author on the basis of data of FAOSTAT (2012) and MINAGRI (2010)
G2231 A Focus on Rwanda Final_Layout 1 07/05/2014 09:34 Page 6

Section 2 Production and Processing of Maize, Soybeans and Wheat
7
Soybean is produced mainly by small-scale farmers, either individually or grouped in cooperatives. Some are
assisted by NGOs such as Duharanira Amajyambere y’icyaro (DUHAMIC-ADRI), Association Rwandaise pour
la promotion du Développement Intégré (ARDI), Conseil Consultatatif des Femmes (COCOF), etc. There are
plans, under the International Fertiliser Development Center (IFDC) CATALIST project, to establish a 700 ha
soybean farm near Akagera, and to establish contracts with 7,000 small-scale farmers for soybean production.
It is hoped that this soybean produce will then supply an oil and cake processing factory which will be
established in Kayonza (USAID, 2009).
The adoption of soybean has been slow despite government efforts to promote the crop to farmers
through the CIP. Although there were some initial increases at the start of the CIP, yields and production still
remain low. Currently the soybean yield can be estimated at around 800kg/ha while the potential yield is
estimated at between 1.2-1.6 tonnes/ha (RADA, 2008).
Figure 3: Zones with high potential for soybean production
Table 3: Trends in soybean production 2005 - 2011
Soybeans 2005 2006 2007 2008 2009 2010 2011
Production (tonnes) 23,703 27,138 39,819 50,931 54,000 57,089 37,426
Area harvested (ha) 42,120 42,364 50,238 61,748 65,731 72,353 47,981
Yield (kg/ha) 563 641 793 825 822 789 780
Source: FAOSTAT, 2012 and MINAGRI, 2010
G2231 A Focus on Rwanda Final_Layout 1 07/05/2014 09:34 Page 7
2.2. PROCESSING OF MAIZE, SOYBEAN AND WHEAT
As with the processing of the majority of agricultural products in Rwanda, the processing of maize, wheatand soybean occurs within the informal sector through petty traders, small unregistered mills or artisanal
processing. The formal processing sector – medium and larger registered mills and processing enterprises –
is relatively small and functioning dramatically below installed capacity. Products produced through informal
hammer mills have a shorter shelf life and need to be consumed within days. However, shelf life is not
currently seen as a consumer priority (USAID, 2009).
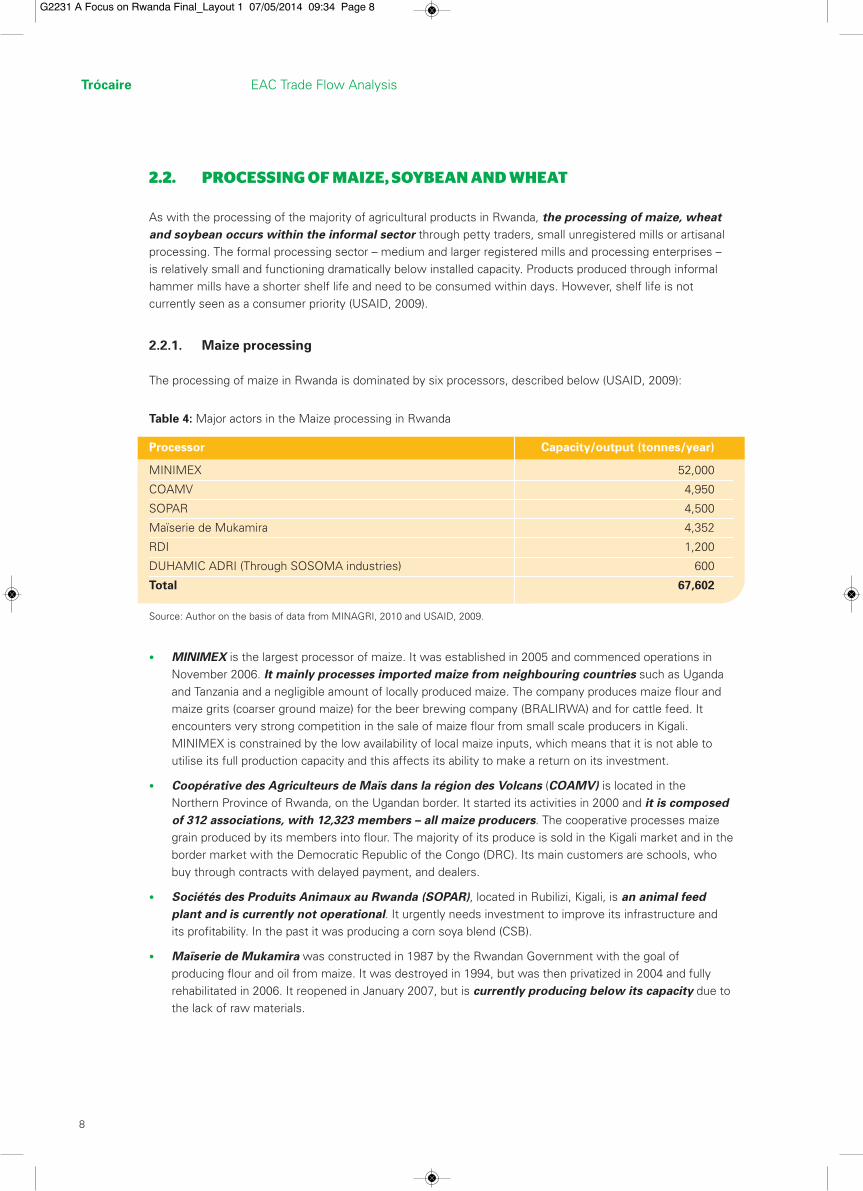
2.2.1. Maize processing
The processing of maize in Rwanda is dominated by six processors, described below (USAID, 2009):
• MINIMEX is the largest processor of maize. It was established in 2005 and commenced operations in
November 2006. It mainly processes imported maize from neighbouring countries such as Uganda
and Tanzania and a negligible amount of locally produced maize. The company produces maize flour and
maize grits (coarser ground maize) for the beer brewing company (BRALIRWA) and for cattle feed. It
encounters very strong competition in the sale of maize flour from small scale producers in Kigali.
MINIMEX is constrained by the low availability of local maize inputs, which means that it is not able to
utilise its full production capacity and this affects its ability to make a return on its investment.
• Coopérative des Agriculteurs de Maïs dans la région des Volcans (COAMV) is located in the
Northern Province of Rwanda, on the Ugandan border. It started its activities in 2000 and it is composedof 312 associations, with 12,323 members – all maize producers. The cooperative processes maize
grain produced by its members into flour. The majority of its produce is sold in the Kigali market and in the
border market with the Democratic Republic of the Congo (DRC). Its main customers are schools, who
buy through contracts with delayed payment, and dealers.
• Sociétés des Produits Animaux au Rwanda (SOPAR), located in Rubilizi, Kigali, is an animal feedplant and is currently not operational. It urgently needs investment to improve its infrastructure and
its profitability. In the past it was producing a corn soya blend (CSB).
• Maïserie de Mukamira was constructed in 1987 by the Rwandan Government with the goal of
producing flour and oil from maize. It was destroyed in 1994, but was then privatized in 2004 and fully
rehabilitated in 2006. It reopened in January 2007, but is currently producing below its capacity due to
the lack of raw materials.
Trócaire EAC Trade Flow Analysis
8
Table 4: Major actors in the Maize processing in Rwanda
Processor Capacity/output (tonnes/year)
MINIMEX 52,000
COAMV 4,950
SOPAR 4,500
Maïserie de Mukamira 4,352
RDI 1,200
DUHAMIC ADRI (Through SOSOMA industries) 600
Total 67,602
Source: Author on the basis of data from MINAGRI, 2010 and USAID, 2009.
G2231 A Focus on Rwanda Final_Layout 1 07/05/2014 09:34 Page 8

Section 2 Production and Processing of Maize, Soybeans and Wheat
9
• Rwanda Development Investment (RDI) was created by the Rwanda Development Organization in
2006. RDI processes maize for cooperatives in the area formerly known as Umutara Province (this
area is now mostly included within Nyagatare District). Altogether, 80% of RDI’s production is maize flour
and 20% is maize grits. The market for its products is mainly limited to Nyagatare District, but it also sells
to schools and prisons outside of the area.
• DUHAMIC-ADRI is an NGO which owns over 80% of the shares in SOSOMA Industries. SOSOMA
Industries is best known for UNIMIX, which is a mixture of flour of soya, maize, vitamins and
mineral and for SOSOMA No. 1 and No. 2, blends of sorghum, corn and soya flour. Products are sold
mainly to development organisations, with 67 % of sales to organisations such as the WFP and USAID.
In addition to these big processors, there are many small grinding mills belonging to dealers in Kigali and
other urban areas throughout the country. The flour produced by these small grinding mills is of low quality
and is sold almost exclusively to local markets. Clients are mainly households buying small quantities for
family food needs.
The poor quality of locally produced maize is another factor that affects processors. For instance, bright
yellow flour is not popular in Rwanda and there is a low demand for it. Whilst Rwandan maize is cleaner than
maize from Uganda, Rwandan maize generally contains different varieties and colours of grains. Mixed colour
maize yields poor flour after milling, which impacts on market margins for traders. As a result, traders prefer
white maize from Uganda as this is uniform in colour thereby giving a better quality of flour once processed.
However, traders pointed out that maize from Nyagatare District is a uniform colour (USAID, 2009).
Stories of ChangeThe Cooperative Level
Our cooperative is known as KOABOBAK and we
grow MAIZE and SOYBEAN crops in Nyaruguru
District in the Southern Province. We started working
in 2008. At that stage we met infrequently, only used
traditional agricultural techniques, had low yields, no
access to credit and distrusted all financial institutions.
Our lives have now changed for the better. We have increased knowledge of agricultural techniques
that complement our traditional approaches and help us to increase yields. The yield from our maize
plantations has increased from 2T/ha to 4T/ha.
Our cooperative now meets regularly, has increased membership and has a fully trained
management committee. Thanks to this we have been able to access credit from financial
institutions. This has helped us to increase our incomes greatly. For instance, from a 400,000
Rwf loan, we were able to pay for the transportation of 23.2T of harvest from NGOMA to Kigali.
In Kigali we received 8,352,000 RwF for our harvest leaving us with plenty of profit even after we
paid back the loan and other expenses. The Trócaire project supported us considerably to achieve
these improvements, but now we are able to function more independently.
The KOABOBAK cooperative meeting to discussways of increasing it links with the Kigali market.
G2231 A Focus on Rwanda Final_Layout 1 07/05/2014 09:34 Page 9

2.2.2. Wheat processing
There are four main companies involved in wheat processing in Rwanda. These are: Bakhresa Grain Milling
(BGM) Rwanda located in Kigali city, PEMBE and SOTIRU flour mills both located in the Northern Province
and Nyungwe Flour Mill located in Nyamagabe District, Southern Province (currently closed).
Bakhresa Grain Milling (BGM) Rwanda is a branch of one of East Africa’s largest flour millers, BGM, which
has its headquarters in Tanzania. BGM Rwanda started commercial production in Rwanda in May 2011. Localfarmers supply the company with a meagre 0.1% of its wheat. The rest is imported from the US, Canada,
Brazil, Argentina, Russia, Ukraine and Australia.
PEMBE flour mill, Byumba, is a branch of the Kenyan company, PEMBE, which owns several flour mills in the
sub-region: seven in Kenya, one in Tanzania and one in Uganda. It processes imported wheat from Russia.
The company is currently trying to source more wheat grain locally and hopes to use local produce for 20% of
its needs in the near future. The company plans to provide flour to Rwanda, Burundi and DRC (USAID, 2009).
Société des Travaux Industriels du Rwanda (SOTIRU) was formerly a Rwandan-Belgian company, known
as ETIRU, which closed in 1995 and was then sold in 2001 to a group of Rwandan investors. It sources 20%of its wheat from local producers. SOTIRU processes four products from wheat: Flour n°1 intended for the
bread making/bakeries, Flour n°2 for porridge, Flour n°3 for small ruminants feed and Flour n°4 for large
ruminants feed (USAID, 2009).
Nyungwe Flour Mill ceased operations in 2010, but plans to reopen in the near future. In 2009, the flour
mill was producing at only 20% of its capacity. At the time of its closure it was producing three products,
wheat flour for bakeries, flour for porridge and “son de blé” (wheat bran) for animal feeds (USAID, 2009).
As for maize production, there are also numerous small grinding mills that are well equipped and process
wheat. These small mills belong either to dealers or to artisans who work on customer demand or occasional
contracts. The artisanal wheat flour is sold to families who use the flour for porridge (especially in the area of
Gikongoro), doughnuts and bakers who blend the flour of local wheat with the flour of imported wheat
(USAID, 2009).
2.2.3. Soybean processing
Soybean processing in Rwanda is dominated by the Kigali-based SOSOMA Industries Ltd. SOSOMA
Industries are engaged in flour production and marketing. Products include soybean flour, maize flour,
sorghum flour and SOSOMA n° 1 and n° 2. Most of these products are sold in supermarkets throughout the
country. The company purchases raw materials inputs (soybean, maize and sorghum grains) from farmer
cooperatives. The company purchases 300 tonnes of soybean a year of which 220 tons is imported from
regional markets, mainly Uganda. Only about 26% of its soybean is sourced locally (Mujawamariya, 2012).
Trócaire EAC Trade Flow Analysis
10
Table 5: Major actors in wheat processing in Rwanda
Processor Capacity/output (tones/year)
Bakhresa Grain Milling(BGM) Rwanda 90,000
PEMBE flour mill 66,000
SOTIRU 15,000
Flour mill of Nyungwe 5,000
Total 176,000
Source: Author on the basis of data from MINAGRI (2010) and USAID (2009).
G2231 A Focus on Rwanda Final_Layout 1 07/05/2014 09:34 Page 10

Section 2 Production and Processing of Maize, Soybeans and Wheat
11
Apart from SOSOMA industries, there are other small factories involved in soybean processing including
Conseil Consultatif Féminin (COCOF), Cooperative ABAHUJE and Initiative pour la Promotion de la Famille et
du Genre (IPFG). Also, as mentioned above, there will be a new soybean oil factory in Kayonza District in the
Eastern Province, which is expected to start processing soybean towards the end of 2013.
COCOF is a non-governmental initiative located in Kamonyi District, Musambira Sector. It works with thelocal population, especially women trained in the cultivation and small scale processing of soybean.
COCOF has a production unit which transforms soybean into various consumable products such as soya flour,
composite flour made of soybean, maize and sorghum, fortified flour, tofu and soymilk. Its products are
mainly sold in Muhanga Town, Kigali City and Kamonyi District.
The ABAHUJE cooperative was established in 1998 and has its headquarters in Ruhango District, Ruhango
Sector. The ABAHUJE cooperative promotes soybean production and processing. The cooperative believes that
this strategy will ensure the food security of the local population. It has a factory producing soybean milk,
tofu, animal feeds, etc. It processes 1.5 tonnes of soybeans per year. The products are mainly sold locally.
IPFG is a non-profit organisation created in 2002. It is based in Gasaka Sector, Nyamagabe District in the
Southern Province. Since 2006, IPFG has been processing cereals such as sorghum, wheat, maize, millet and
soybean in order to enhance the quality and shelf life of these cereals. It has a unit that processes seven
products: composite flour (Komezubuzima), wheat flour, millet flour, soybean flour, red sorghum flour, roasted
soybean coffee, soymilk residuals, tofu, maize flour and soymilk. IPFG has one shop called Komezubuzima in
Nyamagabe District, Gasaka Sector. Its products are almost exclusively sold to consumers at a local level in
Nyamagabe Town.
2.3. CONTRIBUTION OF MAIZE, SOYBEANS AND WHEAT TO FOODSECURITY AND HOUSEHOLD INCOME
Household level food security is an issue for the rural population. Based on anecdotal evidence, it is estimated
that producers retain between 20% - 40% of their farm production for household consumption. Cash
from the sale of the remaining 60% - 80% of production must cover their daily living expenses as well as their
entire investment in inputs and improved production practices (USAID, 2009). However, in some areas,
farmers use more than 40% of their produce for household consumption.
Available estimates show that maize producers retain 52% and soybean producers 58%of their producefor household consumption (USAID, 2009). These rates show that maize and soybean are contributing to
the food security of their producers. For wheat, there is also a sizeable percentage of produce that is
consumed at the producer level. However, the percentage is low compared to maize and soybean. This
indicates that wheat is a more commercially oriented crop in the Rwandan context.
Furthermore, the produce that is sold on the market is also contributing to the food security of the purchasers
of these products. According to the International Monetary Fund (IMF), the CIP has led to an increase in the
production of maize, wheat, rice and Irish potatoes, which in turn contributes to the improvement of food
security at national level. The average dietary intake of the Rwandan population increased from 1900kilocalories (kcal) per person per day in 2007 to 2100 kcal per person per day in 2009 (IMF, 2011).
G2231 A Focus on Rwanda Final_Layout 1 07/05/2014 09:34 Page 11
Trócaire EAC Trade Flow Analysis
12
With respect to the contribution of maize, soybeans and wheat to household income, the following table
shows the margins that farmers can obtain from the cultivation of these crops:
Table 6: Gross margins for maize, soybean and wheat production
Crop Cost of production Yield Total cost of Market price Total income Gross margin(Frws/1kg) (Kg/ha) production (Frw/ha) (Frw/kg) (Frw/ha) (Frw/ha)
Maize 69 2,000 138,000 200 400,000 262,000
Wheat 87.8 3,000 263,400 280 840,000 576,600
Soybean 43.8 1,200 52,560 250 300,000 247,440
Source: Author’s calculations on the basis of data collected by USAID (2009) and Mujawamariya (2012) and from the interviews tobulk collectors
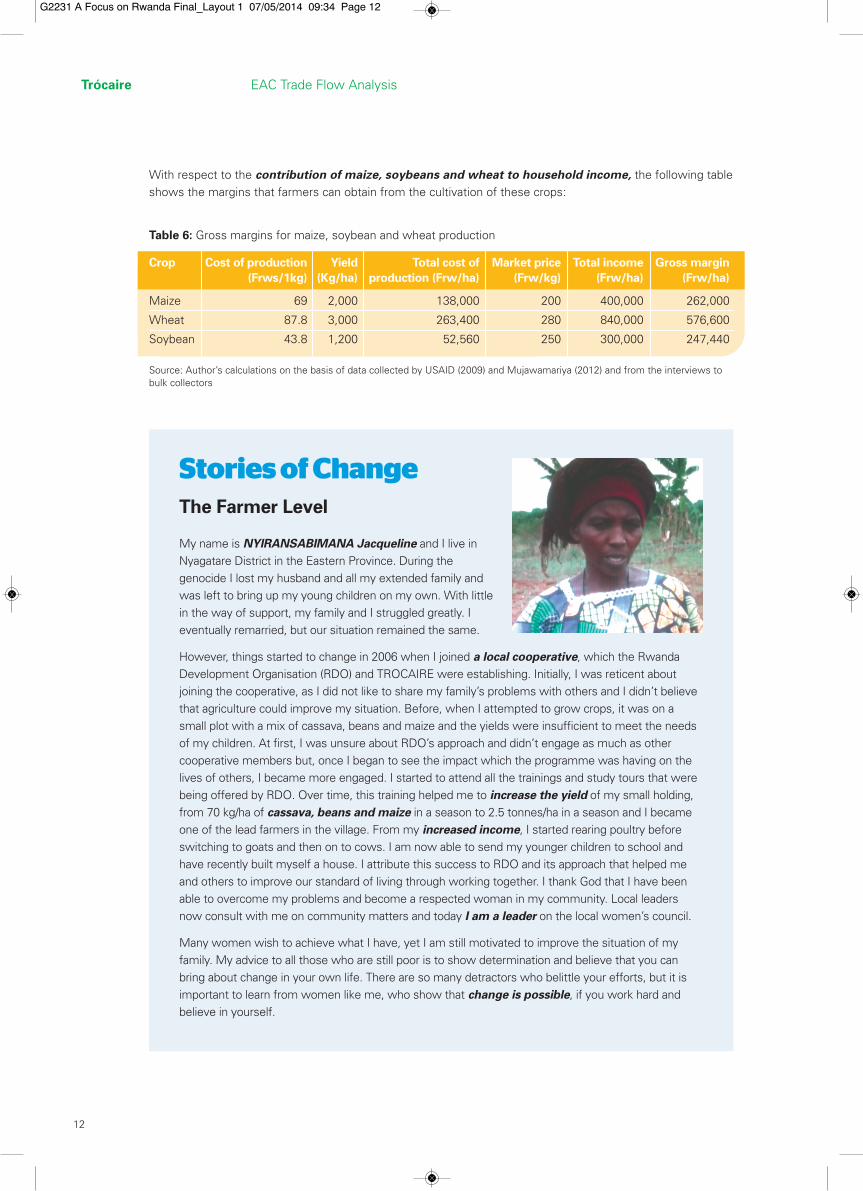
Stories of ChangeThe Farmer Level
My name is NYIRANSABIMANA Jacqueline and I live in
Nyagatare District in the Eastern Province. During the
genocide I lost my husband and all my extended family and
was left to bring up my young children on my own. With little
in the way of support, my family and I struggled greatly. I
eventually remarried, but our situation remained the same.
However, things started to change in 2006 when I joined a local cooperative, which the Rwanda
Development Organisation (RDO) and TROCAIRE were establishing. Initially, I was reticent about
joining the cooperative, as I did not like to share my family’s problems with others and I didn’t believe
that agriculture could improve my situation. Before, when I attempted to grow crops, it was on a
small plot with a mix of cassava, beans and maize and the yields were insufficient to meet the needs
of my children. At first, I was unsure about RDO’s approach and didn’t engage as much as other
cooperative members but, once I began to see the impact which the programme was having on the
lives of others, I became more engaged. I started to attend all the trainings and study tours that were
being offered by RDO. Over time, this training helped me to increase the yield of my small holding,
from 70 kg/ha of cassava, beans and maize in a season to 2.5 tonnes/ha in a season and I became
one of the lead farmers in the village. From my increased income, I started rearing poultry before
switching to goats and then on to cows. I am now able to send my younger children to school and
have recently built myself a house. I attribute this success to RDO and its approach that helped me
and others to improve our standard of living through working together. I thank God that I have been
able to overcome my problems and become a respected woman in my community. Local leaders
now consult with me on community matters and today I am a leader on the local women’s council.
Many women wish to achieve what I have, yet I am still motivated to improve the situation of my
family. My advice to all those who are still poor is to show determination and believe that you can
bring about change in your own life. There are so many detractors who belittle your efforts, but it is
important to learn from women like me, who show that change is possible, if you work hard and
believe in yourself.
G2231 A Focus on Rwanda Final_Layout 1 07/05/2014 09:34 Page 12

Section 2 Production and Processing of Maize, Soybeans and Wheat
13
The cost of production includes labour for cropping activities, seeds and other inputs used in crop production.
The cost of producing one kilogram of maize is Frws 69, one kilogram of wheat is Frws 87.9 and onekilogram of soybean is Frws 43.8. In calculating these costs, intensive production conditions have been
assumed. The yield which has been taken into consideration is the minimum potential yield. The market price
is the average price paid last year for maize, soybean and wheat producers by bulk collectors.
Based on the current average yields for maize, soybean and wheat and a land holding of 0.2 ha (the minimum
arable land holding per household according to USAID, 2009), each household cultivating maize, soybeanand wheat can expect to realise gross margins of at least Frws 52,400; Frws 115,320, and Frws 49,488respectively per cropping season. Taking into account that there are two cropping seasons per year for
maize and soybean and that part of the production is consumed at a household level, maize and soybean
crops are respectively contributing at least Frws 52,400 and Frws 49,488 to producer’s income per year. In
terms of percentages, this can be estimated as a minimum of 16% of household income per year for maize
and 15% for soybean. The minimum contribution of wheat to household’s income should be significantly
more than 16% because wheat is less often consumed at a household level. These figures demonstrate the
importance of these crops to small farmers.
2.4. MAIN CHALLENGES AND CONSTRAINTS IN PRODUCING ANDPROCESSING MAIZE, SOYBEAN AND WHEAT
In general, agriculture in Rwanda consists of subsistence farming characterised by low productivity of
both plant and animal breeds on fragmented small farms (national average farm size is 0.75 ha per
household), with basic farm management practices (MINAGRI, 2013). The farming community is mostly rural
based and illiterate, with very limited access to farm credit to purchase the farming inputs needed (MINAGRI,
2004).
Farming operations undertaken with hand tools represent 98.5 % of total farming operations, while
the use of animal traction and tractors is 1.4% and 0.1% respectively (MINAGRI, 2010). Other forms of
mechanisation are limited to use for harvesting fodder for animal feeds. The sector also suffers from lack of
adequate rural infrastructure, insufficient agricultural markets and processing facilities, weak agricultural
research and extension services and very low levels of investment.
More specifically, the main challenges and constraints in common for producing and processing maize,
wheat and soybean include:
(i) very low volumes of Rwandan production compared to demand, so that processors are forced
to import large volumes of raw materials;
(ii) poor road infrastructure and high transport costs hamper the transportation of produce to
markets and reduce the profit made by producers;
(iii) small-scale farmers have limited experience of producing crops on a commercial scale and need
substantial training;
(iv) post-harvest losses, such as losses during transport, threshing and winnowing, rotting caused by
storage of moist grain; and
(v) lack of consistently available, reliable data on prices in major markets; hence producers and
cooperatives are not well informed at the time of sale. (MINAGRI, 2011).
G2231 A Focus on Rwanda Final_Layout 1 07/05/2014 09:34 Page 13

The main challenges and constraints for maize production and processing are:
i. Strong market demand for fresh maize – this makes it difficult to convince farmers to wait for the
harvest of the dry product, especially in high altitude areas where the period from sowing to harvest
is extremely long and drying of maize is difficult;
ii. Drought in eastern Rwanda, which seriously reduces maize production, with resulting impacts on
buyers, processors and farmers;
iii. Lower priced maize available from neighbouring countries - for example, the average monthly
price for maize from April to December 2012 was US$ 0.45 in Kigali Market, US$ 0.37 in Kampala
market and US$ 0.29 in Iringa market ,Tanzania, making it difficult for Rwandan maize to compete;
iv. Lack of trust between maize producer organisations and buyers;v. The long period from sowing to harvest - farmers in high altitude zones are discouraged from
growing maize;
vi. Under utilization of maize storage facilities - due to the lack of maize available on the local
market;
vii. Maize cooperatives and dealers do not have appropriate training on post-harvest handlingincluding storage management (MINAGRI, 2011).
The main challenges and constraints for wheat production and processing are:
i. The difficulty of drying wheat to the required moisture level (14%) in most production locations;
ii. The processing and storage facilities available for wheat cooperatives are largely small andbasic, leading to losses during milling;
iii. Most wheat cooperatives lack adequate drying and storage facilities as well as negotiation and
management skills;
iv. Poor relationships between wheat producers and millers discourage wheat production;
v. Production suffers once technical and financial assistance provided by NGOs and otherstakeholders to wheat cooperatives ends,
vi. The poor quality of final wheat and presence of impurities (such as stones and other foreignmatter) - due to use of manual threshing, winnowing and drying processes; and
vii. The MUSAMA variety of wheat that is most popular with farmers is seen as a problem as wheatmillers complain that this gives poor quality flour which is not suitable for bread (MINAGRI,
2011).
Trócaire EAC Trade Flow Analysis
14
G2231 A Focus on Rwanda Final_Layout 1 07/05/2014 09:34 Page 14

Section 2 Production and Processing of Maize, Soybeans and Wheat
15
The principal challenges and constraints for soybean production and processing include:
i. The lack of rhizobium, which must be used to protect the seed prior to sowing in order to facilitate
nitrogen fixation which ensures good crop growth and productivity;
ii. As soybean is not considered a priority crop within Rwanda’s crop regionalisation policy, it is not
likely that many farmers’ organisations or entrepreneurs will grow this crop, unless a large
commercial demand develops;
iii. There is limited availability of soybean seeds;
iv. The processing and storage facilities available to soybean growers are largely small and basic,
which leads to losses during milling;
v. There are poor linkages between extension services and soybean growers;
vi. Soybean is a rain fed crop which is vulnerable to drought. Given that irrigation facilities are still very
limited within Rwandan agriculture, this makes investment in soybean production risky;
vii. The number of consumers for soybean products is low, due to the fact that the Rwandan
population are not aware of its nutritional value; and
viii. The market value for soybean grain is low when compared to other crops (MINAGRI, 2011).
Stories of ChangeBeneficiary of Micro Credit
I am MUKAMANA Euphrasie and I am 47 years old. I live in
Karama, Huye District in the Southern Province. Before
RESEAU INTERDIOCESAIN DE MICROFINANCE (RIM) Ltd
started working in our area, my situation was dire. My
husband was in jail and my children and I were living in
great poverty. I would spend the whole day cultivating our
small plot of land in order to grow small amounts of beans
and maize to feed my family.
The amount I was producing was insufficient to meet our needs and I knew that I
needed to find a way to increase my income so that my family could survive and get an education.
That is when I went to RIM and asked for a loan of 30 000 Frws. Although I had no collateral, RIM
agreed to give me the loan. They believed in me and knew that although I was poor, I had good
ideas. I wanted to diversify and start to produce and sell the beer of sorghum and banana beer.
With the loan I received, I was able to do just that and very quickly my income increased. With my
increased income, I was able to pay my children’s school fees and ensure that they had enough to
eat each day.
I have continued to receive loans from RIM Ltd, which have helped me to purchase pigs and
cows, which have helped me to fertilize my fields to provide milk to my family. Now my family is
healthy, happy and free from extreme poverty. My neighbours have been surprised with how I
have turned around my situation. I am now very respected in the local community and have
recently been elected onto the Umudugudu Committee. RIM Ltd has helped me and my family to
achieve all of this and without it I would not have been able to make the progress that I have.
G2231 A Focus on Rwanda Final_Layout 1 07/05/2014 09:34 Page 15

16
Domitille Nyirabavakure (6) at her family home using a traditional wooden pestle and mortar to grind soybean grain.
G2231 A Focus on Rwanda Final_Layout 1 07/05/2014 09:34 Page 16

17
3. MARKET ANALYSIS FORMAIZE, SOYBEAN ANDWHEAT PRODUCTS3.1. INTRODUCTION
Within Rwanda, maize, soybean and wheat products are traded domestically as well as within EAC
community and other international markets. The following tables summarise the situation of domesticproduction and imports of maize, soybean and wheat grains for the 2005-2010 period and for imports of
wheat flour.
Table 7: Rwandan production and imports of wheat, maize and soybean grains (tonnes)
Product 2005 2006 2007 2008 2009 2010 % of internal demand in 2010
Production of maize 97251 91813 102000 167000 286946 432404 79%
Total imports of maize from EAC 468 29067 30938 3519 44459 0 0%
Total imports from EAC non-members 15917 9 14269 4272 8498 118064 21%
Total 113636 120889 147207 174791 339903 594927
Production of wheat 21942 19549 24633 67869 72479 77193 59%
Imports of wheat from EAC 0 1 1654 2644 3100 3100 2%
Imports of wheat EAC non-members 2372 5073 4084 4226 23064 50679 39%
Total 24314 24623 30371 74739 98643 130972
Production of soybean 23703 27138 39819 50931 54000 57089 97%
Imports from EAC 0 116 81 60 274 0 0%
Imports from EAC non-members 345 3 0 0 1201 1397 2%
Total 24048 27257 39900 50991 55475 58760
Source: Author on the basis of FAO agricultural trade statistics from 2005 to 2010 found on http://faostat.fao.org/site/537/default.aspx
G2231 A Focus on Rwanda Final_Layout 1 07/05/2014 09:34 Page 17

Rwanda also exports a small amount of maize flour, wheat flour, maize grain, wheat grain and soybean grain.
The following table summarises the situation of exports of these products.
Taking 2010 as the base year, leaving out the exports (as they are insignificant) and assuming a population of
10 million (in 2010), the estimated demand for maize, wheat and soybean grains for the 2011-2020
period would be as portrayed in Figure 4 below:
18
Trócaire EAC Trade Flow Analysis
Factory workers in Kigali, Rwanda, processing soya into SOSOMA products.
Table 8: Rwandan exports of wheat, maize and soybean grains and their derived products (tonnes)
2005 2006 2007 2008 2009 2010
Export of maize flour 0 0 0 2394 253 2512
Export of wheat flour 38 0 762 1234 67 133
Export of maize 5 552 1465 138 175 1633
Export of wheat 0 0 483 3296 0 0
Export of soybean 0 0 0 9 0 0
Source: Author on the basis of FAO agricultural trade statistics from 2005 to 2010 found on http://faostat.fao.org/site/537/default.aspx
G2231 A Focus on Rwanda Final_Layout 1 07/05/2014 09:34 Page 18

Section 3 Market Analysis for Maize, Soybean and Wheat Products
19
QUANTITY IN
TONNES
YEAR
0
100000
200000
300000
400000
500000
600000
700000
800000
2011 2012 2013 2014 2015 2016 2017 2018 2019 2020
Maize
Wheat
Soybean
Venuste Ndayisabye (49) displays maize grown and hung to dry by his community with support from Trócaire.
Figure 4: Forecasted Rwandan demand for maize, wheat and soybean grains 2011-2020.
Source: Author on the basis of FAO agricultural trade statistics from 2005 to 2010 found on http://faostat.fao.org/site/537/default.aspx
G2231 A Focus on Rwanda Final_Layout 1 07/05/2014 09:34 Page 19

The total intra-EAC trade and EAC imports of wheat, maize and soybean derived products is summarised in
the following table:
Trócaire EAC Trade Flow Analysis
20
Table 9: Situation of EAC production and imports of maize, wheat and soybean (tonnes)
Products 2005 2006 2007 2008 2009 2010 Total %
Production of maize within EAC 7439421 8136858 8067297 7473721 7442525 9890006 48449828 99%
Total intra-EAC trade 227411 494257 114506 248570 1534951 315642 2935337 6%
Total imports of maize from EAC non-members 34674 69169 132988 68551 68538 73213 447133 1%
Total 7474095 8206027 8200285 7542272 7511063 9963219 48896961
Production of wheat within EAC 516821 484749 456740 518051 412763 719721 3108845 23%
Total intra-EAC trade 19937 4381 10084 3635 6453 4193 48683 0.4%
Imports of wheat from EAC none-members 1446858 1684747 1819082 1270244 2065212 2309286 10595429 77%
Total 1963679 2169496 2275822 1788295 2477975 3029007 13704274
Production of soybean 189534 212215 223922 239274 242590 239789 1347324 97%
Total intra-EAC trade 332 1123 5796 6077 11139 15232 39699 3%
Imports of soybean from EAC none-members 5806 9188 4248 4200 12880 5888 42210 3%
Total 195340 221403 228170 243474 255470 245677 1389534
Source: Author on the basis of FAO agricultural trade statistics from 2005 to 2010 found on http://faostat.fao.org/site/537/default.aspx
Table 10: Total intra-EAC trade and EAC imports of wheat, maize and soybean derived products (tonnes)
2005 2006 2007 2008 2009 2010
Total intra-EAC trade of maize flour 4548 6075 2914 5102 2475 3849
Total imports of maize flour from EAC non-members 62731 25308 81264 52641 69292 46600
Total intra-EAC trade of wheat flour 24512 32112 31630 21543 10024 8474
Imports of wheat flour from EAC none-members 9793 9354 44315 29276 73901 95480
Total intra-EAC trade of soybean oil 272 582 40 211 690 205
Imports of soybean oil from EAC none-members 9547 7592 24647 22291 8092 19820
Source: Author on the basis of FAO agricultural trade statistics from 2005 to 2010 found on http://faostat.fao.org/site/537/default.aspx
The situation of maize, wheat and soybean grain production and trade at EAC community level issummarised in the following table:
G2231 A Focus on Rwanda Final_Layout 1 07/05/2014 09:34 Page 20

Section 3 Market Analysis for Maize, Soybean and Wheat Products
21
3.2. NATIONAL MARKETING OF MAIZE, SOYBEAN AND WHEAT PRODUCTS
3.2.1. Maize marketing
Local demand is not met by current levels of maize production within Rwanda. Hence the gap is filled
with imports from other countries - mainly from neighbouring EAC countries. According to Diao et al. (2010),
imports of maize account for at least 20% of domestic consumption.
Market for domestic maize production Marketing of domestic maize production involves four principal actors: individual farmers, farmers’
cooperatives, traders and agro processors:
• Individual farmers are the first link in the marketing chain. They generally sell during harvest and
rarely store any produce due to immediate cash needs. They usually sell small quantities and enjoy
little bargaining power. They have limited market information and as a result they are essentially
price-takers. They do not use weighing balances for selling their products; using the “Mironko”
basket instead. Transactions are either carried out on farms at household level or at local markets. At
the market, individual farmers interact with individual consumers and rural collectors (rural traders).
Individual farmers buy back maize later for use as seed and food.
• Farmers’ cooperatives - farmers who are members can sell their maize through their cooperatives.
The cooperatives collect the production of their members and negotiate prices with clients. Unlike
individual farmers, cooperative members are able to obtain market information and as they sell larger
quantities of maize as a group, they enjoy some bargaining power. These farmers also buy back
maize for food but the seed is usually provided by the cooperatives.
• Maize traders are composed of rural traders (sometimes referred to as rural collectors),travelling traders, wholesalers and retail traders. There are a large number of rural traders inrural markets and they play a vital role in collecting produce from farmers, given the fragmented
nature of production. They wait for farmers to sell maize at rural markets or on roads near rural
markets. They also move from farm to farm purchasing small quantities. Rural traders also use the
“Mironko” basket as a measure for the maize they buy and pay farmers in cash. Rural traders store
the produce they buy and wait to supply larger orders from travelling traders. They also retail maize
making a higher margin of profit. Some rural traders act on behalf of travelling traders. Travellingtraders purchase maize from either farmers and/or rural traders in weekly rural markets and then
weigh and pack the maize for urban markets, mainly the Nyabugogo wholesale market in Kigali.
Sometimes, travelling traders sell small quantities of maize in weekly rural markets. Most travelling
traders have good contacts with transporters. The tonnage of the trucks varies from 3.5 to 5 tonnes.
These trucks dominate transport from the supply areas to the important Nyabugogo wholesale
market in Kigali (USAID, 2009). The wholesalers mainly operate in Nyabugogo market, supplying the
Kigali urban area and providing a centre for maize supplies from within and outside of Rwanda. The
wholesalers play an important role in maize marketing as they maintain stocks and are able to sell
products onwards on demand. The retail traders are located in different urban markets throughout
Rwanda, distributing maize through retail markets, such as stalls or small retail shops.
• The agro-processors purchase the maize as a raw material for processing. The practice of selling
directly to agro-processors is less developed within Rwanda for many reasons. The largest volumes
of maize are sold in raw form, which implies that every farmer sells his own maize. Domesticproduction does not cover the demand from agro-processors. Household level grinding mills
compete with these big agro-processors (USAID, 2009).
G2231 A Focus on Rwanda Final_Layout 1 07/05/2014 09:34 Page 21

Marketing of imported maize
Nyabugogo market is the main wholesale market where imported maize is received. Large warehouses in this
market provide a centre for maize supplies from inside and outside the country. This market is home to dealerswho import into Rwanda and others who export to Uganda. Occasionally, traders deal with each other
directly and in a few cases, through middlemen, commissioners or brokers. The majority of imported grain is
intended for the Kigali City market as there is high demand there from processors. Small scale processors, mainly
in rural areas also process some maize, but usually source maize locally. Some dealers/processors in other areas
of the country also buy maize from Nyabugogo market. Purchases do not usually involve large quantities because
provincial dealers have limited capital. In general, purchases involve 5 - 10 tonnes per dealer (USAID, 2009).
Dealers in Musanze District, Northern Province import small quantities of maize from Uganda through the
border post of Cyanika and in Rubavu District, Western Province, dealers also import small quantities of
maize from the Democratic Republic of the Congo (DRC). The maize from DRC is a yellow corn which is used
to manufacture a yellow paste, which is popular with some consumers. Tanzania, albeit on a lower scale, also
supplies Rwanda with maize. Uganda dominates the import market for maize flour. Industrial processors also
import maize grains from outside of the country.
Marketing of maize flour
The largest volumes of maize flour are sold in Kigali City, with some smaller amounts sold in other provinces.
The flour is sold to independent traders, supermarkets, restaurants and independent retailers who in turn re-sell
to various buyers, such as prisons, secondary schools and NGOs (e.g. WFP, GIZ, World Vision and CRS). The
flour produced by household level grinding mills is mostly sold to local consumers due to its poor quality.
Trócaire EAC Trade Flow Analysis
22
Table 11: Main sources and quantities of Rwandan maize grains imports (tonnes)
Year Burundi RDC Italy Kenya Uganda Tanzania USA Total
2005 159 40 269 640 1108
2006 9 29067 29076
2007 44985 102 45087
2008 74 272 960 2213 3519
2009 870 1407 675 490 32925 10174 1001 47542
2010 94175 23890 118065
944 95591 24565 921 107977 12758 1641
Source: Author on the basis of FAO statistics for 2005-2010 period from http://faostat.fao.org/site/537/DesktopDefault.aspx?PageID=537
Table 12: Main sources and quantities of Rwandan maize flour imports (tonnes)
Year Italy Kenya Uganda Tanzania USA Total
2005 568 491 761 1820
2006 5097 5098
2007 15 2139 2170
2008 1 1564 370 1935
2009 1716 1 1875 2 2964 6634
Total 1716 585 11166 372 3725
Source: Author on the basis of FAO statistics for 2005-2009 period from http://faostat.fao.org/site/537/DesktopDefault.aspx?PageID=537
G2231 A Focus on Rwanda Final_Layout 1 07/05/2014 09:34 Page 22

Section 3 Market Analysis for Maize, Soybean and Wheat Products
23
3.2.2. Wheat marketing
Local demand is not satisfied by current wheat production, consequently, the gap is filled with imports
from other countries, mainly non-neighbouring countries such as Argentina, the United Arab Emirates and the
USA. According to Diao et al. (2010) imports of wheat (grain and flour) account for 20% of domestic
consumption.
Marketing of domestic wheat production
The main actors in the marketing of domestic wheat production are individual farmers, farmers’ cooperatives,
collectors, traders (semi-wholesalers, itinerant traders and retailers) and processors.
Individual farmers are the first link in the marketing chain. The first sale is made at the time of that the crop
is harvested. Farmers who belong to a cooperative may decide to sell through this structure. However, a lot of
sales are made outside of cooperative structures.
Farmers usually sell lower quality wheat, that is only suitable for manual processing, to traders operating in
rural markets. Some farmers also take their produce directly to dealers in the cities. If the quality of wheat is
better and suitable for agro-processing, the farmer would usually take the wheat to a cooperative that s/he
belongs to, which would sell the produce on to the mill.
Table 13: Main sources and quantities of Rwandan wheat grain imports (tonnes)
Year Argentina Canada Kenya Russian Uganda United Arab United USA TotalFederation Emirates Kingdom
2005 752 752
2006 1 1
2007 1644 10 766 2420
2008 1569 1020 1624 389 4602
2009 5743 3100 8270 5037 84 22234
2010 22206 28473 0 50679
Total 8064 22206 5764 28473 1635 8270 5037 1239
Source: Author on the basis of FAO statistics for 2005-2010 period found on http://faostat.fao.org/site/537/DesktopDefault.aspx?PageID=537
Table 14: Main sources and quantities of Rwandan wheat flour imports (tonnes)
Year Belgium Egypt Kenya Uganda Tanzania Total
2005 255 22 27 10256 12353 22913
2006 308 822 184 16872 12810 30996
2007 838 659 4 12381 18553 32435
2008 1074 81 2 13913 5050 20120
2009 925 770 116 1305 3034 6150
Total 3400 2354 333 54727 51800
Source: Author on the basis of FAO statistics for 2005-2009 period from http://faostat.fao.org/site/537/DesktopDefault.aspx?PageID=537
G2231 A Focus on Rwanda Final_Layout 1 07/05/2014 09:34 Page 23

Within cooperatives, the production of wheat is usually well organised and these cooperatives play an
important role in marketing the wheat produced by their members. However, the marketing role of the
cooperatives is often weakened because they lack the financial means to buy the wheat as it is harvested and
the necessary infrastructure to adequately dry and store the produce. In addition, they often lack
management and negotiation skills.
Collectors operate in rural areas and in markets in wheat-producing regions. These collectors make high
margins and the prices they offer to wheat producers are based on the bargaining power of each producer
and prices vary from producer to another.
Traders are also involved in wheat marketing. Wheat is often of less significance to them than other trade in
beans and sorghum but there are some traders who maintain a trade in wheat. Traders also find that
production quantities are very low.
The wholesalers involved in wheat marketing are few and buy from independent collectors and travelling
traders. Some collectors and travelling traders act on behalf of wholesalers. Wholesalers sell to retailers or
directly to consumers.
Wheat processors mainly buy wheat from cooperatives. They also buy wheat from traders. Purchases from
cooperatives are generally made via a written or verbal contract and the price is fixed after the harvest. The final
price agreed will take into consideration the cost of production and the prevailing market price. When processors
purchase from dealers, the final price agreed is the prevailing market price. Artisanal wheat flour from household
level grinding mills is mainly sold direct to consumers and to some dealers who resell the product. Due to the
poor quality of the artisanal wheat flour, only a minimal amount is sold to bakers. The processed wheat market is
almost entirely limited to buyers operating within the local environment of the wheat processing unit.
Marketing of imported wheat
Wheat is imported only in flour or grain form. The imported wheat grain is directly sold to processors. The
flour processed locally and imported flour are sold to independent traders who in turn re-sell to bakers,
supermarkets, restaurants and individual consumers mainly in Kigali City and other urban centres throughout
the country. Processors also sell directly to supermarkets. The wholesale market for wheat flour is located in
the main commercial area of Kigali City, in “Quartier Matheus”.
3.2.3. Soybean marketing
Local demand for soybean is not met by local production, therefore the gap is filled by imports from
other countries, mainly neighbouring nations.
Marketing of domestic soybean production
There are three main actors in the marketing of domestic soybean production in Rwanda. These are individual
farmers or farmers’ cooperatives, traders and agro-processors. Traders are composed of collectors,
wholesalers and retailers. Some wholesalers are also the retailers to urban markets. The collectors also retail
the soybean produce to local markets.
Individual farmers are the first link in the marketing chain. Soybean is either brought to local markets by
farmers or collected at the farm gate by collectors, who bring it to the local markets. Wholesalers purchase
soybean from collectors and farmers at these local markets and then take it to urban markets or to processing
units in urban areas, where the market is larger. As most of these farmers are in urgent need of money, they
often have no choice but to accept the low prices offered to them at harvest time.
Trócaire EAC Trade Flow Analysis
24
G2231 A Focus on Rwanda Final_Layout 1 07/05/2014 09:34 Page 24

Section 3 Market Analysis for Maize, Soybean and Wheat Products
25
Farmers’ cooperatives are also involved
in the marketing of soybean. These
cooperatives collect produce at harvest
from their members and negotiate a price
with big industrial companies. Their
produce is mainly sold to SOSOMAIndustries Ltd and other processingunits, which give a good price (prices
range from Frws 450 to 500 per kg) but
these companies are only interested in
high quality grains. Cooperative members
who sell their soybean through the
cooperative get access to larger markets
with a relatively good price. Preferences of
buyers vary according to different market
categories and intended end use of the
soybean grains.
Local soybean agro-processers get soybean from wholesalers and cooperatives. These units process the
soybean into various consumable products such as soya flour, composite flour made of soybean, maize and
sorghum, fortified flour, tofu and soymilk. These products are sold in urban areas as well as to individual
consumers living near the processing units. The sale passes through local traders who own shops and
supermarkets. They may also have their own shops in urban areas, which sell the products at retail level as
well as wholesale level.
Marketing of imported soybean
The majority of imported soybean is processed into soya flour, such as SOSOMA No. 1, SOSOMA No. 2,
fortified SOSOMA and other products. About 75% of soybean used by agro-processors is imported.
Processed soybean products are also imported from the EAC, mainly Kenya and Uganda. These importedproducts are of relatively good quality and are preferred by high end consumers. They are found in
supermarkets such as SIMBA and NAKUMATT in Kigali City.
3.3. REGIONAL AGRICULTURAL TRADE FLOWS FOR MAIZE, SOYBEANAND WHEAT PRODUCTS
3.3.1. Intra EAC flows for maize, soybean and wheat products
Three countries, Kenya, Tanzania and Uganda dominate trade flows for grains of maize, soybeans and
wheat, maize flour, wheat flour and soybean oil. In general, the EAC community has a negative tradebalance for these products. It is importing large quantities of these products from outside the EAC, mainly
from USA and Europe.
Triphonie Mukamutana (56) harvesting maize in Mpombori marshland, KamonyiDistrict, Southern Province, Rwanda.
G2231 A Focus on Rwanda Final_Layout 1 07/05/2014 09:34 Page 25

0
500000
1000000
1500000
2000000
Annual average Exports
Annual average Imports
Whe
at
Soybe
an o
il
Maiz
e
Flour
of W
heat
Flour
of m
aize
Soybe
ans
The EAC community is a net importer of wheat. The amount of wheat imported is triple the total EACproduction of wheat. The following figure depicts the situation of total EAC production and imports of wheat
Trócaire EAC Trade Flow Analysis
26
QUANTITY IN
TONNES
PRODUCTS
YEAR
0
500000
1000000
1500000
2000000
2500000
2005 2006 2007 2008 2009 2010
Total imports of wheat
Total production of wheat
QUANTITY IN
TONNES
Figure 5: EAC annual average of exports and imports of wheat, soybean oil, maize, wheat flour, maize flour
and soybeans (tonnes)
Source: Author on the basis of FAO agricultural trade statistics from 2005 to 2010 found on http://faostat.fao.org/site/537/default.aspx
Figure 6: EAC total imports and production of wheat
Source: Author on the basis of FAO agricultural trade statistics from 2005 to 2010 found on http://faostat.fao.org/site/537/default.aspx
G2231 A Focus on Rwanda Final_Layout 1 07/05/2014 09:34 Page 26

Section 3 Market Analysis for Maize, Soybean and Wheat Products
27
Kenyan trade in EAC
Kenyan trade statistics for 2005 - 2010 show that Kenya has a positive trade balance for wheat grain andsoybean oil, whilst it has a negative trade balance for maize grain, soybean grain, wheat flour andmaize flour. Kenya is importing large quantities of maize and soybean from Uganda. Kenyan imports of maize
from Uganda amounted to 58,374 tonnes for a value of 12,550,000 US$ in 2010. The Kenyan imports of
soybean from Uganda amounted to 14,870 tonnes for a value of 4,566,000 US$. Kenya also imports maize
from Tanzania. Kenya is exporting large quantities of soybean oil to Rwanda, amounting to 676 tonnes for
values of 959,000 US$ in 2010 and large quantities of wheat to Uganda.
Tanzanian trade in EAC
Tanzanian trade statistics for 2005 - 2010 show that Tanzania has a positive trade balance for all productsexcept for soybean oil. It is exporting large quantities of wheat flour to Rwanda, Kenya and Burundi and
large quantities of maize to Kenya. The total exports of wheat flour to Burundi, Kenya and Rwanda amounted
to 7,517 tonnes, 2,101 tonnes and 3,237 respectively, for a total value of 6,608,000 US$ in 2010. It is also
exporting moderate quantities of maize to Rwanda and Burundi. It is importing soybean oil from Kenya.
Ugandan trade in EAC
Ugandan trade statistics for 2005-2010 show that Uganda has a positive trade balance for all productsexcept wheat. It is exporting large quantities of maize to all other EAC members. Ugandan exports of maize
grain amounted to 17,763 tonnes, 71,559 tonnes, 2,555 tonnes and 11,298 tonnes respectively for Burundi,
Kenya, Rwanda and Tanzania in 2010 for a total value of 22,960,000 US$. It is also exporting large quantities
of maize flour amounting to 2,031 tonnes, 418 tonnes, 2,400 tonnes and 181 tonnes respectively for Burundi,
Kenya, Rwanda and Tanzania for a total value of 1,056,000US$ in 2010. Uganda exports large quantities of
soybean to Kenya and wheat flour to Rwanda and to Kenya. Uganda is regularly importing wheat from Kenya.
The wheat imports of Uganda from Kenya amounted to 2,551 tonnes in 2010 for a total value of
1,131,000US$.
Rwanda and Burundi trade in EAC
Rwanda and Burundi have a negative trade balance for all soybean, maize and wheat products for the2005-2010 period. Burundi exported only 196 tonnes of maize to Rwanda in 2008 and 29 tonnes of wheat in
2006. Burundi is almost exclusively importing from Uganda and Tanzania. Rwanda is exporting a limited
amount of maize flour, wheat flour and maize, mainly to Burundi. The case of Rwanda is further analysed in
the following section.
3.3.2. Rwanda in the context of EAC regional flows
As we have seen, Rwanda has a negative trade balance for maize, soybean, wheat, maize flour, wheatflour and soybean oil. Rwanda trades regularly with Uganda, Kenya and Tanzania, with a majority of imports
coming from Uganda as can be seen in Figure 7 below. Imports from Uganda consist mainly of maize flour,
wheat flour, maize and wheat. The majority of grain imports from Uganda are maize. Imports from Tanzania
consist mainly of maize and wheat flour, with the majority being wheat flour.
G2231 A Focus on Rwanda Final_Layout 1 07/05/2014 09:34 Page 27

0
5000
10000
15000
20000
25000
30000
35000
40000
45000
2005 2006 2007 2008 2009 2010
Maize
Flour of Wheat
Flour of Maize
Wheat
Soybean oil
Soybeans
Trócaire EAC Trade Flow Analysis
28
YEAR
QUANTITY IN
TONNES
Maize, maize flour and wheat are the three products which dominate in Rwandan imports from the EAC
community.
The total annual average of maize imports from the three countries (Uganda, Kenya and Tanzania) trading on
a regular basis with Rwanda is estimated at 20,276 tonnes (1,690 tonnes per month) for a value of 5,330,925US$ (444,243 US$ per month). The total annual average of imports of maize flour from these countries isestimated at 2,021 tonnes (168 tonnes per month) for a value of 461,752 US$ (38,479US$ per month).
Rwandan imports of maize from Uganda for 2009 and 2010 are estimated at 1,371 tonnes per month,
compared to 6,000 tonnes of maize per month from Uganda in 2008 (East Africa Food & Trade Bulletin, March
2008 (No. 48)). This decrease can be explained by the implementation of the CIP which has resulted in
an increase in maize production (IFDC, 2010), thus reducing imports from the EAC and other parts of the
world. Note that the majority of maize imported into Rwanda used to come from within the EAC, but now
more comes from countries outside the EAC.
Figure 7: Total Rwanda imports from the EAC community 2005-2010 (tonnes)
Source: Author on the basis of FAO agricultural trade statistics from 2005 to 2010 found on http://faostat.fao.org/site/537/default.aspx
Table 15 Estimated annual average of imports of maize grain and maize flour (tonnes)
Products Uganda Kenya Tanzania Annual total average
Maize 17,996 154 2,126 20,276
Flour of maize 1,861 98 62 2,021
Source: Author on the basis of FAO agricultural trade statistics from 2005 to 2010 found from http://faostat.fao.org/site/537/default.aspx
G2231 A Focus on Rwanda Final_Layout 1 07/05/2014 09:34 Page 28

Section 3 Market Analysis for Maize, Soybean and Wheat Products
29
Rwanda is exporting moderate quantities of maize to EAC members. The main destination of maize exported
from Rwanda is Burundi, followed by Uganda.
Woreya Kubwimana (3) and Maria Russie Iyatumyavuka (3) enjoy locally produced soya milk.
YEAR
0
50000
100000
150000
200000
250000
300000
350000
400000
450000
500000
2005 2006 2007 2008 2009 2010
Production of maize
Total imports of maize
Total imports outside EAC
Total importsof maizefrom EAC
QUANTITY IN
TONNES
Figure 8: Rwanda maize production and imports (tonnes)
Source: Author on the basis of FAO agricultural trade statistics from 2005 to 2010 found on http://faostat.fao.org/site/537/default.aspx
G2231 A Focus on Rwanda Final_Layout 1 07/05/2014 09:34 Page 29

0
500
1000
1500
2000
2500
3000
3500
Burundi Kenya Uganda Tanzania
Total export of maize
Annual average exportof maize
Wheat grain imports to Rwanda come mainly from Kenya and Uganda, while the majority of wheat flour
imported comes from Uganda and Tanzania. According to USAID (2009) Tanzania is supplying grade one flour,
which is intended for bakery use, while Uganda is supplying grade two flour, which is intended for the
manufacture of doughnuts.
The total annual average of imports of wheat grain from Uganda and Kenya, the only EAC country
members exporting wheat grain to Rwanda, is estimated at 1,234 tonnes (103 tonnes per month) for avalue of 678,630 US$ (5,655 US$ per month). The total annual average of imports of wheat flour from
Uganda, Kenya and Tanzania, the only EAC states members exporting the wheat flour to Rwanda, is atestimated at 17,810 tonnes (1,484 tonnes per month) for a value of 6,623,541US$ (551,961US$ per
month).
In contrast to the decrease in maize imports, total imports of wheat have increased, even if there has been
an increase in wheat production as a result of the CIP programme (IFDC, 2010). From 2008, the increase in
wheat imports is greater than the increase in production as can be seen in Figure 10. But wheat imports from
EAC to Rwanda have declined since 2009. The vast majority of imports of wheat now come fromoutside the EAC.
Trócaire EAC Trade Flow Analysis
30
QUANTITY IN
TONNES
COUNTRY
Figure 9: Rwanda maize exports 2005-2010 (tonnes)
Source: Author on the basis of FAO agricultural trade statistics from 2005 to 2010 found on http://faostat.fao.org/site/537/default.aspx
Table 16: Estimated annual average of imports of wheat grain and wheat flour (tonnes)
Products Uganda Kenya Tanzania Total annual average
Flour of wheat 9,121 56 8,633 17,810
Wheat grain 273 961 1,234
Source: Author’s calculations on the basis of FAO agricultural trade statistics from 2005 to 2010 found onhttp://faostat.fao.org/site/537/default.aspx
G2231 A Focus on Rwanda Final_Layout 1 07/05/2014 09:34 Page 30

Section 3 Market Analysis for Maize, Soybean and Wheat Products
31
Rwanda is mainly exporting wheat to Kenya (annual average of 615 tonnes of wheat). Also, according to
interviews with farmers in Nyamagabe District, Southern Province, UNICOOPAGI, Caritas Gikongoro and
dealers of wheat in Gasarenda Centre, Nyamagabe District, there is an informal trade in wheat between
Rwanda and Burundi, but it is difficult to estimate the volume of this trade. Rwanda also exports moderate
quantities of wheat flour to all other EAC States.
0
10000
20000
30000
40000
50000
60000
70000
80000
90000
2005 2006 2007 2008 2009 2010
Production of wheat
Total import of wheat
Imports of wheat outside EAC
Imports of wheat from EAC
QUANTITY IN
TONNES
YEAR
Figure 10: Rwanda wheat production and imports (tonnes)
Source: Author on the basis of FAO agricultural trade statistics from 2005 to 2010 found on http://faostat.fao.org/site/537/default.aspx
Farmers bring their produce to local markets such as this one in Huye District, Southern Province, Rwanda.
G2231 A Focus on Rwanda Final_Layout 1 07/05/2014 09:34 Page 31

As well as maize grain, maize flour, wheat grain and wheat flour, Rwanda is regularly importing soybeanoil from Kenya and soybean from Uganda. Imports of soybean oil from Kenya are estimated at 195 tonnes
per year (16.5 tonnes per month) at a value of 243,708 US$. Imports of soybean from Uganda are estimated
at 89 tonnes per year (7.5 tonnes per month) for a value of 12,667 US$.
3.4. MARKETING AND TRADE BARRIERS FOR MAIZE, SOYBEAN ANDWHEAT PROCESSED PRODUCTS
At the EAC level, the EAC programme for gradual elimination of internal tariffs, adopted in 2005, was
completed in January 2010. There are no longer any internal tariffs on intra-EAC trade (WTO Secretariat,
2012). However, non-tariff barriers (NTBs) remain a major impediment to the grains trade, the trade of
other products and business development in the EAC. NTBs affecting intra-EAC trade include technical
regulations that are not harmonised within the EAC, sanitary and phytosanitary requirements, customs
procedures and documentation, rules of origin and police road blocks (WTO Secretariat, 2012). There are
national monitoring committees (NMCs) in all EAC member States to monitor progress on the elimination of
NTBs. NMCs report quarterly to the EAC Sectoral Committee on Trade, Industry and Investment, which is
responsible for resolving outstanding NTBs. Issues that are not resolved at this level are referred to the EAC
council (WTO Secretariat, 2012). However, according to Kirk (2010) quoted by the WTO Secretariat (2012),
there has been very little progress in tackling NTBs. Hence, there is need to move beyond simply identifying
and discussing NTBs to implementation of regulatory reforms and reducing measures that restricttrade. A legally binding mechanism with sanctions for non-compliance would help to fully exploit economies
of scale related to economic integration.
Trócaire EAC Trade Flow Analysis
32
0
200
400
600
800
1000
1200
Burundi Kenya Uganda Tanzania
Total exports of wheat flour
Annual average exportof wheat flour
QUANTITY IN
TONNES
COUNTRY
Figure 11: Rwandan exports of wheat flour 2005 - 2010 (tonnes)
Source: Author on the basis of FAO agricultural trade statistics from 2005 to 2010 found on http://faostat.fao.org/site/537/default.aspx
G2231 A Focus on Rwanda Final_Layout 1 07/05/2014 09:34 Page 32

Section 3 Market Analysis for Maize, Soybean and Wheat Products
33
At the national level, in addition to technical barriers to trade such as standards and measurements, plus
sanitary and phytosanitary measures, the main marketing and trade constraints affecting the
commercialisation of soybean, maize and wheat products can be traced from the production and processing
phase to the market. In general, all factors affecting the production and processing of the soybean, wheat and
maize products have repercussions for the marketing of these products. The main factors affecting the
marketing of soybean, maize and wheat products (MINAGRI, 2011) can be summarised as follows:
• Traditional farming systems and artisanal processing of soybean, maize and wheat leads to lowproduction and a low quality of soybean, maize and wheat products, and consequently a low price
for final products;
• Poor road and market infrastructure increases the transaction costs for raw materials (maize,
soybean, and wheat grains);
• The high rate of informal commercialisation of maize, soybean, and wheat grains leads to low
prices which affect the formal trade of these products and, in turn, the production;
• The fragmented market for raw materials impacts on the functioning of large modern processors
and the quality of output;
• Low quality soybean, maize and wheat grains lead to low quality processed products, which are
unable to compete with imports;
• Very low volumes and poor quality of Rwandan production means that there is a need forprocessors to import large volumes of produce from other markets;
• Grains from neighbouring countries are more competitively priced and Rwandan grain
producers find it difficult to compete;
• For producers, there is a lack of consistently available, reliable data on prices in markets. As a
result, producers and cooperatives are not well informed at the time of sale and they receive low prices;
• The processing and storage facilities available to wheat cooperatives are largely small andrudimentary, leading to losses during milling;
• Insufficient access to finance and investment capital for farming, agri-processing and export
development; and
• Banks are reluctant to offer financial services to rural farmers due to low productivity and the
high vulnerability of the sector. They impose high interest rates, heavy collateral requirements and
inappropriate lending conditions, such as repayment schedules that are not linked to the agricultural
cycle.
3.5. MARKETING OPPORTUNITIES AND POSSIBLE SOLUTIONS TOOVERCOMING TRADE BARRIERS
There are ample marketing opportunities for maize, soybean and wheat products, both grains and processed
products. The EAC has a trade deficit for soybean, maize and wheat products. Furthermore, intra EAC tradeis much lower than trade between member States and other international markets. As non-tariffs
barriers are progressively eliminated, the EAC members’ products will gradually be better placed to compete
with imports from outside the EAC, thus providing an opportunity to increase intra EAC trade. Should this
trade increase, there will be a ready market for any increased production of maize, soybeans and wheat
within EAC member states.
Rwanda has a negative trade balance with respect to soybean, maize and wheat products. As it is not
producing the quantities in demand locally for maize, soybean and wheat (both grains and processed
products), there is an opportunity for Rwandan grain producers and processors to increase their production in
order to replace imports both from within and outside of the EAC.
G2231 A Focus on Rwanda Final_Layout 1 07/05/2014 09:34 Page 33

Rwandan grain producers are not currently meeting demand from processors and, as a result,
processors are required to import the majority of their grains from within and outside of the EAC. If Rwandan
grain producers can increase their production they have an opportunity to fulfil this unmet local demand from
processors. As Rwanda is a land locked country, importation costs make local processing competitive
economically.
In order to increase the competitiveness of raw and processed grains from Rwanda, the factors identified
above (under subtitle 3.3) which affect the production and marketing of grains and processed products should
be tackled. The following issues also need to be addressed:
• Increase the production of maize, soybean and wheat by increasing the area dedicated to
growing these crops and the use of improved good quality inputs and maximising yields;
• Conduct research on grain seeds, in order to find varieties suitable for Rwandan soil requirements
as well as consumer requirements in terms of quality;
• Increase the nutritional value of processed products from maize, soybean and wheat currently
found in the markets;
• Formalise the small scale processing of grains;
• Construct and improve rural roads and markets;
• Improve processing and post-harvest facilities, especially for wheat and soybean;
• Establish a market information system which provides grain producers with timely information on
market prices in the country;
• Increase producers’ awareness of the benefits of formal agricultural marketing;
• Offer guaranteed prices to farmers and ensure the sustainability of the market through, for
example, introducing purchase agreement contracts; and,
• Establish an insurance system which provides farmers with compensation for any losses incurred
due to natural calamities.
In addition, the EAC should proactively work to eliminate NTBs by implementing regulatory reforms and
reducing restrictive trade measures. This action should contribute to the competiveness of maize, wheat and
soybean grains and other products originating from member States.
Trócaire EAC Trade Flow Analysis
34
G2231 A Focus on Rwanda Final_Layout 1 07/05/2014 09:34 Page 34

35
Angelique Mukabyenda and her baby daughter Nadine. Angelique and her husband Venuste Ndayisabye joined the local farmers’ coop established by Trócairepartner DUHAMIC - ADRI. Angelique thinks their future is better and brighter because of the training and support they have received through the coop.
G2231 A Focus on Rwanda Final_Layout 1 07/05/2014 09:34 Page 35

4. ENABLINGENVIRONMENT FORAGRICULTURAL TRADE 4.1. RELEVANT NATIONAL POLICIES, INSTITUTIONS AND STRATEGIES
FOR TRADE IN MAIZE, SOYBEAN AND WHEAT PRODUCTS
In accordance with Vision 2020, Rwanda is transforming its agricultural sector from the current traditional
subsistence system into a “productive, high-value, market-oriented sector with forward linkages toother sectors”. Within this framework, the Government of Rwanda (GoR) has initiated policies, strategies
and programmes to promote the agricultural sector aiming at improving food security, income levels, and
productivity. Some of the policies and strategies adopted affect the production and trade of soybean, maize
and wheat crops. Relevant national policies are detailed below.
National Agricultural Policy (NAP)
The National Agricultural Policy was launched in 2004 with the objective of improving food security and thenutritional status of the population, and increasing the income levels of rural households. To achieve
these objectives, Rwanda adopted a strategy to transform agriculture into a modern, professionally operated
and market-oriented system. The Government is promoting professionalism, specialisation, innovation, and
public-private partnerships in the transformation process. The NAP identifies maize, wheat and soybean crops
amongst the crops for which production should be intensified (MINAGRI, 2004).
Economic Development and Poverty Reduction Strategy II (EDPRS2)
The EDPRS2 aims to boost the agriculture sector through the promotion of fertiliser and improvedseeds. In order to increase agricultural productivity, key interventions under the EDPRS framework include
increasing soil fertility, reducing soil erosion and improving land use, land management and land
administration. Farmers should receive intensive training on the optimal use of external inputs including
improved seeds and inorganic fertilisers (MINECOFIN, 2007). The EDPRS2 includes the crop regionalisationstrategy which is the basis for agronomic research and government agricultural policy planning. The
crop regionalisation strategy divides the country into in agro-climatic regions and identifies priority crops for
increased production within each region. Thus, for Burera, Nyabihu, Musanze, Nyamagabe and Gicumbi
Districts, wheat production is the priority. Musanze, Nyabihu and Nyamagabe Districts should also prioritise
development of wheat agro-processing units. For Ruhango, Gatsibo, Rutsiro, Nyabihu and Ngororero Districts,
maize should be the priority, with development of maize agro-processing units in Gatsibo and Nyabihu
Districts (Republic of Rwanda, 2013).
Rwanda Agriculture Board (RAB)
RAB’s mission is to develop agriculture and animal husbandry through reforming crop and animal production
and promoting research, agricultural extension, education and training of farmers in new technologies. The
main goals of RAB are:
(i) to provide farmers and consumers of agricultural products with information, techniques andservices so that they can supply the domestic market with higher quality produce and thereby raise
incomes from agriculture and animal husbandry;
36
G2231 A Focus on Rwanda Final_Layout 1 07/05/2014 09:34 Page 36

37
Section 4 Enabling Environment For Agricultural Trade
(ii) to work closely with other institutions in charge of standards and environmental issues to import
fertilisers, crop protection products and other agricultural and animal husbandry inputs;
(iii) to contribute to establishing, publicizing and enforcing laws and regulations governingagriculture, animal husbandry, research as well as related products;
(iv) to promote and monitor activities to produce, market and regulate improved seed varieties; and,
(v) to support agricultural and animal husbandry cooperatives to deliver improved services.
In particular, RAB maintains good links, through the Institute des Science Agronomiques du Rwanda (ISAR),
with the International Maize and Wheat Improvement Center (CIMMYT) from where new germplasm is
sourced to enrich local agro biodiversity. RAB is also conducting research on the development of improved
varieties for wheat and maize crops.
Rwanda Grain and Cereal Council (RGCC)
The Rwanda Grain and Cereals Council (RGCC) aims to address the challenges that restrict trading ingrain and cereals by establishing structured grain and cereals trading systems to improve organisation of
national trade practices and to promote approaches to trade that help farmers, suppliers, traders and
processors to transform their business. Currently the RGCC is focussing on maize trade organisation.
Crop Intensification Programme (CIP)
The Crop Intensification Programme began in 2007 and seeks to improve farm productivity through theuse of fertilisers, improved seeds and extension services. The CIP, through its land consolidation
programme, encourages farmers with adjacent land to grow the same crop, so as to take advantage of the
economies of scale to increase the net income from land holdings by increasing the volume of production
while reducing costs. The land use consolidation programme is providing small scale famers with the
efficiency of access to fertiliser through voucher schemes, access to extension services; increased
opportunity for credit access, increased marketing power, etc. (MINAGRI, 2012). The CIP provides subsidised
fertilisers and improved seeds for crops such as maize, wheat, soybean, Irish potatoes and cassava cuttings.
It also offers training to agronomists and facilitates the storage of produce at village level to prevent waste.
4.2. RELEVANT EAC POLICIES, INSTITUTIONS AND STRATEGIES FORTRADE IN MAIZE, SOYBEAN AND WHEAT PRODUCTS
The East African Community (EAC)
The EAC progressively puts in place policies and measures facilitating trade between its memberStates. The EAC Common Market Protocol, signed in November 2009, became effective in July 2010. The
protocol provides various rights and freedoms including the right to the free movement of goods, capital,services, and labour. Therefore, the maize, soybean and wheat trade benefits from the Common Market
Protocol. In addition, the EAC standards committee and EAC member State standards bureaus are working to
harmonise staple food product categories for maize and wheat grains and derived products, in order to
improve the environment for cross border trade in these commodities.
G2231 A Focus on Rwanda Final_Layout 1 07/05/2014 09:34 Page 37

The Eastern African Grain Council (EAGC- RATIN)
Eastern African Grain Council-Regional Agricultural Trade Intelligence (EAGC-RATIN) was founded in 2006 tocoordinate matters concerning the grain industry on a regional level. It aims to improve the policy and
trade environment in the grain sector. The EAGC-RATIN represents actors at all stages along the grainvalue chain, including grain farmers, traders, the milling industry, service providers and national associations
(Pannhausen and Untied, 2010). The work of the EAGC-RATIN thus covers trade in maize and wheat. More
specifically, the EAGC is concerned with:
(i) the promotion of a well-functioning regional grain supply chain, focusing on trade issues
affecting all sectors of the chain, and building a platform for reducing constraints in regional grain
trade;
(ii) building cooperation, interaction, partnerships, alliances, networks and market linkages;
(iii) collecting market data, generating information exchange and sharing regional expertise;
(iv) promoting investment in structured marketing systems, including warehouse receipts and
commodity exchanges;
(v) acting as main certification authority in structured systems, and providing commercial services
as needed;
(vi) recognising and supporting accepted principles of international codes of corporate conduct;
(vii) facilitating awareness of new technologies; and,
(vii) representing the regional membership at national, regional and international forums, and leading
advocacy and lobbying actions, to promote the best interests of Council members (Pannhausen and
Untied, 2010).
Trócaire EAC Trade Flow Analysis
38
Farmers return home after a long day’s work on communal farmland.
G2231 A Focus on Rwanda Final_Layout 1 07/05/2014 09:34 Page 38

Section 4 Enabling Environment For Agricultural Trade
39
East African Famers Federation (EAFF)
The EAFF addresses three main issues which will benefit farmers involved in maize, soybean and wheat
value chains:
(i) Regional integration – this includes educating farmers on the benefits of regional integration and
easing substantially or completely removing nontariff barriers to trade, especially harmonising
sanitary and phytosanitary regulations. The EAFF also supports the harmonisation of monetary
policies and the promotion of peace to create the necessary framework for regional integration.
(ii) Value addition – this includes raising farmers’ awareness of the benefits of value addition andcarrying out research in this field. The EAFF also aims to create manageable lending policies to
improve small-scale farmers’ access to medium and long-term lending opportunities. The EAFF
strives to protect the interests of small-scale farmers – for example, by addressing the problem of
products from abroad being dumped in EAC countries.
(iii) Infrastructure – the EAFF lobbies for the improvement of infrastructure such as roads and therailway network, reduction of telecommunication costs and investment in irrigation andpost-harvest facilities (Pannhausen and Untied, 2010).
4.3. RECOMMENDATIONS FOR POLICIES, INSTITUTIONS ANDSTRATEGIES
In order to improve the trade in grains (maize, soybeans and wheat) and grain-based processed products
within EAC and Rwanda, the following measures should be taken at an institutional level:
• Non-tariff barriers should be eliminated by implementing regulatory reforms and reducing
restrictive trade measures.
• Spending on research and development should be increased, with a focus on improving seed
varieties in order to increase the quantity and quality of production. This should support farmers gain
access to higher value markets.
• Use of organic fertilisers should be promoted in combination with inorganic fertilisers, inorder to support the sustainability of land use and viability of agricultural value chain development
over the longer term. Also, there should be precise recommendations on fertiliser application rates
for crops in different Rwandan agricultural regions.
• Financial institutions should adjust the repayment of credit offered to farmers to reflect the
seasonality of production and to enable them to make repayments after crop harvest.
• There should be a clear link between processors and farmers so that they are well informed about
the quantity and quality of grains required and grain prices. This should reduce informal trading of
grains and raise farmers’ income.
• Farmers cooperatives should, where possible, hold shares in processing units in order to increase
their members’ income.
• Rwandan farmers’ cooperatives should increase their collaboration with institutions dealing withgrain production and trade at the EAC level.
G2231 A Focus on Rwanda Final_Layout 1 07/05/2014 09:34 Page 39

5. CONCLUSIONS ANDRECOMMENDATIONSThis study provides information on trade patterns, trends and market dynamics and competitiveness for
maize, soybean and wheat products at national and regional (EAC) levels. In particular, this study analyses
the agricultural trade flows for maize, soybeans and wheat at national (Rwanda) and regional (EAC)levels, with a focus on opportunities and threats for a competitive market for raw and processed products
originating from Rwanda. It identifies and analyses the enabling environment, including regulations, policies,
strategies and institutions that govern production, processing and trade flows of maize, wheat and soybean
grains and processed products. It also identifies opportunities for policy and strategic reforms as well as
necessary measures to facilitate those reforms.
After reviewing information available on maize, soybean and wheat production chains and interviewing key
stakeholders such as Trócaire partners, farmers, traders, researchers and agronomists, a statistical analysis of
the data collected was conducted. The main findings of the study are as follows:
• Most small scale farmers do not sell their produce in national or regional grain markets.
Instead, they sell the majority of their grains to rural traders who usually offer prices well below the
prevailing market rate;
• At a farmer level, the market is working against individual farmers who are vulnerable to pricefluctuations and usually sell their grains at low prices. As they have a stronger negotiation
position with buyers, farmers who are members of cooperatives benefit from relatively betterprices than individual farmers;
• Domestic production of grains is low and not sufficient to meet market demand withinRwanda. Grain produced often fails to meet quality requirements. As a result, processors are required
to import grains in a raw form from inside and outside the EAC. Imports of maize and wheat grain are
estimated to be roughly 20% of domestic consumption, with maize and soya grains coming mainly
from Kenya, Tanzania and Uganda and wheat from non-EAC countries. Grain-based processed products
(maize flour, wheat flour and soybean oil) are also imported from inside and outside the EAC.
• Grain processors in Rwanda are working well below their capacity. Only 30% of grainprocessed in Rwanda is of domestic origin. Overall, there is a negative trade balance for wheat,
maize and soybean grains within the EAC, as well as for derived products such as maize and wheat
flour and soybean oil. Therefore, there is an opportunity for Rwandan producers and processorsto grow their share of the local market and to export to EAC markets;
• There is a favourable environment for the trade of maize, wheat, soybean products at anational and EAC level. The Government of Rwanda has a taken a number of measures which
promote the production, processing and trade of wheat, maize and soybean products, including
drafting of national policies for agriculture, trade and investment; the formation of national institutions
such as the Rwanda Agricultural Board (RAB) and Rwanda Grain and Cereal Council (RGCC); the
development of specific strategies and programmes such as the Economic Development and Poverty
Reduction Strategy II (EDPRS II) and Crop Intensification Programme (CIP). At the EAC level, since
2010, all internal tariffs have been removed and the remaining non-tariff barriers (such as non-
harmonized technical regulations, sanitary and phytosanitary requirements, customs procedures and
documentation, rules of origin, and police road blocks) are currently being reviewed. Also at EAC
level, institutions have been established which promote regional trade of wheat, soybean and maize
products such as the Eastern Africa Farmers Federation (EAFF) and the Eastern African Grain Council-
Regional Agricultural Trade Intelligence (EAGC-RATIN).
40
G2231 A Focus on Rwanda Final_Layout 1 07/05/2014 09:34 Page 40

41
One of the key findings of the research is that grain markets are working against the interests ofindividual farmers and, to a lesser extent, farmers’ cooperatives. Both these groups have poor
negotiating positions, which mean that they are forced to accept prices well below the prevailing market rate.
In order to address this issue, the study urges Trócaire and stakeholders within the maize, soybean andgrain markets, such as small farmers, local and international NGOs, commercial organisations, donors, local
and national government organisations and other development partners to work together to ensure the
following measures are undertaken to improve the functioning of primary markets:
1. Establish a market information system, which grain producers can easily access to help them
obtain timely information from major markets within the country;
2. Increase producers’ awareness of the benefits of formal agricultural marketing to ensure thesustainability of the market, for example, through introducing price guarantees and purchase
agreement contracts;
3. Establish an insurance system, which provides farmers with compensation for any losses incurred
in case of natural disasters affecting crop production;
4. Ensure the provision of increased funding for the construction and improvement of rural roads andmarkets;
5. Provide support to enable farmers and cooperatives to improve the processing and post-harvestfacilities for wheat and soybean in particular;
6. Provide training for cooperatives in management and price negotiation, particularly those
involved in wheat.
More broadly, in order to contribute to the development of maize, wheat and soybean markets, Trócaire andstakeholders should put an emphasis on activities aimed at improving the production and processing ofgrains. Such activities include:
• Promoting the use of improved good quality inputs.
• Conducting research on seeds, in order to find varieties that are high yielding and suitable for local
soils. Use of the Musama seed variety should be reviewed in order to find a compromise between its
suitability for Rwandan soil conditions and the quality of flour yielded. For maize, whilst a choice of
varieties is needed, each plantation should plant a single variety in order to avoid mixing different
colour grains before processing.
• Promoting production processes that increase the nutritional value of processed products.
• Developing models for the integration of small-scale production and processing stages which include
options for farmers’ cooperatives to buy shares in industrial processing.
The survey has found that the EAC trade environment is conducive to the expansion of maize, soybeanand wheat products. This is due to the removal of tariffs within the EAC area and the establishment of
institutions which promote regional trade in maize, soybean and wheat products. However, there are still non-
tariff trade barriers (NTBs) such as technical regulations and sanitary and phytosanitary requirements which
are not harmonised within the region and still inhibit trade within the area. In order to further promote EAC
trade, Trócaire and other stakeholders should put pressure on EAC members to:
• Move beyond simply identifying and discussing NTBs to implementing regulatory reforms andreducing measures that restrict trade. A legally binding mechanism with sanctions for
noncompliance would help to fully exploit economies of scale related to economic integration.
Conclusion
G2231 A Focus on Rwanda Final_Layout 1 07/05/2014 09:34 Page 41

REFERENCESCantore, N. (2010). The Crop Intensification Programme in Rwanda: a sustainability analysis; Overseas
Development Institute Investment and Growth Programme, 111 Westminster Bridge Road, London, SE1 7JD.
Diao, X., Fan, S., Kanyarukiga, S. and Yu, B. (2010). Agricultural Growth and Investment Options for
Poverty Reduction in Rwanda, IFPRI Research Paper.
EAC Secretariat (2006). Agriculture and rural development for the EAC, Arusha.
EAC Secretariat (2006). EAC Agriculture and Rural Development Strategy of 2005-2030 (EAC-ARDS), Arusha.
IFDC (2010). Crop Intensification Programme (2008-2009), Evaluation Report; Catalyze Accelerated
Agricultural Intensification for Social and Environmental Stability (CATALIST) Project in Central Africa’s Great
Lakes Region, Kigali.
IMF (2011). Rwanda: Poverty Reduction Strategy Paper—Progress Report, Washington D.C.
MINAGRI (2013). Agricultural Mechanization Strategy for Rwanda, Enabling mechanization environment for
the private sector, Kigali.
MINAGRI (2012). Farm Land use Consolidation in Rwanda, Assessment from the perspectives of agriculture
sector, Kigali.
MINAGRI (2011). National Post-Harvest Staple Crop Strategy, Kigali.
MINAGRI (2010). Agricultural Mechanization Strategies for Rwanda, Shifting from Subsistence Agriculture to
Market-oriented Agriculture, Kigali, 49p.
MINAGRI (2004). Plan Stratégique pour la Transformation de l’Agriculture au Rwanda. Kigali, Rwanda.
MINECOFIN (2000). Rwanda Vision 2020. Kigali.
MINECOFIN (2007). Economic Development & Poverty Reduction Strategy 2008-2012. Kigali.
MINECOFIN (2007). Economic Development and Poverty Reduction Strategy (EDPRS) 2008-2012.
Mujawamariya, M. (2012). Identification of Potential Niches for Soybean cultivation in Farming systems of
Eastern and Southern Rwanda, MSc thesis Plant Production Systems, Wageningen University.
NISR (2011). Statistical year book, 2011 edition, Kigali, 204p.
Pannhausen, C. and Untied, B. (2010). Regional Agricultural Trade in East Africa. A focus on Kenya, Tanzaniaand Uganda, Eschborn.
RADA (2008). Agenda Agricole 2008-2009, Kigali.
Republic of Rwanda (2013). EDPRS 2, Kigali.
USAID (2009). Staple foods value Chain analysis, USAID Rwanda country report.
WTO Secretariat (2012). EAC trade policy review, Geneva.
Website: www.fao.org www.bnr.gov.rw
42
G2231 A Focus on Rwanda Final_Layout 1 07/05/2014 09:34 Page 42