RAILROAD COMMISSION OF TEXAS Statewide Rule 10 : Downhole Commingling Darren Tjepkema.

Peanuts in Wheat Flour:A Lesson for Agricultural Commingling
Joe Baumert, Ph.D.Associate Professor and Co-Director
Department of Food Science & Technology Food Allergy Research & Resource Program
University of Nebraska
Canadian National Millers AssocationWinnipeg Canada
September 13, 2016

Outline A brief primer on food allergies Should we have really been surprised? Was peanut in
wheat flour really unexpected?Our experiences with agricultural commingling and allergens
Peanut in wheat flour – the story
The ongoing U.S. regulatory response
© 2016

Outline A brief primer on food allergies Should we have really been surprised? Was peanut in
wheat flour really unexpected?Our experiences with agricultural commingling and allergens
Peanut in wheat flour – the story
The ongoing U.S. regulatory response
© 2016

Why Should Millers Be Concerned About Food Allergies?
© 2016

Why Should Food Allergies & Sensitivities be a Priority Concern for Millers?
Allergic consumers expect it (very aware; highexpectations)
Estimated 10-14 million U.S. consumers have food allergy;similar prevalence in Canada
Reactions can occasionally be quite severe, even fatal Reactions happen immediately after ingestion Threshold dose for provoking a reaction is quite low Avoidance is the only strategy for reaction prevention Allergic consumers are diligent label readers
© 2016

The Risks of Uncontrolled Allergens
Regulatory risk – undeclared allergens can lead to product recalls, FDA audits, etc.
Business risk - loss of customers, law suits, failed audits(SQF, etc.), cost of product recalls, loss of consumer confidence, loss of retail space for products with your ingredients, allergen control/sanitation, down time, etc.
Health risk – undeclared allergens can cause consumers to have reactions (some of which can besevere and even fatal!)
© 2016

U.S. FDA Food Allergen Recall IncidentsCalendar Years: 1988-2016
0
50
100
150
200
250
300
350
'88 '90 '92 '94 '96 '98 '00 '02 '04 '06 '08 '10 '12 '14 '16
* Includes FDA recalls & alerts
*
*
*
*
*
© 2016
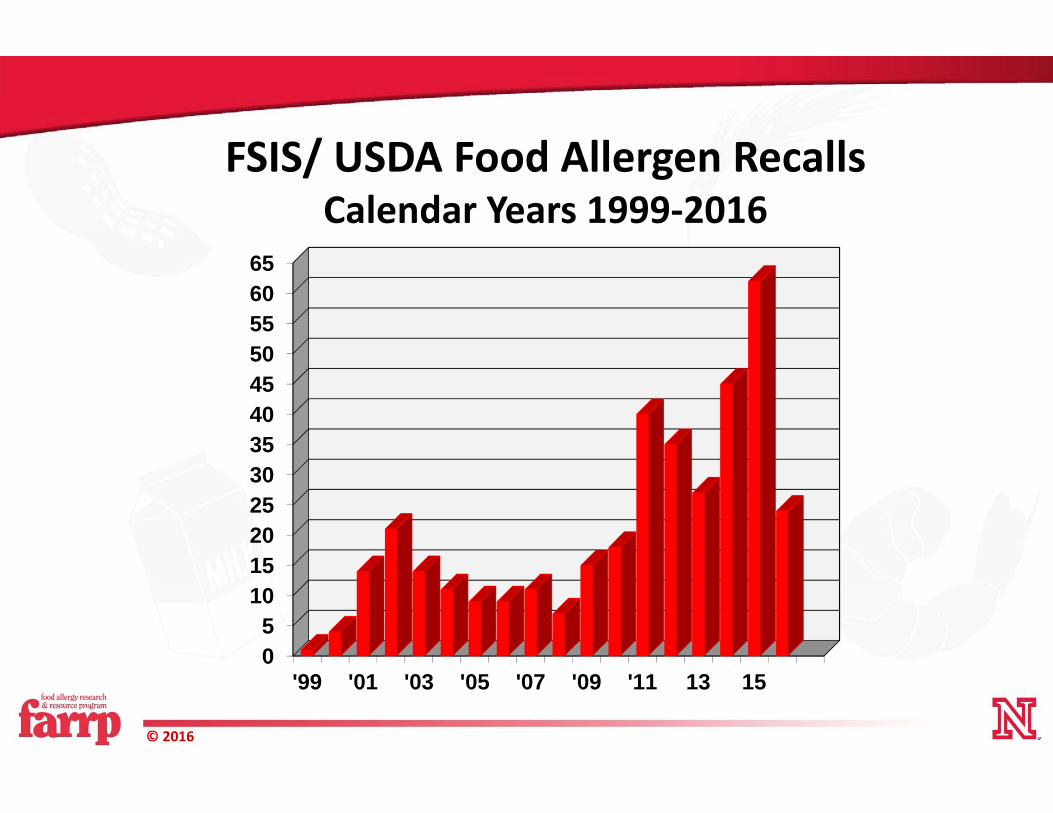
FSIS/ USDA Food Allergen RecallsCalendar Years 1999‐2016
05
101520253035404550556065
'99 '01 '03 '05 '07 '09 '11 13 15
© 2016

Canadian Food Inspection Agency:Food Allergen Recalls
Calendar Years 1999‐2016
0255075
100125150175200225250275300325
97 '99 '01 '03 '05 '07 '09 '11 13 15
© 2016

Typical Symptoms of IgE-Mediated Reactions
Skin:• Urticaria (hives)• Eczema (rash)• Angioedema (swelling)• Puritis (itching)GI Tract:• Nausea• Vomiting• Abdominal pain• Diarrhea
Respiratory:• Asthma• Rhinitis (runny nose)• Laryngeal edema (swelling
of the throat)Cardiovascular:• Hypotension (low blood
pressure)Multiple Organ Systems:• Anaphylaxis or
Anaphylactic shock
© 2016

Exquisite Sensitivity of SomeFood-Allergic Individuals
• Trace amounts of the offending food will trigger reactions
© 2016

How Much is Too Much?
Milligram amounts!(ppm concentrations)
© 2016

Dose of Peanuts Causing Reactions in Peanut-Allergic Individuals
Ballmer‐Weber and Hourihane
Lowest Eliciting Dose in mg whole peanut (mg peanut protein)(0.05 mg) (0.1 mg) (0.25 mg) (1.25 mg) (6.25 mg) (25 mg) (100 mg)
Percent of Peanut‐Allergic Population That Would React To Dose0.3% 1% 4.25% 14% 30% 50%
© 2016

Peanut Threshold Population Distribution(expressed as mg peanut protein)
Cum
ulat
ive
Perc
enta
ge o
f Res
pons
es
0%
10%
20%
30%
40%
50%
60%
70%
80%
90%
100%
Cumulative Dose of Protein (mg)
1.00E-03 1.00E-02 1.00E-01 1.00E+00 1.00E+01 1.00E+02 1.00E+03 1.00E+04 1.00E+05 1.00E+06
Log-Normal Log-Logistic Weibull
© 2016

Number of Available Threshold Data Points
Image Courtesy of Dr. Ben Remington, TNO
© 2016

Dose Distributions for Various Food Allergens:Not all food allergens are created equal
© 2016

Outline A brief primer on food allergies Should we have really been surprised? Was peanut in
wheat flour really unexpected?Our experiences with agricultural commingling and allergens
Peanut in wheat flour – the story
The ongoing U.S. regulatory response
© 2016

Unexpected Sources of Gluten Mixed grains and other commodity crops Gluten-free oats Fermented ingredients: enzymes, bacterial
cultures, etc. Yeast Whey protein concentrate Flavors Products made in shared frying oil Bacon!! Tea!!!! Spices especially from international sources
– Cumin© 2016

Unexpected Sources of Peanut Pickle relish Honey Baby carrots Chocolate liquor Herbal tea bags Mosquito coils – is inhaling smoke dangerous? Lawn aeration treatments Foam insulation for buildings Gum Arabic (gum acacia) Spices
– Cumin (ground and whole seed)– Garlic powder
© 2016

Commodity Commingling Common Examples
Wheat in oats Soy in wheat Soy in corn Wheat in millet Wheat in sorghum Peanut in wheat Many others
© 2016

Commodity Commingling Sources
Grown on the same farms Harvested at the same time of year Harvested with shared equipment Transported in the same trucks Stored at the same grain elevators Shipped in the same rail cars Impossible to separate
© 2016

Outline A brief primer on food allergies Should we have really been surprised? Was peanut in
wheat flour really unexpected?Our experiences with agricultural commingling and allergens
Peanut in wheat flour – the story
The ongoing U.S. regulatory response
© 2016

The Peanut in Wheat Flour Story in North America

Initial Peanut in Wheat Flour Situation March 2016 – A restaurant chain decides that they
want to sell peanut/nut-free cookies in their outlets; ask bakery supplier to produce the cookies
Bakery makes the cookies and sends for analysis; unexpectedly low ppm levels of peanut are found
Bakery has retains of ingredients and finds peanut residues in wheat flour
Wheat flour from a milling facility in Georgia
© 2016

Peanut in Wheat Flour – Recalls Begin Bakery informs miller of situation
Bakery tests other bakery products and find peanut residues in several products
Bakery files RFR report with FDA
Results in several recalls of products made by bakery but distributed by other companies – i.e restaurant chains and retail companies.
© 2016

Peanut in Wheat Flour – The Mill Mill uses mixture of Georgia soft wheat and northern
hard red spring wheat
Mill has a limited number of retain flour samples from dates involved in bakery products (basically months of March/April)
Mill had shipped flour to numerous bakeries during the fateful month, mostly by truck
Over half of mill retain samples contain detectable peanut at levels up to ~25 ppm peanut
© 2016

Peanut in Wheat Flour – The Mill FDA visits mill takes limited number of samples and
finds similar low levels of peanut in some of these samples
Even though allergy risk appears to be low, FDA proposes that mill should do Class II recall of the flour from March/April
Mill proceeds with Class II recall and notifies all customers who received wheat flour during the critical period; customers advised to test finished products and consult with FDA
© 2016

Peanut in Wheat Flour – 2nd Wave Various companies test finished products; most find low
levels of peanut but some samples contain higher levels
Only one company has sufficient data to track the mill’s flour by date and truck load and they find detectable peanut only in certain loads from certain dates
Quantitative risk assessments done by FARRP reveal low risk but near 1% due to high levels of wheat flour incorporated into certain products
© 2016

Peanut in Wheat Flour – 2nd Wave Risk Ex. 1: cookies
– Assume 25 ppm peanut (6.25 ppm peanut protein) in wheat flour
– 35-70% wheat flour in cookie formulations Assume 50% = 3.1 ppm peanut protein in cookie
– Average consumption = 30g
30g x 3.1 ppm peanut protein in cookie = 0.09 mg peanut protein
ED01 = 0.2 mg peanut protein
© 2016

Peanut in Wheat Flour – 2nd Wave Risk Ex. 2: pretzels
– Assume 25 ppm peanut (6.25 ppm peanut protein) in wheat flour
– 90% wheat flour in pretzel formulations = 5.6 mg peanut protein
– Average consumption = 30g
30g x 5.6 ppm peanut protein in pretzel = 0.2 mg peanut protein
ED01 = 0.2 mg peanut protein
© 2016

Peanut in Wheat Flour – 2nd Wave One company receives 2 alleged consumer complaints
about donuts from affected lot but other companies have no complaints
Despite low risk and existence of USDA Grain Standards, FDA prompts Class I recalls for undeclared peanut in numerous products from multiple companies – cookies, pretzels, crackers, etc.
© 2016

Peanut in Wheat Flour – 3rd Wave? So far, FDA has made no effort to expand this
investigation to other lots from the Mill, other flour mills, or other flour-containing products; seem to be considering it as an isolated event
But in reality, it is likely not isolated Milling industry has been observed occasional peanuts
in cleaning house Root cause remains unknown But, affected baking companies have low tolerance for
recalls and are beginning to test flour
© 2016

Past Examples of Potential Business Risk Major restaurant chain tried to source soy-free
breading for fried items (unsuccessful) Major retail grocery chain wanted to declare presence
of soy in wheat-derived bakery products (FARRP talked them out of the idea)
Food company investigating allergen control changeover found even higher risk from commodity contamination of soy in wheat
Major restaurant chain tried to make peanut-free cookies (the recent recall)
© 2016

Past Examples of Potential Business Risk CFIA conducted random allergen testing of wheat-based
products and found undeclared soy; several recalls sought; at least one was conducted; source of soy residue was clearly commodity contamination
Irish Food Safety Authority tested wheat- and corn-based imported products for soy residues and found presence of undeclared soy; no recalls but posted notices on their public web site
FSAI has asked EFSA to investigate threshold levels and desirability of action levels; EFSA agrees (2012)
FDA supports recalls for wheat flour-based products containing low levels of peanut despite knowledge that it is commodity comingling
© 2016

Food Allergies and Commodities
Does any real risk exist?
Quantitative risk assessment can now be used to evaluate magnitude of risk
QRA not yet fully supported by FDA or CFIA
© 2016

Development of Risk Assessment Approaches for Food Allergens
2007 workshop on risk assessment approaches – EuroPrevall, ILSI-EU and UK FSA1. Safety Assessment Approach2. Benchmark Dose (BMD) and Margin of Exposure
(MoE) Approach3. Probabilistic Approach
Workshop concluded that the BMD/MoE and probabilistic approaches had the most merit– Rely upon low-dose extrapolation from dose-
distributions of clinical thresholds rather than a single point estimate
© 2016

Risk Assessment a function of the exposure dose (mg of protein from the
allergenic source) compared to the threshold dose (mg of protein from the allergenic source)
Quantitative risk assessment can evaluate the risk on an individual or population basis
Exposure Dose < Threshold Dose = no predicted reaction
Exposure Dose ≥ Threshold Dose = a predicted reaction
© 2016

Input Parameters:
Clinical threshold data from low-dose food challenges– *Note: data from food-allergic individuals rather than
extrapolation from animal models as in classical toxicological approaches
Exposure Assessment– Food intake– Level of contamination
© 2016

Secondary Input Parameters
Prevalence of the Food Allergy Market Share for Specific Product in Category Number of Packages of Food Manufactured Propensity to Buy Advisory Labeled Products
© 2016

Expressions of Risk
User Population Risk– Assumes everyone is allergic and consumes the
product Allergic Population Risk
– Assumes everyone is allergic but a specific percent (%) consume the product
Overall Population Risk– Assumes a percent (%) of people are allergic and a
specific percent (%) consume the product
© 2016

Allergic?
Yes (0.76%)
Consume Product?
Yes (6.82%)
Consume your brand? (Market Share)
Yes (3%)
Allergen Present?
Yes (65%)
Consume product
Dose over threshold?
Yes
Allergic Reaction Predicted
No
No Reaction
No (35%)
No Reaction
No (97%)
No Reaction
No (93.18%)
No Reaction
No (99.24%)
No Reaction
QRA Diagram
User Risk
Allergic Population
Overall Population
Remington BC, Baumert JL, Marx DB, Taylor SL. Quantitative risk assessment of foods containing peanut advisorylabeling. Food Chem Toxicol. 2013 Dec;62:179‐87. doi: 10.1016/j.fct.2013.08.030. Epub 2013 Aug 27.

Quantitative Risk Assessment
© 2016

Conclusions QRA provides an in-depth analysis not available with
previous methods– Integrates variability and uncertainty of inputs into the risk
assessment model for a more realistic estimate of potential risk
QRA is flexible and applicable to a wide range of scenarios
QRA enables risk assessors to make an informed decision based on the true risk of a product
© 2016

Acknowledgements Steve Taylor, Ph.D. Dave Marx, Ph.D. Jamie Kabourek
Ben Remington, Ph.D. Geert Houben, Ph.D. Astrid Kruizinga Marty Blom, Ph.D.
Barbara Petersen, Ph.D. Rene Crevel, Ph.D. Heather Leslie
© 2016

Thank You for Your Attention
Joe Baumert, Ph.D.Food Allergy Research & Resource ProgramDepartment of Food Science & Technology
University of [email protected]
© 2016