Analysis of mechanical behavior of 3D printed ABS parts by ... · Analysis of mechanical behavior...
9
International Journal of Scientific & Engineering Research, Volume 7, Issue 3, March-2016 116 ISSN 2229-5518 IJSER © 2016 http://www.ijser.org Analysis of mechanical behavior of 3D printed ABS parts by experiments Divyathej M V, Varun M, Rajeev P Abstract—The research work presents analysis of Mechanical behaviour of 3D printed ABS parts.3D printing technology- an additive manufacturing process is a method of making Three Dimensional solid objects from a digital file. The emerge of 3D printing technology is challenging many products that have been traditionally made. In an additive process an object is created by laying down successive layers of material until the entire object is created. In this work, the mechanical properties and behaviour of a 3D Printed object is to be studied by varying parameters such as layer thickness, orientation etc. Various tests such as tensile test, compression test, flexural test and impact test to determine failure characteristics of such materials will be conducted. Based on experimental results, stress–strain relationship and failure criterion can be proposed. Then the strength and mechanical properties of a 3D printed specimen is compared with the product made out of conventional manufacturing method i.e.; through Automated Injection Moulding process. Test results and microscopic observations confirmed that 3D Printed products have anisotropic structure and have advantages over conventional manufacturing processes. Index Terms—3D Printing, Layered structure, Anisotropy, Fused Deposition Modelling, mechanicalproperties, Injection molding ———————————————————— 1 INTRODUCTION lobally 3D printing technology is challenging and on the verge of radically changing the rules for what, how and where everything is made, as manufacturing literally comes home. With the advent of 3D printing it is now possible to print almost everything; household items, Fashion accesso- ries, biomedical materials, architecture and engineering mod- els and even a well-equipped home….the sky is the limit! Every single industry is revolutionizing by 3D printing. 3D printing is not hardware, it is not software, it is not a design but a perfect combination of all. Next industrial revolution will be led by 3D printing! If the earlier 3D printing technology was adopted in rapid prototyping to effectively shorten the product development time, now its application has extended to develop any product as we desire. The time to market is reduced drastically when prototypes are made by 3D printing than regular methods of prototyping. If roughness and proper finish were pointed out as draw back in 3D printing, ongoing researchers are developing object to the high quality and good surface finish by identifying the critical parameters influencing and method to avoid staircase effect etc. These techniques are generally called 3D printing by public for ability to produce 3D printing object directly. 3dimensional printing is additive manufacturing technology that consists in the creation of 3D objects starting from a digi- tal model. 3D printing is being used routinely in a variety of manufacturing sectors ranging from aerospace and automo- tive to bioengineering. In 3D printing a three dimensional ob- ject is created by slicing digital model into many parallel lay- ers and laying down successive layers of material atop anoth- er.An exact 3D printing technique is an advanced RP tech- nique to construct 3D object layer by layer by using binding powder materials. But for a beginner all the process are called as 3D printing. There are other forms of RP technique similar to 3D printing.Fused Deposition Modeling ,Selective Laser Sintering, Digital Light Processing, Steriolithography and Laminated Object Manufacturing etc.. The detailed classifica- tion is as shown in the fig.1 Fig. 1 classification of rapid prototyping process The mechanical properties and quality of a 3D printed com- ponent depends on several factors. Some of them are layer thickness we are adopted for printing ,orientation, raster an- gle, air gap etc. Each of them has its own influence on the productThe entire 3D printing process divided into three steps. Preprocessing -including3D design and slicing, pro- cessing (3D printing) and post processing. It is diagrammati- cally as shown fig. 2 In this research work, focus is given on Fig. 2 principle of 3D printing G IJSER
Transcript of Analysis of mechanical behavior of 3D printed ABS parts by ... · Analysis of mechanical behavior...

International Journal of Scientific & Engineering Research, Volume 7, Issue 3, March-2016 116 ISSN 2229-5518
IJSER © 2016 http://www.ijser.org
Analysis of mechanical behavior of 3D printed ABS parts by experiments
Divyathej M V, Varun M, Rajeev P
Abstract—The research work presents analysis of Mechanical behaviour of 3D printed ABS parts.3D printing technology- an additive manufacturing process is a method of making Three Dimensional solid objects from a digital file. The emerge of 3D printing technology is challenging many products that have been traditionally made. In an additive process an object is created by laying down successive layers of material until the entire object is created. In this work, the mechanical properties and behaviour of a 3D Printed object is to be studied by varying parameters such as layer thickness, orientation etc. Various tests such as tensile test, compression test, flexural test and impact test to determine failure characteristics of such materials will be conducted. Based on experimental results, stress–strain relationship and failure criterion can be proposed. Then the strength and mechanical properties of a 3D printed specimen is compared with the product made out of conventional manufacturing method i.e.; through Automated Injection Moulding process. Test results and microscopic observations confirmed that 3D Printed products have anisotropic structure and have advantages over conventional manufacturing processes. Index Terms—3D Printing, Layered structure, Anisotropy, Fused Deposition Modelling, mechanicalproperties, Injection molding
————————————————————
1 INTRODUCTIONlobally 3D printing technology is challenging and on the verge of radically changing the rules for what, how and where everything is made, as manufacturing literally
comes home. With the advent of 3D printing it is now possible to print almost everything; household items, Fashion accesso-ries, biomedical materials, architecture and engineering mod-els and even a well-equipped home….the sky is the limit! Every single industry is revolutionizing by 3D printing. 3D printing is not hardware, it is not software, it is not a design but a perfect combination of all. Next industrial revolution will be led by 3D printing! If the earlier 3D printing technology was adopted in rapid prototyping to effectively shorten the product development time, now its application has extended to develop any product as we desire.
The time to market is reduced drastically when prototypes are made by 3D printing than regular methods of prototyping. If roughness and proper finish were pointed out as draw back in 3D printing, ongoing researchers are developing object to the high quality and good surface finish by identifying the critical parameters influencing and method to avoid staircase effect etc.
These techniques are generally called 3D printing by public for ability to produce 3D printing object directly. 3dimensional printing is additive manufacturing technology that consists in the creation of 3D objects starting from a digi-tal model. 3D printing is being used routinely in a variety of manufacturing sectors ranging from aerospace and automo-tive to bioengineering. In 3D printing a three dimensional ob-ject is created by slicing digital model into many parallel lay-ers and laying down successive layers of material atop anoth-er.An exact 3D printing technique is an advanced RP tech-nique to construct 3D object layer by layer by using binding powder materials. But for a beginner all the process are called as 3D printing. There are other forms of RP technique similar to 3D printing.Fused Deposition Modeling ,Selective Laser Sintering, Digital Light Processing, Steriolithography and Laminated Object Manufacturing etc.. The detailed classifica-
tion is as shown in the fig.1
Fig. 1 classification of rapid prototyping process
The mechanical properties and quality of a 3D printed com-ponent depends on several factors. Some of them are layer thickness we are adopted for printing ,orientation, raster an-gle, air gap etc. Each of them has its own influence on the productThe entire 3D printing process divided into three steps. Preprocessing -including3D design and slicing, pro-cessing (3D printing) and post processing. It is diagrammati-cally as shown fig. 2 In this research work, focus is given on
Fig. 2 principle of 3D printing
G
IJSER

International Journal of Scientific & Engineering Research, Volume 7, Issue 3, March-2016 117 ISSN 2229-5518
IJSER © 2016 http://www.ijser.org
Fused Deposition modeling, simply called as FDM technique analysis by varying layer thickness. And then comparison is done with Automated Injection molding process.
Fused Deposition modeling It works by extruding material through a nozzle to print
one cross section of an object, followed by lowering the plat-form to repeat the process for a new layer. The nozzle of the printer contains resistive heaters which almost melt the plastic
Fig. 3. FDM process
asit flows through the nozzle and forms a new layer. The ex-truded layer bonds to the layer below it and immediately hardens. This process is repeated several times till the object is finished. The FDM technology is common in less expensive printers and desktop 3D printers. The FDM method also uses a support material. This is used to support the part during printing. After the part is finished the support material has to be removed. This can be done ultrasonic cleaning in a water bath or by dissolving the support material. Process is shown in the fig. 3. Automated Injection moulding process
Fig. 4. Automated injection moulding machine Injection moulding is the most widely used polymeric fab-
rication process.Fig. 4 shows automated injection moulding machine. The main units of a typical injection moulding ma-chine are the clamping unit,the plasticizing unit, and the drive unit; they are shown in Fig. 5. The clampingunit holds the mould. It is capable of closing, clamping, and opening the
fig.5ingectionmoulding process mould.Its main components are the fixed and moving plates, the tie bars and the mechanism for opening, closing and clamping.The injection unit or plasticizing unit melts the plas-tic and injects it into themould. The drive unit provides power to the plasticizing unit and clamping unit.: In stage 1, the mouldis closed and the nozzle of the extruder is pushed against the sprue bushing of the mould.When the mould is completely filled, the screw remains stationary for some time to keep the plastic in the mould under pressure; this is called the “hold” time. During the hold time additional melt is in-jected into the mould to compensate for contraction due to cooling.When the material in the mould has cooled sufficiently to retain its shape, the mould opens and the parts are ejected. 2.Experimantal specimens
Specimens for testing by FDM technique are prepared ac-cording ASTM dimensions. They are designes in designing software Creo. Then they are converted to .STL format for fur-ther processing in slicing software. Here the slicing software used was Kisslicer. Then setting parameters, generates G-codes. Connecting to FDM machine, printing is done.Similarlyfor tesing samples of automated injection moulding process are prepared by using corresponding moulds. Before the tesing, surface roughness values of speci-mens were also noted.
Fig. 6 coordinate system for FDM product Let us define the coordinate system for FDM product.X di-
rection is the strip direction in which nozzle nozzle moves to lay down each strip. Y direction is perpendicular to strip di-rection, where successive strips are layed down. Z axis is per-perpendicular to printing layers, where layers are build up. 3. Mechanical tests
While analysing and characterising 3D printed compo-nents, results obtained should be treated as structural proper-ties instead of material properties. It is because of the fact that,
IJSER

International Journal of Scientific & Engineering Research, Volume 7, Issue 3, March-2016 118 ISSN 2229-5518
IJSER © 2016 http://www.ijser.org
3D printed samples areanisotrpic. FDM samples as well as moulded samples were undergone tensile test, flexural test, compression test and impact test.
3.1 Tensile test
Tensile properties are most widely used and specified properties and are used as an indication of strength of poly-mers. It measures the ability of a material to withstand the forces that tends to pull it apart and extend of deformation before breaking. Tensile test data such as tensile strength, elongation and tensile modulus are useful for the selection of polymeric materials for particular application from a large group. 3.1.1 Specimens
Dumbbell shaped specimens are used for tensile test. The shape and size of specimen shall conform to the dimensions as prescribed by particular test method specification i.e. ASTM D 638 [4]. The specimens were divided into 4 groups, FDM sam-ples of 0.1mm layer thickness, 0.15mm layer thickness, 0.2mm layer thickness and injection moulded, each loaded in X direc-tion. Each group containing 5 samples each. Injection moulded samples and FDM samples are shown in the fig. 7
Fig.7 injection moulded samples and FDM samples 3.1.2 Test Tensile test followed the test procedure prescribed in ASTM D638 [4]. The tensile testing machine of a constant-rate-of-crosshead movement is used.Machines can be operated at dif-ferent constant speed. It was operated at 50 mm/min. It is fitted with load cell and extensometer to record the test load and extension accurately.Tensile strength is defined as the maximum tensile stress sustained by a test piece during the tension test or ultimate strength of material subjected to tensile loading. In other words, it is a measure of the ability of material to withstand forces that tends to pull it apart and to determine to what extend the material stretches before break-ing.The ratio of tensile stress to corresponding strain at the maximum load within its proportional limits is the Tensile Modulus or Young’s Modulus. It is an indication of the rela-tive stiffness of the material. 3.1.3 Results and analysis
Tensile strength, tensile modulus and percentage elonga-tion of the specimens are listed in table 1.
Specimens prepared by injection moulding process have the highest tensile strength at break load (35.512 MPa) and at peak load (44.070 MPa) compared with 3D Printed FDM sam-
ples (33.097 MPa, 32.967 MPa and 33.108 MPa ). Considering elongation, specimens created by FDM process have the great-est performance. Considering elongation at break trend was converse, injection moulded samples have better result. . The summarized values in tensile strength and elongation at break indicate that injection moulded samples provided the highest tensile strength at 44.070 MPa
It can be concluded that injection moulded samples have high molecular orientation than FDM objects so they yield high tensile strength and low elongation than FDM objects. Design of injection mould greatly influences the quality of specimen. Tensile strength and modulus increases and per-centage elongation decreases with increase of rate of straining and vice versa.
While analysing fracture surfaces, it is seen that injection moulded specimen undergone brittle fracture resulting in two perfect smooth half surfaces. At the same time FDM samples have cup and cone fracture with rough mating parts.Breakage is not resulted in two perfect halves. Strain hardened areas are obviously visible in case of injection moulded samples. Gig.8 shows FDM sample part and Fig 9 shows injection moulded sample part after tensile failure.
Fig. 8 FDM sample
Fig. 9 injection moulded sample Analysing tensile strength of FDM products better tensile
strength and tensile modulus achieved is for 0.1 mm layer thickness. It is due to high molecular orientation and the both within a strip.
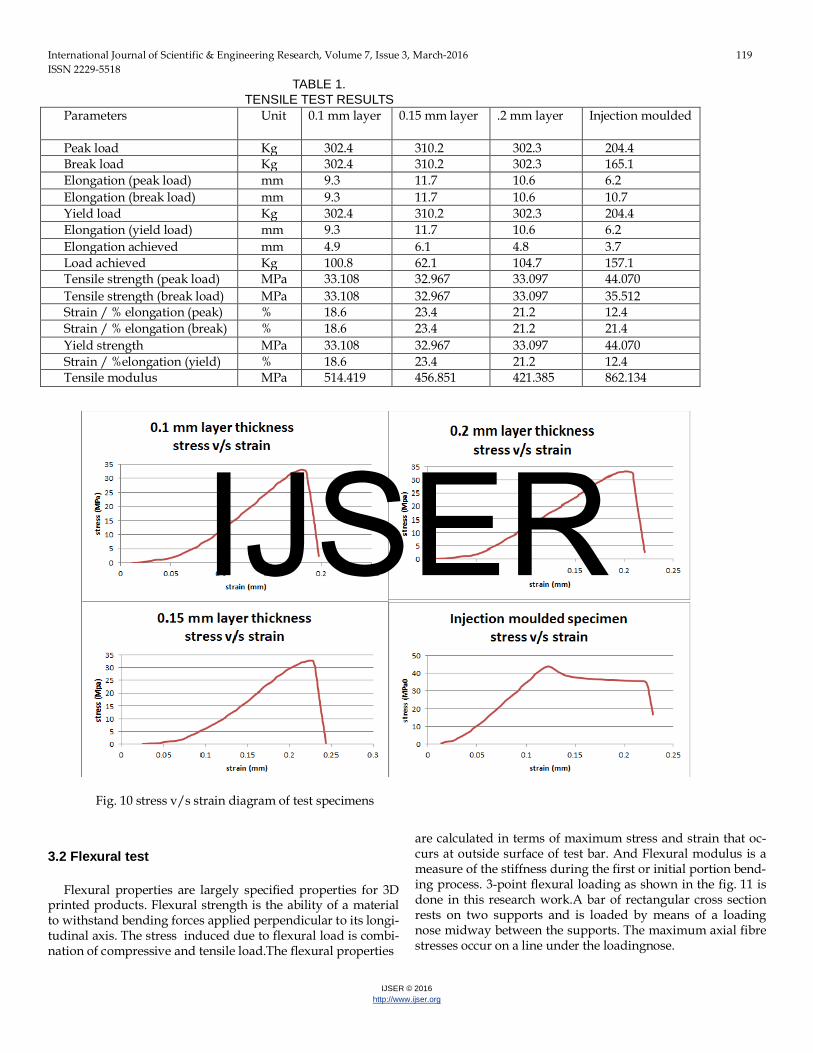
Fig. 10 shows stress v/s strain diagram of test samples
IJSER
International Journal of Scientific & Engineering Research, Volume 7, Issue 3, March-2016 119 ISSN 2229-5518
IJSER © 2016 http://www.ijser.org
TABLE 1. TENSILE TEST RESULTS
Parameters Unit 0.1 mm layer 0.15 mm layer .2 mm layer Injection moulded
Peak load Kg 302.4 310.2 302.3 204.4 Break load Kg 302.4 310.2 302.3 165.1 Elongation (peak load) mm 9.3 11.7 10.6 6.2 Elongation (break load) mm 9.3 11.7 10.6 10.7 Yield load Kg 302.4 310.2 302.3 204.4 Elongation (yield load) mm 9.3 11.7 10.6 6.2 Elongation achieved mm 4.9 6.1 4.8 3.7 Load achieved Kg 100.8 62.1 104.7 157.1 Tensile strength (peak load) MPa 33.108 32.967 33.097 44.070 Tensile strength (break load) MPa 33.108 32.967 33.097 35.512 Strain / % elongation (peak) % 18.6 23.4 21.2 12.4 Strain / % elongation (break) % 18.6 23.4 21.2 21.4 Yield strength MPa 33.108 32.967 33.097 44.070 Strain / %elongation (yield) % 18.6 23.4 21.2 12.4 Tensile modulus MPa 514.419 456.851 421.385 862.134
Fig. 10 stress v/s strain diagram of test specimens
3.2 Flexural test
Flexural properties are largely specified properties for 3D printed products. Flexural strength is the ability of a material to withstand bending forces applied perpendicular to its longi-tudinal axis. The stress induced due to flexural load is combi-nation of compressive and tensile load.The flexural properties
are calculated in terms of maximum stress and strain that oc-curs at outside surface of test bar. And Flexural modulus is a measure of the stiffness during the first or initial portion bend-ing process. 3-point flexural loading as shown in the fig. 11 is done in this research work.A bar of rectangular cross section rests on two supports and is loaded by means of a loading nose midway between the supports. The maximum axial fibre stresses occur on a line under the loadingnose.
IJSER
International Journal of Scientific & Engineering Research, Volume 7, Issue 3, March-2016 120 ISSN 2229-5518
IJSER © 2016 http://www.ijser.org
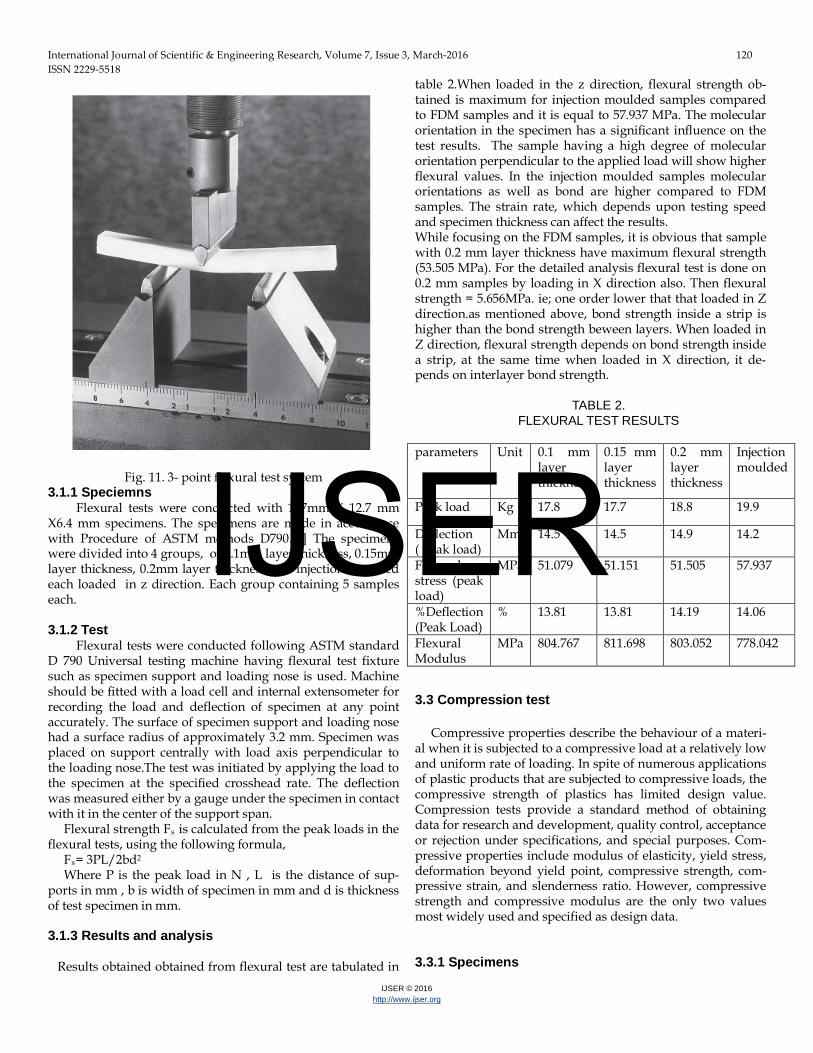
Fig. 11. 3- point flexural test system
3.1.1 Speciemns Flexural tests were conducted with 127mm X 12.7 mm
X6.4 mm specimens. The specimens are made in accordance with Procedure of ASTM methods D790.[5] The specimens were divided into 4 groups, of 0.1mm layer thickness, 0.15mm layer thickness, 0.2mm layer thickness and injection moulded each loaded in z direction. Each group containing 5 samples each. 3.1.2 Test
Flexural tests were conducted following ASTM standard D 790 Universal testing machine having flexural test fixture such as specimen support and loading nose is used. Machine should be fitted with a load cell and internal extensometer for recording the load and deflection of specimen at any point accurately. The surface of specimen support and loading nose had a surface radius of approximately 3.2 mm. Specimen was placed on support centrally with load axis perpendicular to the loading nose.The test was initiated by applying the load to the specimen at the specified crosshead rate. The deflection was measured either by a gauge under the specimen in contact with it in the center of the support span.
Flexural strength Fs is calculated from the peak loads in the flexural tests, using the following formula,
Fs= 3PL/2bd2
Where P is the peak load in N , L is the distance of sup-ports in mm , b is width of specimen in mm and d is thickness of test specimen in mm. 3.1.3 Results and analysis Results obtained obtained from flexural test are tabulated in
table 2.When loaded in the z direction, flexural strength ob-tained is maximum for injection moulded samples compared to FDM samples and it is equal to 57.937 MPa. The molecular orientation in the specimen has a significant influence on the test results. The sample having a high degree of molecular orientation perpendicular to the applied load will show higher flexural values. In the injection moulded samples molecular orientations as well as bond are higher compared to FDM samples. The strain rate, which depends upon testing speed and specimen thickness can affect the results. While focusing on the FDM samples, it is obvious that sample with 0.2 mm layer thickness have maximum flexural strength (53.505 MPa). For the detailed analysis flexural test is done on 0.2 mm samples by loading in X direction also. Then flexural strength = 5.656MPa. ie; one order lower that that loaded in Z direction.as mentioned above, bond strength inside a strip is higher than the bond strength beween layers. When loaded in Z direction, flexural strength depends on bond strength inside a strip, at the same time when loaded in X direction, it de-pends on interlayer bond strength.
TABLE 2. FLEXURAL TEST RESULTS
parameters Unit 0.1 mm
layer thickness
0.15 mm layer thickness
0.2 mm layer thickness
Injection moulded
Peak load Kg 17.8 17.7 18.8 19.9
Deflection ( peak load)
Mm 14.5 14.5 14.9 14.2
Flexural stress (peak load)
MPa 51.079 51.151 51.505 57.937
%Deflection (Peak Load)
% 13.81 13.81 14.19 14.06
Flexural Modulus
MPa 804.767 811.698 803.052 778.042
3.3 Compression test
Compressive properties describe the behaviour of a materi-al when it is subjected to a compressive load at a relatively low and uniform rate of loading. In spite of numerous applications of plastic products that are subjected to compressive loads, the compressive strength of plastics has limited design value. Compression tests provide a standard method of obtaining data for research and development, quality control, acceptance or rejection under specifications, and special purposes. Com-pressive properties include modulus of elasticity, yield stress, deformation beyond yield point, compressive strength, com-pressive strain, and slenderness ratio. However, compressive strength and compressive modulus are the only two values most widely used and specified as design data.
3.3.1 Specimens
IJSER

International Journal of Scientific & Engineering Research, Volume 7, Issue 3, March-2016 121 ISSN 2229-5518
IJSER © 2016 http://www.ijser.org
Test specimen of rectangular block of 12.7mm x 12.7mm x 25.4mm with flat and plane faces is preferred for compression test according to ASTM D 695 [6]. The specimens were divided into 4 groups, of 0.1mm layer thickness, 0.15mm layer thick-ness, 0.2mm layer thickness and injection moulded each load-ed in X direction, which means compressive forces are applied on the face having cross sectional area 12.7mm x 12.7 mm. Each group containing 5 samples each. 3.3.2 Test
The universal testing machine used for tensile and flexural testing can also be used for testing compressive strength.
A deflecto-meter or a compressometer was used to measure any change in distance between two fixed points on the test specimen at any time during the test.Compressive strength is calculated by dividing the maximum compressive load carried by the specimen during the test by the original minimum cross-sectional area of the specimen. The result is expressed in N/mm2.. Modulus of elasticity or compressive modulus, like tensile and flexural modulus, is also represented by the slope of the initial straight-line portion of the stress–strain curve and is calculated by dividing the change in stress by the corre-sponding change in strain. 3.3.3 Results and analysis
Compressive strength was obtained from the maximum load divided by the face area of the rectangular block. Results obtained from compressive strength test areas shown in the table 3. The load v/s displacement graphs are also attached
Specimens prepared by 3D printed FDM 0.2 mm layer thickness samples have the highest compressive strength 3.05 MPa at break load and at peak load compared with injection moulded samples (2.301 MPa). Considering deflection, speci-men created by injection moulding process have the greatest performance.
Since it is found out that 0.2 mm layer thickness samples give remarkable compressive strength and compressive modulus, then testing is continued on another 0.2 mm samples loading in Y and Z directions. In Z direction compressive strength=2.526 MPa and in Y Direction compressive strength = 1.860 MPa. The test results showed that the compression strength in the X direction is higher than that in both Y and Z directions. According to printing process the specimen can be seen as many thin strips overlaying one after another. The printing speed is high in the X direction and the time of print-ing adjacent strips (Y direction) is much shorter than that of printing adjacent layers(Z direction). The bond between two parts of the material appears to be higher when they are print-ed within a shorter period of time, resulting in a higher strength inside a continuous strip than that between the strips, which is in turn higher than that between layers.
3.4 Impact Test Impact test are designed to measure the resistance to failure
of material to a suddenly applied force such as collision,falling object or instantaneous blow. The test measure the impact
TABLE 3.
COMPRESSION TEST RESULTS
energ ,or the energy absorbed prior to fracture .The most common method of measuring impact energy for plastic is izod test. 3.4.1 Specimens In order to conduct a notched izod test, a precise notch be cut into the specimens. The purpose of the notch is to serve as a stress concentrator. The notch is probably the most critical part of specimen preparation and there is a tight tolerances defined by ASTM D 256 on the depth of the notch, the angle of cut and the radius at the base of the notch. As in previous tests, 4 cate-gories of test samples are prepared. For every category, 5 simi-lar samples were taken.
3.4.2 Test
Once that the correct pendulum energy has been selected, clamp the specimen firmly in the vice. The specimen is clamped so that it is vertically cantilevered with the notch sur-face facing the direction of impact. The vice should be equipped with an adjustable stop and a notch centering jig which will aid in positioning the specimen in the same posi-
Parameters Unt 0.1 mm layer
0.15 mm layer
0.2 mm layer
Injection moulded
At load Kg 80 80 100 80 Peak load Kg 79.3 79.7 98.6 79.8 Break load Kg 79.3 79.7 98.6 79.8 deflection (peak load)
mm 0.4 0.4 0.4 0.5
deflection (break load)
mm 0.4 0.4 0.4 0.5
Yield load Kg 79.3 79.7 98.6 79.8 deflection (yield load)
mm 0.04 0.04 0.04 0.05
deflection achieved
mm 0.4 0.4 0.3 0.5
Load achieved
Kg 0 0 0 0
compressive strength (peak load)
MPa 2.467 2.510 3.056 2.301
compressive strength (break load)
MPa 2.467 2.510 3.056 2.301
% deflection (peak)
% 1.6 1.58 1.6 1.88
% deflection (break)
% 1.6 1.58 1.6 1.88
Yield strength
MPa 2.467 2.510 3.056 2.301
% deflection (yield)
% 1.6 1.58 1.6 1.88
Compression modulus
MPa 8.555 9.56 12.394 6.129
IJSER
International Journal of Scientific & Engineering Research, Volume 7, Issue 3, March-2016 122 ISSN 2229-5518
IJSER © 2016 http://www.ijser.org
tion for each determination. Latch the pendulum in its upright position. After making sure that the swing plane of the pendu-lum arm is clear, release the pendulum and allow it to break the specimen. 3.4.3 Results and analysis
TABLE 4. IZOD IMPACT TEST RESULTS Specimen impact strengths
(kJ/𝒎𝟐) 0.1 mm layer thickness 7.54 0.15 mm layer thickness 8.10 0.2 mm layer thickness 15.51
Moulded specimen 15.24 While comparing the results of test as in table 4, it is clear
that there is variation in impact strength of specimen made in different layer thickness. Specimen with layer thickness 0.2 mm has higher impact strength, specimen with 0.1mm layer thickness has lower impact strength .And moulded specimen and specimen with layer thickness 0.2mm have almost same impact strength. It can be concluded that there is no more comparable variation of impact strength for FDM and mould-ed samples. 3. Thermo Gravimetric Analysis (TGA)
TGA measures the amount and rate of change in the mass of a sample as a function of temperature or time in a con-trolled atmosphere. The measurements are used primarily to determine the thermal and or oxidative stabilities of materials as well as their compositional properties. It is useful for the study of polymeric materials, including thermoplastics, ther-mosets, elastomers, composites, films, fibres, coatings and paints. TGA provides information that can be used to select materials for certain applications.
A TGA consists of a sample pan that is supported by a pre-cision balance. That pan resides in a furnace and is heated dur-ing the experiment. A sample purge gas controls the sample environment, it flows over the sample and exits through an exhaust. Mass of the test sample is monitored during the ex-periment.
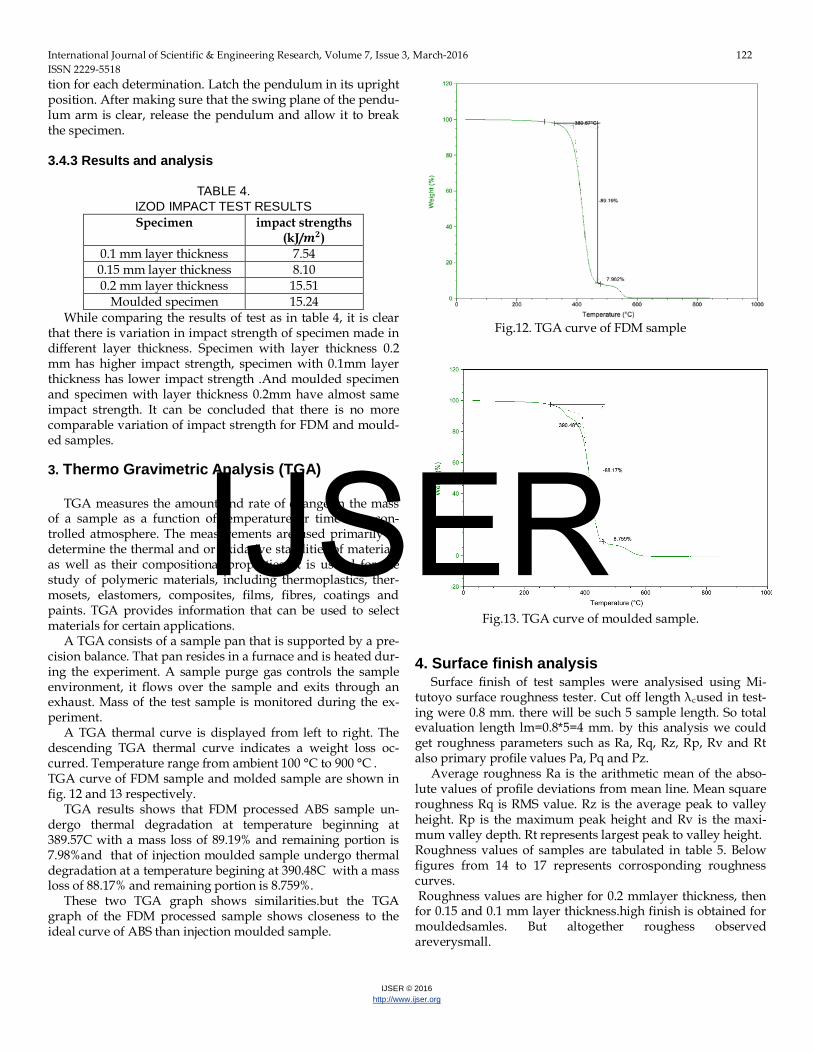
A TGA thermal curve is displayed from left to right. The descending TGA thermal curve indicates a weight loss oc-curred. Temperature range from ambient 100 °C to 900 °C . TGA curve of FDM sample and molded sample are shown in fig. 12 and 13 respectively.
TGA results shows that FDM processed ABS sample un-dergo thermal degradation at temperature beginning at 389.57C with a mass loss of 89.19% and remaining portion is 7.98%and that of injection moulded sample undergo thermal degradation at a temperature begining at 390.48C with a mass loss of 88.17% and remaining portion is 8.759%.
These two TGA graph shows similarities.but the TGA graph of the FDM processed sample shows closeness to the ideal curve of ABS than injection moulded sample.
Fig.12. TGA curve of FDM sample
Fig.13. TGA curve of moulded sample. 4. Surface finish analysis
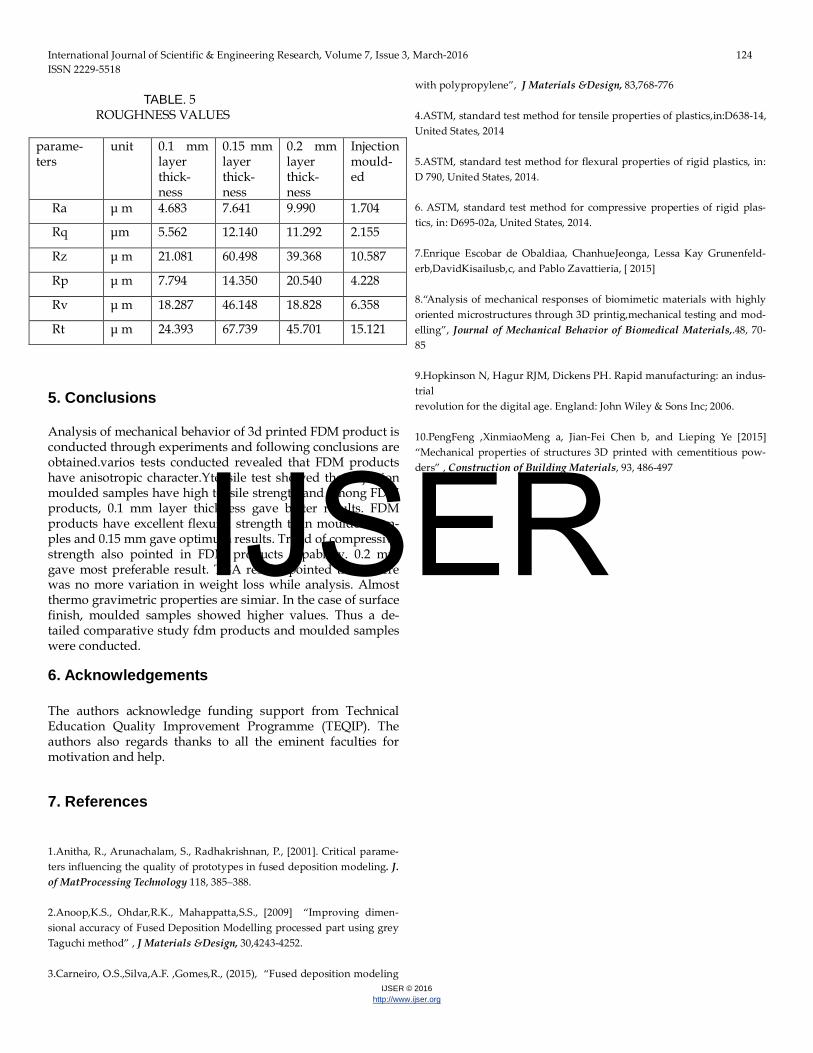
Surface finish of test samples were analysised using Mi-tutoyo surface roughness tester. Cut off length λcused in test-ing were 0.8 mm. there will be such 5 sample length. So total evaluation length lm=0.8*5=4 mm. by this analysis we could get roughness parameters such as Ra, Rq, Rz, Rp, Rv and Rt also primary profile values Pa, Pq and Pz.
Average roughness Ra is the arithmetic mean of the abso-lute values of profile deviations from mean line. Mean square roughness Rq is RMS value. Rz is the average peak to valley height. Rp is the maximum peak height and Rv is the maxi-mum valley depth. Rt represents largest peak to valley height. Roughness values of samples are tabulated in table 5. Below figures from 14 to 17 represents corrosponding roughness curves. Roughness values are higher for 0.2 mmlayer thickness, then for 0.15 and 0.1 mm layer thickness.high finish is obtained for mouldedsamles. But altogether roughess observed areverysmall.
IJSER

International Journal of Scientific & Engineering Research, Volume 7, Issue 3, March-2016 123 ISSN 2229-5518
IJSER © 2016 http://www.ijser.org
Fig 14.o.1 mm layer thickness
Fig 15. 0.15 mm
layer thick-ness
Fig. 16 0.2 mm layer thickness
Fig. 17 injection
moulded sample.
IJSER
International Journal of Scientific & Engineering Research, Volume 7, Issue 3, March-2016 124 ISSN 2229-5518
IJSER © 2016 http://www.ijser.org
TABLE. 5
ROUGHNESS VALUES
parame-ters
unit 0.1 mm layer thick-ness
0.15 mm layer thick-ness
0.2 mm layer thick-ness
Injection mould-ed
Ra μ m 4.683 7.641 9.990 1.704
Rq μm 5.562 12.140 11.292 2.155
Rz μ m 21.081 60.498 39.368 10.587
Rp μ m 7.794 14.350 20.540 4.228
Rv μ m 18.287 46.148 18.828 6.358
Rt μ m 24.393 67.739 45.701 15.121
5. Conclusions Analysis of mechanical behavior of 3d printed FDM product is conducted through experiments and following conclusions are obtained.varios tests conducted revealed that FDM products have anisotropic character.Ytensile test showed that injection moulded samples have high tensile strength and among FDM products, 0.1 mm layer thickness gave better results. FDM products have excellent flexural strength than moulded sam-ples and 0.15 mm gave optimum results. Trend of compressive strength also pointed in FDM products capability. 0.2 mm gave most preferable result. TGA results pointed thare there was no more variation in weight loss while analysis. Almost thermo gravimetric properties are simiar. In the case of surface finish, moulded samples showed higher values. Thus a de-tailed comparative study fdm products and moulded samples were conducted. 6. Acknowledgements The authors acknowledge funding support from Technical Education Quality Improvement Programme (TEQIP). The authors also regards thanks to all the eminent faculties for motivation and help.
7. References
1.Anitha, R., Arunachalam, S., Radhakrishnan, P., [2001]. Critical parame-ters influencing the quality of prototypes in fused deposition modeling. J. of MatProcessing Technology 118, 385–388. 2.Anoop,K.S., Ohdar,R.K., Mahappatta,S.S., [2009] “Improving dimen-sional accuracy of Fused Deposition Modelling processed part using grey Taguchi method” , J Materials &Design, 30,4243-4252. 3.Carneiro, O.S.,Silva,A.F. ,Gomes,R., (2015), “Fused deposition modeling
with polypropylene”, J Materials &Design, 83,768-776 4.ASTM, standard test method for tensile properties of plastics,in:D638-14, United States, 2014 5.ASTM, standard test method for flexural properties of rigid plastics, in: D 790, United States, 2014. 6. ASTM, standard test method for compressive properties of rigid plas-tics, in: D695-02a, United States, 2014. 7.Enrique Escobar de Obaldiaa, ChanhueJeonga, Lessa Kay Grunenfeld-erb,DavidKisailusb,c, and Pablo Zavattieria, [ 2015] 8.“Analysis of mechanical responses of biomimetic materials with highly oriented microstructures through 3D printig,mechanical testing and mod-elling”, Journal of Mechanical Behavior of Biomedical Materials,.48, 70-85 9.Hopkinson N, Hagur RJM, Dickens PH. Rapid manufacturing: an indus-trial revolution for the digital age. England: John Wiley & Sons Inc; 2006.
10.PengFeng ,XinmiaoMeng a, Jian-Fei Chen b, and Lieping Ye [2015] “Mechanical properties of structures 3D printed with cementitious pow-ders” , Construction of Building Materials, 93, 486-497
IJSER