Analysis of Hurricane Andrew Economic Damagensgd.gso.uri.edu/flsgp/flsgpt93003.pdf · Analysis of...
96
Transcript of Analysis of Hurricane Andrew Economic Damagensgd.gso.uri.edu/flsgp/flsgpt93003.pdf · Analysis of...

Analysis of Hurricane Andrew Economic Damageand Recovery Options for the Boating,Marina and Marine Service Industries
Edward K. BakerMaria L. Villanueva
Boating Research Center, Rosenstiel School of Marineand Atmospheric Science
University of MiamiVirginia Key, Florida 33149
Survey funded byHurricane Educational Response Program
Project number 92-ESNP-l-5185.
Technical Paper 72 printed underGrant Number NA89 A A-D SG053
For copies:Florida Sea Grant College Program
University of FloridaP.O. Box 110409
Gainesville, FL 3261l-0409
COLLEGE PROGRAM
October 1993
$5.00
Acknowledgements
The authors are grateful to a number of individuals who helped with this study.Mr. Phil Everingham of Merrill-Stevens Boat Yard, Mr. Frank Herhold of the MarineIndustry Association of South Florida, Mr. Carl Straw of Professional MarineAssociates, Inc., Mr. Frank Piedra of Phoenix Marine, and Mr. Don Pybas, Florida SeaGrant Extension Agent for Dade County assisted in drafting and reviewing the surveyquestionnaires used in the study and in compiling the list of boat yards, boatdealerships, and boat manufacturers in Dade County. Ms. Erica McKinley providedvaluable assistance in conducting the surveys.

Table of Contents
Acknowledgements ............................................
List of Exhibits ...............................................
1.0 Introduction ...............................................
2.0 Survey of Boat Owners in Dade County, Florida ....................
2.1 Review of the 1990 Study ...............................2.1.12.1.22.1.32.1.42.1.5
Target Population . . . . . . . . . . . . . . . . . . . . . . . . . . . . . . . .Development and Validation of the Survey Questionnaire . . .
Results of the 1990 Survey . . . . . . . . . . . . . . . . . . . . . . . . .Marine Traffic Modeling in the 1990 Study . . . . . . . . . . . . .Recommendations and Policy Decisions as a Result of the1990 Study . . . . . . . . . . . . . . . . . . . . . . . . . . . . . . . . . . .
2.2 Assessment of Hurricane Evacuation Plans - Post Andrew ........
2.2.1 Post-Andrew Responses of the Berthed Boat OwnersSurveyed in 1990 ..............................2.2.1.1 Boat Characteristics .......................2.2.1.2 Pre-Hurricane Usage Patterns .................2.2.1.3 Hurricane Planning and Preparation ... _ ........
2.2.1.4 Hurricane Damage and Assessment ............2.2.1.5 Future Boating Plans ......................
2.2.2 Post-Andrew Responses of Boat Owners in General .......
2.2.2.1 Boat Characteristics .......................2.2.2.2 Hurricane Preparation and Planning ............
2.2.2.3 Hurricane Damage and Assessment ............2.2.2.4 Future Boating Plans ......................
3.0 Survey of Dade County Marinas and Boat Storage Facilities ...........
3.1 Facility Characteristics . . . . . . . . . . . . . . . . . . . . . . . . . . . . . . . .3.2 Pre-hurricane Operations ................................
3.3 Hurricane Preparedness . . . . . . . . . . . . . . . . . . . . . . . . . . . . . . . . .3.4 The Effects of Hurricane Andrew ..........................
3.5 Rebuilding Plans .....................................
4.0 Boat Yards, Boat Dealers, and Boat Manufacturers ..................4.1 BoatYards . . . . . . . . . . . . . . . . . . . . . . . . . . . . . . . . . . . . . . . . .
4.1.1 Boat Yard Characteristics and Pre-hurricane Operations ....4.1.2 Hurricane Andrew Damage Assessment and Rebuilding
Plans . . . . . . . . . . . . . . . . . . . . . . . . . . . . . . . . . . . . . . .4.1.3 Post-Hurricane Andrew Operations ...................
4.2 Boat Dealers ........................................
ii
V
1
1010
1111121313151717172123
242525323435
363636
373737
. . .111

4.3 Boat Manufactures ................................... 38
5.0 Summary and Conclusions ................................... 40
6.0 Recommendations ......................................... 43
Appendices . . . . . . . . . . . . . . . . . . . . . . . . . . . . . . . . . . . . . . . . . . . . . . . . . 45
Appendix A . . . . . . . . . . . . . . . . . . . . . . . . . . . . . . . . . . . . . . . . . . . . . . . . 47
Appendix BB . . . . . . . . . . . . . . . . . . . . . . . . . . . . . . . . . . . . . . . . . . . . . . . . 53
Appendix CC . . . . . . . . . . . . . . . . . . . . . . . . . . . . . . . . . . . . . . . . . . . . . . . . 61
Appendix D . . . . . . . . . . . . . . . . . . . . . . . . . . . . . . . . . . . . . . . . . . . . . . . . 67
Appendix E ................................................. 75
Appendix F .................................................. 83
Appendix G . . . . . . . . . . . . . . . . . . . . . . . . . . . . . . . . . . . . . . . . . . . . . . . . 89
Appendix H . . . . . . . . . . . . . . . . . . . . . . . . . . . . . . . . . . . . . . . . . . . . . . . . 95
iv
List of Exhibits
1.11.21.3
2.12.22.32.42.52.62.72.82.9
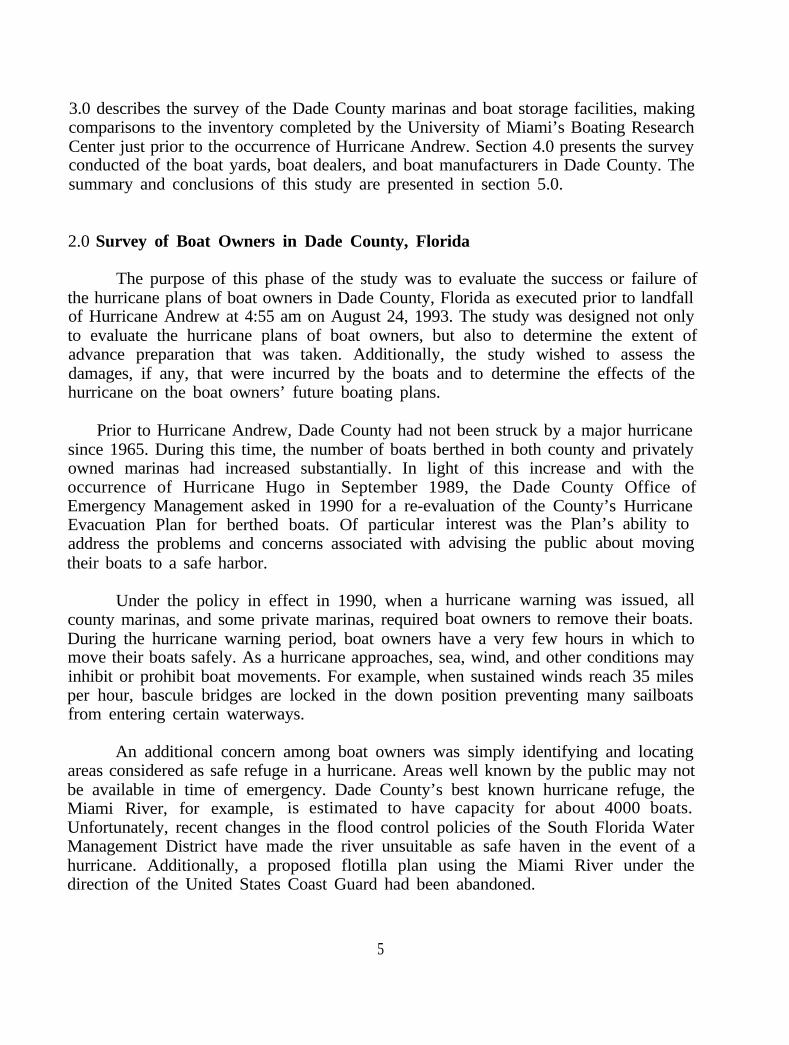
National Weather Service Radar Image of Hurricane Andrew ........... 3Approximate Location of Some Boat Storage Facilities ............... 4
Approximate Location of Boat Yards, Boat Dealerships and BoatManufacturers ........................................... 5
Boat Characteristics, Berthed Boat owners ....................... 12Berthed Boat Owners, Pre-Hurricane Boat Use Patterns .............. 13Berthed Boats, Damage During Hurricane Andrew .................. 14Berthed Boats, Amount of Damage ............................ 14Berthed Boats, When Boats Replaced ........................... 15Berthed Boats, When Boats Repaired ........................... 16Berthed Boats, Post-Hurricane Boat Use Patterns ................... 16Boat Owners,Boat Owners,
2.10 Boat Owners,2.11 Boat Owners,2.12 Boat Owners,2.13 Boat Owners,2.14 Boat Owners,2.15 Boat Owners,2.16 Boat Owners,
By Boat Length and Propulsion ..................... 18Boat Trailers .................................. 18Hurricane Plan ................................ 19Marina Information ............................. 19Boats Required to be Moved ...................... 20When Boats Were Moved ......................... 20Amount of Boat Damage ......................... 21Moved Boat .................................. 21When Will Boats Be Replaced ..................... 22
2.17 When Will Boats Be Repaired ................................ 232.18 Boat Owners, Post-Hurricane Summer Boat Use Patterns .... -: ........ 232.19 Boat Owners, Post-Hurricane Winter Boat Use Patterns .............. 243.1 Pre-Hurricane Andrew Inventory of Boat Storage Facilities, Dade County . 263.2 Pre-Hurricane No. of Available Slips and Occupancy Rates, Boat Storage
Facilities .............................................. 283.3 Post-Hurricane No. of Available Slips and Occupancy Rates, Boat Storage
Facilities .............................................. 303.4 Boat Storage Facilities, Services Offered ......................... 323.5 Boat Storage Facilities, Insurance Requirements .................... 333.6 Boat Storage Facilities, Hurricane Plant .......................... 333.7 Boat Storage Facilities, Require Move Boats ...................... 343.8 Boat Storage Facilities, Amount of Damage ...................... 343.9 Boat Storage Facilities, Insurance Coverage ....................... 353.10 Boat Storage Facilities, Rebuilding Plans ........................ 354.1 List of Boat Yards Surveyed ................................. 364.2 List of Boat Dealership Surveyed .............................. 384.3 List of Boat Manufacturers Surveyed ........................... 39

1.0 Introduction
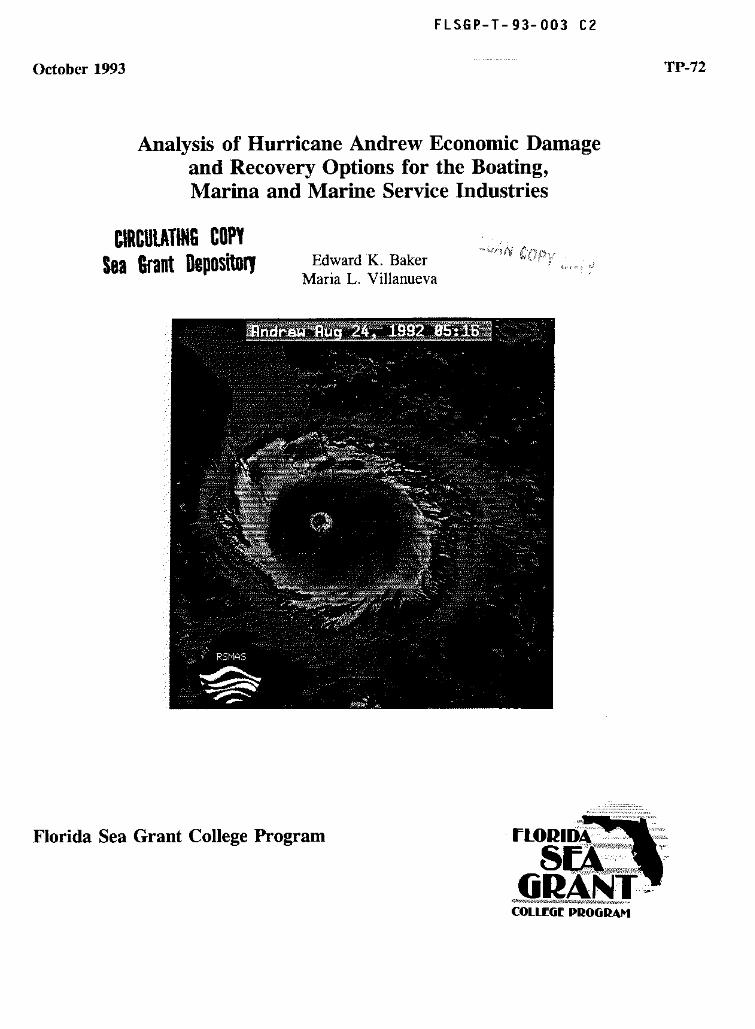
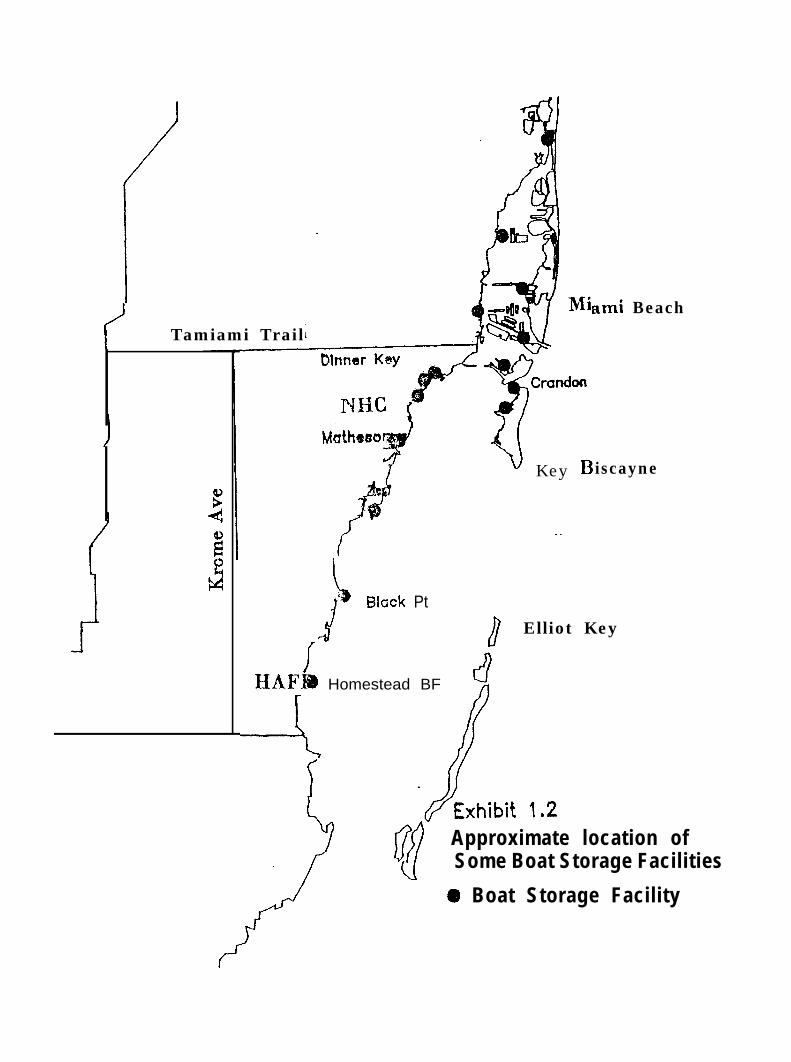
At 4:55 am August 24, 1992, the eye of Hurricane Andrew made landfall at 25.5degrees north latitude in Dade County, Florida. A radar image of the storm from theNational Weather Service Miami radar just before landfall is presented in Exhibit 1.1.The hurricane had a devastating effect on the recreational boating industry in SouthFlorida impacting boaters, marinas, boat yards, boat dealers, and boat manufacturers.A map the boat storage facilities in Dade County with over 100 wet or dry slips ispresented in Exhibit 1.2. A similar map of boat yards, boat dealers and boatmanufacturers contacted in this study is shown in Exhibit 1.3.
In response to the devastation of Hurricane Andrew, Florida Sea Grant conveneda meeting of industry representatives and marine researchers on September 29, 1993 atthe University of Miami’s Rosenstiel School of Marine and Atmospheric Science. SeaGrant agents and marine industry researchers together with the industry representativesenumerated several immediate needs of the industry. This study was undertaken to meetseveral of the needs identified at the meeting.
The purpose of this study was to analyze the impact of Hurricane Andrew onthree distinct sectors of the recreational boating industry: boaters, marinas, and themarine services industries. Specifically the objectives of this study were: 1) to evaluatethe hurricane preparedness plans of the boaters, marinas and other marine relatedbusinesses in Dade County, 2) to assess the damage caused by Hurricane Andrew to theboats, marinas, boat yards, and other boating businesses, and 3) to determine the futureboating activities of Dade County boat owners and the rebuilding plans of the marinebusinesses.
To accomplish these objectives, various survey methodologies were employed.First with regard to boaters, a longitudinal study was conducted from a baseline surveyof hurricane evacuation plans of berthed boat owners in Dade County conducted in1990. In addition to these results, a survey questionnaire was mailed to a stratifiedrandom sample of the general boater population in the county. Second, a post-hurricanesurvey of marinas and boat storage facilities in Dade County was conducted. Thissurvey utilized as a sampling frame the inventory of Dade County marinas and boatstorage facilities completed by the Boating Research Center in July of 1992, threeweeks prior to Hurricane Andrew. Finally, mail and telephone surveys as well aspersonal interviews were conducted with boat yards, boat dealers and boatmanufacturers in Dade County.
A detailed description of the methods employed in each phase of the study andtheir results are presented in the remainder of this report. After this introductory section,Section 2.0 describes the longitudinal survey of berthed boat owners in DadeCounty, as well as the results of the survey of the general boating population. Section

,’ Tamiami Trail
ii
i
Wick Pt
!HAFB) Homestead BF
ami Beach
Key B iscayne
_.
Elliot Key
-4.;_
Approximate location ofSome Boat Storage Facilities
8 Boat Storage Facility

-
3.0 describes the survey of the Dade County marinas and boat storage facilities, makingcomparisons to the inventory completed by the University of Miami’s Boating ResearchCenter just prior to the occurrence of Hurricane Andrew. Section 4.0 presents the surveyconducted of the boat yards, boat dealers, and boat manufacturers in Dade County. Thesummary and conclusions of this study are presented in section 5.0.
-
2.0 Survey of Boat Owners in Dade County, Florida
-
The purpose of this phase of the study was to evaluate the success or failure ofthe hurricane plans of boat owners in Dade County, Florida as executed prior to landfallof Hurricane Andrew at 4:55 am on August 24, 1993. The study was designed not onlyto evaluate the hurricane plans of boat owners, but also to determine the extent ofadvance preparation that was taken. Additionally, the study wished to assess thedamages, if any, that were incurred by the boats and to determine the effects of thehurricane on the boat owners’ future boating plans.
Prior to Hurricane Andrew, Dade County had not been struck by a major hurricanesince 1965. During this time, the number of boats berthed in both county and privatelyowned marinas had increased substantially. In light of this increase and with theoccurrence of Hurricane Hugo in September 1989, the Dade County Office ofEmergency Management asked in 1990 for a re-evaluation of the County’s HurricaneEvacuation Plan for berthed boats. Of particularaddress the problems and concerns associated withtheir boats to a safe harbor.
interest was the Plan’s ability toadvising the public about moving
Under the policy in effect in 1990, when a hurricane warning was issued, allcounty marinas, and some private marinas, required boat owners to remove their boats.During the hurricane warning period, boat owners have a very few hours in which tomove their boats safely. As a hurricane approaches, sea, wind, and other conditions mayinhibit or prohibit boat movements. For example, when sustained winds reach 35 milesper hour, bascule bridges are locked in the down position preventing many sailboatsfrom entering certain waterways.
An additional concern among boat owners was simply identifying and locatingareas considered as safe refuge in a hurricane. Areas well known by the public may notbe available in time of emergency. Dade County’s best known hurricane refuge, theMiami River, for example, is estimated to have capacity for about 4000 boats.Unfortunately, recent changes in the flood control policies of the South Florida WaterManagement District have made the river unsuitable as safe haven in the event of ahurricane. Additionally, a proposed flotilla plan using the Miami River under thedirection of the United States Coast Guard had been abandoned.
5
The problems associated with the search for safe harbor are exacerbated by thefacts that a substantial number of boats in wet storage are owned by non-Dade Countyresidents and that many berthed boat owners have never experienced a hurricane inDade County. The lack of time for preparation and the possible unavailability of spacefor safe haven could be catastrophic if a major hurricane were to strike the area.
As a first step in addressing these concerns, the Metro Dade PlanningDepartment, the Office of Emergency Management, and the University of MiamiBoating Research Center obtained a Coastal Zone Management Grant to obtain primarydata on the hurricane evacuation plans and experiences of the berthed boat owners inDade County, Florida. The results of this study were published in a report in Decemberof 1990 and served as a baseline from which the current survey results were analyzed.
2.1 Review of the 1990 Study
2.1.1 Target Population
In the spring of 1990, the Dade County Planning Department provided theBoating Research Center with an inventory of marinas with ten or more berths and alist of berthed-boat owners in those marinas. The inventory included 88 public andprivate marinas. The list included the names of 3007 berthed boat owners.
The Boating Research Center verified the list of berthed boat owners in themarina inventory provided by the County by cross-referencing the number of wet slipsin the marinas, the number of berthed boats in each marina, and the number of namesof berthed boat owners in each marina. The file of owners of berthed boats in countymarinas was then merged with the 1989 Florida vessel registration file. The mergingwas done to validate the boat characteristics and the names and addresses of boatowners in the inventory. The merging of the files resulted in a total of 1760 recordswith names, addresses and boat characteristics that were used in the sampling frame forthe study.
2.1.2 Development and Validation of the Survey Questionnaire
Using standard survey design methodology, the Boating Research Centerdeveloped a preliminary questionnaire for the mail survey. The questionnaire was thengiven to the Office of Emergency Management and Dade County Planning Office forcomments and suggestions. The changes proposed by these offices were discussed andconsidered and incorporated into the questionnaire for presentation at a HurricanePreparedness Workshop. The comments of attendees at the workshop were also includedin the final questionnaire.
6
A pilot study was conducted to estimate the response rate of the questionnaire,to measure significant variances in the survey responses, to assess the ambiguities in theprepared questionnaire, and to examine the necessity of stratifying the sampling frameaccording to geographical location and type of boat.
The pilot survey was mailed and a thirty four percent response rate was realized.Several points were noted. First, stratification of the population by geographic regionwas needed as hurricane refuge sites were found to be dependent upon marina location.Second, it was found that stratification of the sample by boat type was not required.Third, ambiguities were found to exist in several questions of the questionnaire andthese were rectified.
Of 1000 questionnaires mailed in the 1990 study, 350 responses were received.Fifteen of these questionnaires were disregarded because they were not adequatelycompleted by the respondents. Of the 335 remaining, only 323 were legible andconsistent.
2.1.3 Results of the 1990 Survey
A frequency analysis of the survey data revealed that the typical respondent’sboat was 30 to 40 feet in length with a 6 to 10 foot beam. The most likely draft was 3feet. Clearly 57 percent of the respondents were sailboat owners. Almost 95 percent ofthe boats were constructed of fiberglass. The typical boat of the respondents was of the1970 to 1980 model vintage, and had been purchased within the last four years.
Over 65 percent of the berthed boat owners in Dade County have been boatowners for more than five years. They have typically kept their boat in the marina inwhich it is currently berthed for more than five years.
Most of the berthed boats were not trailerable. Only 24 percent of therespondents had trailerable boats. Of those who could trailer their boats, 68 percentowned a trailer. Twelve percent of the respondents indicated that they would trailer theirboat in the event the threat of a hurricane required marina evacuation.
The boat owners of the 1990 study were generally aware whether or not theirmarina required evacuation if a hurricane threatened. At the time of the survey, 73percent responded that their marina required evacuation and 67 percent said theyintended to move their boat. Of those intending to move their boat, 64 percent plannedto move their boat more than 48 hours before the expected landfall of the storm.
Although a high percentage of berthed boat owners planned to move their boats
7

when a hurricane threatens, 39 percent did not know where to move them. Of thoserespondents who specified a destination in their evacuation plan, 17.8 percent chose theMiami River, 8 percent chose the Coral Gables Waterway, 3.7 percent specified inlandcanals, and 3 percent indicated Biscayne Bay.
Only ten percent of those who intended to move their boats had a written contractfor a hurricane mooring. Only 50 percent of the 1990 respondents had arranged forpickup from their safe refuge moorings; only 59 percent had conducted a dry run.
The analysis of the cross-tabulations of the data from the survey of berthed boatowner hurricane evacuation plans revealed several interesting results. First, as noted inthe pilot study, there exist three distinct geographic areas with respect to berthed boatsin Dade County. For the purposes of this study the three areas were denoted north,central, and south, The north region begins at the mouth of the Miami River andcontinues north to the Broward County line. The central region begins at the MiamiRiver and continues south to Southwest 88th Street. The south region begins atSouthwest 88th Street and continues south to the Monroe County line. These boundariesare visible on the map presented in Exhibit 1.1. The mouth of the Miami River emptiesinto Biscayne Bay at 27.77 degrees north latitude. Southwest 88th Street may be seenapproximately two miles north of the north eye wall of Hurricane Andrew.
A second point revealed by the cross-tabulations was that the three geographicregions in the County differed not only in the typical types of boats in their marinas,but also in the planning and preparation of their boat owners for hurricane evacuation.Finally, traits that are not significantly different across the various marinas included thelength of boat ownership, the decision of when to move the boat if it is to be moved,and the acquisition of insurance coverage.
The types of boats berthed in the marinas of the different geographic regionswere found to be significantly different. In the northern region, which follows theintercoastal waterway, most of the marinas are small privately owned facilities. Thetypical boat in this area is a power boat. In the central and south regions, which havedirect access to Biscayne Bay, the predominant mode of propulsion is sail. The sailboatstend to be taller, have less horsepower, and are not trailerable.
An examination of hurricane evacuation plans in the three geographic regionsrevealed several significant differences. First, with regard to whether or not the ownersplanned to move their boats, the owners in the central region, i.e. marinas in KeyBiscayne and Coconut Grove, overwhelming said they would move their boats, whilein the north and the south the majority of owners said they would not. In fact, themajority of owners in the northern region responded that they were not required tomove their boat. In the southern region, although owners admitted that they wererequired to move their boats, the majority said that they did not intend to do so.
8
Thorough preparation for an evacuation prior to a hurricane includes a practicerun to the refuge site and arranging for someone to pickup the boat captain and bringthem to their home. The responses were again significantly different on these issues.First, only a majority of owners in the central region responded that they had made adry run and that they had arranged a pickup. Neither the majority of owners in the northnor south region had made such arrangements.
Finally it was noted in the responses of the berthed boat owners that the amountof information on hurricane evacuation available at the various marinas was perceivedto be significantly different. The owners in the central region believed that informationwas generally available, while the owners in the northern region were evenly splitbetween available and not available. The owners in the southern region did not find thathurricane evacuation information was generally available.
2.1.4 Marine Traffic Modeling in the 1990 Study
In an effort to use the data obtained in the 1990 survey of berthed boat ownersto evaluate different hurricane evacuation plan scenarios, a marine traffic model wasdeveloped utilizing a geographic information system. The movement of boats frommarinas to safe harbors in the model was accomplished through the use of a networkflow model. In the network model, each marina becomes a source node supplying boatsto the network. Each safe harbor becomes a potential destination for boats in search ofa safe harbor. Connecting the sources and destinations is a marine traffic networkcontaining arcs that represent the legs of navigable marine routes.
The marine traffic flow model was then run to determine the marine trafficpatterns that would disperse all the boats to safe harbor in a minimum total distance.A run of the model was made for each marina and the results combined to determinethe total number of boats seeking safe harbor at a particular location and to determinewhere congestion may exist along the marine traffic network.
Three scenarios were proposed and executed using the marine traffic networkmodel. The first scenario was descriptive of the intended hurricane evacuation plans ofthe boat owners as measured in their survey responses. The last two scenarios wereprescriptive as assumptions are made concerning the capacities of the safe harbors and,once that capacity is reached, boat owners must seek alternative moorings.
The results of the marine traffic modeling showed that the intentions, plans, andpreparations of berthed boat owners differed significantly across the natural geographicstrata of the County’s water resources. Berthed boat owners north of the mouth of theMiami River occupying private slips did not intend to move their boats in the event ofa hurricane. Berthed boat owners in the region from the Miami River south to
9

Southwest 88th Street were generally aware of the requirement to move their boat, wereprepared to move, and had made a practice evacuation run. Owners in the countymarinas south of Southwest 88th Street, however, generally knew of the requirement toevacuate their marina, but had no intention of doing so. Judging from the tone of thewritten comments on the survey forms, many of the southern region owners felt thattheir marinas were safe refuge sites and that they could not improve their condition byevacuating.
In many cases, information, or the lack thereof, was an important factor. Thesurvey results found that berthed boat owners had significantly different perceptions ofthe availability of information concerning hurricane evacuation procedures. Only thoseowners in the central region felt that they had been given adequate information. Manyof the respondents asked for any additional information that may be available and evenoffered to pay for it. Additionally, the population had not made adequate preparationin securing mooring agreements, making practice evacuation runs, and arranging pickupat the safe refuge site.
2.1.5 Recommendations and Policy Decisions as a Result of the 1990 Study
The following recommendations were made as a result of the 1990 study andhence had some influence on what occurred in 1992 during Hurricane Andrew. First,it was recommended that the county engage in a concerted program of education of itsberthed boat owners with regard to its emergency management plan. If all countymarinas were to require the evacuation of berthed boats in the event of a hurricane, thenthe County should make every effort to inform each owner of this intention, and of theconsequences should this policy not be abided. Second, the procedures for locating asafe refuge and securing one’s boat should be readily available to all owners facingmandatory evacuation. Finally, it was hoped that the results of this study may also beused to assist the County in the determination of the efficacy of a mandatory berthedboat evacuation plan. The current policy was widely misunderstood by berthed boatowners and many aware of the mandatory evacuation policy intended to ignore it.
As a consequence of the 1990 study of the hurricane evacuation plans of berthedboat owners in Dade County, Florida and other factors, the County Planning Departmentchanged its policy requiring mandatory evacuation of the County’s marinas. TheDepartment also published and distributed a brochure to all boat ownersproviding current information on hurricane procedures.
in the county
2.2 Assessment of Hurricane Evacuation Plans - Post Andrew
Subsequent to the occurrence of Hurricane Andrew, two surveys were conducted
10
to evaluate the effectiveness of the hurricane preparedness and/or evacuation plans ofthe boat owners in Dade County, Florida. The boat owners were considered in twogroups: 1) the berthed boat owners surveyed in the 1990 study, and 2) boat owners fromthe population in general. Although the results of both survey groups are consideredhere, we first focus on the contrasts of the responses and actions of the berthed boatowners surveyed in 1990.
2.2.1 Post-Andrew Responses of the Berthed Boat Owners Surveyed in 1990
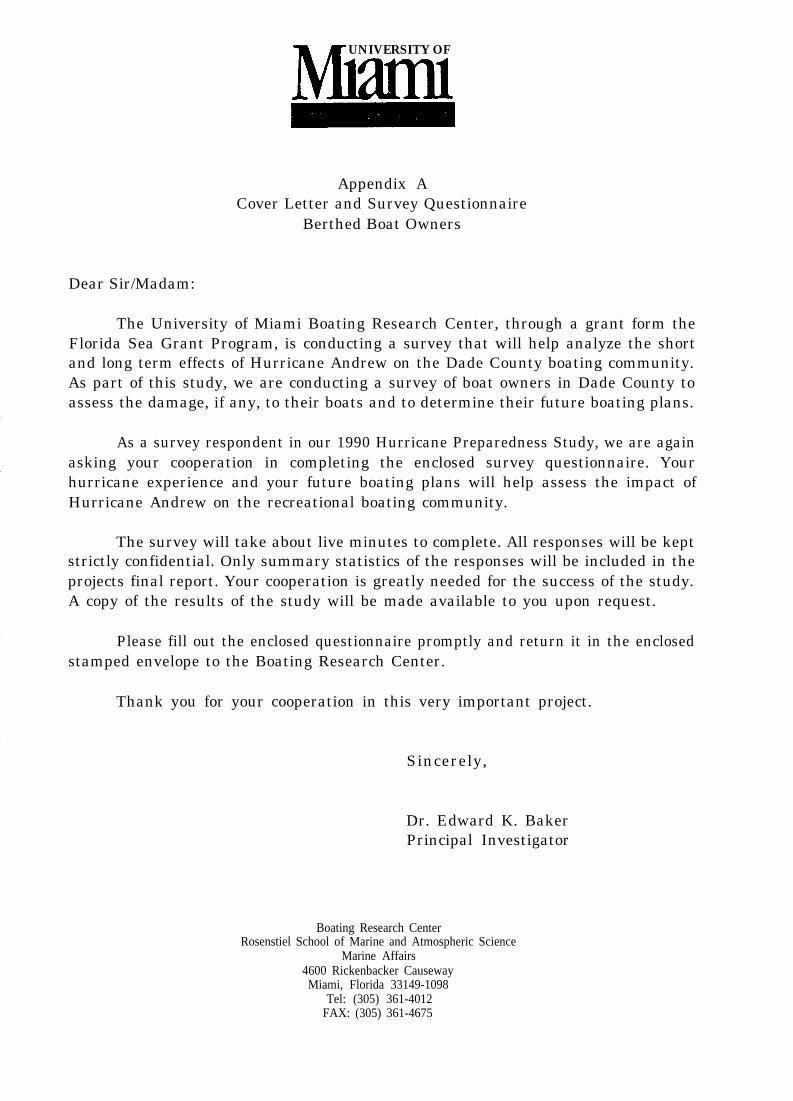
An attempt was made to trace each of the 323 berthed boat owners whoresponded to the 1990 survey through their Florida Boat Registration Number orthrough their address. From the 323 original respondent surveys, 247 mailing addresseswere obtained. Each of these boat owners was sent a personalized cover letter and copyof the 1992 post-hurricane survey questionnaire. A copy of a sample cover letter andsurvey questionnaire are presented in Appendix A. In all, 128 boat owners respondedto the 1992 survey. This is an overall response rate of 51.8 percent. Of the 128 totalresponses, 10.2 percent were from the northern region of the county, 57 percent werefrom the central region, and 32.8 percent were from the southern region. The actualpercentages of all berthed boats in each of the regions from the 1990 study were 9.5,66.3, and 24.2 respectively.
The 1992 survey addressed issues of boat characteristics, pre-hurricane boat usepatterns, hurricane planning and preparation,plans for boat repair,sections immediatelyAppendix B.
replacement and usage.following. A summary
2.2.1.1 Boat Characteristics
damage assessment, and post-hurricaneEach of these issues is discussed in theof the survey responses is presented in
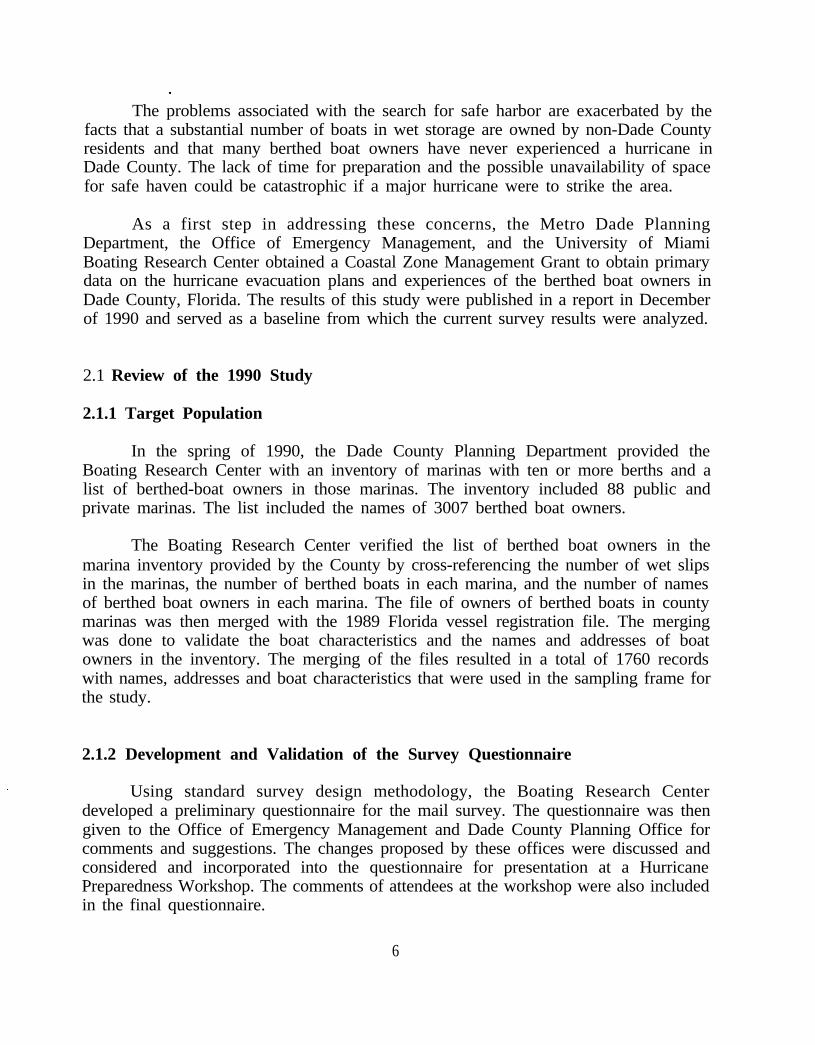
The boat characteristics of the respondents of the 1992 study were obviously verysimilar to those of the 1990 study. The frequency analysis of the responses from the1992 survey revealed that 41 percent of the respondents’ boats were 25-40 feet in lengthand the majority were powered by inboard engines or a combination of inboard and sail.The majority of boats were of model years betwee 1970 and 1985. The percentagesof 1990 berthed boat owners by length and by propulsion is presented in Exhibit 2.1.
11

Exhibit 2.1Boat Characteristics, Berthed Boat Owners
__ In Percent
LT 26 26-30 30-40 GTE 40Type of Proprloion
q OUTboard Cllnboard IEJln/Outbosrd Qs&l Daail WI inb Uhail w/ cab q other
All of the boats were originally believed to be wet berthed, however, three of therespondents indicated boats in dry storage and twelve respondents did not respond tothe question. On average, the respondents had stored their boats in their current locationfor more than five years.
2.2.1.2 Pre-Hurricane Usage Patterns
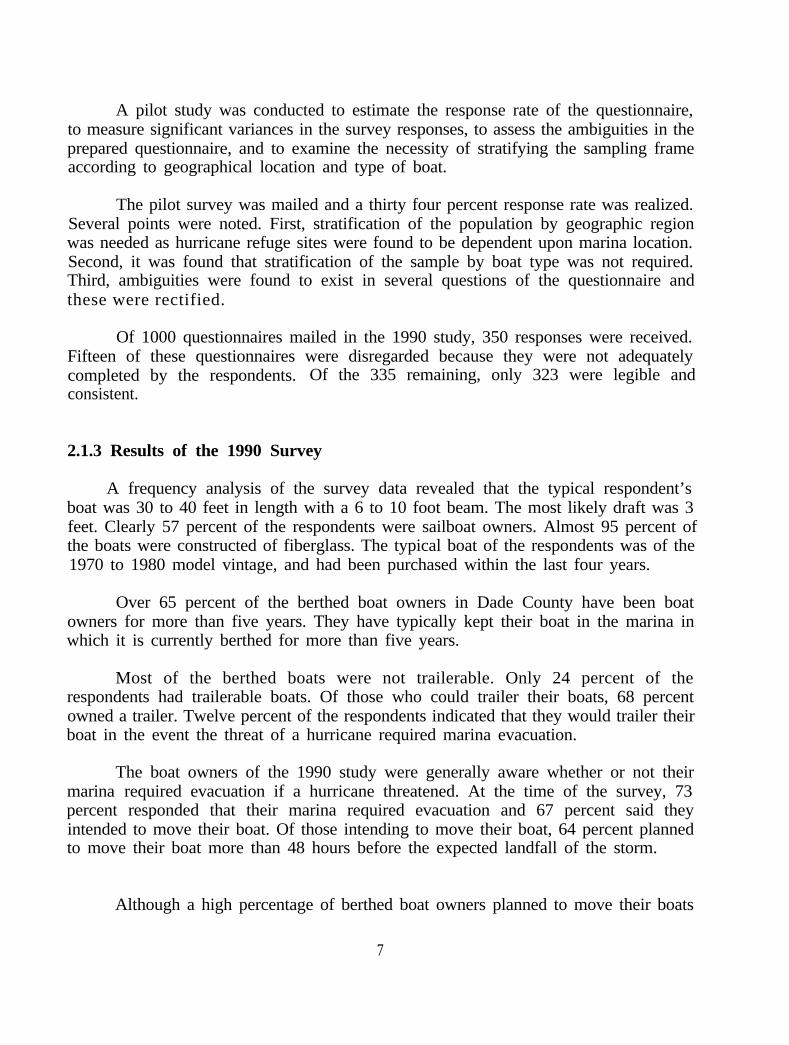
The pre-hurricane usage patterns of the 1990 berthed boat owners are presentedin Exhibit 2.2. For the summer season (April through September), most respondentsused their boats 2-4 weekend days a month. Usage on summer weekdays was less, with41 percent of the respondents saying that they did not use their boat on any summerweekdays. For the winter season (October through March), the most frequentlyoccurring response was 2-4 weekend days per month. The winter weekday pre-hurricaneusage was also less, with 50 percent of the respondents reporting that they used theirboat zero winter weekdays.
12

Exhibit 2.2Berthed Boat Owners, Pre-Hurricane
_ _ In Percent
Boat Use Patterns
80
70
60
5 0,
40
30
20
1 0
00 I 2-4 5-6 9-16 GT16
No. of Days/Month.
-SumWEnd ~SmMJay rCWlnWEnd *kinky
2.2.1.3 Hurricane Planning and Preparation
When asked whether they moved their boat prior to Hurricane Andrew, 53percent replied they did, while 45 percent said they did not. Two percent did notrespond to this question. Of the 68 respondents who moved their boat, 86 percent ofthese said they moved their boat within 48 hours of the hurricane’s landfall. Of thosewho moved their boat, 46 percent said they incurred damage. Of the respondents whodid not move their boat, 81 percent incurred damage.
2.2.1.4 Hurricane Damage and Assessment
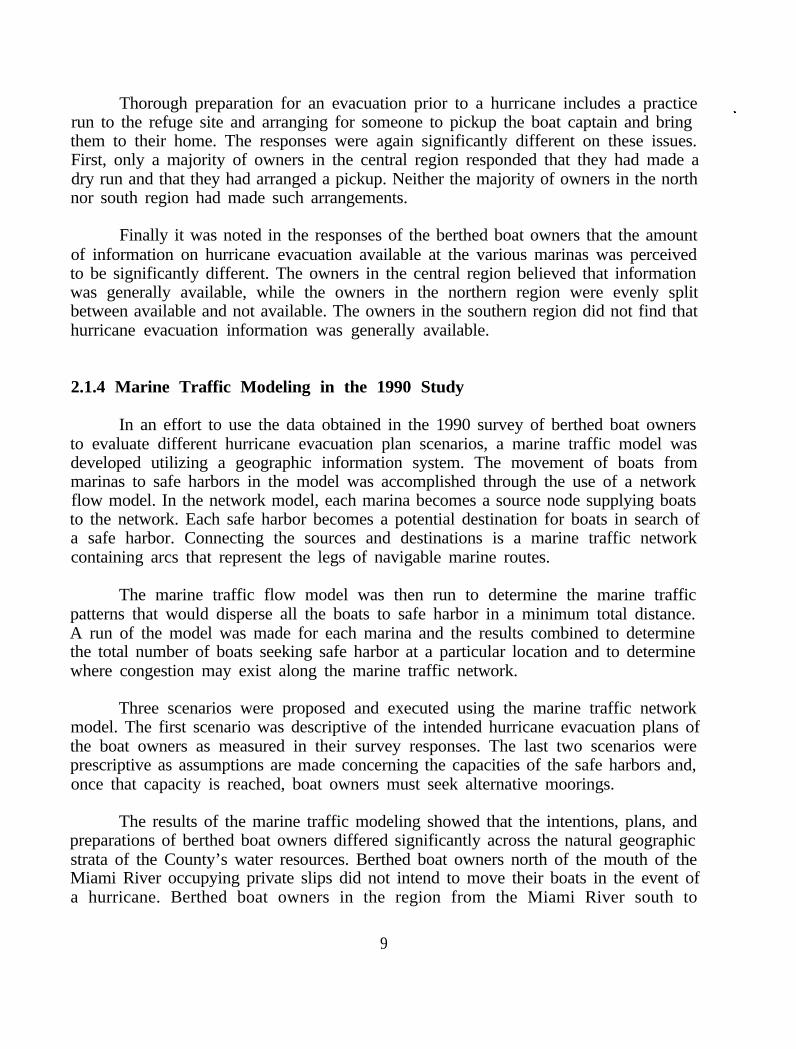
The damage that was incurred by boats was dependent upon the geographicregion in which the boat was stored during the hurricane. Exhibit 2.3 shows thepercentage of berthed boats damaged by Hurricane Andrew by geographic region andby whether or not the boats were moved.
13

Exhibit 2.3Berthed Boats, Damage During Hurricane Andrew
In Percent
North Central
ODamaged EWvtoved/Damaged
South
A profile of the damage incurred by the 1990 berthed boat owners by geographicregion is presented in Exhibit 2.4. The average amount of damage incurred was least
region. For those responding, thewas $25,625, in the central region
in the central region and greatest in the southernaverage amount of damage in the northern region$21,753, and in the southern region $29,056.
Exhibit 2.4Berthed Boats, Amount of Damage
_ __ In Percent
80
North CentralAJnwadDamage
South
ElLTlK lBl.LTsK ESLTlCK OlO.LTSK LDGlE3OK
14
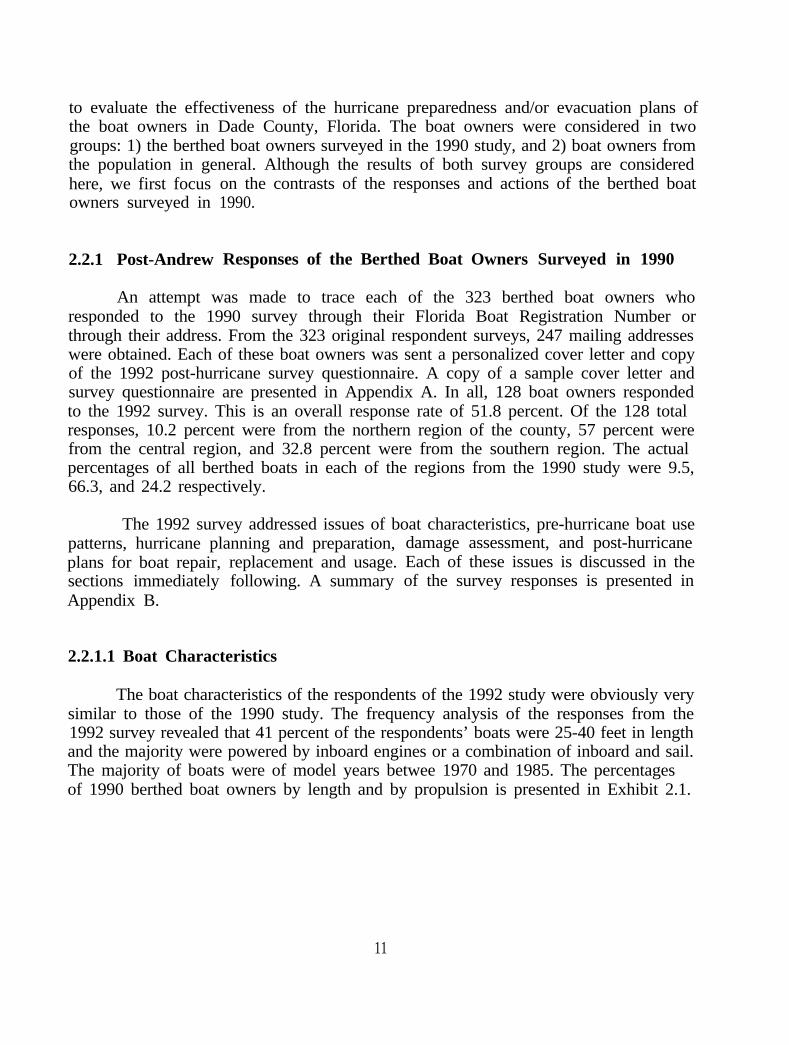
2.2.1.5 Future Boating Plans
With regard to their future boating plans, 92owners said they would continue to use their boat,Twenty six people reported that they lost their boat
percent of the 1990 berthedfive percent said they wouldin the storm. Of these 26, 17
they would replace their boat with a used one of equivalent or greater value, two
boatnot.saidsaid
they would replace their boats with new ones, five said they would not replace theirboat, and two had other responses.
The time frame for the replacement of the boats varied for the respondents.Twenty five percent of the respondents said they would replace their boat immediately,no respondent said replacement would occur in three months, 33 percent specified threeto twelve months, 25 percent specified within one to three years, and the remainder ofthe respondents did not specify a time frame. The time frame for boat replacement ofthe 1990 berthed boat owners is presented in Exhibit 2.5.
Exhibit 2.5Berthed Boats, When Boats Replaced
In Percent
North Central South
Olmmediately in 3-6 mo IZIin 6-l 2 mo
Oin 12-18 mo Elin 18-36 mo !ZlOther
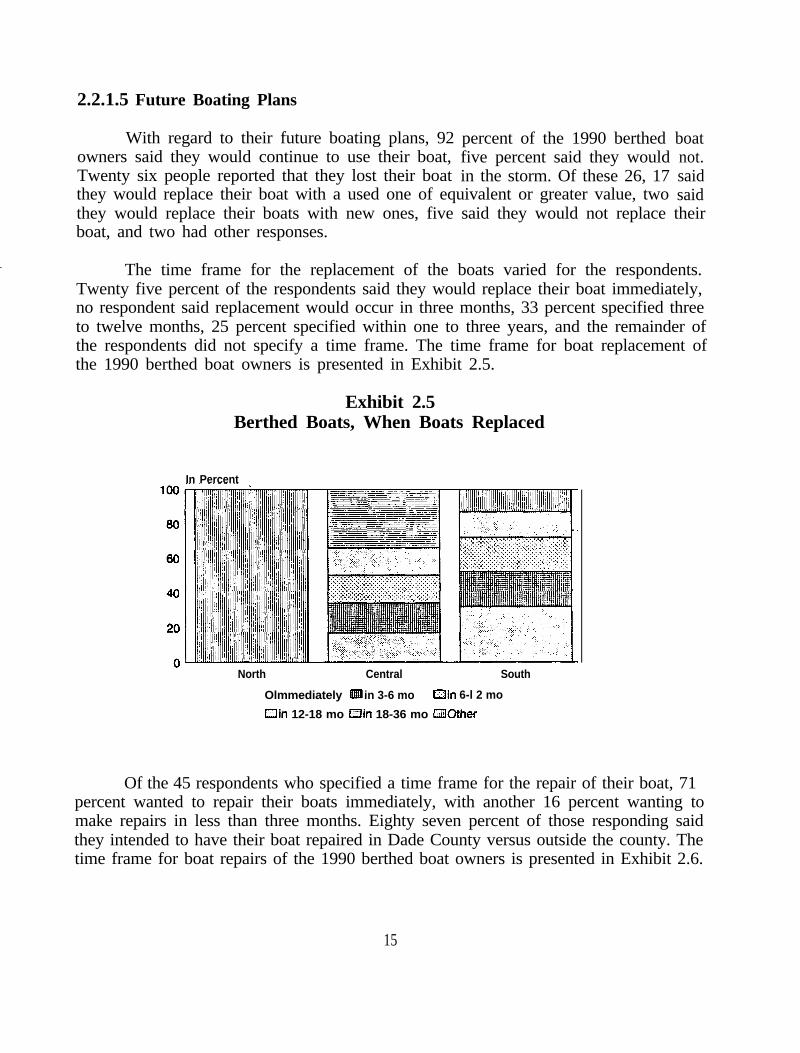
Of the 45 respondents who specified a time frame for the repair of their boat, 71percent wanted to repair their boats immediately, with another 16 percent wanting tomake repairs in less than three months. Eighty seven percent of those responding saidthey intended to have their boat repaired in Dade County versus outside the county. Thetime frame for boat repairs of the 1990 berthed boat owners is presented in Exhibit 2.6.
15
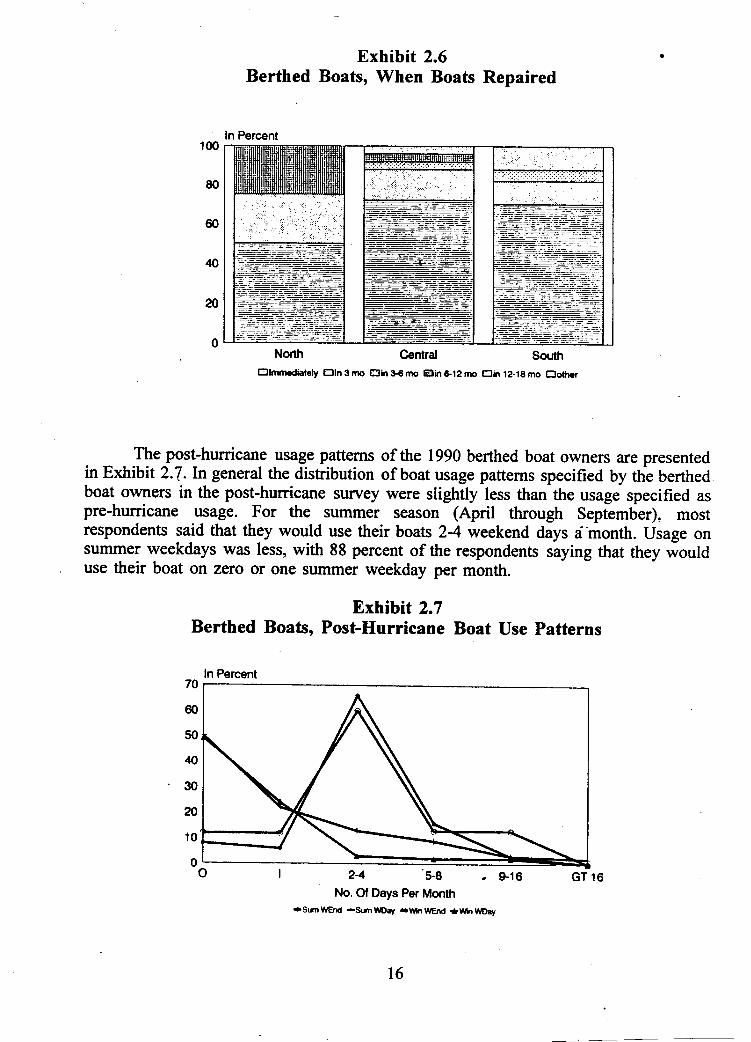
For the winter season (October through March), the most frequently occurringresponse was 2-4 weekend days per month. The winter weekday post-hurricane usagewas also less, with 73 percent of the respondents reporting that they would use theirboat zero or one winter weekdays.
2.2.2 Post-Andrew Responses of Boat Owners in General
Although the longitudinal study of berthed boat owners allowed insights to begained as to changes in hurricane planning and preparation, the majority of berthedboats were greater than 26 feet in length. Since the majority of the Dade County boatpopulation is less than 26 feet, a second survey was conducted that targeted the smallerboats.
A survey questionnaire similar to that sent to the berthed-boat owners wasdeveloped and mailed to a stratified random sample of boaters in the Dade County. Thequestionnaire and the accompanying cover letter are presented in Appendix C. Thesurvey addressed the issues of boat characteristics, hurricane preparation and planning,hurricane damage, and possible changes in boat use patterns. A summary of the surveyresponses for the general boat owners is presented in Appendix D.
2.2.2.1 Boat Characteristics
The majority of the respondents to the survey owned boats that were less than26 feet in length. The majority of the smaller boats had outboard propulsion, while thelarger boats tended to be inboard or inboard/outboards. The distribution of boats bylength and propulsion is presented in Exhibit 2.8.
Sixty one percent of the respondents said their boats were trailerable, and 41percent actually owned a trailer. These figures by length are shown in Exhibit 2.9.
The boats were typically of a model year prior to 1980 and were stored at theowner’s home. The average time the boat had been stored in that location was morethan five years. Boats less than 26 feet are predominantly stored at home, while boatslarger than 26 feet are increasingly likely to be wet berthed.
2.2.2.2 Hurricane Preparation and Planning
With regard to having a hurricane plan, 66 percent of the respondents said thatthey did, 19 percent said that they did not, and 15 percent did not respond. Thepercentage of boat owners with hurricane plans by length of boat is shown in Exhibit
17

2.10. Forty three percent of those in storage facilities who responded said that theirmarina provided them with hurricane information and 40 percent of the respondents saidthat they were required to move their boats in the event of a hurricane. These data aredisplayed in Exhibits 2.11 and 2.12.
Exhibit 2.8Boat Owners, By Boat Length and Propulsion
In Percent60
10
0LT 16 16-LT26 26-LT40 GTE 40
Type of PropulsionUOutbd IXIlnbd Clin/Out Hsail IIIlilsaiVinb ClsaiVout Brother
_.
80
Exhibit 2.9Boat Owners, Boat Trailers
In Percent
LT 16 16-LT 26 26-LT 40
ClTrailerable IkWwn Trailer
GTE 40
18

.
Exhibit 2.10Boat Owners, Hurricane Plan
In Percent100
80
60
40
20
0
7:. . . . , . . . . ,.: . ..(...,,.,._... .
, , , ,.
,;<. : ,:;::.>._>:.:_; > ‘.‘.., ,.;_ .,.;,.,.,.,. .>,::. : :..
\.., .)‘.‘ ,:; ‘. .:.:.:.
I .II ,‘
,s II I
LT 16 16-LT 26 26- LT 40
OYes BillNo IZINo Resp
GTE 40
Exhibit 2.11Boat Owners, Marina Information
50
40
30
20
10
0
In Percent60-
LT 16 16-LT 26 26-LT 40 GTE 40
Of the 250 respondents, 85 said they moved their boat prior to HurricaneAndrew, while 146 did not. Nineteen did not respond. Only three boats were movedmore than 48 hours before the hurricane struck. Exhibit 2.13 shows the distribution bylength of when the boats were moved.
19

Exhibit 2.12Boat Owners, Boats Required to be Moved
In Percent60
5 0
40
30
20
10
0LT 16 16-LT 26 26-LT 40
Exhibit 2.13Boat Owners, When Boats Were Moved
80
60
40
20
0
In Percentloo-
LT 16 16-Lt 26 26-Lt 40 GTE40
I949-72 hrs B 24-48 hrs iZB LT 24 hrs
20
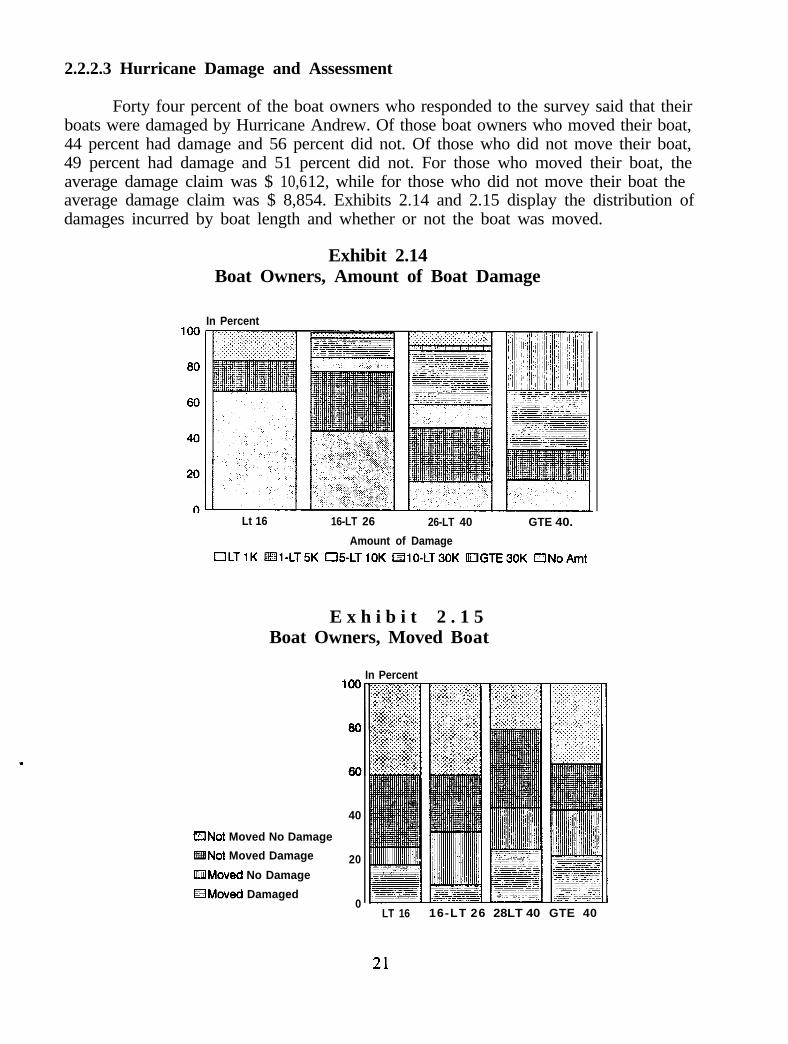
2.2.2.3 Hurricane Damage and Assessment
Forty four percent of the boat owners who responded to the survey said that theirboats were damaged by Hurricane Andrew. Of those boat owners who moved their boat,44 percent had damage and 56 percent did not. Of those who did not move their boat,49 percent had damage and 51 percent did not. For those who moved their boat, theaverage damage claim was $ 10,612, while for those who did not move their boat theaverage damage claim was $ 8,854. Exhibits 2.14 and 2.15 display the distribution ofdamages incurred by boat length and whether or not the boat was moved.
Exhibit 2.14Boat Owners, Amount of Boat Damage
In Percent
Lt 16 16-LT 26 26-LT 40 GTE 40.
Amount of DamageOLTlK EEll-LT5K 05-LTlOK tZilO-LT30K UZUGTE30K aNoAmt
E x h i b i t 2 . 1 5Boat Owners, Moved Boat
In Percent_ __
40
BNot Moved No Damage
IiHNot Moved Damage 20UWvloved No Damage
tZtMoved Damaged0
LT 16 16-LT 26 28LT 40 GTE 40
Forty four percent of the respondents said that they had insurance on their boat,but only 16 percent said they thought the insurance would cover the damage incurred.
Of the 15 respondents who lost their boat in the hurricane and are planning toreplace their boat, only two plan to replace their boat with a new boat, while elevenplan to replace with a used boat. Eighty percent of the respondents said they plan toreplace their boat with one of equal or greater value.
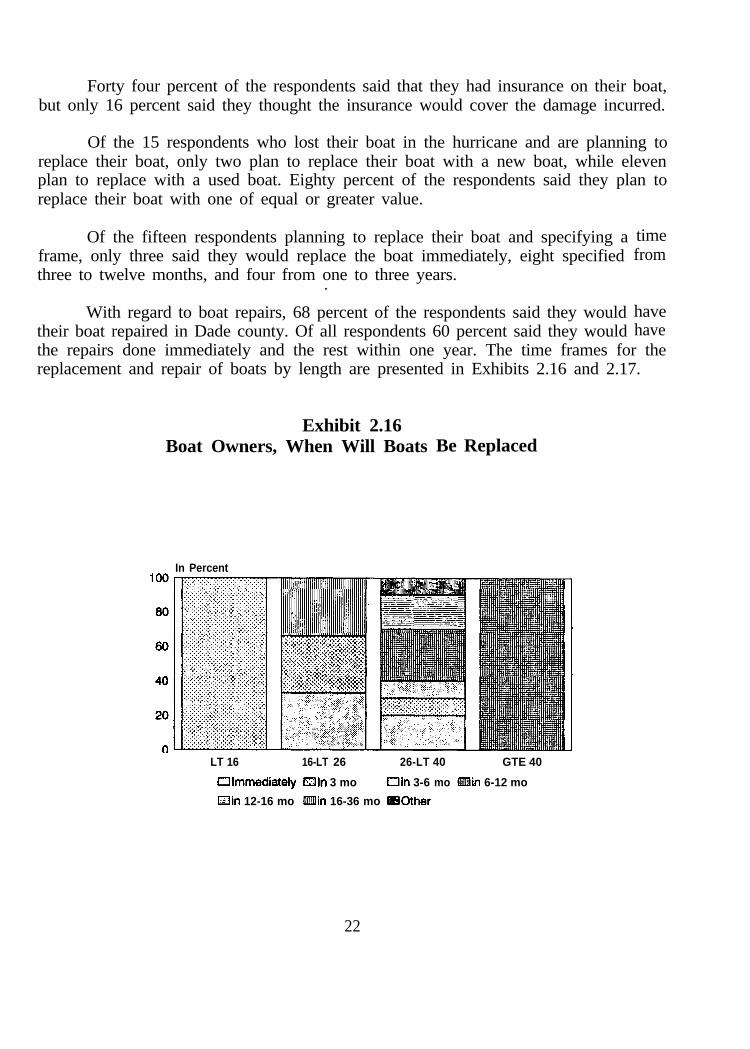
Of the fifteen respondents planning to replace their boat and specifying aframe, only three said they would replace the boat immediately, eight specifiedthree to twelve months, and four from one to three years..
With regard to boat repairs, 68 percent of the respondents said they wouldtheir boat repaired in Dade county. Of all respondents 60 percent said they would
havehave
the repairs done immediately and the rest within one year. The time frames for thereplacement and repair of boats by length are presented in Exhibits 2.16 and 2.17.
timefrom
Exhibit 2.16Boat Owners, When Will Boats Be Replaced
In Percent
LT 16 16-LT 26 26-LT 40 GTE 40
Olmmediately EClln 3 mo Oin 3-6 mo BiBlin 6-12 mo
ain 12-16 mo Uil!ilin 16-36 mo lIDOther
22
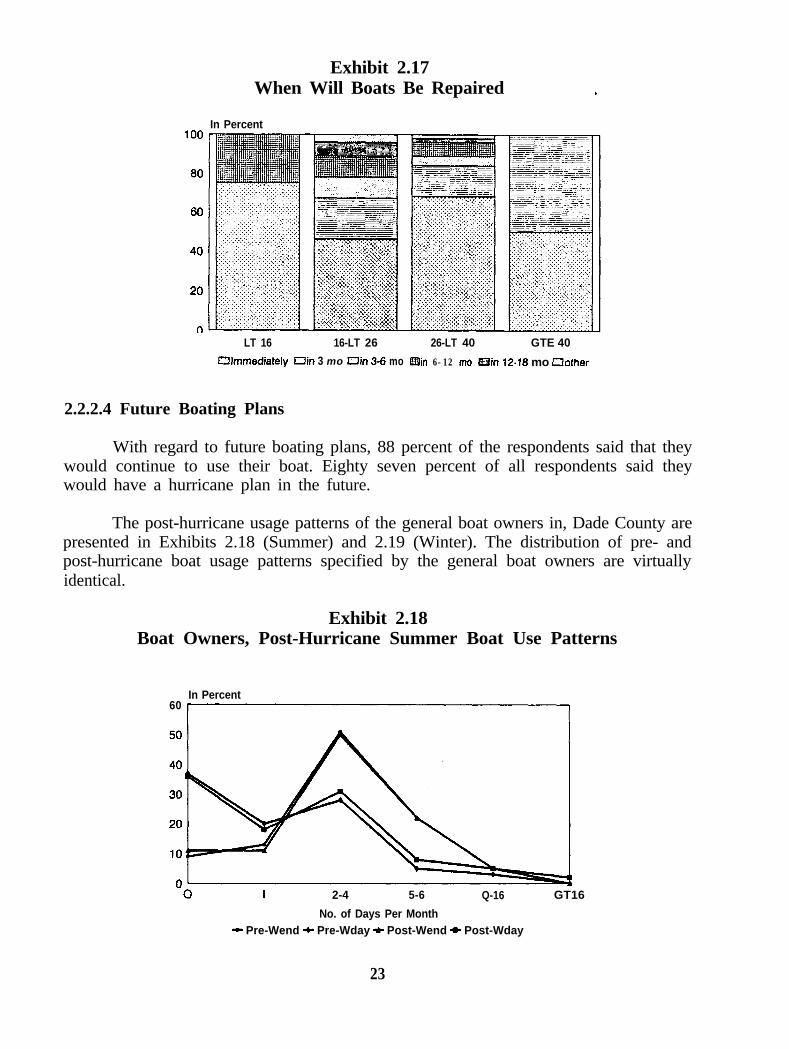
Exhibit 2.17When Will Boats Be Repaired
In Percent
- -
LT 16 16-LT 26 26-LT 40 GTE 40~htrf’i8diat8ly ain 3 mo Clin 3-6 mo EZlin 6-12 mo Bin 12-18 mo mother
2.2.2.4 Future Boating Plans
With regard to future boating plans, 88 percent of the respondents said that theywould continue to use their boat. Eighty seven percent of all respondents said theywould have a hurricane plan in the future.
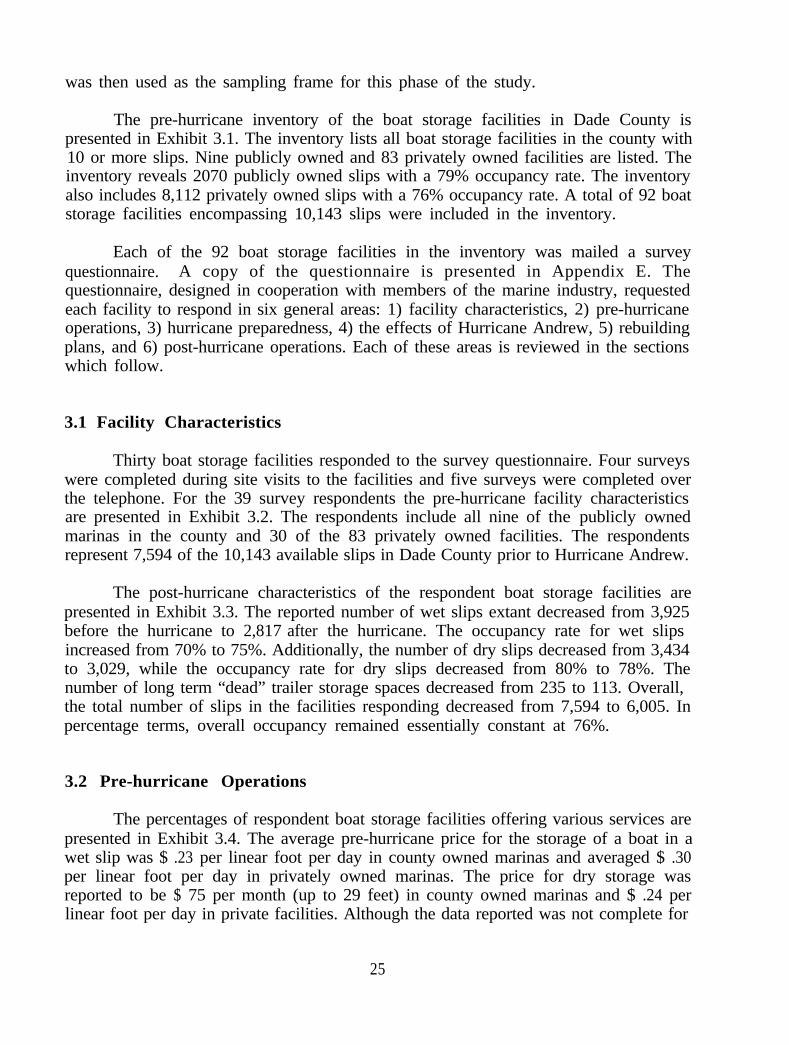
The post-hurricane usage patterns of the general boat owners in, Dade County arepresented in Exhibits 2.18 (Summer) and 2.19 (Winter). The distribution of pre- andpost-hurricane boat usage patterns specified by the general boat owners are virtuallyidentical.
Boat Owners, Post-Hurricane Summer Boat Use PatternsExhibit 2.18
In Percent60
I 2-4 5-6 Q-16 GT16
No. of Days Per Month- Pre-Wend + Pre-Wday * Post-Wend * Post-Wday
23

Exhibit 2.19Boat Owners, Post-Hurricane Winter Boat Use Patterns
In Percent60 ,
0 I 2-4 5-6No. Of Days Per Month
9-16 GT16
A Pre-Wend + Pre-Wday -+ Post-Wend * Post-Wday
The frequencies of both the summer and winter usage patterns for the generalpopulation of boat owners show similar patterns over the range of values surveyed. Thepatterns are also similar to the patterns specified by the berthed boat owners. Thefrequency of use of the berthed boat owners, however, is slightly greater than that ofthee general boating population. The fact that boat usage has in fact remained constanthas been corroborated by data obtained from talking with dockmasters in the county.
3.0 Survey of Dade County Marinas and Boat Storage Facilities
The inventory of marinas used in this study was the result of three previousreports. First, the Submerged Lands Section of the Division of State Lands of theBureau of State Lands Management prepared a report entitled “An Inventory of Multi-Slip Docking Facilities in Florida” in 1984. This document listed all marinas in the stateat that time, reporting number of slips, wet and dry, occupancy rates, and servicesavailable. The second data source employed was a May 8, 1992 draft of the DadeCounty Manatee Protection Plan prepared by the Department of EnvironmentalResources Management. This report listed number of slips and occupancy rates for allmarinas, boat yards, and ports in the county. Finally, a marina inventory used as partof a marina siting study performed by the Boating Research Center at the University ofMiami was utilized. This final study, completed in July of 1992, considered only wetand dry berthed marinas. Boat yards and the Port of Miami were not included in thislisting. As a validation measure, all county and city owned marinas and all privatelyowned marinas with more than 100 slips were surveyed by telephone to confirm thenumber of slips, wet or dry, and the pre-hurricane occupancy rates. This final inventory
24
was then used as the sampling frame for this phase of the study.
The pre-hurricane inventory of the boat storage facilities in Dade County ispresented in Exhibit 3.1. The inventory lists all boat storage facilities in the county with10 or more slips. Nine publicly owned and 83 privately owned facilities are listed. Theinventory reveals 2070 publicly owned slips with a 79% occupancy rate. The inventoryalso includes 8,112 privately owned slips with a 76% occupancy rate. A total of 92 boatstorage facilities encompassing 10,143 slips were included in the inventory.
Each of the 92 boat storage facilities in the inventory was mailed a surveyquestionnaire. A copy of the questionnaire is presented in Appendix E. Thequestionnaire, designed in cooperation with members of the marine industry, requestedeach facility to respond in six general areas: 1) facility characteristics, 2) pre-hurricaneoperations, 3) hurricane preparedness, 4) the effects of Hurricane Andrew, 5) rebuildingplans, and 6) post-hurricane operations. Each of these areas is reviewed in the sectionswhich follow.
.- 3.1 Facility Characteristics
Thirty boat storage facilities responded to the survey questionnaire. Four surveyswere completed during site visits to the facilities and five surveys were completed overthe telephone. For the 39 survey respondents the pre-hurricane facility characteristicsare presented in Exhibit 3.2. The respondents include all nine of the publicly ownedmarinas in the county and 30 of the 83 privately owned facilities. The respondentsrepresent 7,594 of the 10,143 available slips in Dade County prior to Hurricane Andrew.
The post-hurricane characteristics of the respondent boat storage facilities arepresented in Exhibit 3.3. The reported number of wet slips extant decreased from 3,925before the hurricane to 2,817 after the hurricane. The occupancy rate for wet slipsincreased from 70% to 75%. Additionally, the number of dry slips decreased from 3,434to 3,029, while the occupancy rate for dry slips decreased from 80% to 78%. Thenumber of long term “dead” trailer storage spaces decreased from 235 to 113. Overall,the total number of slips in the facilities responding decreased from 7,594 to 6,005. Inpercentage terms, overall occupancy remained essentially constant at 76%.
3.2 Pre-hurricane Operations
The percentages of respondent boat storage facilities offering various services arepresented in Exhibit 3.4. The average pre-hurricane price for the storage of a boat in awet slip was $ .23 per linear foot per day in county owned marinas and averaged $ .30per linear foot per day in privately owned marinas. The price for dry storage wasreported to be $ 75 per month (up to 29 feet) in county owned marinas and $ .24 perlinear foot per day in private facilities. Although the data reported was not complete for
25

Exhibit 3.1Pre-Hurricane Andrew Inventory of
Boat Storage Facilities, Dade County
City/Cnty Owned FacilitiesBlack PointCrandon ParkDinner Key MarinaHaulover ParkHomestead BayfrontMatheson HammockMiamarinaPelican HarborSubtotal
Other Facilities5660 Collins CondoApache MarineAranow Power BoatsAventura MarinaBal Harbour Yacht ClubBanyan Bay AptsBasset Sea Ray MarinaBiscayne Bay Marriot MarinaBiscayne Bay Yacht ClubBlue Marlin MarinaBrickell Bay VillageBrickell Biscayne Bay CondoBrickell Harbor CondoBrickell Place MarinaCarriage House CondoCastaways MarinaCauseway 79 MarinaCoastal TowersCoconut Grove SailingCocoplum Yacht Club
Club
Commodore Towers PlazaCoral Reef Yacht ClubCosta BravaEden Rock HotelFisher Island Club and MarinaFort Apache Marina IncForte TowersFountainbleau HotelFour Ambassadors MarinaFPL Docking FacilitiesGables Harbor CondoGables Waterway Exec. CenterGables Waterway TowersGrove Isle MarinaGrove Key MarinaHarbor West AptsHaulover Resort MarinaHi Lift MarinaImperial House CondoIndian Creek Club and MarinaInternational Yacht HarborJockey ClubKey Biscayne Yacht ClubKeystone Point MarinaKing Cole condoKings Bay Yacht Club
No. of Slips %Occupied209 0.92414 1 .00582 0.93
44 0.39194 0.44323 0.95167 0.1598 0.25
2031 0.79
No. of Slips %Occupied10 0.0012 1.0010 1.0027 0.8937 0.5050 0.2632 0.63
221 0.60123 1.27
10 1.0013 0.6217 1 .0012 1 .0067 0.7513 1 .0013 0.46
267 1 .0033 0.94
244 1 .00176 0.8220 0.50
169 1 .0030 0.2017 0.82
106 0.28204 0.65
12 1.0023 0.0036 0.6189 1 .0023 1 .0031 1 .0027 1 .0085 0.69
328 1 .0033 0.73
325 0.80269 0.82
10 0.8012 0.17
376 0.3040 0.66
100 1 .00475 0.95
32 0.31 290 0.90
26

Little River Marina 20 1.00L’Hermitage 15 0.40Manhattan Towers 16 0.69Marine Management 300 0.91Marine Plaza Apts 22 1 .00Mariners Bay Condo 28 0.50Maule Lake Marina 375 0.60Miami Yacht Club 212 1 .00Monty Trainers Dock and Bar 150 0.93Morton Towers 26 0.19Nine Island Ave. 36 1.00Palm Bay Yacht Club 43 0.33Pirate Spa Marina 45 1.00Racquet Club 19 0.68Rickenbacker Marina 170 0.60River Run Marina. 81 1 .00Royal Harbor Yacht Club 49 0.90Seacoast East Condo 10 0.00Seacoast Towers 15 0.20Seacoast Towers South 22 0.27Snapper Creek Marina 50 0.94Snug Harbor Townhouse 25 0.28South Bay Condo 15 0.93South Gate Towers 15 0.93Spinnaker Marina 487 0.67Sunny Isles Marina 282 0.90Sunset Harbor Marina 125 0.44Tower House Condo 17 0.29Towers of Quayside 63 0.32Turnberry Isle Yacht Club 117 0.26Villa Regina Condo 43 0.47Virginia Key Marina 460 0.70Waterways Marina 99 0.72Water’s Edge Condo 18 1 .00Watson Island Marina 43 1 .00Winston Towers Yacht Basin Inc 50 0.90Subtotal 8112 0.76
Total 10143 0.77
Data Based on:
1. “1984 Inventory of Multi-Slip Docking Facilities in Florida” by the Division of State Lands, Bureauof State Lands, Bureau of State Lands Management, Submerged Land Section.2. “Draft of Dade County Manatee Protection Plan” by Dade County Department of EnvironmentalResources Management, May 8, 1992.3. “Marina Siting Evaluation Model Study” of Boating Research Center, University of Miami-RSMAS,May-July 1992.
27
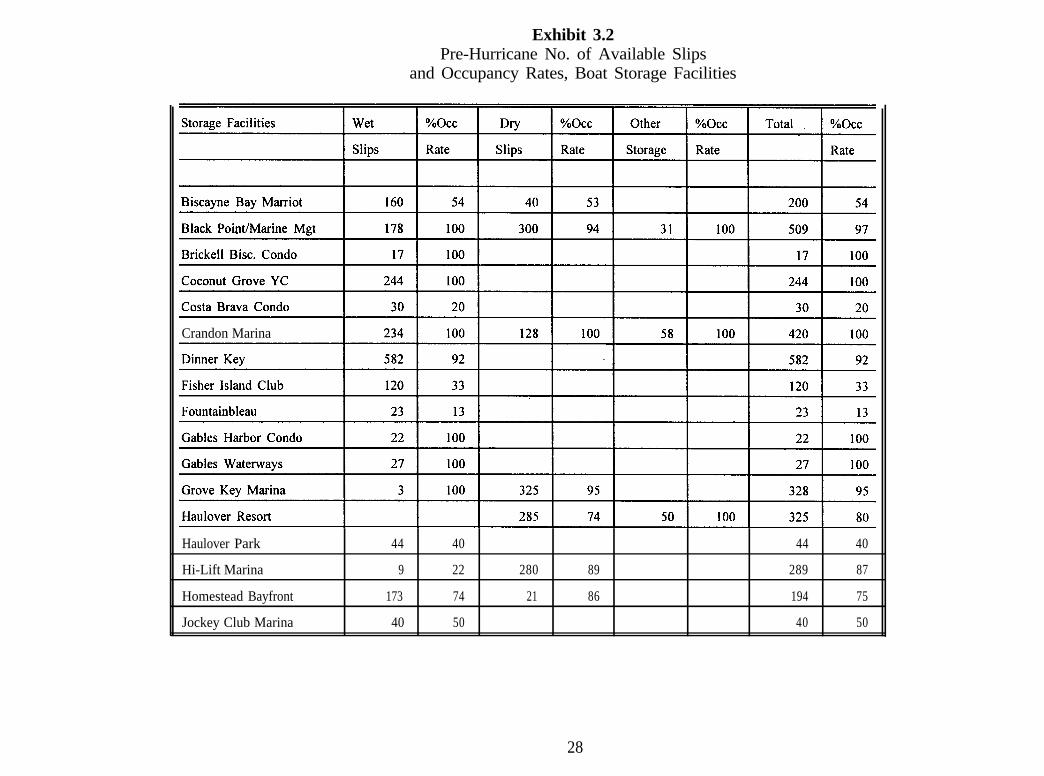
Exhibit 3.2Pre-Hurricane No. of Available Slips
and Occupancy Rates, Boat Storage Facilities
Crandon Marina
Haulover Park 44 40 44 40
Hi-Lift Marina 9 22 280 89 289 87
Homestead Bayfront 173 74 21 86 194 75
Jockey Club Marina 40 50 40 50
28


Storage Facilities Wet %Occ Dry %Occ Other %Occ Total %Occ
Keystone Point
Marine Plaza Apts
Maule Lake Marina
Miami Beach Marina
Miami Yacht Club
Morton Tower
Nine Island Condos
Palm Bay Marina
Pelican Harbor
Royal Harbor YC
Rickenbacker Causeway
River Run YC
Spinnaker Marina
Sunny Isles Marina
Sunset Harbor Marina
* Villa Regina
Virginia Key
Waterways Marina
Winston Towers
25 80 450 96 475 95
30 100 30 100
165 55 200 30 365 41
395 75 395 75
44 100 180 56 224 64
48 17 48 17
36 22 36 22
22 5 22 5
98 59 98 59
48 94 48 94
170 100 170 100
81 100 81 100
20 100 425 65 25 60 470 68
20 100 250 100 270 100
125 100 50 100 175 100
460 61 460 61
99 42 99 42
50 60 50 60
Total 2817 70 3029 78 113 91 6005 76
31

all survey respondents, the average number of full-time employees per facility waseight, while the average number of part-time employees was two.
Exhibit 3.4Boat Storage Facilities, Services Offered
In Percent100
t
80
60
EElFlFood BSupplies ElPhone fZKlestaurant ClElectricitya Sewage El Repairs m Fuel WOthers
3.3 Hurricane Preparedness
The hurricane preparedness section of the survey investigated the boat storagefacilities’ requirements of boat owners as to insurance, hurricane plans, and evacuationprocedures. The facilities’ requirements for the boat owners’ insurance is shown inExhibit 3.5. Hull insurance was required by 48 percent of the wet berth facilities and56 percent of the dry berth facilities. Liability insurance was required by approximately61 percent of the wet storage facilities and 67 percent of the dry storage facilitiesresponding.
In terms of having a hurricane plan, 85 percent of the wet berth facilities and 89percent of the dry storage facilities reporting said that they had a hurricane plan. Ofthose facilities with a plan, 62.5 percent of both the wet berth and the dry storagefacilities said they distributed their plan to the boat owners. These results are shown inExhibit 3.6.
32
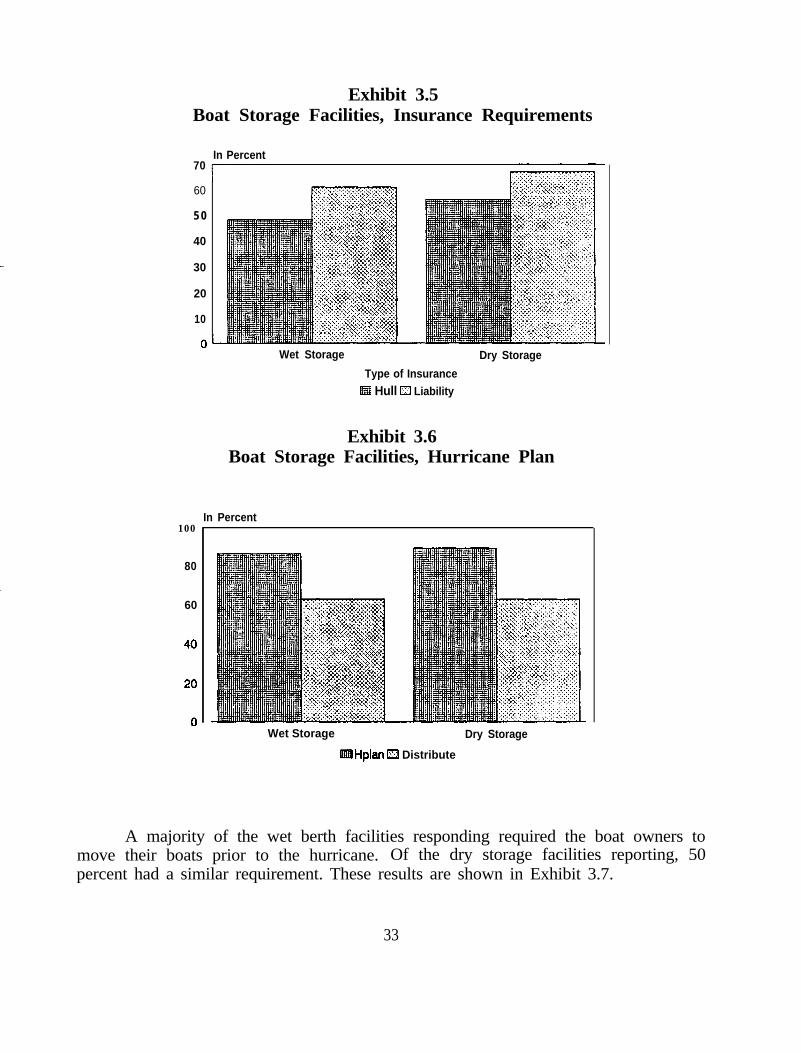
Exhibit 3.5Boat Storage Facilities, Insurance Requirements
In Percent70
:~:.i?:.‘.:.~:.:;-.:.:.~.~.V..C.,O.....“h~.....~.~.~60
5 0
40
30
20
10
100
80
60
Wet Storage Dry StorageType of Insurance
IEil Hull Fl Liability
Exhibit 3.6Boat Storage Facilities, Hurricane Plan
In Percent
Wet Storage Dry Storage
Hplan IB Distribute
A majority of the wet berth facilities responding required the boat owners tomove their boats prior to the hurricane. Of the dry storage facilities reporting, 50percent had a similar requirement. These results are shown in Exhibit 3.7.
33

Exhibit 3.7Boat Storage Facilities, Require Move Boats
In Percent70
60
5 0
40
30
20
10
0Wet Storage Dry Storage
3.4 The Effects of Hurricane Andrew
Of the boat storage facilities responding, 80 percent of the wet berth facilities and77 percent of the dry storage facilities incurred damage. The amount of damage incurredby the facilities was dependent upon many factors and thus ranged from no damage toseveral millions of dollars. Of the boat storage facilities reporting, 32 of 39 said theyhad damage. Of those reporting damage, 18 specified an amount. A profile of theamounts of damage reported by the respondents is presented in Exhibit 3.8.
Exhibit 3.8Boat Storage Facilities, Amount of Damage
In Percent100
80
60
20
0Wet Storage Dry Storage All Facilities
&Zl Lt 1 OK I3 1 0-Lt 50K UliI50-Lt 1 OOK IiBd 1 00-LT 500K =GTE 50K
34

Generally, the boat storage facilities had insurance to help cover their damages.Ninety percent of the wet berth facilities had insurance, while 100 percent of the drystorage facilities reporting had insurance. Although the facilities frequently had liabilitycoverage, a lesser number had business interruption insurance. These insurance figuresare presented in Exhibit 3.9.
100
80
60
Wet Storage
Insurance
3.5 Rebuilding Plans
Ir
Exhibit 3.9Boat Storage Facilities, Insurance Coverage
i Percent
Dry STorage
EElBusiness Inter. Ins
All of the boat storage facilities responding to the survey said that they wouldrebuild their facilities damaged by Hurricane Andrew. Uniformly the dry storagefacilities said that they would rebuild immediately. The wet berth facilities also intendedto rebuild quickly. Fifty-two percent of the wet berth facilities responding said theywould rebuild immediately and the rest within 18 months. These statistics are reportedin Exhibit 3.10.
E x h i b i t 3 . 1 0Boat Storage Facilities, Rebuilding Plans
In Percent100
80
Wet Storage Dry Storage
IZllmmediately Elln 3 mo lIlGlin 3-6 mo
win 6-12 mo Elin 12-18 mo mother
35
4.0 Boat Yards, Boat Dealers, and Boat Manufacturers
With the help of marine industry representatives questionnaires were designed tobe sent to boat yards, boat dealers, and boat manufacturers in Dade County, Florida.Reasonable results were obtained from the boat yards, however, the response rate wasextremely low and questionnaires were often only partially completed from the boatmanufacturers, and no responses were received from the boat dealers. Each of theindustry sectors is considered below.
4.1 Boat Yards
Seventeen boat yards were identified in Dade County, Florida and each was senta survey questionnaire. The list of boat yards surveyed is presented in Exhibit 4.1. Acopy of the survey questionnaire is presented in Appendix F. Eight responses werereceived from the boat yard population for a 47 percent response rate. The questionnaireaddressed the areas of boat yard characteristics, pre-hurricane operations, HurricaneAndrew damage assessment, rebuilding plans, and post-hurricane operations.
Exhibit 4.1List of Boat Yards Surveyed
Anchor MarineAtlantic Aero Marine Assoc.Atlantic Marine Boat YardBimini Boat Yard of MiamiBojean Boat YardCoastal Marine WaysCoffey’s Marine, Inc.Glass Tech Corp.
Grove Key MarinaJones Boat Yard & Dry DockLa Coma Marine, Inc.Las Americas Marine Inc.Merrill-Stevens Dry Dock Co.Dinner Key BoatyardNorseman Shipbuilding Corp.Nuta’s Boat YardPoland Yacht Basin
4.1.1 Boat Yard Characteristics and Pre-hurricane Operations.
Of the eight boat yards responding to the survey, six are located along the MiamiRiver. The number of full-time employees at the facilities ranged from three to seventy.The number of part-time employees ranged from zero to twenty. The monthly salariespaid by the boat yards responding ranged from $4,400 to $270,000 per month. Theaverage number of repairs made per month prior to Hurricane Andrew ranged
36
from six to thirty three. There were insufficient data to report typical figures for theaverage cost of a repair made. The sources of materials and supplies used in the repairswere approximately equally obtained from Dade and Broward counties, however, oneyard reported obtaining 25 percent of its materials from out of state.
4.1.2 Hurricane Andrew Damage Assessment and Rebuilding Plans
With regard to damages incurred during Hurricane Andrew, the property damageassessments ranged from zero to $120,000 with a median of $6,000. Exactly half of thesurvey respondents had property insurance, covering from fifty percent to 100 percentof the damage incurred. Only 25 percent of the facilities had business interruptioninsurance. One facility reported being closed for one month, another reported beingwithout electricity for two weeks.
Of the three facilities responding that rebuilding was necessary, two planned torebuild immediately and the other within twelve to 18 months.
4.1.3 Post-Hurricane Andrew Operations
All of the respondents had hired more full-time employees in their post-hurricaneoperations. The range of full-time employees was from four to 90. Each of the facilitiesresponding was able to identify hurricane related repairs above their regular level ofrepair and maintenance work. The reported percentages of hurricane related business tototal business varied from 33 percent to 71 percent. For those facilities providing pre-hurricane and post-hurricane repair data, the number of repairs was up 13 percent afterthe hurricane. The timing of the repairs showed that there was a dramatic increase inthe month of September, however, the repairs in October and November were less thanthe previous year. Repairs for December through January were again above the pre-hurricane levels.
4.2 Boat Dealers
With the help of marine industry representatives,identified for the purposes of this study. Each dealership
15was
boat dealerships werecontacted by phone to
verify their efficacy and to establish a personal contact. Each dealership was then senta survey questionnaire by mail or, as nine dealers had requested, the survey was sentby FAX. The list of boat dealers surveyed is presented in Exhibit 4.2. A copy of thesurvey questionnaire and the accompanying cover letter is presented in Appendix G.The questionnaire addressed the areas of boat yard characteristics, pre-hurricaneoperations, Hurricane Andrew damage assessment, rebuilding plans, and post-hurricaneoperations.
37

Exhibit 4.2
List of Boat Dealership Surveyed
ABC MarineBassett Boat Co.Bayflite Marine, Inc.Boat Center of MiamiBob Hewes BoatsChampion Marine, Inc.D.O.S. MarineDixie Marine
Fisherman’s ParadiseGables MarineGateway MarineHilift MarinaJohnson-Kirby, Inc.Langer’s MarinePerformance MarineSunny Isles Marina
Despite the efforts of the researchers, no completed surveys were returned.Immediately following all FAX transmissions, follow-up phone calls were conductedto encourage responses. Telephone follow-up calls were made ten days later to allboat dealers who had not responded. At that time, questionnaires were resent andphone interviews were conducted to determine the reason for the lack of responses.
The reasons for the lack of response were varied, however, several commonthemes emerged. First, the dealerships felt they were too busy to take the time tocomplete the survey. Second, the owners were often out of town and the employeesdid not have access to the needed information. A final reason was that the surveywas not applicable because the dealership had experienced no serious damage fromHurricane Andrew and they saw no change in business since the hurricane. Oneboat dealer interviewed said he anticipated a positive business response, but that itwould be delayed until boat owners had repaired the other pieces of their lives suchas homes and businesses. This may be a topic for future investigation.
Dealerships form an important link in the chain of marine service industries.The lack of survey data from boat dealerships is a weakness of this study. Given theineffectiveness of standard survey methodology in this case, future studies shouldseek to employ alternative methods to obtain information on the boat dealer sector ofthe recreational boating industry.
4.3 Boat Manufacturers
With the assistance of the leaders of the recreational boat manufacturingindustry in Dade County, a list of 81 boat manufacturers was compiled for thisstudy. Each manufacturer was contacted by phone to inform them of the survey, to
38
-
-
-
-
-
-
-
-
-
-
-
verify their current address, and to identify a contact person for the mail survey.Of the 81 manufacturers initially identified for the study, the list was
eventually reduced to 34 participants. These reductions occurred for a number ofreasons. First, a number of the manufacturers on the initial list were actually locatedoutside of Dade County. Second, 16 businesses had disconnected telephones with noforwarding number. Finally, a few on the original list were small, one or two person,operations custom building l-3 boats per year. A list of the manufacturers contactedin the study is provided in Exhibit 4.3.
List of Boat Manufacturers Surveyed
AcrylicraftAirboat HeadquartersAngler Boat Corp.Answer MarineAirboat ServiceApache Performance BoatsAdvance PowerboatsBlackfin Yacht Corp.Bobby Moore’s CustomMarine
Cigarette Racing TeamContender Boats Inc.Corsa Marine Ltd.Crusader BoatsClassic Water CraftConcept BoatsCondor Powerboats Inc.Dolphin Boat Mfg.
Dusky Sport Fishing BoatsGreat Boat CompanyInternational Marine MfgMagnum MarineNovurania of America Inc.P & D ClassicOffshore Boat Corp.Pantera Power BoatsPhoenix Marine Inc.Sea Taxi YachtsStapleton Boat Corp.Tamair Speed MarineMako Marine Inc.Avanti Powerboats Inc.Best Yacht RepairVIP Marine Industries Inc.Whitewater
Exhibit 4.3
A copy of the survey questionnaire and the accompanying cover letter ispresented in Appendix H. The questionnaire addressed the areas of boat yardcharacteristics, pre-hurricane operations, Hurricane Andrew damage assessment,rebuilding plans, and post-hurricane operations.
A telephone follow-up was conducted ten days after the initial mailing, toensure that the manufacturers had received the survey questionnaire, to encouragemanufacturers to respond to the survey, and to offer assistance in filling out thequestionnaire. To further encourage responses, repeated telephone contact was madewith the participating boat manufacturers and questionnaires were resent, after
-
39
addresses and contact names had been verified, to those who had lost them or didnot recall receiving them. Ten days following the second mailing, final phoneinterviews were conducted with the manufacturers who had failed to respond and theresearchers asked if the manufacturer would take a few moments to answer the mostimportant questions on the survey over the phone and to determine the reason for thelow response rate.
Despite the repeated efforts by the researchers only four survey questionnaireswere eventually returned, and of the four only one was filled out entirely. Theremaining three had only the basic data, and very little substantive economicinformation concerning pre and post-hurricane operations.
Of the remaining 30 manufacturers, six stated they had already sent thecompleted questionnaires back, three said they would not respond and gave noexplanation, two said they had little physical damage and that most of their businesswas European and not effected by the hurricane, a few were located in north DadeCounty, had no damage and saw no change in business from the hurricane. Onlyone manufacturer targeted had gone out of business, and one had relocated becauseof the hurricane, but would not respond to the survey by mail or phone interview.
As in the case of the boat dealerships, the survey data obtained from the boatmanufacturers in Dade County was insufficient for the purposes of this study. Thesurveys returned were not in sufficient number nor did they contain enoughinformation to allow reliable inferences to be made as to how the general populationof boat manufacturers was effected by Hurricane Andrew.
5.0 Summary and Conclusions
This study was undertaken to analyze the impact of Hurricane Andrew onthree distinct sectors of the recreational boating industry: boaters, marine storagefacilities, and the marine services industries. Each of these sectors was surveyed withvarying degrees of success. With regard to boaters, two studies were undertaken thatwere very successful, 1) a longitudinal study of hurricane evacuation plans ofberthed boat owners in Dade County using a 1990 study as a baseline, and 2) astratified random sample of the general boater population in the county. With regardto marinas and boat storage facilities, a sampling frame of Dade County marinas andboat storage facilities was completed by the Boating Research Center in July of1992, three weeks prior to Hurricane Andrew and produced good results. Finally,surveys of boat yards, boat dealers and boat manufacturers in Dade County wereconducted with lesser degrees of success.
40
-
-
-
-
-
-
-
-
-
-
-
-
The objectives of this study were three: 1) to evaluate the hurricanepreparedness plans of the boaters, marinas and other marine related businesses inDade County, 2) to assess the damage caused by Hurricane Andrew to the boats,marinas, boat yards, and other boating businesses, and 3) to determine the futureboating activities of Dade County boat owners and the rebuilding plans of the marinebusinesses. Each of these areas is summarized below with regard to the varioussectors of the recreational boating industry.
Among boaters in general, 66 percent said that they had a hurricane plan priorto Hurricane Andrew. After Andrew, 80 percent of all boaters, and 95 percent ofberthed boat owners, had a hurricane plan. Prior to Andrew, 67 percent of theberthed boat owners said they planned to evacuate their marina, whereas 53 percentactually did evacuate. The evacuations came much closer to hurricane landfall thanexpected. Prior to the hurricane, 64 percent said that they would evacuate more than48 hours before landfall, when actually only 32 percent of the berthed boat ownersevacuated more than 48 hours before hurricane landfall. Many berthed boat ownerslocated in the southern region of Dade County felt that their marina would be safe ina hurricane. This turned out not to be the case for Hurricane Andrew.
Of the berthed boat owners who responded to the survey, 64 percent incurreddamage to their boats. For those berthed boat owners responding the average damagefigure was approximately $25,000. In the general boater population, 44 percent ofthose responding had damage to their boats. The average damage figure for theserespondents was approximately $9,160. The majority of boaters who lost their boatsplan to replace them with boats of equal or greater value within one year. Of thoseboaters needing repairs, 68 percent said that they would have their boat repairedimmediately using marine services within Dade County.
With regard to future boating plans, 88 percent of the respondents said thatthey would continue to use their boats. The usage patterns for the berthed boatowners, and the boat owners in general, indicated a post-hurricane usage rate aboutthe same as the pre-hurricane rate. The frequency of use of the berthed boat owners,however, is slightly greater than that of the general boating population. The fact thatboat usage has in fact remained constant after Hurricane Andrew has beencorroborated by data obtained from talking with dockmasters in the county.
The survey of marinas and boat storage facilities investigated the requirementsof boat owners as to insurance, hurricane plans, and evacuation procedures. Hullinsurance was required by 48 percent of the wet berth facilities and 56 percent of thedry berth facilities. Liability insurance was required by approximately 61 percent ofthe wet storage facilities and 67 percent of the dry storage facilities responding.
41
In terms of having a hurricane plan, 85 percent of the wet berth facilities and89 percent of the dry storage facilities reporting said that they had a hurricane plan.Of those facilities with a plan, 62.5 percent of both the wet berth and the dry storagefacilities said they distributed their plan to the boat owners. A majority of the wetberth facilities responding required the boat owners to move their boats priorto the hurricane. Of the dry storage facilities reporting, 50 percent had asimilar requirement
Of the boat storage facilities responding, 80 percent of the wet berth facilitiesand 77 percent of the dry storage facilities incurred damage. The amount of damageincurred by the facilities was dependent upon many factors and thus ranged from nodamage to several millions of dollars. Ninety percent of the wet berth facilities hadinsurance, while 100 percent of the dry storage facilities reporting had insurance.Although the facilities frequently had liability coverage, few had businessinterruption insurance.
All of the boat storage facilities responding to the survey said that they wouldrebuild their facilities damaged by Hurricane Andrew. All of the dry storagefacilities responding said that they would rebuild immediately. The wet berthfacilities generally intended to rebuild quickly, with 50 percent of the respondentssaying they would rebuild immediately.
Of the boat yards surveyed in Dade County, the number of formal hurricaneplans was not reported. Exactly half of the survey respondents had propertyinsurance, covering from fifty percent to 100 percent of the damage incurred. Only25 percent of the facilities responding had business interruption insurance.
With regard to damages incurred by boat yards during Hurricane Andrew, theproperty damage assessments reported ranged from zero to slightly over one hundredthousand dollars. One facility reported being closed for one month, another reportedbeing without electricity for two weeks. Of the three facilities responding thatrebuilding was necessary, two planned to rebuild immediately and the other withintwelve to 18 months.
In their post-hurricane operations, all of the boat yards responding had hiredmore full-time employees. Each of the facilities responding was able to identifyhurricane related repairs above their regular level of repair and maintenance work.For those facilities providing pre-hurricane and post-hurricane repair data, thenumber of repairs was up 13 percent after the hurricane. The timing of the repairs
showed that there was a dramatic increase in the month of September, however, therepairs in October and November were less than the previous year. Repairs for
42
-
__
-
-
-
-
-
-
-
-
-
-
-
-
-
December through January were again above the pre-hurricane levels. This pattern ofrepair work was also indicated by the boat owners surveys.
The responses from the boat dealers and manufacturers were verydisappointing. The reasons for lack of response included lack of time to complete thesurvey, lack of access to the needed information, and lack of serious damage fromHurricane Andrew with no apparent change in business since the hurricane. Onlyone manufacturer contacted in the study had gone out of business and one hadrelocated because of the hurricane. Future studies of these sectors of the recreationalboating industry must recognize the difficulty in obtaining the necessary informationand employ alternative measures and methods.
6.0 Recommendations
In the wake of Hurricane Andrew it is difficult to make any specificrecommendations concerning the appropriate procedures to follow in preparation fora hurricane to ensure the safety of boaters, boats, and marine-related services andindustries. In many cases, conventional wisdom was shown to be unwise. Perhaps,the best illustration of this was the vulnerability of boats docked or moored in socalled “hurricane holes”. It was shown that if a storm the magnitude and strength ofHurricane Andrew passes over such a “hole”, standard docks and moorings will beno match for the storm.
On the other hand, the experience of all of those who weathered the stormwould indicate that it is best to have an emergency plan that is well thought out andrehearsed. This was shown to be true for boaters, as well as for marine relatedindustries. For those who had a hurricane plan, the experience of Andrew may beused to assess and evaluate its effectiveness, and to revise and update it as required.For those who did not have a plan, the experience of Andrew is surely motivation tocreate one. The researchers are heartened that the preparation of hurricane plans hasbeen a focus of recent workshops sponsored by the International Marina Institute andthe Marine Industry Association of Florida.
Whereas much of the focus of the preparation of hurricane plans has been onthe marine industry, a similar effort needs to be made for boaters. The disseminationof emergency planning material, the conducting of workshops, and the providing ofinstruction for proper techniques of seamanship and mooring are all continuing needsof the boating community.
With regard to the assessment of the economic impact of a catastrophic eventsuch as Hurricane Andrew, additional longitudinal studies are required. Additionalsurvey work, for example, is necessary to validate the intentions of boating surveyrespondents who assessed their anticipated level of boating activity and their boatreplacement and repair schedules immediately following the storm. Similarly, theboating research segments of the community and academe must redouble their efforts
43

to increase their cooperation with the boat dealership and the boat manufacturingsegments of the marine industry. A wealth of beneficial information is available toindustry through the state boat registration tiles and through the research surveysconducted by various agencies. This information needs to be brought to the attentionof the industry so that through mutual cooperation better industry data becomesavailable.
44

Appendices

Appendix A
UNIVERSITY OF
Appendix ACover Letter and Survey Questionnaire
Berthed Boat Owners
Dear Sir/Madam:
The University of Miami Boating Research Center, through a grant form theFlorida Sea Grant Program, is conducting a survey that will help analyze the shortand long term effects of Hurricane Andrew on the Dade County boating community.As part of this study, we are conducting a survey of boat owners in Dade County toassess the damage, if any, to their boats and to determine their future boating plans.
As a survey respondent in our 1990 Hurricane Preparedness Study, we are againasking your cooperation in completing the enclosed survey questionnaire. Yourhurricane experience and your future boating plans will help assess the impact ofHurricane Andrew on the recreational boating community.
The survey will take about live minutes to complete. All responses will be keptstrictly confidential. Only summary statistics of the responses will be included in theprojects final report. Your cooperation is greatly needed for the success of the study.A copy of the results of the study will be made available to you upon request.
Please fill out the enclosed questionnaire promptly and return it in the enclosedstamped envelope to the Boating Research Center.
Thank you for your cooperation in this very important project.
Sincerely,
Dr. Edward K. BakerPrincipal Investigator
Boating Research CenterRosenstiel School of Marine and Atmospheric Science
Marine Affairs4600 Rickenbacker CausewayMiami, Florida 33149-1098
Tel: (305) 361-4012FAX: (305) 361-4675

HURRICANE ANDREW AFTERMATH BOATING SURVEYUniversity of Miami Boating Research Center
Check (X) the appropriate items or fill in the blanks. Please write an answer that cannot be adequatelyexpressed by checking or filling in a blank.
BOAT TYPE
1.
2.
3.
4.
5.
6.
7.
8.
9.
Boat Propulsion[ ] outboard[ ] sail[ ] other
[ ] inboard [ ] inboard/outboard[ ] sail with inboard [ ] sail with outboard
Horsepower: hp
Boat DimensionsLength: ftBeam : ft
Hull Material:[Iwd [ ] fiberglass
Engine Type:t 19s [ ] diesel
Is your boat trailerable? t 1 YesIf yes, do you own a trailer? [ ] Yes
Year boat was built:
Draft : ftHeight : ft
[ ] steel [ ] other
[ ] other
[I No [ ] Don’t Know[I No
Year boat was purchased:
Florida Registration Number:
BEFORE HURRICANE ANDREWBOAT USF PATTERN
1.
2.
3.
4.
5.
Did you live in Dade County? [ ] Yes [INoYour zip code:
Before Hurricane Andrew, where was your boat berthed/stored?[ ] wet berth [ ] dry storage [ ] homeName of marina/dry storage:Address of home/marina/dry storage:
How long was boat stored there?[ ] less than 1 year [ ] 1 to less than 3 years[ ] 5 to less than 10 years [ ] 10 years and over
[ ] 3 to less than 5 years
Indicate the total number of trips that you made per season before Hurricane Andrew.
Seasons Weekend Days Per Month Weekdays Per MonthSummer (April - September)Winter (October - March)
Where was your most frequent water destination?
50
page 1

6. indicate approximate boating related expenses you incurred in spaces provided below.Per Trip Expenses Per Year Expensesfuel boat storage feesfood/drink maintenance/repairbait boat insurancerestaurant clothing/shoes/etcOthers (Please specify) Others (Please specify)
$ $
AFTER HURRICANE ANDREWHurricane Preparation
1.
2.
3.
4.
5.
6.
7.
8.
9.
10.
11.
Did your marina provide you with information for hurricanepreparedness? [ J Yes [ ] No [ ] Don’t Know
Did your marina require you to move your boat? [ J Yes [ ] No [ ] Don’t Know
Did you have a hurricane preparedness plan? [I Yes [I No
If yes, did you conduct a dry run to test your plan? [I Yes [I No
Was your boat in Dade County during Hurricane Andrew? [ ] Yes [ ] No
Did you move your boat prior to hurricane landfall? [] Yes [I No
If yes, how many hours before hurricane landfall did you move your boat?[ ] 49 - 72 hours [ ] 24 - 48 hours [ ] less than 24 hours
Where did you move your boat?
Did you have a contract for hurricane mooring? [I Yes [I No
How long did it take to move your boat to the mooring site? hours. -.
Did you properly secure your boat at the mooring sitein preparation for the hurricane? [ ] Yes [ ] No [ ] Don’t Know
Hurricane Damage Assessment
12.
13.
14.
15.
Did your boat incur damage? [I Yes [I NoIf yes, approximate value of damage. $Briefly describe the damage incurred.
Did you have boat insurance? [I Yes [I No
If yes, did your boat insurance cover the damageto your boat? [IYes [I No
If yes, what percentage of damage to your boat was covered by your insurance? %
Did your boat insurance cover the damage that your boat inflictedupon the marina or other parties? [ ] Yes [INoIf yes, what percentage of damage to other parties was covered by your insurance? %
Future Boating Plans
16. If you lost your boat in the hurricane, do you plan to[ ] replace your boat with a new boat[ ] replace your boat with a used boat[ ] not replace your boat at all[ ] other (Please specify)
51 page 2

17. If you plan to replace your boat, will you[ ] buy a boat of equivalent value[ ] buy a less expensive boat[ ] buy a more expensive boat[ ] other ( Please specify)
18. When do you plan to replace your boat?[ ] immediately [ ] in 3 months [ ] in 3 to 6 months[ ] in 6 to 12 months [ ] in 12 to 18 months [ ] in 18 to 36 months [ ] other
19. If your boat incurred damage. do you plan to:[ ] have your boat repaired in Dade County[ ] have your boat repaired outside Dade County[ ] sell your boat as is[ ] other ( Please Specify).
20. When do you plan to have your boat repaired?[ ] immediately [ ] in 3 months [ ] in 3 to 6 months[ ] in 6 to 12 months [ ] in 12 to 18 months [ ] in 18 to 36 months [ ] other
21. Given your hurricane experience, will you continue to use your boat?[ I Yes [I No [ ] Don’t Know
22. If yes, indicate the number of times you plan to use your boat per season,
Seasons Weekend Days Per Month Weekdays Per MonthSummer (April - September)Winter (October - March)
23. Given your hurricane experience, where do you plan to store/berth your boat in the future?[ ] home [ ] wet berth [ ] dry storage [ ] otherName of the marina/dry storage facility:Address of home/marina/dry storage facility:
24. Do you plan to have a “hurricane preparedness plan”?W= [I No [ ] Don‘t Know
25. Do you think discounts for boat insurance should be given to boat owners withformal written “hurricane preparedness plan”?[IYes [INo [ ] Don’t Know
26. Comments/Suggestions:
Please return the questionnaire in the enclosed addressed stamped envelope to:
Boating Research CenterUniversity of Miami - RSMASDivision of Marine Affairs4600 Rickenbacker CausewayMiami, FL 33149
Thank you very much for your cooperation.
52page 3

Appendix B

Region North Central South
Total Responses 13 73 42
LengthLess than 2525-40More than 40no response
Propulsionoutboardinboardinboard/outboardsailsail/inboardsail/outboard
other
ModelyearPre 197070-7980-8586-8990-92no response
Issue DatePre 197070-7980-8586-8990-92no response
Appendix B
Summary ResponsesBerthed Boat Owners
742
13
28 1334 20
6 55 4
73 42
213
37
3314
173
418
22
142
13 42
230251
13
12351112
3
41513
91
73 42
1 133 236 253 12
25
1020
5
13 73 42
55
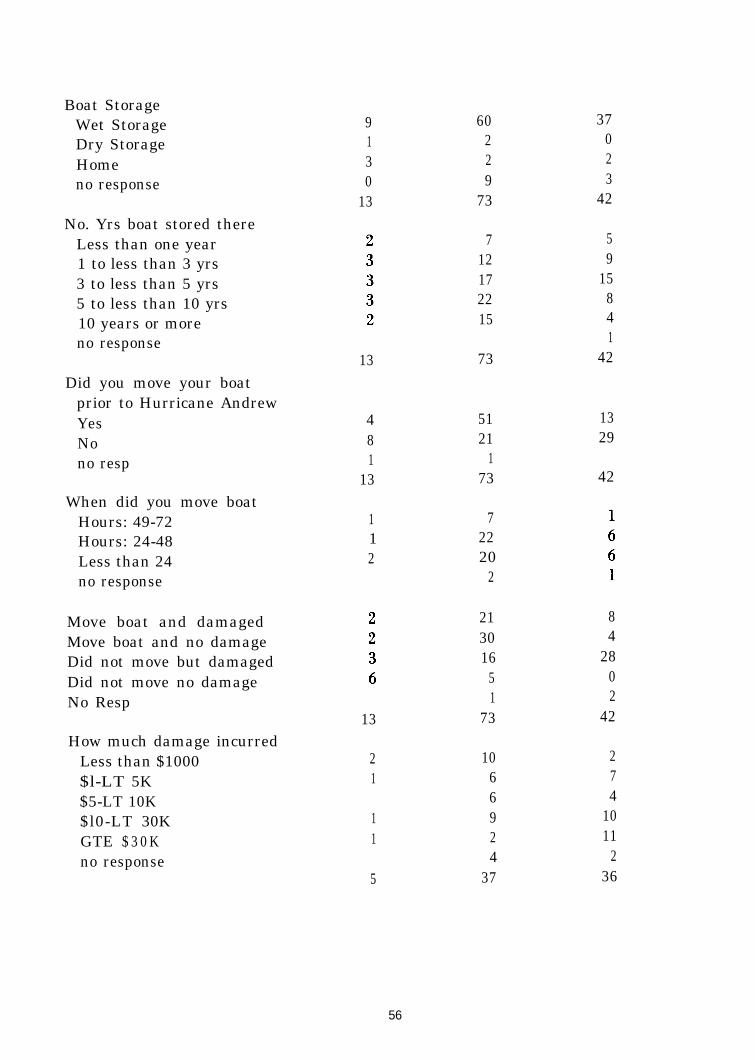
Boat StorageWet StorageDry StorageHomeno response
No. Yrs boat stored thereLess than one year1 to less than 3 yrs3 to less than 5 yrs5 to less than 10 yrs10 years or moreno response
Did you move your boatprior to Hurricane AndrewYesNono resp
When did you move boatHours: 49-72Hours: 24-48Less than 24no response
Move boat and damagedMove boat and no damageDid not move but damagedDid not move no damageNo Resp
How much damage incurredLess than $1000$l-LT 5K$5-LT 10K$l0-LT 30KGTE $ 3 0 Kno response
9 60 371 2 03 2 20 9 3
13 73 42
13
4 518 211 1
13 73
112
13
21
11
5
712172215
73
72220
2
21 830 416 28
5 01 2
73 42
10 26 76 49 102 114 2
37 36
59
15841
42
1329
42
56
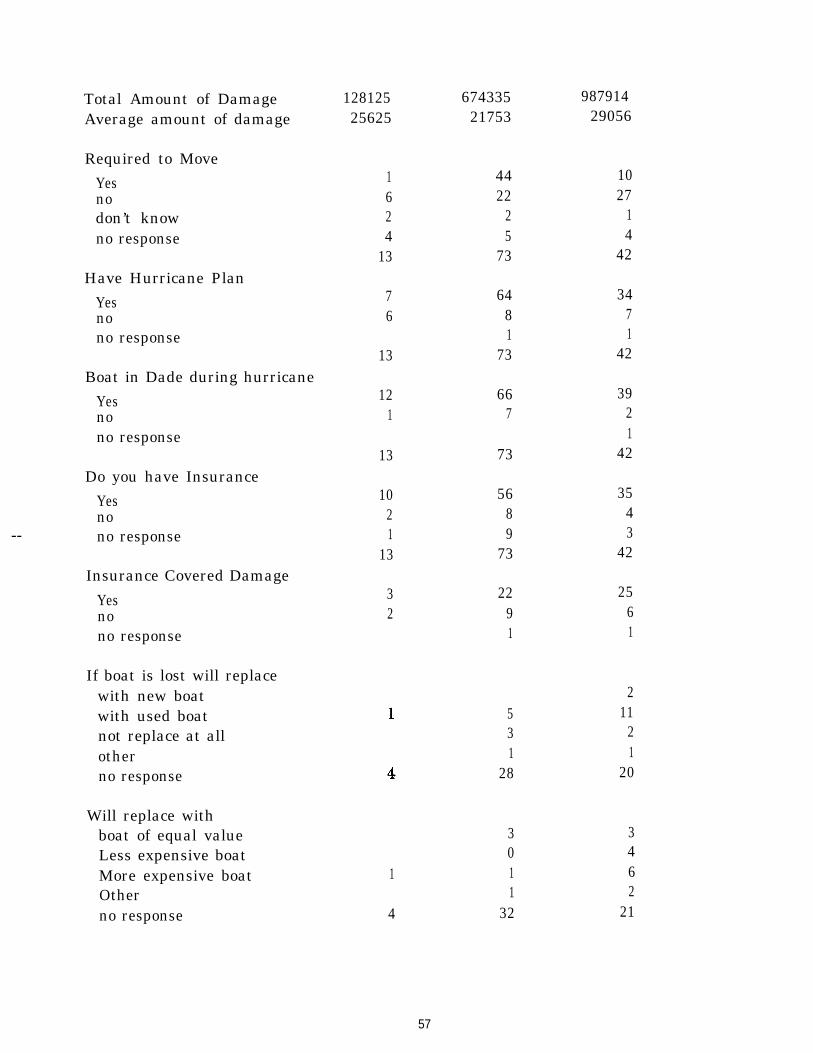
Total Amount of Damage 128125 674335 987914Average amount of damage 25625 21753 29056
Required to MoveYesnodon’t knowno response
1 44 106 22 272 2 14 5 4
13 73 42
64 348 71 1
73 42
Have Hurricane PlanYesnono response
76
13Boat in Dade during hurricane
Yesnono response
667
3921
42
121
13
1021
13
73Do you have Insurance
Yesno
-- no response
355689
73
43
42Insurance Covered Damage
Yesnono response
22 259 61 1
32
If boat is lost will replacewith new boatwith used boatnot replace at allotherno response
211
21
20
531
28
Will replace withboat of equal valueLess expensive boatMore expensive boatOtherno response
1
4
3 30 41 61 2
32 21
57
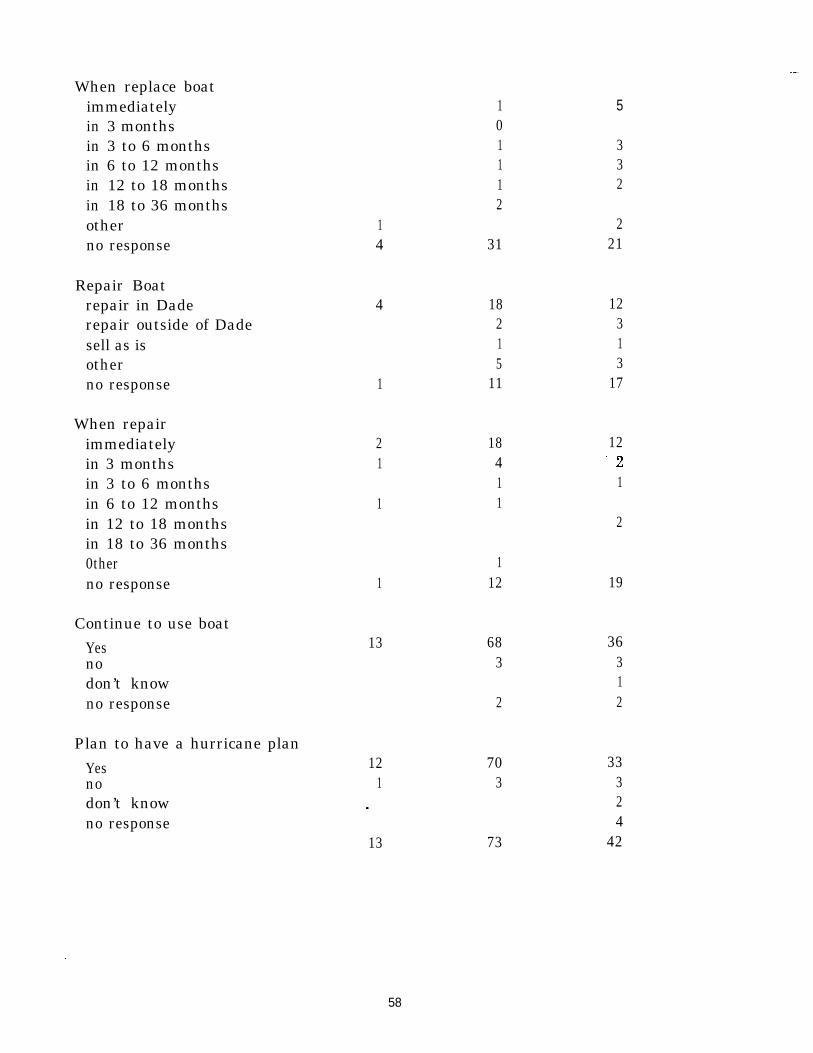
When replace boatimmediately 1in 3 months 0in 3 to 6 months 1in 6 to 12 months 1in 12 to 18 months 1in 18 to 36 months 2other 1no response 4 31
Repair Boatrepair in Daderepair outside of Dadesell as isotherno response
When repairimmediatelyin 3 monthsin 3 to 6 monthsin 6 to 12 monthsin 12 to 18 monthsin 18 to 36 months0therno response
Continue to use boatYesnodon’t knowno response
Plan to have a hurricane planYesnodon’t knowno response
4 18 122 31 15 3
1 11 17
2 181 4
11 1
1
13
112
683
2
12 701 3
13 73
5
332
221
12.2
1
2
19
36312
33324
42
58

Pre Hurricane UseSummer wkends
012-45-89-16More than 16no resp
13Summer wkdays
012-45-89-16More than 16no Resp
Winter wkends012-45-89-16More than 16no resp
Winter wkdays012-45-89-16More than 16no resp
13
138
1
13
13
44
4812
1
473
31 180 0
14 1015 7
3 56 14 1
73 42
7 47 9
47 237 41 1
4 173 42
371513
31
4 173 42
23
269111
42
19895
Post Hurricane Use
59

Summer wkends012-45-89-16More than 16no response
Summer wkdays012-45-89-16More than 16no resp
Winter wkends012-45-89-16More than 16no resp
Winter wkdays012-45-89-16More than 16no resp
11
10
1
13
13
228
1
13
13
45
4512
7 173 42
3713
65327
73
7 85 7
43 2010 5
1 1
7 173 42
311513
3227
73
71
2472
1811
75
142
2410
7
142
6 0

Appendix C

-
-
--
-
Appendix CCover Letter and Survey Questionnaire
All Boat Owners
Dear Sir/Madam:
The University of Miami Boating Research Center, through a grant form theFlorida Sea Grant Program, is conducting a survey that will help analyze the shortand long term effects of Hurricane Andrew on the Dade County boating community.As part of this study, we are conducting a survey of boat owners in Dade County toassess the damage, if any, to their boats and to determine their future boating plans.
We are asking your cooperation, as a boat owner, in completing the enclosedsurvey questionnaire. Your hurricane experience and your future boating plans willhelp assess the impact of Hurricane Andrew on the recreational boating community.
The survey will take about five minutes to complete. All responses will be keptstrictly confidential. Only summary statistics of the responses will be included in theprojects final report. Your cooperation is greatly needed for the success of the study.A copy of the results of the study will be made available to you upon request.
Please fill out the enclosed questionnaire promptly and return it in the enclosedstamped envelope to the Boating Research Center.
Thank you for your cooperation in this very important project.
Sincerely,
_̂
-
Dr. Edward K. BakerPrincipal Investigator
Boating Research CenterRosenstiel School of Marine and Atmospheric Science
Marine Affairs4600 Rickenbacker CausewayMiami, Florida 33149-1098
Tel: (305) 361-4012FAX: (305) 361-4675
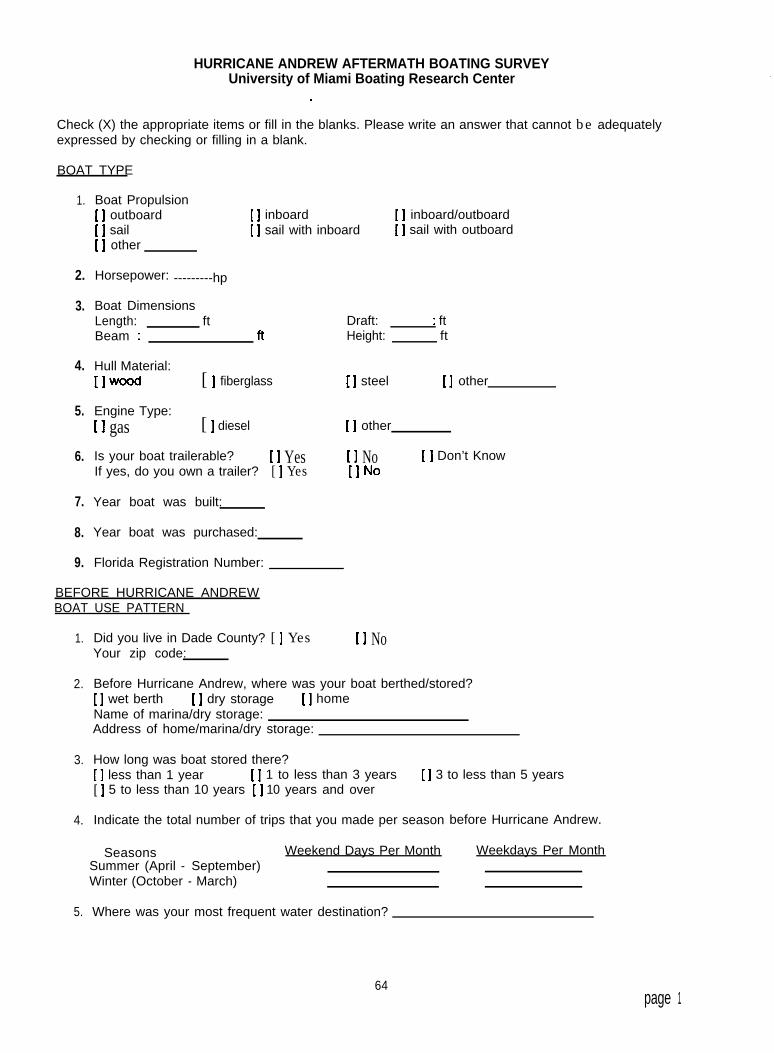
HURRICANE ANDREW AFTERMATH BOATING SURVEYUniversity of Miami Boating Research Center
.
Check (X) the appropriate items or fill in the blanks. Please write an answer that cannot be adequatelyexpressed by checking or filling in a blank.
BOAT TYPE
1.
2.
3.
4.
5.
6.
7.
8.
9.
Boat Propulsion[ ] outboard[ ] sail[ ] other
[ ] inboard [ ] inboard/outboard[ ] sail with inboard [ ] sail with outboard
Horsepower: ---------hp
Boat DimensionsLength: ftBeam : ft
Hull Material:[Iwood [ ] fiberglass
Engine Type:[I gas [ ] diesel
Is your boat trailerable? [I YesIf yes, do you own a trailer? [ ] Yes
Year boat was built:
Draft: : ftHeight: ft
[ ] steel [ ] other
[ ] other
[I No [ ] Don’t Know[INo
Year boat was purchased:
Florida Registration Number:
BEFORE HURRICANE ANDREWBOAT USE PATTERN
1.
2.
3.
4.
5.
Did you live in Dade County? [ ] Yes [I NoYour zip code:
Before Hurricane Andrew, where was your boat berthed/stored?[ ] wet berth [ ] dry storage [ ] homeName of marina/dry storage:Address of home/marina/dry storage:
How long was boat stored there?[ ] less than 1 year [ ] 1 to less than 3 years[ ] 5 to less than 10 years ji 10 years and over
[ ] 3 to less than 5 years
Indicate the total number of trips that you made per season before Hurricane Andrew.
Seasons Weekend Days Per MonthSummer (April - September)Winter (October - March)
Weekdays Per Month
Where was your most frequent water destination?
64page 1

6. Indicate approximate boating related expenses you incurred in spaces provided below.Per Year Expenses
fuelfood/drink ’
boat storage feesmaintenance/repair
bait boat insurancerestaurant clothing/shoes/etcOthers (Please
$specify) Others (Please specify)
$
AFTER HURRICANE ANDREWHurricane Preparation
1.
2.
3.
4.
5.
6.
7.
Did your marina provide you with information for hurricanepreparedness? [ ] Yes [ ] No [ ] Don’t Know
Did your marina require you to move your boat? [ ] Yes [ ] No [ ] Don’t Know
Did you have a hurricane preparedness plan? [I Yes [I No
8.
If yes, did you conduct a dry run to test your plan? [IYes [INo
Was your boat in Dade County during Hurricane Andrew? [ ] Yes [ ] No
Did you move your boat prior to hurricane landfall? ’ [ ] Yes [ ] No
If yes, how many hours before hurricane landfall did you move your boat?[ ] 49 - 72 hours [ ] 24 - 48 hours [ ] less than 24 hours
Where did you move your boat?
9. Did you have a contract for hurricane mooring? [I Yes [I No_.
10. How long did it take to move your boat to the mooring site? hours.
11. Did you properly secure your boat at the mooring sitein preparation for the hurricane? [ ] Yes [ ] No [ ] Don’t Know
Hurricane Damage Assessment
12. Did your boat incur damage? [IYes tl NoIf yes, approximate value of damage. $Briefly describe the damage incurred.
13.
14.
15.
Did you have boat insurance? [IYes tl No
If yes, did your boat insurance cover the damageto your boat? [I Yes [I No
If yes, what percentage of damage to your boat was covered by your insurance? %
Did your boat insurance cover the damage that your boat inflictedupon the marina or other parties? [ ] Yes [I NoIf yes, what percentage of damage to other parties was covered by your insurance? %
16. If you lost your boat in the hurricane, do you plan to[ ] replace your boat with a new boat[ ] replace your boat with a used boat[ ] not replace your boat at all[ ] other. (Please specify)
65page 2

17. If you plan to replace your boat, will you[ ] buy a boat of equivalent value[ ] buy a less expensive boat[ ] buy a more expensive boat[ ] other ( Please specify)
18. When do you plan to replace your boat?[ ] immediately [ ] in 3 months [ ] in 3 to 6 months[ ] in 6 to 12 months [ ] in 12 to 18 months [ ] in 18 to 36 months [ ] other
19. If your boat incurred damage, do you plan to:[ ] have your boat repaired in Dade County[ ] have your boat repaired outside Dade County[ ] sell your boat as is[ ] other ( Please Specify).
20. When do you plan to have your boat repaired?[ ] immediately [ ] in 3 months [ ] in 3 to 6 months[ ] in 6 to 12 months [ ] in 12 to 18 months [ ] in 18 to 36 months [ ] other
21. Given your hurricane experience, will you continue to use your boat?[IYes [I No [ ] Don’t Know
22. If yes, indicate the number of times you plan to use your boat per season.
Seasons Weekend Days Per Month Weekdays Per MonthSummer (April - September)Winter (October - March)
23. Given your hurricane experience, where do you plan to store/berth your boat in the future?
24.
25.
26.
[ ] home [ ] wet berth [ ] dry storageName of the marina/dry storage facility:Address of home/marina/dry storage facility:
[ ] other
Do you plan to have a “hurricane preparedness plan”?[ 1 Yes [INo [ 1 Don’t Know
Do you think discounts for boat insurance should be given to boat owners withformal written “hurricane preparedness plan”?[ 1 yes [I No [ ] Don’t Know
Comments/Suggestions:
Please return the questionnaire in the enclosed addressed stamped envelope to:
Boating Research CenterUniversity of Miami - RSMASDivision of Marine Affairs4600 Rickenbacker CausewayMiami, FL 33149
Thank you very much for your cooperation.
66 page 3

Appendix D
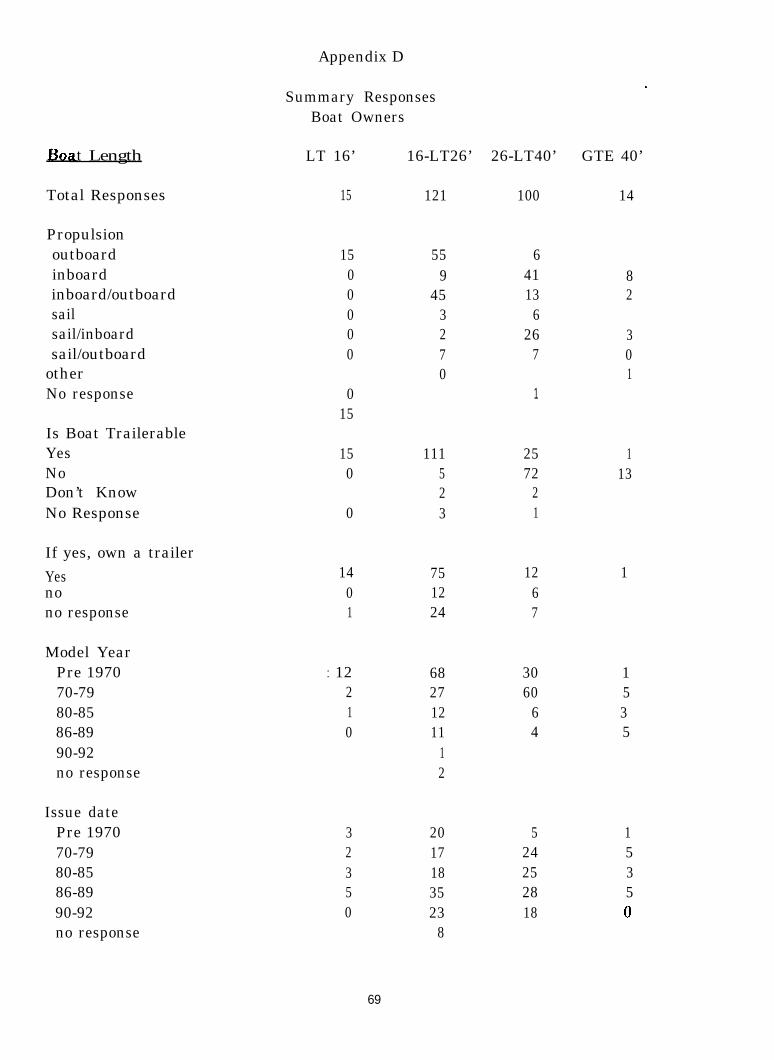
t Length LT 16’ 16-LT26’ 26-LT40’
Total Responses
Propulsionoutboardinboardinboard/outboardsailsail/inboardsail/outboard
otherNo response
Is Boat TrailerableYesNoDon’t KnowNo Response
If yes, own a trailerYesnono response
Model YearPre 197070-7980-8586-8990-92no response
Issue datePre 197070-7980-8586-8990-92no response
Appendix D
Summary ResponsesBoat Owners
15
1500000
015
150
0
1401
: 12210
32350
121
559
453270
111 255 722 23 1
100
64113
626
7
1
75 12 112 624 7
68 30 127 60 512 6 311 4 5
12
2017183523
8
5 124 525 328 518
.
GTE 40’
14
82
301
113
69
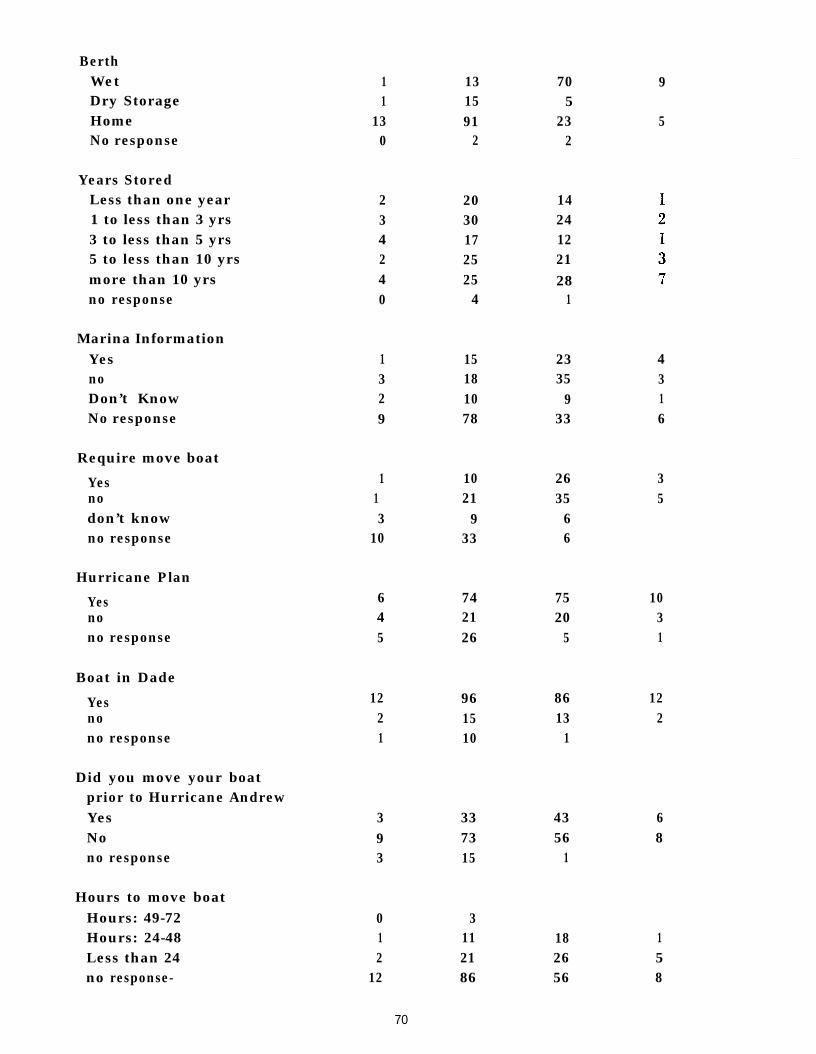
BerthWetDry StorageHomeNo response
Years StoredLess than one year1 to less than 3 yrs3 to less than 5 yrs5 to less than 10 yrsmore than 10 yrsno response
Marina InformationYesnoDon’t KnowNo response
Require move boat
Yesnodon’t knowno response
Hurricane Plan
Yesnono response
Boat in Dade
Yesnono response
Did you move your boatprior to Hurricane AndrewYesNono response
Hours to move boatHours: 49-72Hours: 24-48Less than 24no response-
11
130
234240
1329
113
10
645
1221
393
012
12
70
13 7015 5 91 23
2 2
9
5
20 1430 2417 1225 2125 28
4 1
15 23 418 35 310 9 178 33 6
10 2621 35
9 633 6
35
74 75 1021 20 326 5 1
96 8615 1310 1
122
337315
3112186
4356
1
68
18 126 5 56 8
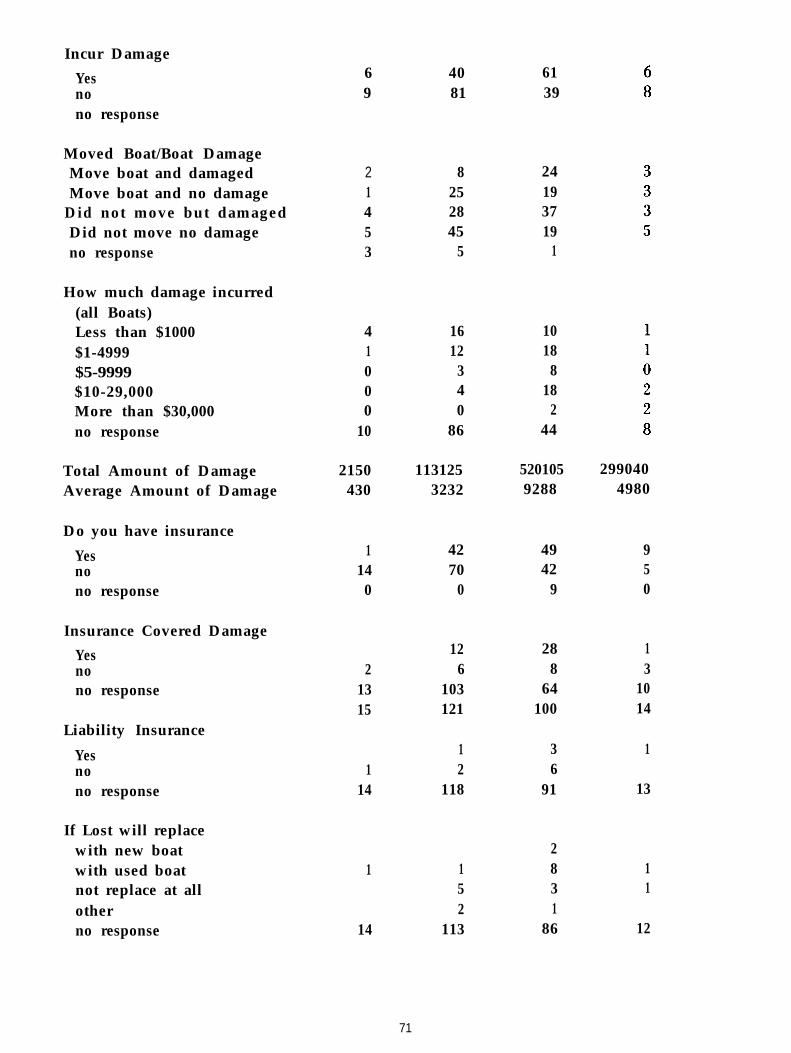
Incur DamageYesnono response
Moved Boat/Boat DamageMove boat and damagedMove boat and no damage
Did not move but damagedDid not move no damageno response
How much damage incurred(all Boats)Less than $1000$1-4999$5-9999$10-29,000More than $30,000no response
Total Amount of DamageAverage Amount of Damage
Do you have insuranceYesnono response
Insurance Covered DamageYesnono response
Liability InsuranceYesnono response
If Lost will replacewith new boatwith used boatnot replace at allotherno response
21453
41000
10
2150430
114
0
21315
114
1
8252845
5
24193719
1
16 1012 18
3 84 180 2
86 44
113125 5201053232 9288
42 4970 42
0 9
12 286 8
103 64121 100
1 32 6
118 91
21 85 32 1
14 113 86
6 40 619 81 39
2990404980
950
13
1014
1
13
11
12
71
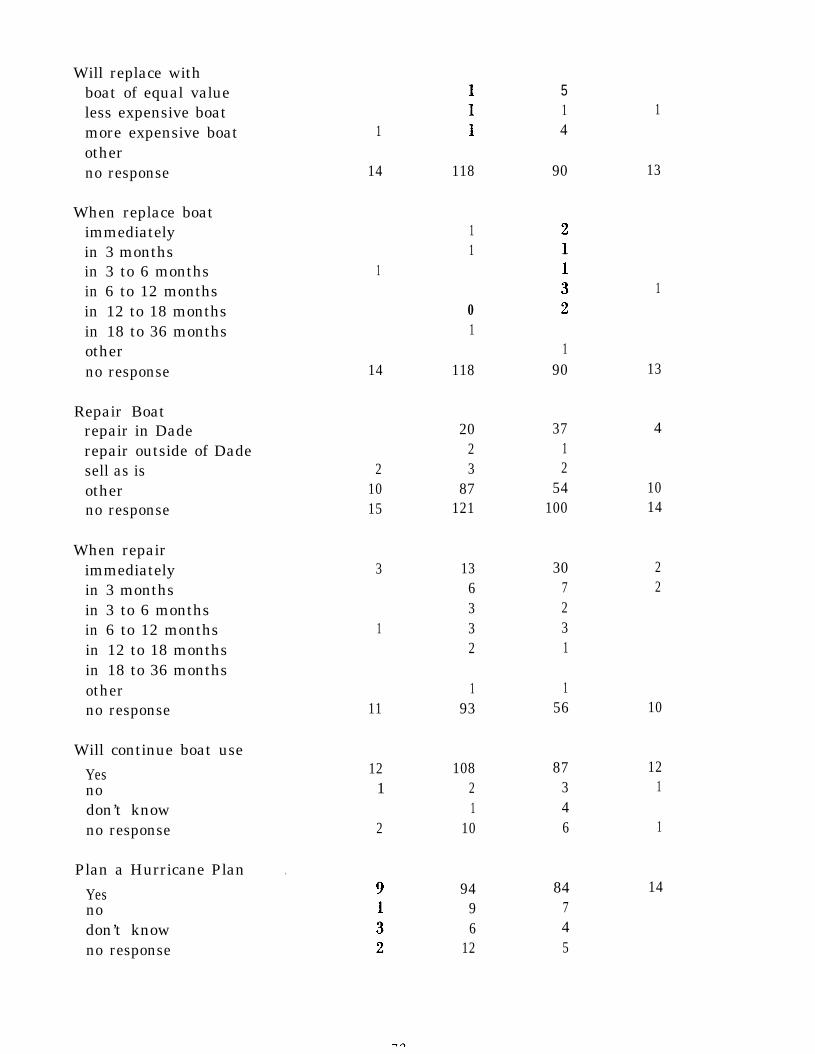
Will replace withboat of equal valueless expensive boatmore expensive boatotherno response
514
1
13
1
14 118 90
When replace boatimmediatelyin 3 monthsin 3 to 6 monthsin 6 to 12 monthsin 12 to 18 monthsin 18 to 36 monthsotherno response
11
11
01
19014 118 13
4
1014
22
Repair Boatrepair in Daderepair outside of Dadesell as isotherno response
2023
87121
3712
54100
21015
When repairimmediatelyin 3 monthsin 3 to 6 monthsin 6 to 12 monthsin 12 to 18 monthsin 18 to 36 monthsotherno response
13 306 73 23 32 1
3
1
1 193 56 1011
Will continue boat useYesnodon’t knowno response
121
2
108 872 31 4
10 6
121
1
Plan a Hurricane PlanYesnodon’t knowno response
.94 84
9 76 4
12 5
14
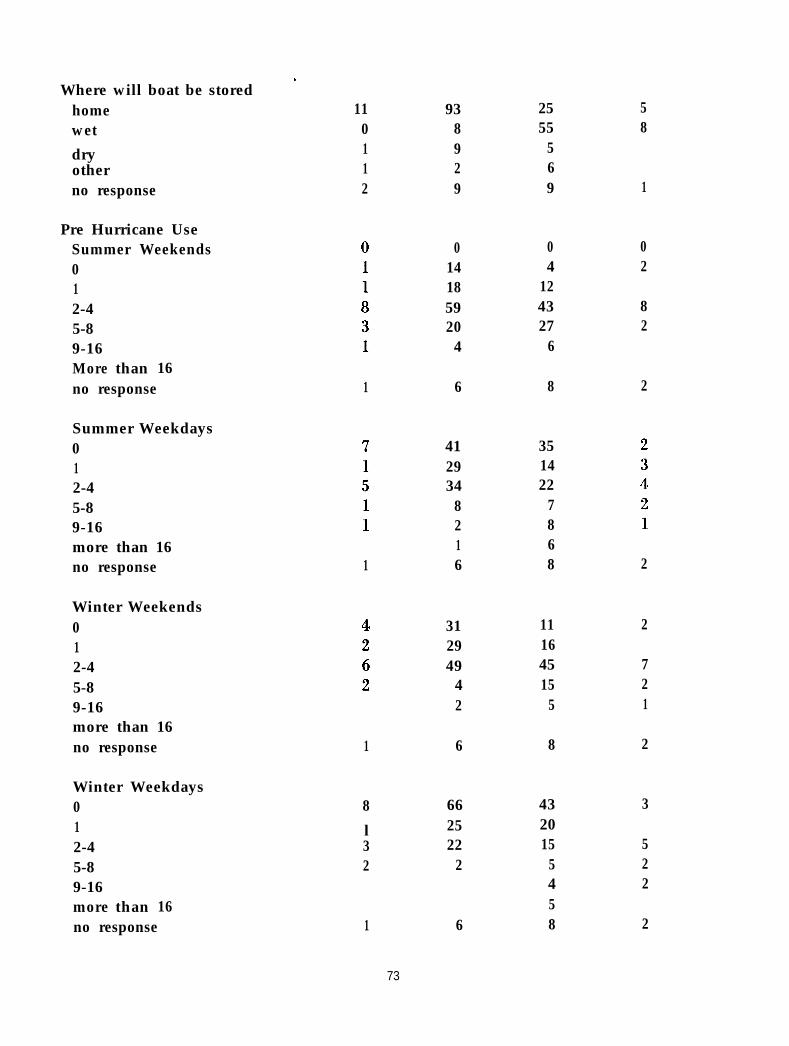
Where will boat be storedhomewet
dryotherno response
11 93 250 8 551 9 51 2 62 9 9
58
1
Pre Hurricane UseSummer Weekends012-45-89-16
0 014 418 1259 4320 27
4 6
02
82
More than 16no response 1 6 8 2
Summer Weekdays012-45-89-16more than 16no response 1
412934
8216
351422
7868 2
Winter Weekends012-45-89-16more than 16
31 1129 1649 45
4 152 5
2
721
no response 1 6 8 2
Winter Weekdays012-45-89-16more than 16no response
8 66l 253 222 2
432015
5458
3
522
1 6 2
73

Post Hurricane UseSummer Weekends012-45-89-16more than 16no response
Summer Weekdays012-45-89-16more than 16no response
Winter Weekends012-45-89-16more than 16no response
Winter Weekdays012-45-89-16more than 16no response
2 19 212 14 75 55 392 17 25
4 13
4 404 213 35
102
4 13
2 29 93 21 14 4 52 372 3 17
3 5
4 13 18 4
4 57 334 20 153 26 160 3 70 1 40 1 74 13 18
1
291223
675
18
0
73
4
4
0
631
74

Appendix E

-
UNIVERSITY OF
Appendix ECover Letter and Survey Questionnaire
Boat Storage Facilities
Dear Sir/Madam:
The University of Miami Boating Research Center (BRC) through a grant fromthe Florida Sea Grant Program, is conducting a study that will help analyze the shortand long term effects of Hurricane Andrew on the Dade County boating community.As part of this study, we are conducting a survey of boat storage facilities in DadeCounty to assess the damage, if any, to these facilities, to determine their futurerebuilding plans, and to estimate the impact of Hurricane Andrew to the boat storageoperations. We are asking your cooperation in completing the enclosed surveyquestionnaire.
Please fill out the enclosed questionnaire promptly and return in the enclosedstamped envelope to the Boating Research Center. The survey will take about twentyminutes to complete. Your cooperation is greatly needed for the success of the study.A copy of the results of the study will be made available to you upon request. If youhave any questions, please call the BRC at (305) 361-4012.
Thank you very much for your cooperation in this very important project.
Sincerely,
Dr. Edward K. BakerPrincipal Investigator
Boating Research CenterRosenstiel School of Marine and Atmospheric Science
Marine Affairs4600 Rickenbacker CausewayMiami, Florida 33149-1098
Tel: (305) 361-4012FAX: (305) 361-4675

HURRICANE ANDREW BOAT STORAGE FACILITIESUniversity of Miami Boating Research Center
Facility NameName of Person Filling out the form:
I Boat Storage Facility Characteristics
1. Facility Type[ ] wet berth[ ] dry storage
2. Facility LocationAddress:
[ ] wet berth and dry storage[ ] other
SURVEY
Nearest Accessible Waterway:
3. No. of years the facility has been in operation: years
II Pre-hurricane operations
Pre-hurricane storage capacity: Wet Dry Other (Please specify)Total available storage capacityNumber Occupied
Pre-hurricane price structure:Dry Storage: ($ per linear foot per day or month or fixed rate per month)Wet Storage: ($ per linear foot per day or month or fixed rate per month)Other (specify): ($ per linear foot per day or month or fixed rate per month)
Pre-hurricane employment characteristics:Number of people employed at this facility:Full TimePart Time
Please indicate pre-hurricane marina services offered below:food/groceriesmarina suppliesboat repairselectricitysewage flush outrestauranttelephonefuelother (please specify)
78
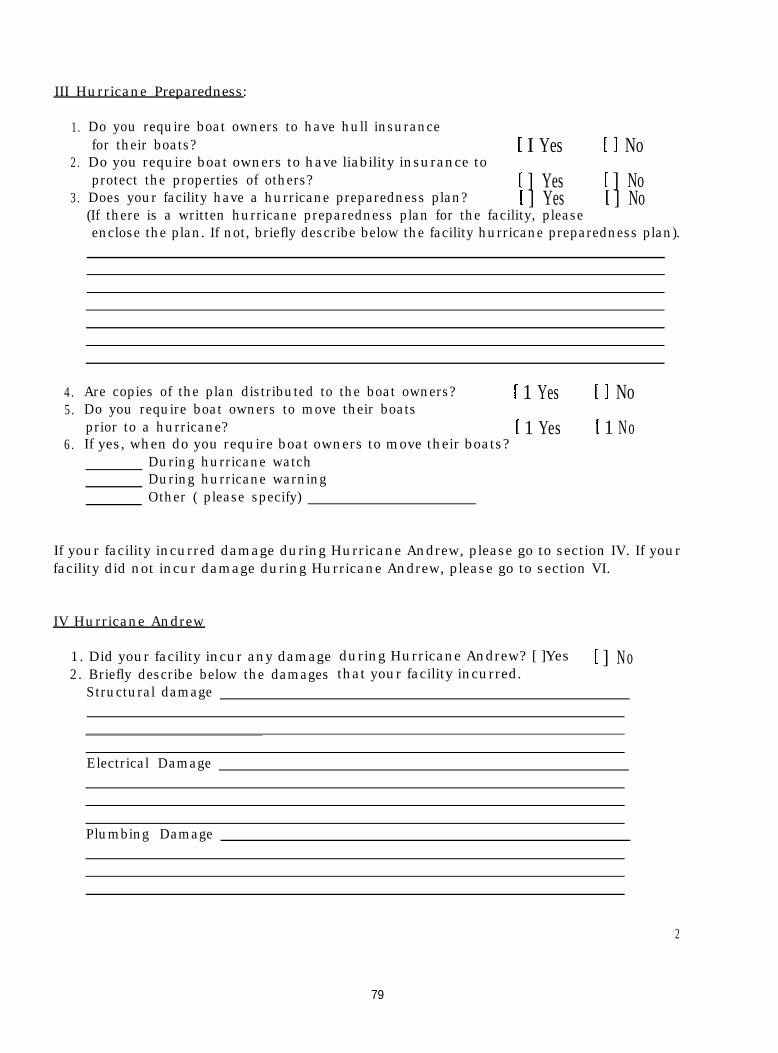
III Hurricane Preparedness:
IV Hurricane Andrew
1.
2.
3.
4.5.
6.
Do you require boat owners to have hull insurancefor their boats? [ I Yes [I NoDo you require boat owners to have liability insurance toprotect the properties of others? [ ] Yes [ ] NoDoes your facility have a hurricane preparedness plan? [ ] Yes [ ] No(If there is a written hurricane preparedness plan for the facility, pleaseenclose the plan. If not, briefly describe below the facility hurricane preparedness plan).
Are copies of the plan distributed to the boat owners? [ 1 Yes [I NoDo you require boat owners to move their boatsprior to a hurricane? [ 1 Yes [ 1 NoIf yes, when do you require boat owners to move their boats?
During hurricane watchDuring hurricane warningOther ( please specify)
If your facility incurred damage during Hurricane Andrew, please go to section IV. If yourfacility did not incur damage during Hurricane Andrew, please go to section VI.
1. Did your facility incur any damage during Hurricane Andrew? [ ]Yes ] ] No2. Briefly describe below the damages that your facility incurred.
Structural damage
Electrical Damage
Plumbing Damage
2
79
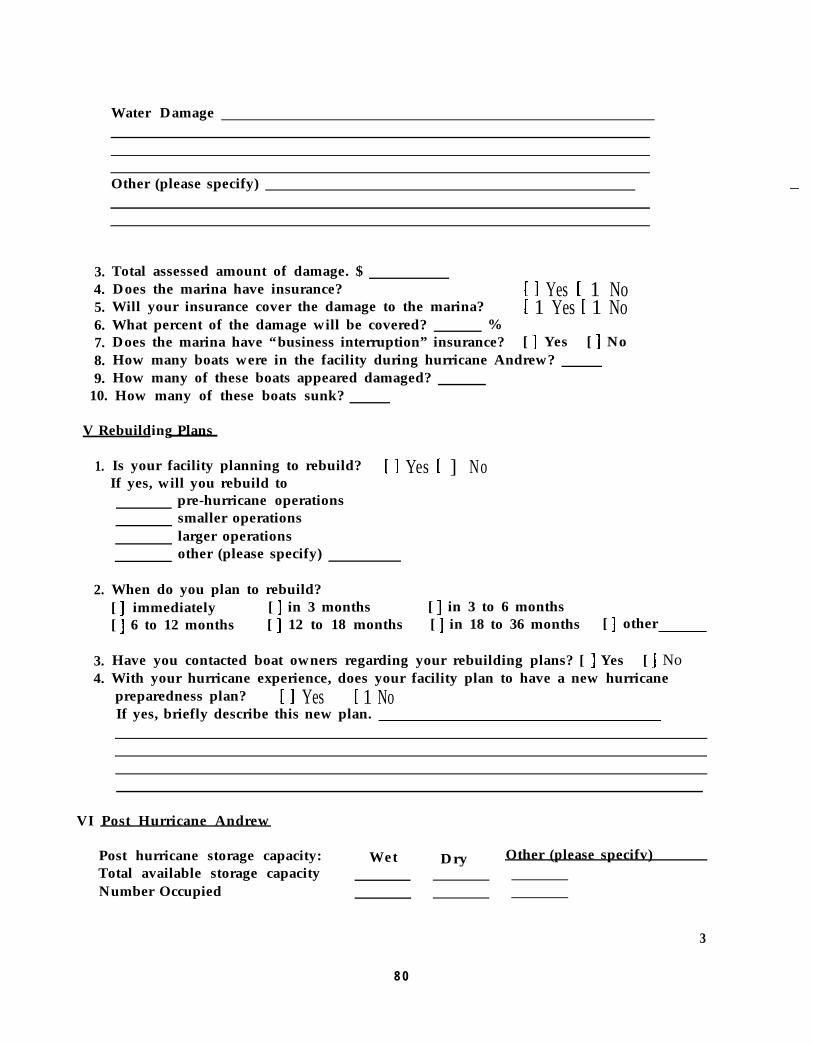
Water Damage
Other (please specify)
3. Total assessed amount of damage. $4. Does the marina have insurance? [I Yes [ 1 No5. Will your insurance cover the damage to the marina? E 1 Yes [ 1 No6. What percent of the damage will be covered? %7. Does the marina have “business interruption” insurance? [ ] Yes [ ] No8. How many boats were in the facility during hurricane Andrew?9. How many of these boats appeared damaged?
10. How many of these boats sunk?
V Rebuilding Plans
1.
2.
3.4.
Is your facility planning to rebuild? [I Yes c ] NoIf yes, will you rebuild to
pre-hurricane operationssmaller operationslarger operationsother (please specify)
When do you plan to rebuild?[ ] immediately [ ] in 3 months [ ] in 3 to 6 months[ ] 6 to 12 months [ ] 12 to 18 months [ ] in 18 to 36 months [ ] other
Have you contacted boat owners regarding your rebuilding plans? [ ] Yes [ ] NoWith your hurricane experience, does your facility plan to have a new hurricanepreparedness plan? [I Yes [ 1 NoIf yes, briefly describe this new plan.
VI Post Hurricane Andrew
Post hurricane storage capacity: Wet Dry Other (please specifv)Total available storage capacityNumber Occupied
3
8 0

Post hurricane price structure:Dry Storage: ($ per linear foot per day or month or fixed rate per month)Wet Storage: ($ per linear foot per day or month or fixed rate per month)Other (specify): ($ per linear foot per day or month or fixed rate per month)
Post hurricane employment characteristics:Number of people employed at this facility:Full TimePart Time
-- Please indicate post hurricane marina services offered below:food/groceriesmarina suppliesboat repairselectricitysewage flush outrestaurant .telephonefuelothers (please specify)
Please return the completed questionnaire in the enclosed stamped envelope to the:
Boating Research CenterDivision of Marine AffairsUM - RSMAS4600 Rickenbacker CausewayMiami, FL 33143
Thank you.
4
81

Appendix F
83

Appendix FCover Letter and Survey Questionnaire
Boat Yards
Dear Sir/Madam:
The University of Miami Boating Research Center (BRC) through a grant fromthe Florida Sea Grant Program, is conducting a study that will help analyze the shortand long term effects of Hurricane Andrew on the Dade County boating community.As part of this study, we are conducting a survey of boat repair facilities in DadeCounty to assess the damage, if any, to these facilities, to determine their futurerebuilding plans, and to estimate the impact of Hurricane Andrew to the boat repairoperations. We are asking your cooperation in completing the enclosed surveyquestionnaire.
Please fill out the enclosed questionnaire promptly and return in the enclosedstamped envelope to the Boating Research Center. The survey will take about twentyminutes to complete. Your cooperation is greatly needed for the success of the study.A copy of the results of the study will be made available to you upon request. If youhave any questions, please call the BRC at (305) 361-4012.
Thank you very much for your cooperation in this very important project.
Sincerely,.
Dr. Edward K. BakerPrincipal Investigator
Boating Research CenterRosenstiel School of Marine and Atmospheric Science
Marine Affairs4600 Rickenbacker CausewayMiami, Florida 33149-1098
Tel: (305) 361-4012FAX: (305) 361-4675
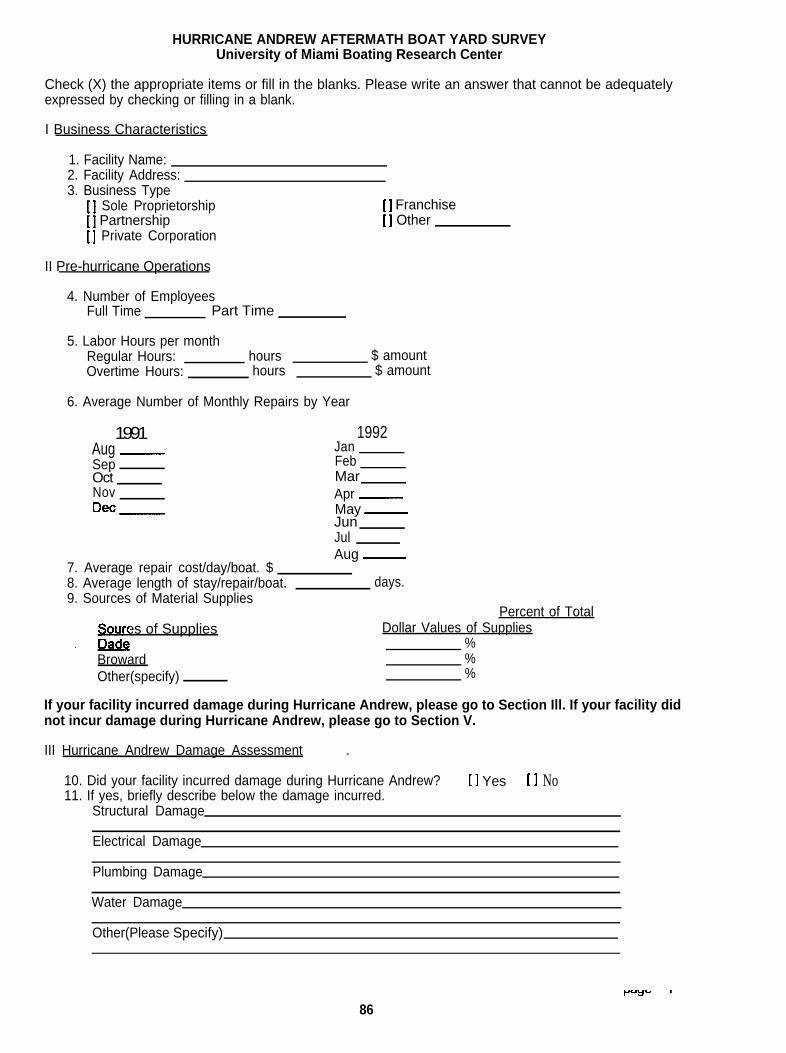
HURRICANE ANDREW AFTERMATH BOAT YARD SURVEYUniversity of Miami Boating Research Center
Check (X) the appropriate items or fill in the blanks. Please write an answer that cannot be adequatelyexpressed by checking or filling in a blank.
I Business Characteristics
1. Facility Name:2. Facility Address:3. Business Type
[ ] Sole Proprietorship[ ] Partnership[ ] Private Corporation
[ ] Franchise[ ] Other
II Pre-hurricane Operations
4. Number of EmployeesFull Time Part Time
5. Labor Hours per monthRegular Hours:Overtime Hours:
hourshours
$ amount$ amount
6. Average Number of Monthly Repairs by Year
1992JanFebMarApr -May -JunJulAug -
days.
Percent of TotalDollar Values of Supplies
%%%
1991Aug -SepOctNovDee-
7. Average repair cost/day/boat. $8. Average length of stay/repair/boat.9. Sources of Material Supplies
0 ces of Supplies.E
BrowardOther(specify)
If your facility incurred damage during Hurricane Andrew, please go to Section Ill. If your facility didnot incur damage during Hurricane Andrew, please go to Section V.
.III Hurricane Andrew Damage Assessment
10. Did your facility incurred damage during Hurricane Andrew? [I Yes [I No11. If yes, briefly describe below the damage incurred.
Structural Damage
Electrical Damage
Plumbing Damage
Water Damage
Other(Please Specify)
86

12. Total assessed value of damage incurred. $.13. Does your facility have hurricane damage insurance?
14. If yes, will your insurance cover the damage to your facility?15. What percent of damage will be covered? %16. Does your facility have “business interruption insurance”?
IV Rebuilding Plans
17. Have you rebuilt or completed repairs of your facility?If no, is your facility planning to rebuild?
[I Yes [I No[I Yes [I No
18. If yes, will you rebuild topre-hurricane operationssmaller operationslarger operationsother (please specify)
19. When do you plan to rebuild?[ ] immediately [ ] within 3 months[ ] 6 to 12 months [ ] 12 to 18 months
V Post Hurricane Andrew
20. Number of EmployeesFull Time
Part Time
21. Labor Hours per monthRegular Hours: hours $ amountOvertime Hours: hours $ amount
22. Average Number of Monthly Repairs by type of repair, by year.
[ 1 Yes [ 1 No[ 1 Yes [I No
[I Yes [I No
[ ] 3 to 6 months[ ] 18 to 36 months[ ] other
1992, 1993
Sep Oct Nov Dec JanHurricane Related
RepairsRegular repair
& Maintenance
23. Average repair cost/day/boat. $24. Average length of stay/repair/boat.25. Sources of Material Supplies
Sources of Supplies
EardQ@!x(specify)
* days.
Percent of TotalDollar Values of Supplies
%%%
Thank you for your cooperation.Please return the completed questionnaire in the enclosed stamped envelope to the:
Boating Research CenterDivision of Marine AffairsUM - RSMAS4600 Rickenbacker CausewayMiami, FL 33149
87

Appendix G
89

Dear Sir/Madam:
Appendix GCover Letter and Survey Questionnaire
Boat Dealerships
The University of Miami Boating Research Center (BRC) through a grant fromthe Florida Sea Grant Program, is conducting a study that will help analyze the shortand long term effects of Hurricane Andrew on the Dade County boating community.As part of this study, we are conducting a survey of boat dealers in Dade County toassess the damage, if any, to these facilities, to determine their future rebuilding plans,and to estimate the impact of Hurricane Andrew to the boat dealers’ operations. Weare asking your cooperation in completing the enclosed survey questionnaire.
Please fill out the enclosed questionnaire promptly and return in the enclosedstamped envelope to the Boating Research Center. You can also FAX your responseto BRC at (305) 361-4675. Your cooperation is greatly needed for the success of thestudy. A copy of the results of the study will be made available to you upon request.If you have any questions, please call the BRC at (305) 361-4012.
Thank you very much for your cooperation in this very important project.
Sincerely,
Dr. Edward K. BakerPrincipal Investigator
Boating Research CenterRosenstiel School of Marine and Atmospheric Science
Marine Affairs4600 Rickenbacker CausewayMiami, Florida 33149-1098
Tel: (305) 361-4012FAX: (305) 361-4675
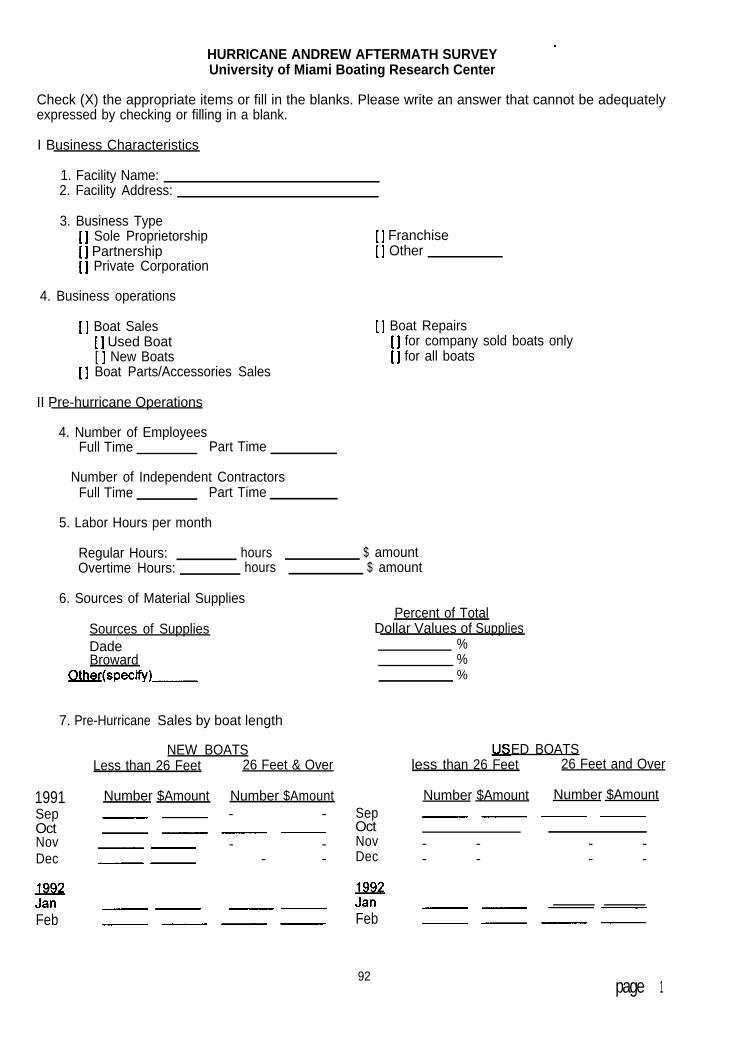
HURRICANE ANDREW AFTERMATH SURVEYUniversity of Miami Boating Research Center
Check (X) the appropriate items or fill in the blanks. Please write an answer that cannot be adequatelyexpressed by checking or filling in a blank.
I Business Characteristics
1. Facility Name:2. Facility Address:
3. Business Type[ ] Sole Proprietorship[ ] Partnership[ ] Private Corporation
[ ] Franchise[ ] Other
4. Business operations
[ ] Boat Sales[ ] Used Boat[ ] New Boats
[ ] Boat Parts/Accessories Sales
[ ] Boat Repairs[ ] for company sold boats only[ ] for all boats
II Pre-hurricane Operations
4. Number of EmployeesFull Time Part Time
Number of Independent ContractorsFull Time Part Time
5. Labor Hours per month
Regular Hours: hoursOvertime Hours: hours
$ amount$ amount
6. Sources of Material Supplies
Sources of SuppliesDadeBroward
Otherb.=W_
Percent of TotalDollar Values of Supplies
%%%
7. Pre-Hurricane Sales by boat length
NEW BOATSLess than 26 Feet 26 Feet & Over
ED BOATSless than 26 Feet 26 Feet and Over
1991 Number $Amount Number $Amount Number $Amount Number $AmountSep - -
x T - -Sep
Oct Oct - - - -Nov Nov- -Dec :T - -
- - - -Dec - - - -
F F-- --Feb Feb_ _ - _ z 1 _ -
92 page 1
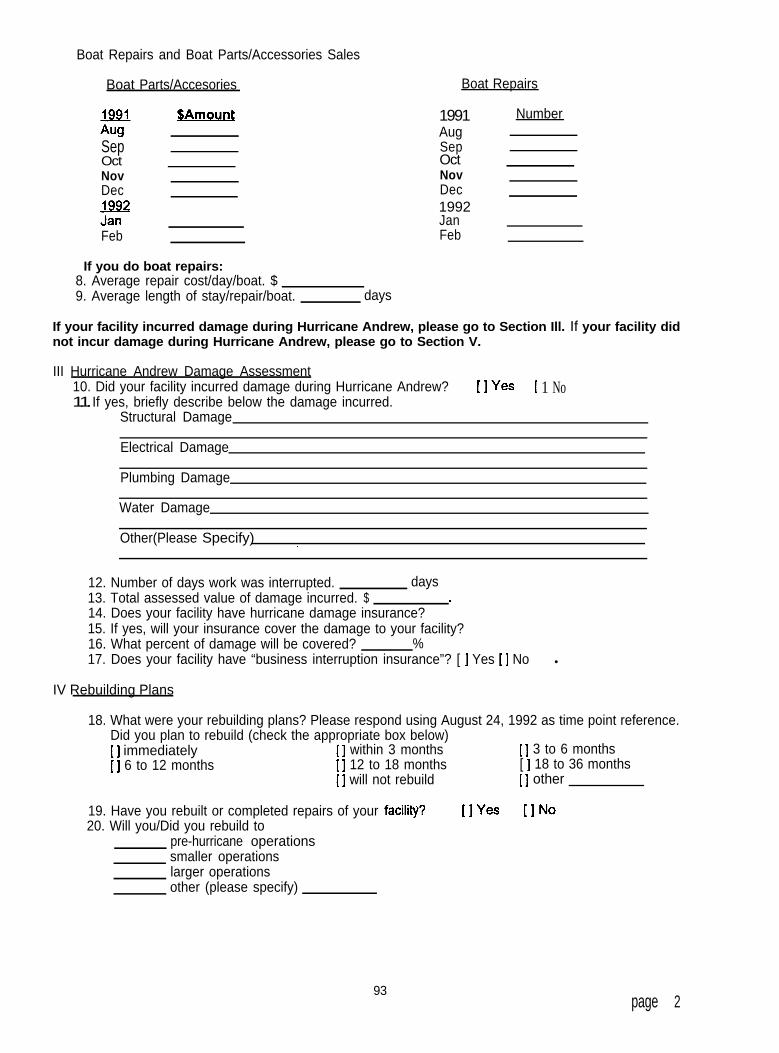
Boat Repairs and Boat Parts/Accessories Sales
Boat Parts/Accesories Boat Repairs
SepOctNovDec
EFeb
1991AugSepOctNovDec1992JanFeb
Number
If you do boat repairs:8. Average repair cost/day/boat. $9. Average length of stay/repair/boat. days
If your facility incurred damage during Hurricane Andrew, please go to Section Ill. If your facility didnot incur damage during Hurricane Andrew, please go to Section V.
III Hurricane Andrew Damage Assessment10. Did your facility incurred damage during Hurricane Andrew? [IYes t 1 No11. If yes, briefly describe below the damage incurred.
Structural Damage
Electrical Damage
Plumbing Damage
Water Damage
Other(Please Specify) .
12. Number of days work was interrupted. days13. Total assessed value of damage incurred. $
’14. Does your facility have hurricane damage insurance?15. If yes, will your insurance cover the damage to your facility?16. What percent of damage will be covered? %17. Does your facility have “business interruption insurance”? [ ] Yes [ ] No l
IV Rebuilding Plans
18. What were your rebuilding plans? Please respond using August 24, 1992 as time point reference.Did you plan to rebuild (check the appropriate box below)[ ] immediately [ ] within 3 months [ ] 3 to 6 months[ ] 6 to 12 months [ ] 12 to 18 months [ ] 18 to 36 months
[ ] will not rebuild [ ] other
19. Have you rebuilt or completed repairs of your faciliv? [IYes [INo20. Will you/Did you rebuild to
pre-hurricane operationssmaller operationslarger operationsother (please specify)
93page 2

V Post-Hurricane Andrew
21. Number of EmployeesFull Time Part Time
Number of Independent ContractorsFull Time Part Time
22. Labor Hours per monthRegular Hours:Overtime Hours:
hours $ amounthours $ amount
23. Post-Hurricane Sales by boat lengthNEW BOATS
n 26 Feet 26 Feet & Over
I992 Number $Amount Number $AmountSepOct T T - -Nov - - - -Dec _ - - _1993Jan - -Feb T 1 _ -
OctNovDec1993JanFeb
Boat Repairs and Boat Parts/Accessories Sales
Boat Parts/Accesories Boat Repairs
1992 $Amount 1992Aug AugSep SepOct OctNov NovDec Dec
2 !?Feb Feb
Number
If you do boat repairs24. Average repair cost/day/boat. $25. Average length of stay/repair/boat.
26. Sources of Material Supplies
days
USFD BOATSLess than 26 Feet 26 Feet and Over
Number $Amount Number $Amount_____ __________ ______ ________- - - -- - - -- - - -
- - - -- - - -
Sources of Supplies
kOtherWecW
Percent of TotalDollar Values of Supplies
%%%
Thank you for your cooperation.Please return the completed questionnaire in the enclosed stamped envelope to the:Boating Research CenterDivision of Marine AffairsUM - RSMAS4600 Rickenbacker CausewayMiami, FL 33149
94

-Appendix H
-
95

-
-
-
UNIVERSITY OF
Appendix HCover Letter and Survey Questionnaire
Boat Manufacturers
-
Dear Sir/Madam:
The University of Miami Boating Research Center (BRC) through a grant fromthe Florida Sea Grant Program, is conducting a study that will help analyze the shortand long term effects of Hurricane Andrew on the Dade County boating community.As part of this study, we are conducting a survey of boat building facilities in DadeCounty to assess the damage, if any, to these facilities, to determine their futurerebuilding plans, and to estimate the impact of Hurricane Andrew to boat buildingoperations. We are asking your cooperation in completing the enclosed surveyquestionnaire.
-
Please fill out the enclosed questionnaire promptly and return in the enclosedstamped envelope to the Boating Research Center. Your cooperation is greatly neededfor the success of the study. A copy of the results of the study will be made availableto you upon request. If you have any questions, please call the BRC at (305) 361-4012.
-Thank you very much for your cooperation in this very important project.
.
-
--
Sincerely,
Dr. Edward K. BakerPrincipal Investigator
Boating Research CenterRosenstiel School of Marine and Atmospheric Science
Marine Affairs4600 Rickenbacker CausewayMiami, Florida 33149-1098
Tel: (305) 361-4012FAX: (305) 361-4675
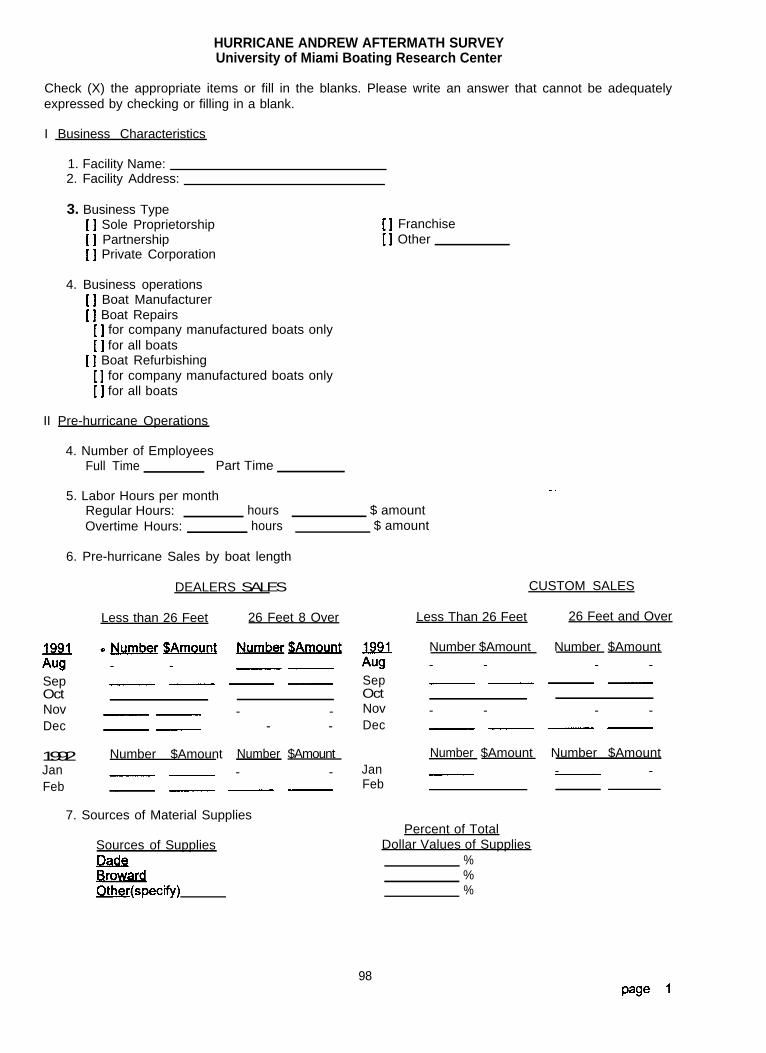
HURRICANE ANDREW AFTERMATH SURVEYUniversity of Miami Boating Research Center
Check (X) the appropriate items or fill in the blanks. Please write an answer that cannot be adequatelyexpressed by checking or filling in a blank.
I Business Characteristics
1. Facility Name:2. Facility Address:
3. Business Type[ ] Sole Proprietorship[ ] Partnership[ ] Private Corporation
[ ] Franchise[ ] Other
4. Business operations[ ] Boat Manufacturer[ ] Boat Repairs
[ ] for company manufactured boats only[ ] for all boats
[ ] Boat Refurbishing[ ] for company manufactured boats only[ ] for all boats
II Pre-hurricane Operations
4. Number of EmployeesFull Time Part Time
5. Labor Hours per monthRegular Hours:Overtime Hours:
hours $ amounthours $ amount
6. Pre-hurricane Sales by boat length
DEALERS SALES CUSTOM SALES
Less than 26 Feet 26 Feet 8 Over Less Than 26 Feet 26 Feet and Over
Number $Amount tNumber $Amount- - _Y - - - -
Sep SepOct - - - - Oct - - - -Nov Nov- -Dec Tz - -
- - - -Dec _ _ - _
1992 Number $Amount Number $Amount Number $Amount Number $AmountJan Jan- -Feb T T _ -
- -Feb - -
7. Sources of Material Supplies
Sources of Supplies
EardOther(specW
Percent of TotalDollar Values of Supplies
%%%
98

If you do boat repairs or boat refurbishing:8. Average repair cost/day/boat. $9. Average length of stay/repair/boat. days
If your facility incurred damage during Hurricane Andrew, please go to Section Ill. If your facility didnot incur damage during Hurricane Andrew, please go to Section V.
III Hurricane Andrew Damage Assessment
10. Did your facility incurred damage during Hurricane Andrew? W= [INo11. If yes, briefly describe below the damage incurred.
Structural Damage
Electrical Damage
Plumbing Damage
Water Damage
Other(Please Specify)
12. Number of days work was interrupted. days13. Total assessed value of damage incurred. $
.14. Does your facility have hurricane damage insurance?15. If yes, will your insurance cover the damage to your facility?16. What percent of damage will be covered? %17. Does your facility have “business interruption insurance”?
[I Yes [ 1 No[I Yes [I No
-’ [ ] Y e s [ ] N o
IV Rebuilding Plans
18. Have you rebuilt or completed repairs of your facility?If no, is your facility planning to rebuild?
19. If yes, will you rebuild topre-hurricane operationssmaller operationslarger operationsother (please specify)
1 I Yes[ 1 Yes
[I No[I No
20. When do you plan to rebuild?[ ] immediately [ ] within 3 months[ ] 6 to 12 months [] 12 to 18 months
V Post Hurricane Andrew
[ ] 3 to 6 months[ ] 18 to 36 months[ ] other
21. Number of EmployeesFull Time Part Time
22. Labor Hours per monthRegular Hours: hours $ amountOvertime Hours: hours $ amount
99
page 2
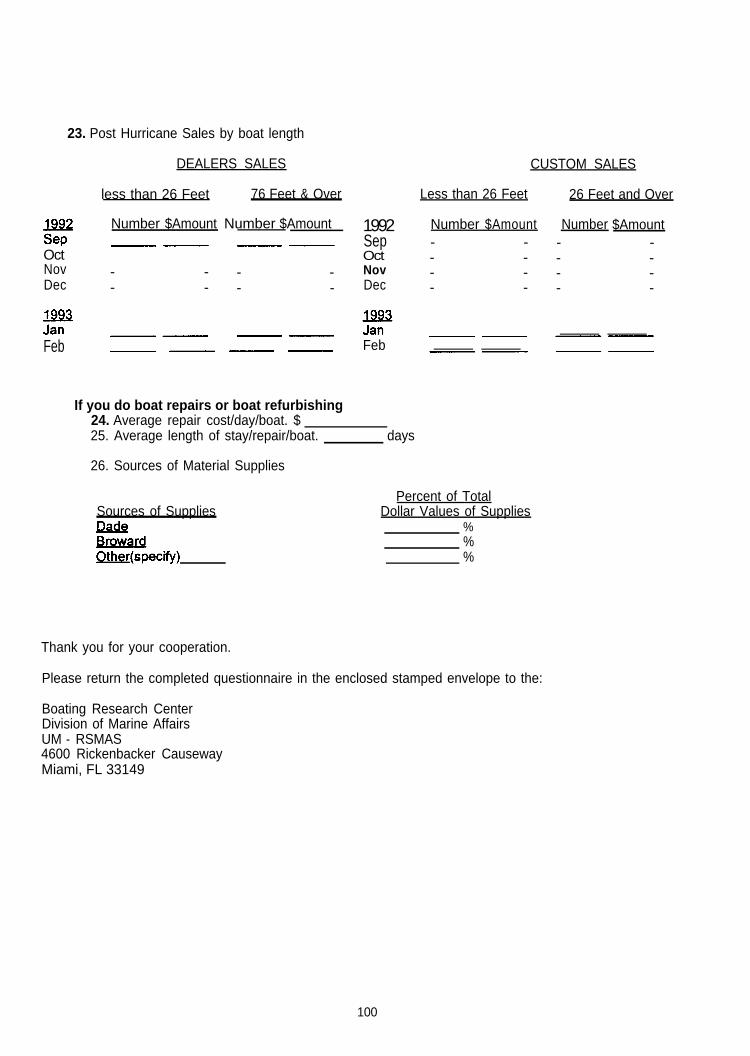
23. Post Hurricane Sales by boat length
DEALERS SALES CUSTOM SALES
less than 26 Feet 76 Feet & Over
Number $Amount tNumber $Amount
- - - -OctNov - - - -Dec - - - -
EF -- PP
Feb _ _ - _
1992SepOctNovDec
EFFeb
Less than 26 Feet 26 Feet and Over
Number $Amount Number $Amount- - - -- - - -- - - -- - - -
-- --
If you do boat repairs or boat refurbishing24. Average repair cost/day/boat. $25. Average length of stay/repair/boat.
26. Sources of Material Supplies
days
Sources of Supplies
EardOther(specW
Percent of TotalDollar Values of Supplies
%%%
Thank you for your cooperation.
Please return the completed questionnaire in the enclosed stamped envelope to the:
Boating Research CenterDivision of Marine AffairsUM - RSMAS4600 Rickenbacker CausewayMiami, FL 33149
100