.I b3 - Welcome to the National Sea Grant Librarynsgd.gso.uri.edu/flsgp/flsgpb97001.pdf ·...
108
Transcript of .I b3 - Welcome to the National Sea Grant Librarynsgd.gso.uri.edu/flsgp/flsgpb97001.pdf ·...


.3b2-.I
3

Contents
List of Tables, Figures, and Plates, ixForeword, xi
Preface, xiiiChapter 1. Introduction, 1
Chapter 2. Historical Discussion of Florida Hurricanes, 51871-1900, 61901-1930, 91931-1960, 161961-1990, 24
Chapter 3. Four Years and Billions of Dollars Later, 361991, 361992, 371993, 421994, 43
Chapter 4. Allison to Roxanne, 471995, 47
Chapter 5. Hurricane Season of 1996, 54Appendix 1. Hurricane Preparedness, 56
Appendix 2. Glossary, 61References, 63
Tables and Figures, 67Plates, 129
Index of Named Hurricanes, 143Subject Index, 144
About the Authors, 147

Tables, Figures, and Plates
Tables, 67
1. Saffir/Simpson Scale, 672. Hurricane Classification Prior to 1972, 683. Number of Hurricanes, Tropical Storms, and Combined Total Storms by
10-Year Increments, 694. Florida Hurricanes, 1871-1996, 70
Figures, 84
l A-I. Great Miami Hurricane2A-B. Great Lake Okeechobee Hurricane3A-C. Great Labor Day Hurricane4A-C. Hurricane Donna
5. Hurricane Cleo6A-B. Hurricane Betsy7A-C. Hurricane David
8. Hurricane Elena9A-C. Hurricane JuanIOA-B. Hurricane Kate1 l A-J. Hurricane Andrew12A-C. Hurricane Albert0
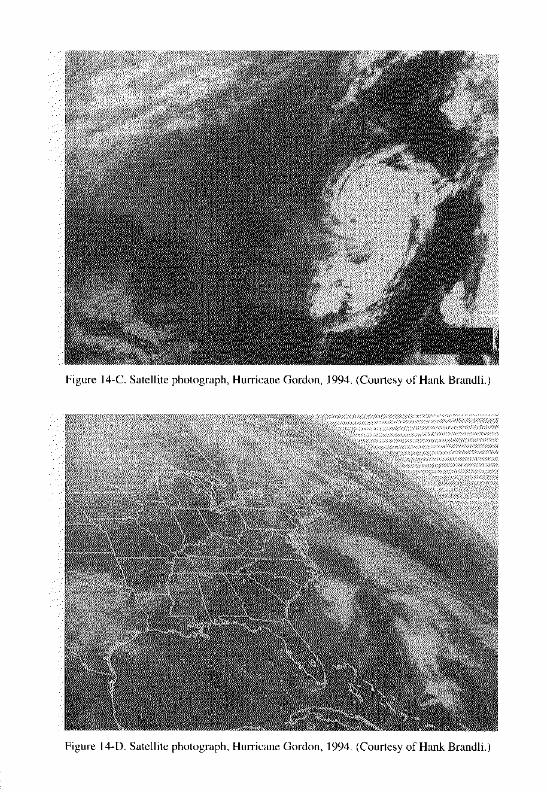
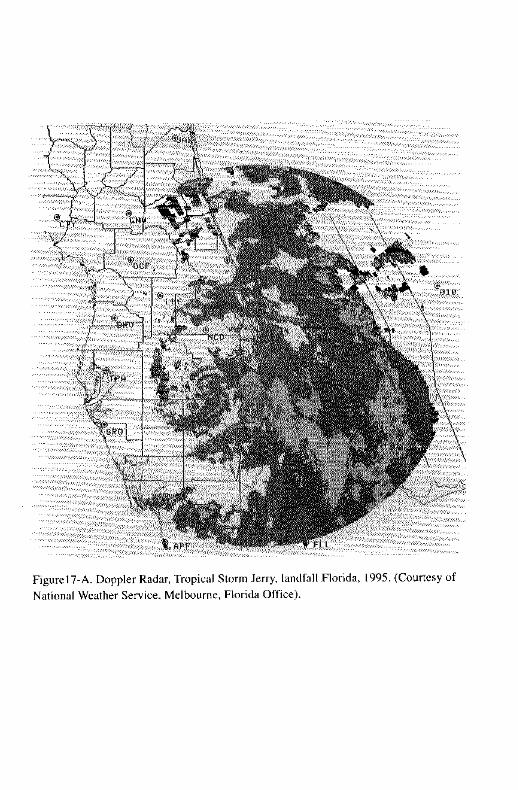
13. Hurricane Beryl14A-D. Hurricane Gordon15A-C. Hurricane Allison16A-F. Hurricane Erin17A-B. Hurricane Jerry18A-G. Hurricane Opal
I9A. 1995 Hurricane Season19B. Five 1995 Storms20. Hurricane Josephine ,
Plates, X29
1. 1871-18802. 1881-18903. 1891-19004. 1901-19105. 1911-19206. 1921-19307. 1931-19408. 1941-19509. 1951-196010. 1961-197011. 1971-198012. 1981-199013.1991-199514.1996
Foreword
These days, nothing can escape the watchful, high-tech eyes of the NationalWeather Service. Our satellites and newly installed Doppler radars can de-tect even the slightest weather system, where it is, what it is doing.
Public awareness, a problem in the past, has increased also. HurricaneAndrew in 1992 taught a bitter lesson to many whose attitude was apathetic,and it’s possible that apathy kills more people than do winds and surges dur-ing a hurricane.
With our sophisticated detection and warning equipment, there is no rea-son for any one to die because of a hurricane-but people still do. Damagewill continue to be proportional to the increase in coastal building, but thatcan also be controlled.
Evidence showed that communities built away from the water’s edge sur-vived serious damage when Hurricane Opal struck the Florida Panhandle in1995. Homes that followed the local building codes also faired better.
Evidence also showed that some buildings built to code were heavily dam-aged during Andrew, but Andrew was a rare exception to the rule.
Dr. Theodore Fujita, an expert on severe weather and resulting damage,once suggested that we should build to the 200-mph standard instead of thepresent 120-mph ratings. But he also said that would be cost prohibitive, andhe was right. So what’s the answer? My next tropical cyclone will be mythirtieth, and I have observed several things during those storms. (1) Thereshould be a restriction on how close to the water’s edge any type of build-ings can be built. (2) Strict adherence to an updated building code shouldbecome standard practice (it is not now). (3) Public awareness should be in-creased. (4) Perhaps a little test on hurricanes and other storms should berequired for future builders and for all present and future homeowners. And(5) evacuation is a necessity in certain areas and should become a preciseprocedure. Evacuation saves lives!
X xi

Those people who are lucky enough to live on our beautiful Floridabeaches experience the ultimate in living-but not during a hurricane. Theywill likely be in an evacuation area and should go at first notice. Owners ofmobile homes should expect to move to shelters. Some in other areas willhave to move, too. Yes, it is a pain! And it has to be a traumatic experienceto come back after the storm and find one’s property inundated and dwell-ings either destroyed or badly damaged. But in most cases, one can reclaimthe property and rebuild the dwellings. On the other hand, if you choose tostay, it might be extremely difficult to erase your name from the obituarylist.
John M. Williams
Preface
This book presents, by historical periods, a summary of the hurricanes andtropical storms that affected Florida’s more than 1,200-mile-long coastlineduring the 126 years from 1871 through 1996.
Prior to the publication of the first edition, Florida Hurricanes and TropicalStorms, 1871-1993: An Historical Survey, the only books or reports exclu-sively on Florida hurricanes were R.W. Gray’s report, revised by Grady Nortonin 1949, titled Florida Hurricanes, and a survey by Gordon E. Dunn andstaff of the National Hurricane Center (NHC) also titled Florida Hurricanes.
Grady Norton and Gordon Dunn were important figures during the earlyyears of what is now known as the Tropical Prediction Center, formerly theNational Hurricane Center. Grady Norton was considered by many as oneof the best hurricane forecasters. After his death in 1954, Gordon Dunn wasnamed director of the NHC. After he retired, Dr. Robert Simpson becameNHC Director. He was followed by Dr. Neil Frank. Dr. Robert Burpee is thecurrent director in the new facility on the campus of Florida InternationalUniversity, Miami.
In addition to the report Florida Hurricanes, the 1995 NHC report titledThe Deadliest, Costliest, and Most Intense United States Hurricanes of ThisCentury provides invaluable information on both historical and recent hurri-canes affecting Florida and the United States.
Our primary goal in preparing the first and second editions of this bookwas to update the historical work as it pertains to Florida, to consolidate andstandardize technical terms published at the beginning of each hurricane sea-son on hurricane tracking maps, and to introduce the following new mate-rial pertaining to Florida: (1) a detailed historical discussion, (2) a chrono-logical listing of all Florida hurricanes, (3) 14 plates of hurricane and tropicalstorm tracks grouped into IO-year increments, and (4) a table showing the
xii. . .
x111

number of tropical storms and hurricanes by lo-year increments. The bookis written on a nontechnical level for the general reader who is interested inknowing when and where tropical cyclones affected Florida and the magni-tude of damage inflicted by the storms. Those wishing more technical infor-mation on tropical cyclones can consult the reference, contact the NHC di-rectly, or contact Internet web sites (see References and Internet Web Sites).
Principal reference documents used in preparing this book, in addition tothe ones mentioned above, came from the National Oceanic and AtmosphericAdministration (NOAA) publication Tropical Cyclones of the North Atlan-tic Ocean, 1871-1986, Historical Climatology Series 6-2; U.S. Weather Bu-reau publications Climatolbgical Data (for Florida 1897-1965); and MonthlyWeather Review.
It should be noted that this book deals primarily with the characteristicsof Florida hurricanes and tropical storms and some eye-witness accounts.Amounts of precipitation associated with Florida hurricanes were only notedbut not discussed in this book because of their frequent occurrence resultingfrom other systems such as tropical depressions or nontropical systems. How-ever, we should point out that precipitation from a hurricane or tropical stormcan be heavy and can cause major damage and flooding.
Tropical depressions can also cause heavy flooding problems and dam-age. Tropical waves and depressions are not named. Some of the direct quoteswe use make reference to the earlier terms “Great Hurricane” and “MajorHurricane.” The reader is referred to the glossary and tables for a detailedexplanation of all terms, including the Saffir/Simpson Scale now in use tocategorize hurricanes.
We are especially thankful to the reviewers of the original manuscript whopointed out several deficiencies and errors and who provided important sug-gestions leading to an improved and accurate final manuscript. We are espe-cially thankful to friends, colleagues, assistants, and organizations whose helpwe could not have done without. Specifically, we thank the following peoplewho helped in preparing the first edition: Bill Mahan, who encouraged us toprepare the first edition; Annette Bernard, Ann Bergonzoni, Derrick Doehring,Rosary Pedreira, Arnold Samreth, and Huan Feng for manuscript prepara-tion; Henry (Hank) Brandli for graciously providing us with his satelliteimages of Florida hurricanes; Rob Downey for the color photograph of Hur-ricane Andrew; Anita Bromberg and John Reposa, who assisted in the prepa-ration of the plates showing the hurricane tracks; Victoria (Tori) Smith andJeanette C. Sparks of the Florida Tech Evans Library for searching histori-cal documents; Florida Sea Grant College, which provided financial assis-tance to complete the first edition; Jay Humphreys, who read the manuscript
and provided suggestions for improvement; the News/Sun Sentinel, Ft. Lau-derdale, and the Miami Herald for the use of their photographs; Ruth Warnerfor kindly providing her grandmother’s account of the 1926 Miami hurricane;Lois Stephens for allowing us to use her personal account of Hurricane An-drew titled “On Sabbatical with Hurricane Andrew”; and the National Hur-ricane Center for providing photographs.
In preparing both the first and second editions, we are especially thankfulto the Office of the National Weather Service in Melbourne for providingDoppler radar images and other information.
Finally, the following people were helpful in contributing to this secondedition: Hank Brandli, who has always faithfully and graciously provided uswith a steady stream of satellite photographs; Mike Witiw of Florida Tech,who also provided satellite images; Vern Miller, Tom Needham, and TracyWilcox of the Panama City News Herald, who kindly provided photographsof hurricane damage from Opal, Allison, and Erin, and Nina Williams, alsoof Panama City, who sent pictures and articles about Opal; Susan Hurd,Kathleen Lisa, and Kuei-Tin (Katy) Hsu, who assisted in word-processingand software; Larry Floyd for providing photographs of Hurricane Andrewdamage; Richard Clark, who provided historical photographs of the 1926Miami hurricane; and Susan Grantharn of Florida Sea Grant College, whopatiently worked with us on all aspects of both editions of this book. We aregrateful to University Press of Florida for accepting this project.
xiv xv

Chapter I
Introduction
A hurricane is an extremely violent whirling and spiraling tropical cyclone,shaped somewhat like a funnel, that frequently originates in tropical regionsof the North Atlantic Ocean, Caribbean Sea, Gulf of Mexico, Western Pa-cific Ocean, Eastern Pacific Ocean, South Pacific, China Sea and IndianOcean. The term cyclone, used by weathermen and meteorologists, refers toan area of low pressure in which winds move around the pressure center andare usually attended by foul weather and strong wind speeds. A tropical cy-clone is a nonfrontal, warm-core, low pressure synoptic scale storm that de-velops over tropical or subtropical waters and has a definite organized circu-lation.
Tropical Cyclones are called typhoons in the western North Pacific Oceanand South Pacific Ocean; hurricanes in the Eastern North Pacific and Atlan-tic Basin; baguios in the South China Sea; cyclones in the Indian Ocean; andwilly-willies in Australia.
The size of a typical tropical cyclone can vary considerably dependingon the extent of the wind fields and rain fields. In a relatively large hurri-cane, such as the Florida hurricane of September 1947, hurricane force windscan extend 100 miles from the center (i.e. a distance from Palm Beach toMelbourne). However, in August 1992 Hurricane Andrew, the most destruc-tive hurricane ever to strike Florida, or the U.S. mainland for that matter,had maximum winds with a radius of only about 12.5 miles.
To be classified officially as a hurricane, wind speed in a tropical cyclonemust be 74 miles per hour or greater. The direction of rotation of wind in atropical cyclone is counterclockwise in the northern hemisphere, and clock-wise in the southern hemisphere. The average hurricane’s center, referred toas the eye, is about 14 miles in diameter. The eye is surrounded by hurri-cane force winds, and is known as the wall cloud, or eye wall. Outside thewall cloud, or area of maximum winds, winds decrease fairly rapidly to tropi-cal storm or gale force.

Within the hurricane, barometric pressure is l-3 inches of mercury belowthe standard atmospheric pressure at sea level which is 29.92 inches.
The North Atlantic Hurricane Season occurs during the months of Junethrough November, with September generally having the greatest number ofstorms. The total number of hurricanes or tropical storms show great varia-tion from year to year. In fact, certain past multi-decadal periods had signifi-cantly greater numbers of hurricanes than others. This is supported by therecent study of William M. Gray in 1990 who reported that the period fromthe late 1940s through the late 1960s had a much larger number of hurri-canes (i.e. a strong cycle) than during the 1970s and 198Os, except for Gil-bert in 1988 in the Caribbean and Hugo in 1989 in the U.S. (1988 and 1989were weak cycle years). The year of “Andrew”, 1992, was also a weak cycleyear. The average year is about 9 named storms with 6 of these becominghurricanes. Possibly two of the hurricanes will be intense, that is a Category3,4, or 5 on the Saffir/Simpson Scale.
Quoting a passage from Gray’s 1990 article entitled Strong AssociationBetween West African Rainfall and U.S. Landfall of Intense Hurricanes:
Seasonal and multi-decadal variations of intense hurricane activity are closelylinked to seasonal and multi-decadal variations of summer rainfall amountsin the Western Sahel region of West Africa. In general, the annual frequencyof intense Atlantic hurricanes was appreciably greater from ‘I947 to 1969,when plentiful amounts of rainfall occurred in West Africa, than during theyears between 1970 to 1987, when drought conditions prevailed.
The average forward movement of a hurricane approaching the Floridacoastline is about 6- 15 miles per hour. The direction of movement relative!.Ito the coastline has a large bearing on added destructive forces, with the per-pendicular landfall being the most dangerous situation. This is because thewind field in a hurricane is typically asymmetric with the strongest wind gen-erally within the right-front quadrant of the storm as viewed in the directionof movement and with the forward speed added to the wind speed. The right-front quadrant is the side of the wind field which produces the strongest stormsurge, which, in most cases, is the most destructive part of the hurricane.
A storm surge, also called a hurricane surge, is the abnormal rise in sealevel accompanying a hurricane or any other intense storm. The height ofthe storm surge is the difference between the observed level of the sea sur-face and the level in the absence of the storm. The storm surge is estimatedby subtracting the normal or astronomical tide from the observed or estimatedstorm tide. Surge heights vary considerably and result from a combinationof direct winds and atmospheric pressure. Water transport by waves and
swells, rainfall, and shoreline configuration, bottom topography, and tideheights at the time the storm or hurricane hits the coast are also factors. Asan example of an extreme storm surge, Hurricane Donna, which struck theflorida Keys in 1960, caused a surge of an estimated 12 to 14 feet, which isvery significant considering the fact that there are few structures and littleterrain that high in the Keys! A more catastrophic surge was the 24.4 footsurge which resulted from Hurricane Camille which struck the Mississippicoastline in 1969. The potentially devastating effects of the storm surge arefurther illustrated if one considers that a cubic yard of seawater weighs nearlythree-fourths of a ton which pretty well guarantees destruction of anythingin its path.
The storm surge has a tendency to dissipate the farther inland it goes, par-ticularly if the land rises in elevation. However, winds and flooding still re-main a problem. High winds, the storm surge, battering waves, and high tidemake a hurricane a potentially deadly killer with accompanying devastationand huge losses to property. In addition, tornadoes can be spawned by hurri-canes, adding to the overall threat.
Torrential rainfall, which can also occur in a hurricane, adds to life-threat-ening and major damaging effects of a hurricane by causing floods and flashfloods. For example, the aftermath of Hurricane Agnes, which was a rela-tively weak Florida hurricane, but well known as one of the costliest hurri-canes in the mid-Atlantic states, resulted in severe inland flooding from tor-rential rainfall from its merging with another weather system in mountainousareas. In this case the hurricane surge at landfall played only a small part inthe total destruction that resulted.
High winds alone can lead to a barrage of flying debris, including treelimbs and branches, signs and sign posts, roofing (including entire roofs inmajor storms), and metal siding, all of which can move through the air likemissiles.
Except when crossing completely flat, wet areas, such as in extreme southFlorida, hurricanes usually weaken rapidly as they move inland. HurricaneAndrew actually intensified slightly as it passed over the swampy area of ex-treme south Florida.
However, the remnants of a hurricane can bring 6 to 12 inches of rain ormore to an area as the storm passes. Should a weakened hurricane on landreturn to the sea, it can regain strength.
It is clear then that entire communities, including residential and businessbuildings, can be wiped out by a hurricane.
Because of the difficulty in relating the different and varying factors orcharacteristics of a hurricane to the destruction, the Saffir/Simpson Scale was
2 3

conceived in 1972 and introduced to the public in 1975. This scale, namedin behalf of Herbert Saffir and Robert Simpson, has been used for over 20years to estimate the relative damage potential of a hurricane due to windand storm surge. The SaffirLSimpson Scale categorizes a hurricane as beingeither a one, two, three, four or five, depending upon the barometric pres-sure, the wind speed, and the storm surge and destruction (Table 1). A Cat-egory 1 hurricane would inflict minimal damage, for example, primarily toshrubbery, trees, foliage, unanchored structures, mobil homes, small craft,and low lying areas which could become flooded. A Category 4 or 5 hurri-cane would cause catastrophic damage such as blown down trees and powerlines and poles, overturned vehicles, torn down or blown away buildings,complete destruction of mobile or manufactured homes, entire mobile homeparks, and massive flooding. After Hurricane Andrew, the Fujita TornadoScale was used to assess damage. Dr. Theodore Fujita is an expert on torna-does and severe weather. F0 to F5 indicates winds from 40 mph to over 261mph.* Evidence showed that there was a possibility of F3 and F4 tornadoactivity in the wall-cloud of Andrew.
The practical usefulness of the Saffir/Simpson Scale is that it relates prop-erties of the hurricane to previously observed damage. Historically and be-fore the SaffirLSimpson Scale was developed, hurricanes were referred to aseither Great Hurricanes, Severe, Minimal, Major, or Extreme Hurricanes; be-cause these terms are no longer used, the reader is referred to the gloss-ary for an explanation of the these historical terms and to Tables 1 and 2.Tropical storms are named but are not assigned a Saffir/Simpson categorynumber.
1. Fujita tornado scale:F0 = 40-72 mphFl = 73-112 mphF2 = 113-57 mphF3 = 158-206 mphF4 = 207-60 mphF5 = >260 mph
Chapter 2
Historical Discussion of Florida Hurricanes
While Florida is often considered synonymous with sunshine and is frequentlycalled the Sunshine State, mention of the state also brings to mind summeror fall tropical storms and hurricanes. These storms move in a west to north-west direction through the Caribbean and Atlantic toward Florida’s east coastand generally northward in the Gulf area. From the year 1493 to 1870, theCaribbean area and Florida experienced nearly 400 hurricanes as reportedby Professor E.B. Garriot in 1900 in his classic study, West Indian Hurri-canes. Many Spanish galleons loaded with gold, silver and other treasure musthave met a swift and untimely demise at the hand of a hurricane or tropicalstorm. As a result, today treasure hunting is an active and frequently profitablebusiness in Florida.
In recent times, from 187 1 to 1996, over 1000 tropical cyclones have oc-curred in the North Atlantic, Caribbean Sea, and Gulf of Mexico. Of this to-tal, about 184 have reached Florida, with 74 of these known to have hurri-cane force winds (wind speed > 74 mph) and 79 with tropical storm forcewinds (39-73 mph).
During the early U-year period from 187 1 to 1885, there were 3 1 tropicalcyclones of unknown intensity (shown by the solid line on Plates 1 and 2). His-torical data indicate that some of these were hurricanes. Because these hurri-canes have not been officially documented, they are listed as total combinedstorms for the purposes of overall count of Florida hurricanes (Table 3).
In the last 126-year period, there were as many as 21 (in 1933) hurricanesand tropical storms during an individual year, and there were 29 years dur-ing which no tropical cyclones made landfall or their center passed immedi-ately offshore of the Florida coastline (Femandina Beach to Key West toPensacola). It should be emphasized that data gathered before 1900 is sketchythough some accounts are detailed. Most data obtained after World War IIare reliable.
4 5

-
While early records are fragmentary and incomplete, the following is adiscussion of the more formidable Florida hurricanes. For convenience andto provide readable hurricane tracks, the discussion examines hurricanes oc-curring within 10-year periods. When possible the Saffir/Simpson Scale(Table 1) describes the hurricane category for both past hurricanes (beforethe scale was developed), and recent hurricanes.
1871-1900
Starting in 187 1, only a few years after the Civil War, tropical cyclone databecame part of the historical inventory of the U.S. Signal Service and laterthe U.S. Department of Agriculture Weather Bureau which collected, archivedand published these data. Relying on early works of authors, such as WestIndian Hurricanes (Garriott, 1900), annual tropical cyclone tracks for theyears 187 I- 1990 were later published in the NOAA Historical ClimatologySeries 6-2, Tropical Cyclones of the North Atlantic, 1871-l 986 (NOAA, 1987).The yearly tracks were extracted from that NOAA publication and are pre-sented here by IO-year periods.
Looking at the first 10 years of tropical cyclone tracks (Plate l), the moststriking feature is that only four tropical cyclones entered Florida’s coast fromthe east, southeast, Atlantic, or Caribbean. In contrast, 17 tropical cyclonesentered the west coast and panhandle region from the southwest, the north-western Caribbean and Gulf of Mexico.
The periods 1881-1890 (Plate 2) and 1891-1900 (Plate 3) show essentiallythe same pattern except that the concentration of northeasterly tracks shiftsfurther to the south.
We shall see from an examination of the other plates that this patternchanged after the turn of the century. Principally all of the storms which en-tered the west coast of Florida came from the northwestern Caribbean or thesouthern portion of the Gulf of Mexico.
There are some contradictory events reported during these early years thatmerit discussion. They pertain to the hurricanes of 1876, 1880, and 1885. Inan interview published June 4, 1978, in the Florida Today newspaper, thenNational Hurricane Center director Dr. Neil Frank said:
In [August] ‘I871 the center of a hurricane slammed into Central Florida nearCocoa Beach.... In [September/October] 1873 a major Hurricane exitedFlorida near Melbourne . . . ..ln [August/September] 1880 another major hur-ricane battered the coast south of Cocoa Beach.
In reference to the 1880 hurricane that “battered the coast south of CocoaBeach”, this hurricane was classified in G. Norton’s Florida Hurricanes (Re-vised Edition) as a Great Hurricane. According to his notes, it affected thePalm Beach/Lake Okeechobee section of Florida; nothing is said about Co-coa Beach, but Dunn and Miller in their book Atlantic Hurricanes publishedin 1964 said that the hurricane affected Vero Beach. However, the 1880 trackas extracted from NOAA’s Historical Climatology Series 6-2 (1987), showsa hurricane entering the East Coast near Cocoa Beach. The area affected bythis hurricane could not have been the Palm Beach-Lake Okeechobee sec-tion if the hurricane entered the Florida east coast from the east-southeastnear Cocoa Beach. If, on the other hand, Norton is correct in his finding,then the 1880 hurricane track reported by NOAA has to be a considerabledistance south of Cocoa Beach; this contention is amply supported by thehurricane track of August 26-31, 1880, reported by Garriott in 1900 in hisbook West Indian Hurricanes and by the August 1880 track published byTannehill in 1938 in his book.
In reference to the August 1885 hurricane, the track published by NOAA(1987) along the east coast may also be in error in that the published track isat least 20 miles offshore. According to B. Rabat’s (1986) book, The City ofCocoa Beach:
The hurricane that hit in 1885 discouraged further settlement. The stormpushed the ocean waves over the barrier island (elevation 10 feet), flood-ing out the homesteaders. The beach near the Canaveral Light House wasseverely eroded, prompting President Cleveland and the Congress to allotmoney for an effort to move the tower one mile west.
The fact that President Cleveland was in office from 1885 to 1888 pro-vides further support that this was the year of occurrence. It is certainly pos-sible that the 1885 northerly tropical cyclone track shown over the oceanalong the Florida East Coast on the NOAA (1987) track chart was slightlydisplaced (from the correct position), and that the eye of the hurricane actu-ally passed Cocoa Beach. In fact the report by Sugg, Pardue and Carrodusin 1971 shows the 1885 track passed the central East Coast.
The final controversy concerns the hurricane of 1876. Historical informa-tion from G.W. Holmes in a letter to a friend in 1876 indicates that the eyeof a terrible hurricane passed over Eau Gallie (now part of Melbourne) onthe Indian River Lagoon on a northerly course during the early morning (nodate or month was given) of 1876. Dr. Holmes is quoted as follows:
6

The wind came from the east at over a hundred miles an hour until about3:30 AM. The vortex [the eye] came on us for about four hours, duringwhich not a leaf stirred. We began to look for our boats when all at oncewith a tremendous roar the wind came from the west, with equal violencein the early part of the night.
The quotation implies that the hurricane traveled north along the IndianRiver Lagoon or beaches. NOAA (1987) shows a northerly hurricane trackfor the year 1876, about 30-40 miles east of the coast passing Cape Canaveralduring September 12-19, 1876. The 1876 hurricane could easily have beenoff by 30 miles which brings the eye over Melbourne, and makes the effectwhich Mr. Holmes quotes valid. In October 12-22, another hurricane exitednear West Palm Beach from the west. However, until hurricane tracks for1876, 1880 and 1885 are officially modified by NOAA, they have to be ac-cepted as given from NOAA’s track book and shown in Plate 1.
Beginning with 1886, tropical storm and hurricane tracks were publishedseparately. In this book, they are presented by dashed and solid lines withthe year circled at the beginning of each track (Plates 2-14). A solid line priorto 1886 indicates either a tropical storm or hurricane. From 1886 on, a solidline crossing the coast indicates a hurricane, and a dashed line indicates atropical storm. Beginning with the year 1899, tracks became more detailedand categories were used to describe the relative magnitude of hurricanes.
We conclude this section with quotations about two hurricanes which en-tered Florida in 1898 and 1899.
Hurricane of October 2-3,1898, Fernandina Beach
The damage to Fernandina and vicinity was very great. It is conservativelyestimated at $500,000. Nothing escaped damage and a great deal was ab-solutely destroyed. Giant oaks were snapped off at the base, houses blowndown, and vessels sweptinland by an irresistible in-rush of water. The windsignal display man Major W.B.C. Duryee, who has resided in Fernandina morethan thirty years, states that no previous storm was so severe. [U.S. WeatherBureau, October 18981
In 1898, Professor F.H. Bigelow provided this rather elegant descriptionof a hurricane, published in the Yearbook of the Department of Agriculturefor 1898.
The physical features of hurricanes are well understood. The approach of ahurricane is usually indicated by a long swell on the ocean, propagated togreat distances and forewarning the observer by two or three days. A faint
rise in the barometer occurred before the gradual fall, which becomes verypronounced at the center; fine wisps of cirrus clouds are seen, which sur-round the center to a distance of 200 miles: the air is calm and sultry, butthis is gradually supplanted by a gentle breeze, and later the wind increasesto a gale, the clouds become matted, the sea rough, rain falls, and the windsare gusty and dangerous as the vortex core comes on. Here is the indescrib-able tempest, dealing destruction, impressing the imagination with its wildexhibition of the forces of nature, the flashes of lightning, the torrents ofrain, the cooler air, all the elements in an uproar, which indicate the closeapproach of the center. In the midst of this turmoil there is a sudden pause,the winds almost cease, the sky clears, the waves, however, rage in the greatturbulence. This is the eye of the storm, the core of the vortex, and it is,perhaps, 20 miles in diameter, or one-thirtieth of the whole hurricane. Therespite is brief and is soon followed by the abrupt renewal of the violentwind and rain, but now coming from the opposite direction, and the stormpasses off with the features following each other in the reverse order. Thereis probably no feature of nature more interesting to study than a hurricane,though feelings of the observer may sometimes be diverted by thoughts ofpersonal safety!
Hurricane of August 1, 1899, Carrabelle
After reaching the coast and maintaining very high velocities from the north-east backing to the North and West for 10 hours, the storm gradually abatedleaving the town of Carrabelle a wreck. The results to shipping were disas-trous, A4 Barks (transport sailboats) and 40 vessels under 20 tons havingbeen wrecked. The loss of life was amazingly small, the total being only six.The property loss, including vessels and cargo will amount to $500,000. [U.S.Weather Bureau, 18991
1901-1930
This thirty-year period had less tropical storm and hurricane activity than thepreceding thirty-year period (1871- 1900) or the following thirty-year period(1931- 1960). From 1901 to 1930, there was a combined total of 42 tropicalstorms and hurricanes as compared to 63 during the previous 30 years (187 l-1900) and 51 for the following thirty years (193 I- 1960). Storms during thisperiod came primarily from the southwest.
8 9

U.S. Weather Bureau records (1901-1930) show that there were 23 hurri-canes and 19 tropical storms during this period; specific hurricanes are listedin Table 4. With the availability of more factual data published in the Cli-matological Data Bulletin since 1897, information now becomes more ac-curate and detailed, consisting of actual reports for those years.
Looking at the first lo-year segment (1901-19 l0), the Great Hurricane ofOctober 19 10 did a loop north of the western tip of Cuba (Norton, 1949),passed through Key West and entered the coast near Ft. Myers, where a lowpressure of 28.20 inches of mercury was reported. This was probably one ofthe most destructive hurricanes to hit Florida, a Category 3 storm.
At Key West, there was a 15 foot storm tide and Sand Key reported 125miles per hour winds. The U.S. Army and Marine Hospital Docks were sweptaway at Key West in this hurricane, but little other narrative information isavailable on this storm except that it made landfall near Cape Romano.
Actually, Key West, which is touted in stories and movies as a typical hur-ricane setting, is not all that hurricane-prone. The last encounter was 198’7’sHurricane Floyd, about noon on the 12th of October. Highest winds wereabout 80 miles per hour and pressure was about 29.32 inches. Floyd’s eyewas reoorted at Kev West, Marathon and Islamorada and was a weak cat-
During the height of the storm, the water rose 8 l/2 feet above normalhigh water mark, being the highest known. The entire water front propertywas inundated; train service in and out of the city was completely paraly-sed . . . Muskogee Wharf, belonging to the L&N Railroad Co., was brokenin two in the middle, and the tracks on either side of the Main Creek werewashed away [including thirty-eight coal cars] . . .The greatest havoc waswrought along east Main Street, the south side of which has been completelywashed away. The total damage from this hurricane will be three to fourmillion dollars [equivalent to $80-100 million in 19901.
This hurricane made actual landfall in Alabama but affected Pensacola;because of this storm 164 people lost their lives. Other storm notes by theU.S. Weather Bureau for the hurricane of September 1906 are from St. An-drews, Washington County.
On the 26th, a tidal wave swept this place; the water was higher than anytime during the past 19 years, and every wharf in St. Andrews was com-pletely destroyed. [U.S. Weather Bureau, 19061
A report from Apalachicola, Franklin County:I M
egory one storm.Before Floyd, it had been 21 years, all the way back to Hurricane Inez in
1966, since a hurricane had struck the Keys. In 1965, Hurricane Betsy side-swiped the “Conch Capital” as did Isbell, in 1964. These storms followed a14-year lull during which the Keys were untouched by hurricanes. In 1950,Easy struck the Keys bringing to an end the area’s 28 years of calm goingbackJo 1919. From 1871 to 1987, Key West was hit by 14 tropical cyclonesor by about 10% of the storms discussed here.
Other hurricanes during the 1901-1910 period were the hurricane of Sep-
On the 27th, the wind blew a gale from the southeast, and on the 28th, itincreased to a hurricane velocity. The amount of rainfall was 10.12 inches.[U.S. Weather Bureau, 19061
And from Galt, Santa Rosa County:
The storm of the 26-28th was the worst ever known in this section; on the26th, the tide rose 14 feet. Two lives were lost here.
The Hurricane of October 6-13,1909, Sand Key
tember 1906 which practically destroyed Pensacola and the hurricane of 1909.These two storms have good documentation which is worth further discus-
Tannehill (1938) provides the following discussion of the October 1909hurricane that struck Sand Key and resulted in 15 deaths:
sion.
The Hurricane of September 19-29,1906,Mobile-Pensacola Area
According to the 1906 U.S. Weather Bureau report this was a major storm.
This was the most terrific storm in the history of Pensacola, or since the Vil-lage of Pensacola on Santa Rosa Island was swept away 170 years ago . . .
The hurricane of October 1909, was one of exceptional intensity. It recurvedover the extreme southern tip of Florida, at which time it had attained tre-mendous force. The Weather Bureau had a station at Sand Key, Florida whichwas abandoned at 8:30 AM., and supplies and instruments were carried tdthe lighthouse. The wind was then 75 miles an hour; shortly thereafter, theanemometer cups were carried away and the wind was estimated at 100miles an hour. All the trees were blown down and at 935 AM heavy seasswept over the island. At IO:30 AM, the Weather Bureau building went over
10 11

and was swept out to sea. The lowest barometer reading was 28.36 inches.At Key West the barometer fell to 28.50 inches and the extreme wind ve-locity was 94 miles. Property damage there amounted to $1 ,000,OOO [equiva-lent to $20 million in 19901. About four hundred buildings collapsed.
During the second 10-year segment (1911- 1920), there were four hurri-canes including one Great Hurricane which deserves mentioning. Three ofthese, all with winds over 100 miles per hour, affected the Pensacola areaagain like the hurricane of September 1906.
The Hurricane of July 1916, Mobile-Pensacola Area
The U.S. Weather Bureau (July 1916) reported that:
. . . at 1 PM, a 92 mile per hour gale occurred with severe puffs from thesoutheast. The duration of the gale was extraordinary, and the total dam-age to the crops and the property will easily total $1,000,000 [equivalentto $20 million in 199OJ for the section.
This hurricane made landfall in Mississippi where four lives were lost.
The Ii urricane of October 1916, Pensacola
The barometric pressure in this storm was 28.76 inches at Pensacola.
The wind instrument tower at the Weather Bureau Office blew down atIO:14 AM, after registering an extreme rate of 120 miles per hour at lO:‘I3AM. Oak trees that withstood the July storm were uprooted; about 200 treesthroughout the city were blown down. [U.S. Weather Bureau, October 19163
The Hurricane of November 1916, Florida Keys
The system started in the Caribbean and moved northwest through theYucatan Channel and into the Keys on the 15th. Minimal damage resultedfrom this Category 1 storm.
The Hurricane of September 1917,Pensacola-Valparaiso Area
This was a very severe storm, doing much damage on the coast and to crops.The lowest barometer reading, 28.51 inches, was a record for the Pensacola
Station. The highest wind velocity during the storm was 103 miles an hourwith an extreme rate of I25 miles an hour from the southeast. [U.S. WeatherBureau, September ‘I 9173
The Great Hurricane of September, 1919, Key West
The following citation for the Great Hurricane of September 1919 wastaken from NOAA (1987).
The storm that passed over Key West on September 9 and 10 was, withoutquestion, the most violent of any recorded at this station. Property loss isestimated at 2 million [equivalent to 40 million dollars in 19901. In the terrificgusts that prevailed during the height of the storm, staunch brick structureshad walls blown out, and large vessels which had been firmly secured, weretorn from their moorings and blown on the banks. [U.S. Weather Bureau,September 19191
Lowest barometric pressure was 27.37 inches of mercury at the DryTortugas with 300 lives lost in Key West where winds were 110 miles perhour. According to a recent NOAA report by Hebert, Jarrell, and Mayfield(1995), this storm ranked third among the most intense hurricanes to strikethe United States this century until Hurricane Andrew took over that rank-ing in August of 1992. I
During the last ten years of the period from 1901 to 1930, there were sixinteresting hurricanes, including two Great Hurricanes which could be con-sidered equivalent to Category 4 hurricanes, according to the Saffir/SimpsonScale. Some descriptions of these storms are briefly either quoted or describedhere.
The Hurricane of October 20,1921, Tarpon Springs
Great damage resulted at Tampa and adjacent sections from the combinedeffects of high winds and storm tides. The tide at Tampa was 10.5 feet, thehighest since 1848. Eggmond and Sanibel island were practically coveredby water. [U.S. Weather Bureau, October 19211
Barometric pressure was 28.11 inches at Tarpon Springs and winds weremore than 100 miles per hour.
Only one hurricane and one tropical storm were recorded for Florida in1925. The storm that came ashore near Tampa on November 30 was signifi-cant from a statistical standpoint as it was the latest any storm had hit theU.S. during hurricane season.
13

The Hurricane of July 26.28,1926 Indian River
The Center was near Palm Beach on the morning of the 27th, then movednorth-northwestward. The high winds and seas swept before them boats,docks, boat houses and other marine property on the ocean front as welt asthat on the Indian River Lagoon. Trees were uprooted, including citrus trees;houses were unroofed or otherwise damaged. The observer at Merritt Is-land remarks that there was a tremendous wave (this on the Indian RiverLagoon) and with the high wind all boats, docks, and other property fromthe river front were swept ashore . . . [U.S. Weather Bureau, July 19261
The Great Miami Hurricane of September II-27,1926
/’
From the viewpoint of property loss, low barometric pressure, and maximumwind velocities at Miami, the hurricane of September, 1926, stands unchal-lenged in the meteorological records of the Weather Bureau, save only inrespect to the loss of life at Galveston during the hurricane of 1900. Thestorm waters of the Atlantic united with the waters of Biscayne Bay andswept westward into the City of Miami . . . This was the most severe stormthat ever visited this city. The extreme velocity was registered at 7:26 AM.The average velocity for the 20th was 76.2 miles an hour. Never before havehurricane winds been recorded for so long a time and never has the windmaintained a velocity of 100 miles for more than a hour. [U.S. Weather Bu-reau, September 1926; see Fig. 1 -A - 1 -Cl
Winds and barometric pressure of this storm were 138 miles per hour and27.61 inches of mercury, respectively. Richard Clark kindly provided histori-cal photographs of this storm (Figures 1-D - 1-I).
The following excerpts are from copies of letters kindly donated by Mrs.Ruth Warner of Barefoot Bay, Florida, documenting her Grandmother’s (Mrs.Lucia Lawrence) experience in the 1926 Miami Hurricane. Mrs. Lawrencewrote in September and on October 2, 1926:
The weather bureau broadcasted that a hurricane of great intensity washeaded for the east coast, but that around Jupiter would be the center ofthe storm, but Miami got it.
About midnight, the wind was blowing a gale and the electric lights wentout; everything in darkness.
When we got candles lighted, [we] found the water pouring through theceilings on the rear half of the house so we knew the roofing was off.
With daylight Saturday came a lull in the wind for about 45 minutes. Agood many (people) didn’t know it was the center of the storm and so were
fooled. Mrs. Moran (a friend at whose house they were staying) says theworst is yet to come but it will come from another direction. Sure enoughthe puffs soon began coming, but from the southeast. Before that it wasfrom the north east.
We all huddled in the dining room and kitchen until it was over, expect-ing every moment to feel and see the house going to pieces, at least, thefront caving in as it rocked and swayed as the gusts struck.
We nailed the doors, watched the screens and awnings go. Said we haddone all we could do and left the rest with God.
The fury of the storm was terrible. It made such a peculiar muffled roar-ing sound in the air above. There are about 18,000 homes, either completelydemolished or roofs torn off. About 5,000 injured and a good many moredead than the papers give, I believe. Probably a good many from the boatswill never be found.
It’s some mess to have all ones bedding blankets, clothing and bureaucontents soaked at the same time.
The Hurricane of August 7-8,1928, Indian River Lagoon
Damage to property was heaviest from South Brevard to St. Lucie Coun-ties... substantial houses were unroofed and frail ones were razed. Highwayswere flooded and badly washed. Many bridges were undermined requiringreplacement. Many citrus trees were uprooted, the loss of fruit estimated at1 ,OOO,OOO boxes. Large oaks, sentinels of a century, were uprooted. [U.S.Weather Bureau, 19281
The Deadly Great Lake Okeechobee Hurricane ofSeptember 6-20,1928
This Category 4 storm tracked across Lake Okeechobee’s northern shore,causing the shallow waters to reach heights of more than 15 feet. This surgewas forced southward, causing terrible flooding in the lowlands at the lake’ssouth end. This area was farmed primarily by migrant workers. Thousandsof migrant farmers died as water rushed over the area. After the storm, theRed Cross counted 1,836 dead, but still more bodies and skeletons were dis-covered in later years. The barometric pressure was measured at 27.43 inches.To prevent future similar disasters, dikes were built around the lake by theU.S. Army Corps of Engineers.
The 1928 storm caused $25 million (equivalent to $300 million in 1990dollars) in damage (Figures 2-A - 2-B).
14 15
From the Hebert et al. (1995) report this hurricane ranked second amongthe deadliest hurricanes to strike the U.S., and was ranked fourth among themost intense hurricanes to strike the U.S. But this storm falls to fifth place,as far as intensity, after Hurricane Andrew, which struck south Florida in Au-gust 1992 with a low barometric pressure of 27.23 inches.
The Hurricane of September 28,1929, Key Large
Tannehill (1938) provides the following account of this hurricane strik-ing the Keys.
The center passed over Key Largo on the 28th, barometer about 28 inchesand wind estimated at 150 miles an hour. There was a ten-minute lull asthe center passed. At Long Key the barometer was 28.18 inches. At the Ev-erglades, the wind was estimated at 100 miles an hour, barometer 28.95inches. The storm reached Panama City on the 30th, barometer 28.80 inches.Although there was enormous damage at Nassau in the Bahamas and manylives were lost there, its course in Florida was such that damage probablydid not exceed $500,000 [$6 million in 1990 dollars] and only three liveswere lost. The population had been thoroughly warned by the Weather Bu-reau and there had been ample time for all possible precautions.
1 9 3 1 - 1 9 6 0
This thirty-year period had more storm activity than the previous thirty-yearperiod (i.e., 51 total storms compared to 42). There were 21 hurricanes, al-most the same as reported for the previous period. However, tropical stormsnumbered 30 as compared to 19 for the previous thirty years, which accountsfor the high number of total storms.
The temporal distribution of hurricanes from 193 1 to 1960 is interesting.While there were few hurricanes in 193 l-40 (six) and 195 I- 1960 (three), therewere 12 hurricanes for the lo-year period 1941- 1950 alone. This made the1941- 1950 segment the most destructive and costliest period to that date interms of equivalent dollar value since records were kept for the state. Yetten years later, in 1960, one single hurricane, Donna, a Category 4, was evenmore costly and destructive than all the storms occurring in the total 10 yearperiod from 1941to 1950 (Hebert et al., 1995).
Looking at the first 10 years (193 1- 1940), out of a total of 6 hurricanes,there were two Category 3 storms and one Category 5 hurricane in 1935
which was one of only two Category 5 hurricanes to ever hit the U.S. coastwith that intensity - the other was Hurricane Camille which struck Missis-sippi in 1969. Hurricane Allen, which struck Texas in 1980, reached Category5 intensity three times during its path but weakened to Category 3 at land-fall (Hebert et al., 1995).
The Major Hurricane of September ‘l933, Jupiter
In July and September 1933, two hurricanes entered the east coast ofFlorida within a short distance of each other. The second of these two, whichoccurred on Labor Day, deserves review.
There was much property damage on the east coast from Vero Beach toPalm Beach; a few houses were totally demolished, quite a number blownoff their blocks. More than the equivalent of 4 million boxes of citrus wereblown from the trees statewide. The property loss in Indian River, St. Lucie,and Palm Beach Counties probably was about 2 million dollars [$25 millionin 19901. [U.S. Weather Bureau, September 19331
In addition to the above report, an elderly citizen from Ft. Pierce recalledthat the 1933 storm was the most devastating in the history of Ft. Pierce(Yanaros, 1986).
In 1935, two hurricanes visited southern Florida. The first was the GreatLabor Day Hurricane of September 1935 and the other was the storm calledthe Yankee Hurricane (October 30 - November 8) because it came in from anortheasterly course and struck the extreme south Florida coast and the westcoast.
The Great Labor Day Hurricane was the most violent in the history ofFlorida and the United States and the Atlantic basin. It was the only Cat-egory 5 storm ever to strike Florida; its central barometric pressure of 26.35inches of mercury was the lowest ever recorded at that time in the northernhemisphere. (As of 1988, Hurricane Gilbert, which did not affect Florida,has the record for the lowest barometric pressure in the northern hemisphere,26.22 inches).
The following excerpts from the 1935 storm are quoted from Norton’s1949 paper entitled Florida Hurricanes.
No anemometer reading of the wind was obtained, but the gradient for-mula gives 200-250 miles per hour and the engineer’s estimate by stressformula is in substantial agreement . . . the path of destruction was less than40 miles in width. More than 400 people were killed, most by drowning.
\16 17

The tracks of the Flagler Railroad were washed from the Long Key viaductat an elevation of 30 feet above mean low water. A survey by the U.S. En-gineers some time after the storm indicated that the tide level never reachedthe rails there, but the hurricane surge superimposed on the tide probablyassisted in carrying the tracks away.
(Maximum storm surge with Hurricane Camille was 24.2 feet.)
In 1938 Tannehill described a tragic event of the storm. (Figures 3-A -3-C)
A rescue train that was sent to remove World War I veterans and residentsfrom the Florida Keys, on September 2, 1935, was swept from the tracksby the hurricane and the storm wave.
The following lo-year period, 1941- 1950, was the most devastating de-cade in Florida’s history since records were kept. Out of 12 hurricanes, 11of these took place between 1944 and 1950. In this relatively short periodthere was one Category 4 in 1947, and six Category 3 hurricanes, one eachin 1944, 1945, 1948, 1949, and two in 1950; a Category 1 storm struck Ft.Myers on the west coast in 1946. All are discussed here.
The following is a quotation describing the 1944 storm, taken from theU.S. Weather Bureau in their report of October 1944.
Dangerous winds extended fully 200 miles to the right or east of the cen-ter, about 100 miles to the left or west, thus affecting the entire peninsulaof Florida. (Even at Dry Tortugas, barometric pressure was 28.02 inches ofmercury.) Winds of hurricane force velocity surrounded the central core, withgusts up to 100 mph at Tampa and Orlando. Tides were high from Sarasotasouthward on the Gulf and from Melbourne northward on the Atlantic.Naples, and Jacksonville Beach reported 12 foot tides. Citrus loss was over21 million boxes (average. harvest was 80 million). Throughout the state therewas damage to telephone, telegraph and power lines, trees, roofs, chim-neys, signs, and radio towers. Of the interior cities, Orlando seems to havesuffered the most damage, being estimated at over one million dollars.
The next hurricane of importance entered the coast in September 1945 atHomestead, curving northward right up through the center of Florida. Dur-ing the course of the storm, it decreased in windspeed, but maintained itselfas one with minimal hurricane force. It also remained over land to exit nearJacksonville Beach. The tragic event with this storm was the destruction atRichmond, Florida, of the three Navy blimp hangars which were used as
18
evacuation shelters for 25 Navy blimps, 183 military planes, 153 civilianplanes and 150 automobiles. The three great hangars were torn to pieces atthe height of the storm, and then caught fire and burned with all their con-tents; the total loss was estimated at 35 million dollars (U.S. Weather Bu-reau, September 1945).
Then came the Category 4 hurricane of September 17,1947, clocking thehighest recorded windspeed, except for Hurricane Andrew in 1992, inFlorida’s history with a 1 -minute maximum windspeed of 155 miles per hour,recorded from a reliable instrument at the Hillsboro (Pompano Beach) lightstation. The following describes this exceptionally strong hurricane (U.S.Weather Bureau, September 1947).
Hurricane force winds were experienced along the Florida East Coast fromabout Cape Canaveral to Carysfort Reef Light (south of Miami), a distanceof about 240 miles, while winds of +I00 miles per hour, or over, were feltfrom the northern portion of Miami to well north of Palm Beach, or about70 miles. This classifies this hurricane as one of the great storms of recentyears.
This September 1947 storm had a barometric pressure of 27.97 inches ofmercury at Hillsboro, with tides at Clewiston and Moore Haven of 21.6 feetand 20.9 feet, respectively. This storm was nearly as bad as the 1928 hurri-cane at the lake. But only fifty-one people died.
During October 9-16 1947, a hurricane came across western Cuba intosouthwest Florida, northeast into the Atlantic around Palm Beach. It was aCategory 1 and was seeded for the first time. It split in two in the Atlanticand the worst part hit Savannah, Georgia.
There were two hurricanes in 1948. The first one ran from September 18-25 and was classified as a Category 3. The system started just west of Ja-maica and moved west to northwest then north over western Cuba into theFlorida Straits. It struck Florida near Everglades City in the 10,000 islands,then moved northeast through Florida to emerge into the Atlantic near Jupi-ter. A tornado was reported in Homestead on September 21. Lowest baro-metric pressure was 28.44 inches, and top winds were 122 miles per hour.The hurricane killed 3 people and caused $105 million damage.
The second 1948 storm ran from October 3-5 and started just off the Nica-raguan/Honduran coast in the northwest Caribbean Sea. This hurricane alsomoved across western Cuba into the Florida Straits and even crossed the Sep-tember hurricane’s path near the coordinates 24.ON and 82.OW. This stormpassed through the Keys and extreme south Florida into Grand Bahama Is-land. At about 31 N latitude it did a gigantic loop in the middle of the Atlan-
19

tic and finally became a non-tropical cyclone. A tornado was reported in Ft.Lauderdale on the 5th of October. Lowest barometric pressure was 28.92inches, and top winds were around 90 miles per hour. In August 1949, an-other major hurricane, taking a course similar to the Great Hurricane of Sep-tember 1928 entered the coast near Palm Beach. It was the worst hurricanefelt in the Lake Okeechobee area since 1928. Hurricane force winds werereported at St. Augustine, Cape Canaveral, and Melbourne, and winds of 120miles per hour or greater were felt from Stuart to Pompano. The highest re-corded wind speed gust, 153 miles per hour, was at Jupiter, only 2 miles perhour less than the wind speed record set on September 27, 1947. The amountof damage in dollars, 45 million (equivalent to $270 million in 1990), wasalmost twice that of the 1928 hurricane. The storm was not classified as be-ing among the Great Hurricanes in Florida’s history, but it fell into the cat-egory of only being slightly below them (U.S. Weather Bureau, August 1949).Tides were 24 feet and 23 feet at Belle Glade and Okeechobee, respectively.
Finally, here are some brief quotations, taken from the U.S. Weather Bu-reau reports, 1950, for the last two major hurricanes of the 1941- 1950 de-cade; during this period the storms were named using World War II phoneticalphabet: Able, Baker, Charlie, Dog, Easy, etc.
Hurricane Easy, September 1950, Cedar Key
Old residents say this was the worst hurricane in 70 years... half of the houseswere severely damaged or destroyed... The fishing fleet upon which the towndepends for a livelihood, was completely destroyed by wind and waves...The tide in Tampa Bay rose 6.5 feet, the highest since 1921. (U.S. WeatherBureau)
This hurricane looped twice on the west coast, had top winds of 125 milesper hour and a barometric pressure of 28.30 inches. It caused 38.7 inches ofrain at Yankeetown in the September 5-6 period, and brought unfounded ac-cusations of seeding by the Weather Bureau from residents of the area.
Hurricane King, October 1950, Miami
The path of principal destruction was only 7-10 miles wide through thegreater Miami area and northward to West Ft. Lauderdale on October 17. Itwas at first reported that the damage was the result of a tornado or torna-does, but after careful inspection there was no evidence of tornado action. Itwas simply that of a small violent hurricane. Gusts were 150 miles per hourat Miami and 138 miles per hour at Ft. Lauderdale. Barometric pressure fell
20
to 28.20 inches and tides were 19.3 feet at Clewiston. Three people died dur-ing this StOlXl.
Following is a personal eyewitness report on Hurricane King describedby coauthor J.M. Williams.
This storm, Hurricane King, formed down in the northwest Caribbean nottoo far from Swan Island. It curved its way northward to clip the west tip ofJamaica. From there King traveled almost due north across Cuba to slaminto Florida close to Miami and made passage through western Ft. Lauder-dale. I was home on leave from Army duty on the 17th of October, 1950,visiting my folks who lived in Country Club Estates, which is now Planta-tion. This was my first hurricane on land. I had been in one on a ship at seacoming back from Occupation Duty in Europe. In the afternoon of the 17th,rain was coming intermittently in sheets and the wind was gusting prettyhigh. Then, as if nothing was going on, it would calm down and the sunwould come out. We were from Iowa where when it looked stormy, youwere going to get it! That, I found out didn’t mean anything down here inFlorida. My mother had two cats who were progressively getting noisy andmean. We found out later that they were affected by the barometric pres-sure drop as the storm approached. By the time the storm hit they wereclimbing the walls! The house was CBS block construction so we felt okaybecause shutters had been installed some years ago. On the front porch werealuminum jalousies.
The main part of King hit us in the late evening and it was really some-thing, to me at least! The street in front of the house was gravel back thenand the winds picked the rock up and blasted the front of the house! Thenoise on those aluminum jalousies was so bad we couldn’t hear each othertalk. There was a lot of lightning in the storm and we could see out throughthe shutters. Newspapers were flying all over the place. The only troublehowever, the newspapers were not newspapers but were tiles off the roof.
We went outside during the eye and I found out what everybody hadalways said about the eye: we could see stars, the moon, and a few clouds,and we could feel a slight breeze. We detected a smell, some said was ozone.But ozone is odorless! Nevertheless we experienced the Hurricane Eye Smell.
The famous backside of the hurricane came right away, like now, andwe rode out the remainder of the storm like we did the first part. Now thewind came from the other direction and it loosened up everything.
After the passage of Hurricane King we took a long look at the damage.Out of six fruit trees, only one was still standing. About half of the rooftiles were lost and would need to be replaced. The aluminum jalousies were
21

dented and stripped of all paint. Debris could be seen all over the place. Asthe area was wooded in that period of time, trees were down here and there.A big tree, about two feet in diameter took down the power and telephonelines. I had returned to Fort Benning by the time power had been restored.We heard that a tornado was running around in the eye of King and wipedout a trailer park in the town of Dania, south of us. Some people were killeddue to King.
The last lo-year period, 1951-1960, of the 1931-1960 thirty-year segmentwas marked by a sharp reduction in major hurricane activity; it was duringthis period when the Weather Bureau began giving hurricanes female namesin 1953.
In October 195 1, Hurricane How, as a tropical storm, crossed mid-Florida.In 1952, a tropical storm crossed south Florida in February. This systemstarted in the Caribbean Sea about the second of February and moved throughthe Yucatan Channel then northeast into the Florida Keys, Florida Bay andFlorida’s southwest coast. In no time it was out in the Atlantic becoming anextratropical storm, all in the matter of about two days. Even though the sys-tem was very fast moving, it managed to record gusts of 68-84 mph in theMiami area.
In 1953, Tropical Storm Alice struck northwest Florida in June. In Au-gust an unnamed storm crossed south Florida. In September another unnamedstorm crossed north Florida and Hurricane Florence hit northwest Florida.Tropical storm Hazel crossed mid-Florida in October to finish out 1953.
In 1956, Hurricane Flossy struck northwest Florida in September. In 1957two tropical storms hit the same region, one was unnamed and one was namedDebbie.
In June of 1957 an unnamed tropical storm in the southwest Gulf ofMexico made landfall just east of Apalachicola on the 8th. Suwannee andadjacent counties had 15 inches of rain in 48 hours. There was heavy cropdamage particularly to tobacco and watermelon, and 100-200 families hadto evacuate near the city of Perry. There were at least 9 tornadoes in north-east Florida on the 8th of June.
A Gulf of Mexico storm from the 7th to the 9th of June 1957, Debbie madelandfall near Ft. Walton Beach on the 8th. Peak winds were 52 miles per hourway down near Tampa and the low pressure reading was 29.68 inches inPensacola. Wewahitchka, Florida, recorded 11.26 inches of rain. There wasflooding in St. Marks, Florida, but most of the rain was welcome because ofthe low levels of water in the lakes. In October 1959 two more tropical storms
22
came ashore in Florida: Irene into northwest Florida, and Judith crossing mid-Florida. None of these were of major consequence.
Hurricane Donna stole the show in 1960 (Figures 4-A - 4-C), while Brenda,as barely a tropical storm, crossed north Florida in September, and Florencealso a very weak storm, crossed south and central Florida a week earlier.
Hurricane Donna ranked fifth, prior to Hurricane Andrew in 1992, amongthe most intense hurricanes ever to strike the U.S. this century (Hebert etal., 1995). Except for the western Panhandle, where Flossy with a baromet-ric pressure of 28.93 inches affected Pensacola in 1956 with gusts at 98 milesper hour, Donna was the first major hurricane to have an affect on Floridasince Hurricane King in 1950.
Hurricane Donna caused $300 million ($1.9 billion, 1990 dollars) in dam-ages to the state and was one of the most destructive hurricanes to affectFlorida in modem times (Dunn and Miller, 1964; Hebert et al., 1995). Hur-ricane Andrew, 1992, replaces Donna as Florida’s most damaging storm.
At Conch Key, pressure was 27.46 inches on the 10th of September, 1960,and tides were 13 feet 40 miles northeast and 20 miles southwest. Donnawas at her peak here, moving only 8 miles per hour. The storm killed three
Ipeople in the Keys. Top winds of 180-200 miles per hour were recorded inthe Keys, with gusts to 150 miles per hour at Everglades City and Naples.In central Florida, the pressure was 28.60 inches at Lakeland, 28.66 inchesat Orlando, and 28.73 inches at Daytona. In Ft. Myers, the barometric pres-sure was 28.05 inches. Fifty people died when a U.S. airliner crashed offDakar, Africa, at the beginning of the storm.
Following are some quotations from the U.S. Weather Bureau records,(September 1960) about this hurricane.
Storm damages range from very severe in the Middle Keys and the south-west coast from Everglades City to Punta Gorda, to relatively minor in north-west Florida and points north of the storm track. At Naples tides pushedinland to the center of the city damaging buildings and smashing docks allalong the intrusion. Everglades City, a town that had been largely evacu-ated was also inundated by storm tides and about 50 percent of the build-ings in that city were destroyed by tides and winds. Even well outside theseareas, the wind toppled thousands of trees, demolished many weaker build-ings, blew off or damaged roofs, and shattered many windows. Power andcommunication facilities fell throughout central and south Florida. Crape-fruit losses were between 25 and 35 percent of the state’s crop. Gusts of99 miles per hour recorded at the FAA tower in Daytona Beach marked
23

Donna’s exit from Florida, having retained hurricane status throughout its According to the U.S. Weather Bureau report of August 1964, main lossesentire passage in Florida. from Hurricane Cleo were from glass and water damage in the Mia,mi Beach
Donna inflicted major ecological damage. Dunn and Miller in 1964 re-ported that one of the world’s largest stand of mangrove trees was 50 per-cent wiped out and that 35-40 percent of the white heron population waskilled.
In Everglades National Park, a monument on the road to naming0 m-nindsvisitors today about Hurricane Donna.
1961-1990There were 27 storms during this 32-year segment. Comparing these figureswith the 21 hurricanes and 30 tropical storms for the previous 30 years, onecan easily see the overall reduction in both hurricanes and tropical storms(Table 4). In the 1961- 1992 period, 6 hurricanes (Category 3 or higher), Betsy,Eloise, Elena, David, Inez, and Andrew, occurred as compared to 11 from193 l-1960. Hurricanes Inez and Kate did strike Florida but were Categories1 and 2 storms then. Inez and David were Category 4 storms in the Carib-bean. Hurricanes Juan and Elena, in 1985, affected northwest Florida with-out a landfall.
area and agricultural losses in the Indian River Lagoon citrus belt.Author John M. Wikliams provides the following personal account of Cleo
whose pati was tracked semi-hourly through southeast Florida in the Ft. Lau-derdale area (Figure 5).
Cko was the worst in the southeast coastal area. Cleo was of Cape Verdevintage and traveled through the Atlantic and the Caribbean as a “textbook”storm. Between Jamaica and Maiti, however, she turned northward into theCuantanamo Naval Base in Cuba causing considerable damage there andin Cuba. Passing across Cuba brought the usual decrease in strength, butonce into the Florida Straits she regained her hurricane status. The follow-ing is my eye-witness report on the passage of Cleo in western Ft. Lauder-dale area.
During the first lo-year period, 1961 - 1970, seven hurricanes--Cleo, Dora,Isbell, Betsy, Inez, Alma, and Gladys-hit Florida, a sharp increase over theprevious 10-year period, 1951- 1960. While there were no storms from 1961to 1963,3 hurricanes struck Florida in 1964 alone, making this year the cost-liest ($350 million and more, which is equivalent to $1.75 billion dollars in1990) so far in Florida’s history.
In 1962, Alma as a tropical depression passed Florida’s east coast on 26August. In 1965, a tropical storm crossed northwest Florida on 15 June fromthe Pacific.
In late August 1964, Hurricane Cleo was the first hurricane to strike theMiami area since Hurricane King in 1950. Cleo moved up the peninsula about20 miles inland paralleling the east coast. It produced 138 mile per hour gustsat Bahia Mar Marina, Ft. Lauderdale, and knee-deep water was observed insome locations. Due to its small size, Cleo soon weakened to below hurri-cane strength around the Fellsmere-Melbourne area, yet the total storm dam-age was estimated at $125 million ($600 million in 1990 dollars). Cleo sailedthrough Georgia, South Carolina, and North Carolina to break into the At-lantic in September. She regained hurricane status on the 2nd, but died inthe North Atlantic near Nova Scotia on the 5th of September.
There were winds and rain all day of the 26th August. Some gusts werein the 60 miles per hour category. It seems that I had the only ladder in theneighborhood and since the people there knew I was in the weather busi-ness, a line of them formed as I was finishing the preparations on my house.I didn’t see the ladder again until after the storm had passed, but I heard itgot as far as two blocks away.
I knew the storm was going to hit this area after dark so we decided tohave supper and get all the other amenities out of the way. We put all thekids to bed early but that didn’t last for long, after all, it was their first hur-ricane! It was lucky that we toweled up all the doors and had the shutterson the windows because at the height of the storm we had water comingin the front door and through some of the windows. We had glass jalousiesthroughout the house!
It peaked late in the evening just before the eye passage with gusts to130 miles per hour at my location and there was considerable lightning, alongwith that tremendous roar. You could see almost like daylight through theshutters.
My children will never forget the ‘little leaf’, obviously sheltered by thehouse, hopping across the yard, in the opposite direction from the wind.About ten minutes before the eye, a Florida room aluminum shutter, about3 by 8 feet, ripped off the house next to mine. It slammed into the cornerof my house and ricocheted out into my front yard. I had a small palm treeout there which was bending over from the winds and the shutter man-aged to wedge itself between the tree and the ground.
24 25

The eye passage lasted one hour and twelve minutes at my location.I opened the door at that time to a rush of water about two inches deep.
While the wife mopped that up, I stepped off the porch into nearly knee-deep water and waded to the palm tree. As hard as I tried, I couldn’t freethe shutter from the tree.
I could see the stars in a beautiful sky about me and there was that un-mistakable stillness and smell that only happens in the eye of a hurricane!
The guy across the street yelled over to me that he had lost all the glassjalousies from his Florida room and had to move inside the house. He hadonly taped his windows! I tugged again and again at the tree and big shut-ter but to no avail. I couldn’t move it. I checked around the house and ev-erything seemed all right or passable. But now it was time to get back inthe house because the backside of a hurricane comes on like ‘Gang Bust-ers’!
Since the wind comes from the opposite direction and right now, it is therebefore you know it! And it came! The palm tree straightened up and thebig shutter came loose and was last seen, in lightning flashes, heading north,up over the house across the street! We never saw it again. The back sideof the storm was drier than the front but not by much.
The house leaked (all houses leak in a storm like Cleo), and we had a lotof mopping to do. The pea-rock on the flat roof of the garage was all goneand there was a dent in the decklid of the car parked in the carport; some-thing was flying around loose. When the water subsided, it left a mass ofdebris all over the place and power was off in some parts of town for fivedays. Our power came on again by late afternoon of the 27th of Augustone day after the storm passed by. There was widespread damage through-out the area but only an occasional catastrophic type.
In a few days, we had the place almost cleaned up; I had my ladder backand the kids still wanted to know what happened to the ‘little leaf’. For aperiod after the storm when I mowed the lawn, the clippings were a com-bination of grass and pea-rock shrapnel.
In September 1964, just a few weeks after Hurricane Cleo, Hurricane Dorastruck the Florida coast at a near 90 degree angle from the east at St. Augus-tine, Florida. It was the first hurricane to do so, north of Stuart, since theGreat Hurricane of 1880. The hurricane’s winds of 125 miles per hour at St.Augustine resulted in a 12-foot storm tide which swept across Anastasia Is-land (St. Augustine) and also produced a 10 foot storm tide at FernandinaBeach, and Jacksonville. These massive storm tides caused extensive beacherosion, inundated most beach communities, washed out beach roads, and
swept buildings into the sea. There was also considerable flooding along theSt. Johns River in Jacksonville. Total damage was estimated at $250 milliondollars (more than $1 billion in 1990 dollars) (U.S. Weather Bureau, Sep-tember 1964).
Hurricane Isbell, while not a strong hurricane, struck Florida in October1964 and is described in an eyewitness account by coauthor J.M. Williams.
This storm grew down south of the western tip of Cuba and proceedednortheast, across Cuba, the Florida Straits, and into the Ten Thousand Is-lands region of southwest Florida. From there, lsbell took a more northeastcourse across Florida. On the evening of October 14, the storm passed justnorthwest of Fort Lauderdale, Florida. Winds were 50 to 60 miles per hourwith a recorded gust of 120 miles per hour. Many tornadoes, spawned byIsbell, caused as much damage as the hurricane did. Rains were extremelyheavy in the early period of the storm but slacked off to nearly dry condi-tions at the end. A tornado, less than a block from where I lived, tore thewhole Florida room, constructed of block, off a house. lsbell passed out tosea between the cities of Palm Beach and Vero Beach and dissipated in theAtlantic.
The following year, in September 1965, Hurricane Betsy, a Category 3storm, struck extreme southern Florida from the east. Wind gusts up to 60miles per hour were reported as far north as Melbourne. In south Florida, anobserver at Grassy Key reported winds of 160 miles per hour before the an-emometer was blown away at 7: 15 AM on September 8. Six to eight footstorm tides and wave action caused considerable flooding between greaterMiami and the Palm Beaches; rising waters flooded extensive sections of KeyBiscayne, covering virtually all of the island (U.S. Weather Bureau, Septem-ber 1965).
Hurricane Betsy was unique and formed far out in the Atlantic around the27th of August, and was obviously a Cape Verde type hurricane (Figures 6-A - 6-B) . After moving west for a few days, it developed an erratic coursestarting around Puerto Rico (Sugg, 1966). The path was a zig-zag, generallyin a northwest direction to a point about 300 miles almost due east of CapeKennedy (as the Cape was known in those days). She became stationary therefor nearly two days, then suddenly moved in a south-southwest directionwhich took her right into the central Bahamas. Just east of Nassau, Betsystalled again. For 20 hours, winds of 120-140 miles per hour buffeted thearea causing death and destruction.
The following eye-witness (coauthor J.M. Williams) report is about thepassage of Betsy in western Ft. Lauderdale.
26 27
During the 7th of September we -were intermittently pelted with rain andstrong wind gusts. Nassau is only about 150 nautical miles from Ft. Lauder-dale and since Betsy was a large ‘Cane’, we were getting all sorts of weatherin the area.
During the early morning of the 8th, we were getting rain in sheets withseveral gusts in the 125 miles per hour category. Sustained winds easily hungin around 65 mph. Even though we did not experience the eye, things wouldcalm down to almost sunshine conditions but this would not last long.
There was a lot of flooding and house seepage but not as bad as lastyear’s Cleo. Betsy’s eye, which was huge and about 40 miles in diameter,was south of us and our pressure bottomed out at 29.12 inches.
This combination of pelting rain and heavy winds continued all day long,and even at supper time it was still not advisable to venture outside. Ourpower was off for more than ten hours and the usual mass of debris was allover the place. There was a lot of orange and grapefruit damage as well asdamage to other crops; again most of the pea-rock was blown off the ga-rage roof.
Our place was wet for a long time and I recorded more than eight inchesof rain for the passage period. When there is no break in the continuity ofa storm (the eye), you get the effects all the time: more rains, more winds,more everything.
In 1966, Inez was a Cape Verde type hurricane with a classic track throughthe Caribbean, across Haiti and Cuba and into the Florida Straits. From thereshe earned the name, “the Crazy One” by the National Hurricane Center. Shetook a’very erratic course, first north, then south, then east, and finally westand this had everybody’s fingernails completely gone!
Before she died in the mountains near Tampico, Mexico, Inez had killedmore than 1500 people, had recorded top winds of 190 miles per hour, andplanted a barometric pressure of 27.38 inches (from Air Reconn flights) inthe books! Back then, that was called a “Severe” Hurricane. Today that wouldbe a strong Category 4.
The following eye witness report (coauthor J.M. Williams) is of the pas-sage of the storm in western Ft. Lauderdale, Florida.
I had put the wife and kids to bed early that night and told them that lnezwas heading northeast. As erratic as it had been though, I was going to stayup and keep a check on it. I was off duty so there was nothing else to do,and I was a Storm-Hunter anyway. I was glued to the weather radio, TV,
barometer and the rest of the instruments at my station. But as enthusiasticas I was about the whole thing, I was guilty of dozing off two or three times.
The winds here were gusting more than 40 miles per hour and I had pulleddown the shutters just in case.
At 0800, 3 October, the pressure at the house was 29.65 inches, tem-perature was 780F, Dew Point was 780 F, humidity was lOO%, winds werenorth at 29 miles per hour sustained and it was overcast with rain. lnez was93 miles east-northeast of Miami moving north-northeast at 7 miles per hour.We had it made. At 1100, the storm was 75 miles west-northwest of Nassaumoving north-north east.
At 1400, she was stationary about 85 miles west-northwest of Nassau.At 2300, lnez was drifting slowly south-southwest pushing 25 foot seas
as reported by a Coast Guard Cutter. The Southeast Florida coast had gustsof more that 55 miles per hour. I dozed a couple of times even though Iknew it was now coming this way.
At 0345, 4 October, I awoke to shutters rattling and pelting rain! Windswere gusting more than 60 miles per hour. Barometer was 29.59 inches, tem-perature was 75” F, dew point was 730 F, humidity was 91% and it was over-cast with thunder and lightning!
At 0700, lnez was 45 miles southeast of Miami with winds of at Beast 85miles per hour and moving west at 7 miles per hour.
At 1 aO0, the storm was moving west-southwest at 8 miles per hour withgale-force winds 175 miles to the north, and 100 miles south. Here, we hadhurricane gusts frequently and gales with heavy rains all day. U.S. HighwayNo. 1 in the Keys was under water. The eye of the storm was 30 miles indiameter.
At 0200, my barometer was reading 29.67 inches and the wind was stillgusting in excess of 45 miles per hour.
By 1500, 5 October, lnez was stationary near Dry Tortugas with windsof 120 miles per hour. From there, she finally continued west to Mexico.
We got a bit of minor damage on the house and there was a lot trash topick up around the yard. Everything was wet for a few days, however, weconsidered ourselves lucky!
Until Hurricane Allison in 1995, Alma had the distinction of being the ear-liest storm to hit the U.S. during Hurricane Season. She struck northwestFlorida June 9, 1966. Alma started in the northwest Caribbean and trackednorth across the western tip of Cuba on the 8th of June. Landfall was about20 miles east, northeast of Apalachicola. Winds of 76-100 miles per hour were
28 29

felt in the area. Pressure was 29.06 inches at Alligator Point. Tides 4-10 feethit the concave coastline in the area and more than 6 inches of rain fell. Low-est pressure in the storm was 28.64 inches and peak winds were 125 milesper hour. Alma caused 6 deaths and $10 million in damages.
During the 18th and 19th of October, 1968, Hurricane Gladys struck thewest coast of Florida between Bayport and Crystal River about midnight onthe 18th.
Gladys formed in the western Caribbean near Swan Island and steadilymoved in a north track across western Cuba, over the Dry Tortugas and intoFlorida’s west coast.
The Dry Tortugas and Plantation Key both reported winds near 90 milesper hour. The storm’s forward speed was about 15 miles per hour. Tides alongthe west coast were 6.5 feet above normal causing beach erosion and flood-ing mostly between Clearwater and Bayport.
Maximum gusts were over 100 miles per hour and lowest pressure was28.76 inches. Citrus was heavily damaged and mobile-home damage was ex-tensive, as usual, as far inland as Ocala. Gladys broke out into the Atlanticnear St. Augustine having killed 3 people in Florida and one in Cuba. Onemore death was added in Nova Scotia and the total damage was nearly $17million in 1968.
On the 3rd of June, 1968, Abby was a Category 1 hurricane in the Gulfof Mexico heading for the Florida west coast. But on the 4th, she was a tropi-cal storm when she hit Punta Gorda that morning. During the 4th and 5th,Abby headed east, northeast across Florida. Heavy rains brought relief froma drought and Titusville and Orlando recorded 10 inches of rain. Four toma-does were reported near Pineda Bar and Haines city on the 4th. The systemstalled along the beaches from Cape Kenneday to Jacksonville producingwinds of 66-77 mph during the Florida passage. Peak wind was 90 miles perhour recorded by air-reconn and lowest pressure was 28.50 inches also re-ported by reconn aircraft.
Brenda was a depression in June passing through Florida. Dolly was a Cat-egory 1 hurricane in August in the Florida Straits but weakend to a depres-sion as it dumped 2-4 inches of rain on southeast Florida and the Miami area.
The big storm in 1969 was of course, Hurricane Camille, a Category 5that ravished the upper gulf Coast. Florida was very lucky that year, suffer-ing only from tropical storm Jenny. This was an early October storm mak-ing landfall near Naples on the second. Fifty-five miles per hour winds andpressure of 29.52 inches was good for up to 5 inches of rain over Florida.The slow moving storm got to the Cape Kennedy area before moving backto the west and emerging into the Gulf on the sixth.
In 1970 came another Alma (Alma was a named used in 1966). Althoughonly a depression through Florida, Alma nevertheless dumped more than 6inches of rain on Ft. Myers in 12 hours. Landfall was near Cedar Key on the25th. Alma was only the third month-of-May storm in 100 years.
Becky came in July 1970. Landfall of this tropical storm was near PortSt. Joe on the 22nd of July with 63 miles per hour winds and pressure of29.62 inches. Nine inches of rain fell in the area and a tornado destroyed 3houses in Panacea, Florida. Tides in that area were 6 feet and damage was$500,000.
Greta was another 1970 storm. Greta passed through the lower Keys onthe 27th of September with 55 miles per hour winds and pressure of 29.69inches. Tavemier, to the northeast, recorded 55 mile per hour winds. Rainwas not unusually heavy.
The next to the last 10-year period, 197l-1980, had the lowest storm to-tal of the 126-year history-three hurricanes and one tropical storm. The threeFlorida hurricanes were Agnes, Eloise and David.
Hurricane Agnes, which occurred in 1972, was barely a Category 1 hurri-cane in Florida but resulted in major devastation in the middle, southern, andnortheastern states, and caused 122 deaths and six billion dollars damage in1990 dollars. Agnes struck the Florida panhandle, then merged with anothersystem in the mid-U.S., triggering torrential rains and extreme floodingthroughout the entire eastern seaboard.
The threat of a hurricane usually diminishes rapidly as it moves inlandand loses its oceanic heat source, however, sometimes the storm will encoun-ter an environment that supplies an auxiliary source of energy to maintainstrength far inland. Such is the case with Agnes, which from landfall nearApalachicola, Florida, where losses were less than $10 million, she travelednearly a thousand more miles to become one of the most destructive stormsin U.S. history.
Hurricane Eloise, in 1975, was a Category 3 hurricane. Hurricane David,in 1979, had weakened from a Category 4, to a Category 2 hurricane whenit struck Florida, but David still caused over $400 million in damage.
Hurricane Eloise, which came in September 1975, made landfall aboutmidway between Ft. Walton Beach and Panama City. It was the first directhit by a major hurricane in the 20th century in that area. Measurements ofhigh water marks by the U.S. Army Corps of Engineers indicated hurricanetides of 12-l 6 feet above mean sea level. Eglin Air Force Base, 20 miles westof the center, reported the highest sustained wind of 81 miles per hour whenthe instrument failed; 14.9 inches of rain fell. However, maximum sustainedwinds were estimated at about 125 miles per hour with gusts to 156 miles
30 31

per hour. The combined effects of winds and tides undermined or demolishednumerous structures along the beach from Ft. Walton Beach to Panama Cityand the lowest barometric pressure was 28.20 inches. Damage was over $1billion in 1990 dollars from this Category 3 hurricane; there were 21 deathsin the United States.
In August, 1976, tropical storm Dottie formed in the Keys from a depres-sion in the Gulf of Mexico. The system moved southeast, then east throughthe Keys on the 19th, then north up the Florida southeast coast. Dottie cameback out into the Atlantic later on the 19th near Palm Beach. Eight inches ofrain and 3-5 foot tides were the result in the Miami area.
In 1979, the National Hurricane Center decided to integrate male and fe-male names for the hurricanes in the Atlantic for the first time. Bob was thefirst Atlantic hurricane with a male name and the ‘guys’ decided to out-dothe ‘gals’ and they did!
In September 1979, Hurricane David moved inland south of Melbourneon the east coast and then northward along the Indian River Lagoon to exitat New Smyrna Beach. It was the first hurricane to strike the Cape Canaveralarea since the hurricane of 1926. Severe beach erosion from a near five footstorm tide was reported in Brevard County and the southern portion of VolusiaCounty. Some homes, businesses, and public buildings were severely dam-aged or destroyed; however, most of the damage, though widespread, wasminor because the strongest winds were just offshore over the adjacent At-lantic Ocean.
Figure 7-A shows Hurricane David from the 22,000 mile high Geo-synchronus Operational Environmental Satellite (GOES) orbiting the earth.At this point, August 31, David was about to make landfall on Hispaniolaabout 1800 EST. Winds were near 150 miles per hour and the central pres-sure was 27.34 inches. Earlier, about 125 miles south of Puerto Rico, sus-tained winds of 150 miles per hour and central pressure of 27.29 inches wasDavid’s strongest point, then rated as a Category 4 hurricane.
On September 1 at 0600, David broke into the sea north of Hispaniolaand Haiti. Winds were down to about 75 miles per hour after crossing al0,000-foot mountain in the Dominican Republic. Later that day, a hurricanewatch was posted for south Florida with the weakened storm some 350 milessoutheast of Miami. In the late evening of the same day, hurricane warningswere up as the now strengthened hurricane, with 90 mile per hour winds,was 300 miles from Miami.
At 0700 on September 3, David was 35 miles east of Ft. Lauderdale with85 mile per hour winds and a pressure of 28.85 inches. Ft. Lauderdale expe-rienced torrential rain, in squalls with gusts over 75 miles per hour. Since
the eye and strong side of the storm were over the ocean, this condition keptup most of the day.
Figure 7-B shows David, at about 1800 that evening. David made land-fall about 20 miles south of Melbourne with 90 mile per hour winds and cen-tral pressure of 28.75 inches, a Category 2 hurricane.
From there, the hurricane made it to Savannah, Georgia, before downgrad-ing to a tropical storm, on September 4. On the 7th, David was no longer athreat and died near Newfoundland (see Figure 7-C).
Fatalities were: United States - 5; Puerto Rico - 7; Dominica - 56; and inthe Dominican Republic - 1200. The damage was $5 million (1990 dollarvalue) in the U.S. and Florida.
While Hurricane Frederic in August/September 1979 did not strike Floridadirectly, hurricane warnings extended over to Panama City on September 1 lth,and gale warnings were displayed south to Cedar Key.
Frederic had a development that was similar to David. This caused muchapprehension because people were not ready for another storm so soon, oneweek, after David.
The final thirteen years ( 198 1 - 1993) of the thirty-two year period, had sev-eral storms and hurricanes, marking an upswing in overall storm activity(Table 4). Some of the storms became hurricanes after they passed Florida,and will be mentioned briefly here.
On August 17-18, 1981, tropical storm Dennis struck Florida. Dennisstarted as a tropical storm southwest of the Cape Verde Islands on the 6th ofAugust, and continued at this level near Barbados, but became a tropical de-pression south of Puerto Rico and then turned into a mere disturbance. Justwest of Jamaica, Dennis regained tropical storm status, turned north andslammed into the southwest Florida coast. The track was up through CentralFlorida to become stationary between Ft. Myers and southwest LakeOkeechobee. Southeast Florida had 10 inches of rain, and Homestead had20 inches. Winds were more than 55 miles per hour. Finally, Dennis movedacross the lake and out to sea near Melbourne and Cape Canaveral, Florida.On the 2Oth, east of Cape Hatteras, Dennis became a hurricane.
On August 25th, 1983, tropical storm Barry struck Florida. This stormcrossed Florida on a track from Melbourne to Tampa on the 25th, first as atropical storm and then as a tropical depression. After crossing the Gulf, Barrybecame a hurricane southeast of Brownsville, Texas, on the 28th of August.
Hurricane Diana, which gained hurricane status on September 10, 1984,scraped the Florida coast between Daytona and Jacksonville on the 9th-10thas a tropical storm; winds were in excess of 70 miles per hour.
Tropical storm Isidore occurred during the period between September 25
32 33

and October 1, 1984. On the 27th, it had winds of 50 miles per hour. Land-fall occurred between Vero Beach and Melbourne on the evening of the 27th.From there it went to Orlando at about midnight, then travelled west, to about75 miles north of Tampa. On the 28th it made another turn, headed north-east, crossing over to Jacksonville and then out to sea; the storm was accom-panied by heavy rains.
Hurricane Bob was relatively short-lived and struck the southwest Floridacoast near Ft. Myers on July 21-25, 1985, as a tropical storm. Winds were50-70 miles per hour. Bob crossed Lake Okeechobee and went out to seanear Vero Beach on the 23rd of July, followed by a sharp turn to the north,skirting Daytona on the 24th. Bob became a hurricane at sea on the 24th,east of Georgia.
On October 9-13, 1987, Hurricane Floyd appeared. It moved across thewestern tip of Cuba on the 11th on a northeast track. A more eastern turnwas made across the Dry Tortugas and into the Keys on the 12th of October.It became a hurricane near Key West with winds of 80 miles per hour. Theeye of the hurricane crossed over Key West at about noon. Warnings weregiven all across south Florida; some tornadoes occurred on the southwestcoast of Florida.
The eye of the storm appeared over Marathon later and over Key Largoat about 1800 on the 12th. Floyd’s winds were 75 miles per hour and thebarometric pressure was 29.32 inches. About 30 miles south of Miami, Floydbroke out into the Atlantic near midnight on the 12th. Winds and rains at-tributed to Floyd were felt as far as Palm Beach.
Hurricanes Elena, Juan, and Kate, which occurred in 1985, are briefly dis-cussed below.
Hurricane Elena, a Category 3 hurricane in August/September 1985, de-serves discussion although it never actually made landfall in Florida (Figure8). Its center passed within 40 miles of the West Coast, where it stalled forabout 24 hours offshore from Cedar Key, and then moved west northwest,passing within 30 miles of Cape San Bias. In its passage the storm tide thatwas created caused heavy waterfront damage in the City of Cedar Key andthe disappearance of 1500 feet of the exposed south tip of Cape San Blas.Because of the offshore location of Elena’s peak winds, most of the damageto the coast was due to the storm tide (7-9 feet) and wave activity causingdestruction which stretched from Venice to Pensacola. Nearly a million peoplewere evacuated from low lying coastal sections in the warning areas postedfor Hurricane Elena.
While not directly striking the Florida coastline, Juan in October/Novem-ber 1985, nevertheless, impacted the extreme northwest Florida panhandle
(Figures 9-A - 9-C). Pinellas, Manatee, Sarasota and Lee Counties were con-tinuously pounded by the storm’s spiral bands through the evening of Hal-loween.
On November 21, 1985, Hurricane Kate, a Category 2 storm, struck thecoast near Port St. Joe in the Florida Panhandle (Figures 10-A - 10-B). Itwas the only hurricane to strike Florida so late in the season this far north.Just prior to making landfall near Mexico Beach, about halfway betweenPanama City and Port St. Joe, Kate slowed her forward speed and weakenedin the early morning because of cooler sea surface temperatures in the north-em Gulf of Mexico. The total damage was mainly due to the storm tide andwave activity. A sizeable $300 million in damages (1990 dollars) resulted,yet it caused only about one-fourth of the damage inflicted by HurricaneElena.
Tropical storm Isabel scraped extreme northeast Florida near FemandinaBeach and the Florida-Georgia border on October 10, 1985, with minimaldamage.
Hurricane Chris was a tropical storm during the period August 21-29,1988.Chris, with heavy rains, skirted the Florida east coast from Miami to Jack-sonville, first as a tropical depression then as a tropical storm on the 27thand 28th.
Hurricane Keith was a tropical storm during November 17-24,1988. Thestorm moved into Florida’s west coast between Ft. Myers and Tampa on the22nd, a tropical storm with 65 miles per hour winds. The storm crossed thestate intact and came out into the Atlantic near Melbourne and Cape Canaveralon the 23rd. Heavy rains and some tornadoes were sighted throughout thestate.
While 1990 produced 14 named storms, the most since naming began in1953, only Marco, a tropical storm, affected the northwest portion of Floridaslightly, and Klaus, as a final disturbance, got into the central and north cen-tral part of Florida.
34 35

Chapter 3
Four Years and Billions of Dollars Later
The even-numbered years of this four-year period seemed to provide the mostFlorida activity. Hurricane Andrew, 1992, dominated this period with morethan $25 billion in damages.
In 1994, Alberto, Beryl and Gordon chalked up more than $1 billion indamages as mere tropical storms. Obviously the dollar value was different.While the population and building densities were not the same for these tropi-cal storms as in the case of Hurricane Andrew, it does prove that you shouldn’tsell a ‘mere’ tropical storm short.
1991
The hurricane season of 1991 couldn’t rally anything more than a brush withtropical storm Fabian on the extreme southeast tip of Florida.
Hurricane Bob, the most potent of the 1991 season, headed toward theMiami-Palm Beach area but 200 to 300 miles off the Florida coast he ex-ecuted an almost 90 degree turn to the north and missed all of Florida. Sothe Sunshine State escaped once again.
1992
Hurricane Andrew
Except for several tropical depressions, June, July and half of August ofthe 1992 hurricane season were quiet. The last late start was Anita back in1977 on the 28th of August, in the Gulf of Mexico.
But on August 14, 1992, satellite photos indicated a strong tropical waveoff the African coast in the area of the Cape Verde Islands. This system movedwest for two days and developed into a tropical depression near 11.6N and40.4W early on the 17th. By noon on the 17th, the winds were 40 miles perhour and Tropical Storm Andrew was named. This position was about 1175miles east of the Lesser Antilles.
By the 20th, Andrew was in trouble. The winds were less than 45 milesper hour and the barometric pressure was that of normal sea level, leavingthe whole system shaky. At this point, San Juan, Puerto Rico, was only 350miles southwest, but Andrew had slowed down!
The next morning, however, winds were up to 60 miles per hour and pres-sure had dropped to 29.71 inches. By 2300 on the 2lst, Andrew was 610miles east of Nassau, in the Bahamas, with 65 mile per hour winds.
The morning of the 22nd of August, air reconn confirmed that, “Andrewis now a hurricane”. Winds were 76 miles per hour, pressure was 29.35 inchesand he was 800 miles east of Miami, Florida.
By 2300 on the 22nd Andrew was moving dead west at 15 miles per hourwith 110 mile per hour winds and a pressure of 28.32 inches, a Category 2hurricane.
But by noon of the 23rd we had a Category 4 hurricane! Winds were 135miles per hour, pressure had dropped to 27.46 inches, and the storm was 330miles east of Miami, still moving west at 16 miles per hour.
By 1415 that same afternoon, Andrew was at his peak with 150 mile perhour winds and 27.23 inches (Andrew was very close to a Category 5 storm).At this point a Hurricane Watch was posted from Titusville south to VeroBeach and Hurricane Warnings covered from Vero Beach south through thekeys and up the west coast to Ft. Myers.
By 2100 on August 23rd, Andrew was in the Bahamas 180 miles east ofMiami. Landfall near Miami was predicted for early morning August 24.
Between 0400 and 0500 on the 24th, Andrew struck the Florida coastlinejust south of Miami, with sustained winds of 145 miles per hour and recordedgusts of 164 miles per hour, reported by the National Hurricane Center in
36 37

Coral Gables, before the main radar at the center was destroyed (Figure ll-A). Gusts to 175 mph were later confirmed.
Andrew crossed the state with 125 mile per hour winds and a forwardspeed of 18 miles per hour, still moving dead west, and a Category 3 stormnow (Figure 11-B). Pressure was 27.91 inches. Some recorded gusts in milesper hour were:
Palm Beach International Airport 54Goodyear Blimp Base at Pompano 100Miami International Airport 115National Hurricane Center 164Turkey Point Power Plant 163Turkey Point Nuclear Power Plant 160Fowey Rocks (Biscayne Bay) 169
(U.S. Army Corps of Engineers, 1993)
Once into the warm waters of the Gulf of Mexico, winds returned to 140miles per hour, or Category 4 again.
By 0600 on the 25th, Andrew was 270 miles southeast of New Orleans,now moving west, northwest at 17 miles per hour. Winds were 140 milesper hour.
At 1300 on the 25th, the storm was 150 miles south of New Orleans mov-ing west, northwest at 16 miles per hour. Winds were still 140 miles per hourand barometric pressure was 27.85 inches.
The storm slowed-down to almost stationary 30 miles southeast of La-fayette, Louisiana. Early on the 26th of August, winds near New Iberia, Loui-siana, were reported to be 115 miles per hour with gusts to 160 miles perhour.
Landfall occurred between New Iberia and Lafayette, Louisiana, as a Cat-egory 3 hurricane.
By noon on the 26th, Andrew was down-graded to tropical storm statusfor the first time since the 22nd of August. Near Baton Rouge, Louisiana,there was up to 10 inches of rain and 65 mile per hour winds, with torna-does.
By the morning of the 28th, the system was in eastern Tennessee, tryingto merge with a cold front, the remains of Hurricane Lester, a Pacific hurri-cane. Andrew finally died out in Pennsylvania on August 29, 1993.
r On Sabbatical with Hurricane Andrew
After anchoring their 40-foot sailboat (named Sabbatical) in Manatee Bayin the upper Keys, Dr. and Mrs. Stephens took refuge in a friend’s home inSouthwest Miami. The following is an eye-witness account written by LoisStephens of Melbourne Beach, Florida.
Sleep was difficult, but I think we all managed to sleep some. About 2:00AM it started. The wind was howling and shutters were banging. The fiveof us all crowded into the hallway, just like the usual pre-hurricane instruc-tions stated. Fortunately, Karen had put out candles for us. So far so good.
The lights went out, the rain started. The wind got many times strongerand the house almost shivered. The force became so great we ran almostpanicky into the bathrooms. There were two, both without windows. Ronand Karen headed for one, Lee, Tom and I the other. We sat on lawn chairs,nestled close together, in the dark with our eyes closed. We opened the dooronly long enough to get a small votive candle, but the force became toogreat to open it. The wind grew more ferocious. Suddenly, the windows be-gan to blow out, one at a time, fiercely smashing against the tiled floors.One huge crash I assumed to be the TV, but it was the newly purchasedcomputer. Glass kept smashing. I had been aware for some time of my tworoot canals. It was strange, but the teeth had piercing pain. I rememberedonce before being in an airplane with inadequate pressure regulation andexperiencing the same pain. Then it hit.
The drop in pressure in the house was so intense it caused pain in yourears and you had to keep swallowing, something like when a plane takesoff, but much, much worse. We tried to open the bathroom door, but theforce was too great. So three and two of us sat in silence, eyes closed, waitingfor the horror to end. The small door to the “attic” storage space blew inand the rain followed. Water crept in around our feet, and I had a dread ofit rising. But it did not. Sometime after 6:00, I think, the wind subsided sub-stantially, and we had nerve enough to leave our sanctuary.
The house was all but demolished. The bed where Tom and I had slept afew hours before was full of glass and wet soggy debris. (My emergencybag of clothing, etc. was waterproof, but I had left it unzipped so it waslikewise wet and full of junk.) The newly tiled (and in 3 rooms, newly car-peted) floors were covered with roof shingles, nails, much glass of all sizes,furniture, books, and of course, with a couple of inches of water. Ceilingfans still clung to their mountings, but under each, the light globes were
39

full of dirty water. Water oozed from holes in the walls where Karen’s (sheis an artist) newly framed tropical paintings had been hung. Paint wasstripped from the walls. The carport (a sturdy “permanent” one) and dooroverhang were gone. The new roof was without shingles, and had gapingholes. A look outside showed that all trees and fences were down.
It was, of course, light now, so being cautious but ignoring some of thewarnings we had heard, we walked around the neighborhood. It was sick-ening, horrifying. Not one house had escaped major damage. Trees, eventhe largest, were sprawled over houses, cars and streets. Some cars had onlybroken windows and dents (as did our friend’s), and some were blown aboutand overturned. One had burned from a fallen power line. Not just the powerlines were down, but heavy duty power poles were also broken. Except forno smoke or fires at this point, it must have been what a “bombed out”area looks like in wartime.
Miraculously, quick checks with neighbors found no one injured. Sinceroads in every direction were impassable, any hope of getting back to whatmight or might not be left of our boat were given up for the present.
LATER...
Highways were somewhat clear by this time, except for some question-able power lines. Trees and large downed poles lined the way. What wasmost amazing, though, was that literally thousands of cars had found theirway to the same area where we were. Traffic was next to impossible, lightsand signs inoperative, and cars in extremely questionable condition. We’llnever know the number of traffic accidents that day alone.
We &sed the hotel, the Holiday Inn, where we had tried so desperatelyto get a room. It was standing, but barely, with all windows, balconies, etc.blown away. We passed houses with walls only and houses without any walls.Devastation went on for miles.. We passed lines of hundreds of people wait-ing for water. Huge trucks had apparently been placed there at some pointto distribute bottled water (Figure 11 -C). One truck had blown uselessly onits side.
Eventually we got to our boat - it was not where we had left it, of course,but it looked good and was tightly nestled back in a grove of mangroves,aground. Miraculously, even the little Zodiac dinghy was still tied to it,snuggled alongside like a loyal puppy nestled against its master. A windowwas out, glass was every where and branches were entwined in some lines.A stanchion (Tom says) was out and leaves and red mud covered one sideof the boat. It was beautiful - we were ecstatic. The carpet was wet -- the
galley was soaked and covered with glass, but everything else was as weleft it.
That night, Tom and I were alone in the middle of Manatee Bay, the mostbeautiful anchorage of our entire sailing experience.
The sky was clear and bursting with stars with no electric lights to dis-tract from their beauty. There were no airplanes, distant cars, trains or anynoises. The most amazing phenomena was taking place in the water aroundus. We had seen luminous fish on occasion, but we saw intensely brilliantgreen fish swimming around the boat. We dropped a line in the water andswirled it around and it left a trail of light behind it, somewhat like a comet.If we splashed the water, we splashed thousands of tiny lights. (All of this,of course, sent us later to our reference books to see what we had discov-ered.) We were so fortunate, so thankful, and we sipped our champagne.
THE NEXT DAY...
We were stopped by the Miami Police in a huge inflatable boat and ad-vised we were on the Coast Guard “list” (missing persons and boats) andto ‘call home’.
Andrew Epilogue
Current death toll stands at 40. This is far less than what has occurred inpast hurricanes of comparable strength. Massive evacuations were orderedin Florida and Louisiana which accounts for the low death rate.
Hurricane Andrew was the most destructive natural disaster in U.S. his-tory! Damage estimates were more than $25 billion, most of which was insouthern Dade and Monroe Counties, Florida, from Kendall southward to KeyLargo. The Bahamas estimated $250 million dollars in damage and Louisi-ana more than $1 billion.
Florida’s agricultural industry loss was $1.04 billion alone. There was mod-erate impact damage to the offshore reef areas down to a depth of 75 feet(U.S. Army Corps of Engineers, 1993).
Ninety percent of all homes in Dade County had major roof damage (U.S.Army Corps of Engineers, 1993) and 117,000 homes were destroyed or hadmajor damage.
According to the U.S. Army Corps of Engineers who worked coopera-tively with other agencies to determine environmental impacts, 12.7 millioncubic yards of debris resulting from Andrew were hauled away; there were39 approved debris-burning sites (Figure 11-D).
40 41

Damage to the Turkey Point nuclear power plant belonging to FloridaPower and Light Co. was $100 million (U.S. Army Corps of Engineers, 1993).
In terms of damage to moored recreational vessels within Biscayne Bay,a total of 918 hurricane damaged vessels were found. According to Antoniniet al. (1993), “roughly . . . one-third of the damaged vessels were completelyor partially submerged, damaged but floating, and damaged aground.” Thesite of the greatest devastation was in the area of Dinner Key Marina nearCoral Gables in Miami.
The recovery process is still underway (Figure 11 -E), but it should be em-phasized that the results of tremendous structural damage by Andrew’s windscould become cumulative in the future.
Andrew was a compact system with a radius of maximum winds of about12 miles. A slightly larger system or one with a landfall a few miles furthernorth would have been even more catastrophic by affecting the more heavilypopulated areas of Greater Miami, Miami Beach, and Ft. Lauderdale. NewOrleans was relatively spared also.
Such statistics as the 16.9-foot storm tide in Biscayne Bay, Miami, is arecord maximum for southeast Florida. Louisiana had 7-foot storm tides.
Only Hurricane Carnille in 1969 and the “Great Labor Day Hurricane of1935” in the Florida Keys had lower barometric pressures at landfall in thiscentury. Barometric pressure associated with Andrew bottomed out at 27.23inches.
A maximum lo-second flight-level wind speed of 170 knots, or 196 milesper hour, was reported by the reconnaissance aircraft in the vicinity of north-ern Eleuthera Island in the Bahamas on the 23rd of August. The storm surgethere was.23 feet!
Andrew will not be the last hurricane to cause such massive devastationand havoc (Figures 11 -F - 11 -J). Another similar storm may appear next year,or ten years from now there is no way to know when. However, the bitterlessons we have learned should provide us with ample ammunition to sur-vive the next big one.
1993
No hurricanes or tropical storms struck Florida or seriously affected Floridain 1993. The most powerful storm of the 1993 season was Hurricane Emily,August 22 to September 6. She was a Category 3 hurricane with top windsof 120 miles per hour and a low pressure of 28.38 inches. This storm came
42
directly at Florida until the 28th of August, at which time she turned to thenorthwest. Emily, because of Andrew in 1992, did a first-class scare-job onthe Florida coast from Miami to Jacksonville but she never got to within 800miles of the Florida coast at any point. Emily scraped the Cape Hatteras areawith minimal damage, then turned back east again to die out some 480 milessouth, southeast of Cape Race, Newfoundland.
1994
Albert0 - June 27 -July 4
The 1994 Florida hurricane season started with a disturbance in the Ba-hamas near 23N-78W on the 27th of June. This system moved west, throughthe Florida Straits, across Cuba into the Yucatan Channel. On the 29th, itturned north and became a tropical depression. (See Plate 13 and Figure 12-A for detailed track.) On the 1st of July, the winds were 40 miles per hour,the pressure was 29.74 inches and “Alberto” was named 425 miles south-east of the mouth of the Mississippi River. The next day, winds were up to60 miles per hour and pressure had fallen to 29.47 inches and Albert0 was150 miles south of Pensacola, Florida. A slight turn to the north, northeaston the 3rd of July steered Albert0 to landfall near Destin, Florida about noon.Winds at landfall were 65 miles per hour with peak gusts as high as 86 milesper hour. The barometric pressure bottomed out at 29.32 inches. Maximumtides were more than 5 feet and 5-10 inches of rain fell in the area. Alberto,now a tropical depression, moved slowly to near Atlanta where it becamestationary for almost 2 days. A slow move to the south and southwest broughtthe system into southwest Georgia and north Florida. Heavy flooding in Geor-gia, Alabama and Florida resulted in 13 counties being declared disaster ar-eas in Florida alone. All rivers in northwest Florida and southern Georgiawere over their banks. The Apalachicola, Chipola, Withlacoochee, Ochlock-onee, and Flint Rivers were all over flood stage (See Figurel2-B). As muchas 27.61 inches of rain fell in southern Georgia and extreme north Florida.Two thousand people were evacuated in the areas affected and as many as18,500 were without electricity for more than two days. As many as 300,000chickens and 125 steers and hogs as well as 50% of the peanut, cotton, soy-bean, and corn crops were destroyed. Ninety percent of the Apalachicola Bayoyster beds were destroyed. There were 31 deaths and darnage was over 500million dollars. By the 6th of July, Albert0 was gone leaving a saturated
43

Florida Panhandle, Georgia, and Alabama. It is evident that tropical stormscan, and often will, cause more damage than some hurricanes (see Figure12-C).
Be@ - August a347
The second tropical cyclone of the 1994 hurricane season also madeFlorida a target. A disturbance off the west coast of Florida near Sarasotawas found moving northwest on the 13th of August. “Beryl” was named asa tropical storm just off Cape San Blas, Florida (See Plate 13 and Figure 13for detailed track.) On the 15th, she carried 58 miles per hour winds and pres-sure of 29.71 inches while pushing 3-5 foot surges along the Panhandle coast-line. Although the main track appeared to be northeast, the center oscillatedfirst west, then east finally making landfall near Panama City. Winds of 60miles per hour were felt at Shell Point, Turkey Point, and at the state capitolat Tallahassee. Lowest pressure measured was 29.50 inches at landfall. Tal-lahassee, still soaked from Alberto, received nine inches of rain and Apa-lachicola got 10.69 inches. There was heavy flooding in Apalachicola andCedar Key and several dozen tornadoes were sighted in Florida, Georgia,South and North Carolina and Virginia. Twenty thousand people lost powerfor several days and the oyster beds in Apalachicola Bay were hit hard enoughagain to be closed due to contamination. By 0600 on the 16th of August, thesystem was 80 miles southwest of Albany, Georgia, moving northeast at 6miles per hour. She still packed 64 mph winds and a pressure of 29.56 inches.By 1800 that same day, Beryl was a depression in North/Central Georgia mov-ing north, northeast at 15 miles per hour dissipating rapidly. Beryl causedno deaths, but chalked up 73 million dollars worth of damage. The half-waydried-out Panhandle had to start all over again.
In the meantime, the Atlantic was fairly busy with Hurricane Chris andTropical Storms Debby and Ernesto, mostly deep-Atlantic storms. Septem-ber was hurricane-free for the first time since 1968. There was a suspiciousarea (low pressure) in the mid-Gulf on the 3Oth, but nothing happened. EarlyNovember produced Hurricane Florence (in the Atlantic, a Category 2 storm),the strongest of the season, and as in the past, probably the last for this year.
Gordon - November 8-21
But on the 8th just off the Nicaraguan coast, tropical depression 12 formedand moved slowly north. On the 10th about 50 miles off the Nicaraguan/Hon-duran coast, the storm was named Gordon, and became the 7th named storm
44
of the 1994 season (see Plate 13 and Figures 14-A - 14-B). The north trackcontinued until the 12th when the system turned east. Gordon stayed on thistrack south of Cuba until the 13th. Just south of the Guantanarno Naval BaseTropical Storm Gordon turned north and passed over eastern Cuba into theBahamas. On the 14th, Gordon was moving west through the Florida Straits.Guantanamo recorded a peak gust to 120 miles per hour (probably from oneof the numerous thunderstorms). Sometime later on, the 15th, the Air Reconnreported the center to be near the north Cuban coast while radar showed anew center forming about 25 miles east-southeast of Key West. Gordon wasmoving west 6 miles per hour with winds more than 50 miles per hour andpressure at 29.50 inches. Later that same day, Gordon turned north, puttingthe center about 110 miles south of Sarasota. A more northeasterly turn onthe 16th put the landfall near Ft. Myers about noon. During the day, the sys-tem, still a tropical storm, crossed Florida with sustained winds around 45miles per hour and heavy rains (Figure 14-C). He emerged into the Atlanticsouth of Melbourne around midnight. Flooding from the heavy rains resultedin heavy crop damage. The entire potato crop in Dade County was submerged.Virginia Key recorded a sustained wind of 53 miles per hour and a peak gustof 83 miles per hour in another part of Dade county. From 6 to 9 inches ofrain fell in most of Florida with more than 16 inches in Broward County.Six tornadoes were confirmed in the state during the passage with one justsouth of Melbourne, at Barefoot Bay, killing one person and injuring 40.Seven more people drowned along the southeast coast. In Volusia County,1236 buildings were damaged and heavy flood damage was evident there,mostly to roads and sewers. Power and telephone lines and signs were alsoheavily damaged. Some 425,000 customers were without power in Dade andBroward Counties. A 506 foot long freighter was beached off Ft. Lauderdaleand 37 people were rescued from sin.king boats. Gordon continued northeastinto the Atlantic and became a hurricane about noon on the 17th about 325miles south of Cape Hatteras, North Carolina. Highest winds were 85 mphwith the pressure lowest at 28.94 inches (Figurel4-D).
But, this erratic storm was not finished. A counterclockwise loop broughtGordon back toward Florida, and on the 2Oth, around midnight, the systemwas making landfall just north of Cape Canaveral as a depression, still withwinds of 25-30 miles per hour and heavy rains. Dissipation took place asthe system moved through Florida and Georgia. The total damage was morethan $400 million and Gordon killed 1145 people, most in Haiti.
On the 21st of December, a low pressure area formed near 24N - 86W inthe Gulf of Mexico and moved east, northeast. This system crossed southFlorida the same day and entered the Atlantic Ocean as a tropical system on
45

the 22nd. Fowey Rocks, Miami and Lake Worth automated stations recorded5 1 mph sustained winds at 1800 on the 21st and Florida got 7 inches of rainduring the passage. It was not named.
That brought to an end the 1994 hurricane season. There were 7 totalstorms-3 hurricanes, 4 tropical storms. The season was unusual in viewof the suppressed activity during the height of the season (August-October),and not since 1980 have there been two November hurricanes. No majorhurrricanes (Categories 3-5 on the Saffir/Simpson scale) occurred either. (Theaverage is 2.1 Categories 3-5 storms per season.)
Chapter 4
Allison to Roxanne
1995
All but two of the 19 storms of 1995 grew from tropical waves originatingoff the west African coast. The season cost the areas affected over $9 billionin damage and an estimated 128 lives were lost in the Atlantic Basin.
The 1995 hurricane season was not a record but it was a close second tothe 1933 season which had 21 storms. There were 19 named storms in 1995,(the average is 9), 11 of which became hurricanes (the average is 5). Felix,Luis, and Opal were Category 4 storms while Marilyn and Roxanne wereCategory 3 hurricanes. There were two Category 2 and four Category 1storms. Erin and Opal struck the Florida coast as hurricanes and Allison andJerry were tropical storms at Florida landfall. Florida has not been hit with4 tropical storms since 1953 and the overall season has not been so busy since1969.
Between Hurricane Erin and Tropical Storm Jerry, east-central Florida wasinundated with more than 20 inches of rain. Opal will go into the record booksas the second most expensive storm in Florida (Andrew has that record). Opalcaused major erosion along 57 miles of Panhandle beaches which will costover 100 million dollars to repair. This exceeds erosion damage done by An-drew, Eloise, and other major storms in Florida.
The storm surge from Opal was estimated to be 12 to 15 feet in some ar-eas, and beach dunes as high as 21 feet were flattened.
46

Allison - June 3-6
A disturbance was noted in the northwest Caribbean on the first of June.By the third of June, this system was a tropical depression 160 miles southof the western tip of Cuba, moving north, northwest at 10 miles per hour.
At 1100, the storm was named Allison (See Figure 15-A for detailed trackand plate E3), having become the first named storm of the 1995 season. Windswere 40-45 miles per hour and pressure was 29.59 inches, and she was mov-ing north, northwest at 14 miles per hour heading for Cozumel and Yucatan.
At 1400, however, Allison was 70 miles east, southeast of Cancun, Mexicoon a north track at 15 miles per hour.
Early on the 4th, she had cleared the Yucatan Channel, winds were up to60 miles per hour, and pressure had fallen to 29.41 inches.
By noon, Allison was a hurricane, 300 miles south of Apalachicola, Floridamoving north at 16 miles per hour. This was the peak of Allison with 75 mphwinds and pressure of 29.15 inches.
At 0600 on the 5th, she was 40 miles southwest of Apalachicola pushinghigh tides, spawning tornadoes and over five inches of rain. Landfall wasnear St. George Island, Florida as a minimal hurricane or strong tropicalstorm. The system was large at this point, and actual landfall was betweenSt. George Island and St. Marks (see Figure 15-B).
Heavy rains throughout the area caused flooding and gusts up to 54 mphwere felt as far north as North Carolina’s Outer Banks. The remnants endedup in Massachusetts.
Allison caused one death and $1.7 million damage (Figure 15-C). It wasthe earliest storm to strike the Florida Panhandle this century.
Meanwhile, Tropical Storms Barry, Chantal, and Dean in July were play-ing around in the Atlantic and Gulf of Mexico, but did not affect Florida.
Erin - July 31 - August 6
Erin formed from tropical depression 5 in the southeast Bahamas (See Fig-ure 16-A for detailed track and plate 13). The system had been tracked fromeast of the Leeward Islands. The storm moved west, northwest 10 miles perhour and about 340 miles east, southeast of Miami. Erin was a hurricane withwinds 75 miles per hour and pressure 29.21 inches.
At 0600 on the first of August, hurricane warnings were issued along Florida’ssoutheast and central coast.
At 0100,2 August, Erin was making landfall north of Vero Beach betweenSebastian and Palm Bay (similar to 1979’s Hurricane David) (Figures 16-B- 16-C).
At that time pressure was 29.09 inches and winds of more than 85 milesper hour were occurring. The actual eye is described by coauthor J.M. Will-iams as it passed over his house in Palm Bay:
The eye passage started at 0245, at which time the barometric pressure bot-tomed out at 29.00 inches (Figure 16-D).
Before that, it was the usual squally, hard rain--light rain routine of anapproaching storm.
Winds gusted to more than 65 mph at times and I watched sustainedwinds over 50 mph for as long as 20 minutes at a time. All this from theNorth. I was worried about my garage door, (two-car garage) as this canbe the weakest part of one’s house--but I had parked my pick-up truck closeto and across the door. It shook & rattled but held up ok. During the eye,the sky was relatively clear with occasional light breezes. Once for about 5minutes, nothing stirred!
At 0330, the winds picked up rapidly from about 110 degrees and nowthere were several severe thunderstorms added to the other activities.
My peak gust of 75 mph from 140 degrees came at 0404 and the worstpart of the storm was definitely the back side. I measured more than 8.3inches of rain during the passage and more than 10 inches fell before thesystem was out of here.
There was minimal damage, lots of debris, the power sputtered severaltimes but never went off and I finally lost cable TV about 0530 after re-cording the whole storm. By 0700 Erin was dumping heavy rain on DisneyWorld and still doing it locally. I had no flooding problems but a few blocksaway, there were major flood problems plus the power was off there.
The following is an eyewitness account of Erin’s devastation by coauthorI.W. Duedall who lives in Melbourne Village, a few miles north of Palm Bay.
My wife Mary and I went to bed early on the evening of the August 1st.We were awakened at about midnight by the sounds of thunder and light-ning and strong gusts of wind hitting the palms and pines. With outsideflood lights on, we experienced our very first Florida hurricane inside thecomfort of our house; the power went out at about 0400, so we finishedout the storm by candlelight.
48 49

The severity of the storm seemed to lessen by around 0430. The eye ofthe storm passed south of us, probably near John Williams’ house in PalmBay so we really never experienced ‘the before and after the eye of a hurri-cane.’ Oh well, next time. When it came light around 0600, we walked out-side: tree limbs and debris were everywhere, it was nature’s way of creat-ing a first class mess! The storm allowed many of our tall trees to calve theirlimbs and large branches naturally; fortunately none fell on the roof. Sur-prisingly, there was not too much standing water-we didn’t know it thenbut the real devastation of Erin was yet to come, in a few more hours-huge amounts of rain!!
That morning at about 0700 Mary was to have left for Orlando Interna-tional Airport to visit my Aunt Violet in Albany, Oregon. When we calledthe airline the day before to learn whether the flight was on or off becauseof the oncoming hurricane, the agent told us that the rescheduled flight mayleave early in the afternoon of the 2nd; we were surprised that the airportwould reopen so soon. While we were preparing to leave for the airportErin’s rain had started, but giving little hint to what was in store forMelbourne Village and area in the next few hours.
The trip to Orlando was uneventful. The airport was operating, with littleevidence that it had been struck by a tropical storm a few hours earlier. Halfway back to Melbourne the rain began to increase. However, I took littlenotice. But on l-95 a few miles before the intersection to Highway 192 nearWest Melbourne the downpour started. The rain was so heavy (the worst Ihave ever been in) that traffic came to a near halt; I could not see anythingout of my windshield even with wipers moving full blast. I drove slowly withmy head out the driver’s window. It took an hour to move a distance thatnormally”takes a few minutes.
As I approached the intersection Highway 192 on l-95 the disaster ofErin’s rain became evident. Except for a small portion of its inside lane, High-way 192 and shoulder were flooded as far as you could see. I knew if Istopped I would never get started again; I also figured that the road wouldbe closed very soon. Cars and pickups were stranded randomly on the shoul-der. But I proceeded onto Highway 192 anyway traveling that small openarea of the inside lane. I made it all the way to the entrance to MelbourneVillage. As I drove into the Village, its streets were likewise flooded. Waterwas everywhere but I just kept moving, keeping a light pedal on my brakestrying to keep them as dry as possible (you can’t stop a car with wet brakes).Fortunately I made it to my driveway which was under a foot or so of wa-ter. In fact a ‘lake’ surrounded our house (and many other houses in theVillage); the log poles that normally border our driveway were floating all
5 0
around the driveway. Later that afternoon Scott Taylor, my neighbor, tookhis family on a canoe ride, paddling up and down Village roads.
Several Village homes were flooded. Several days later after things beginto dry out, some residents put their ruined rugs and destroyed furniture andbelongings on the curb for pickup by the garbage truck.
The greatest damage occurred at the Village entrance where the Targetdepartment store stands. So much rain fell in such a short time that Target’sroof caved in. The store was closed for several weeks for repair and restock-ing.
Three days passed before the ‘lake’ disappeared around our house.Melbourne Village residents were without power about five days.
By 1800 Erin was 90 miles southeast of Apalachicola moving west 17miles per hour. At 0600 on the 3rd, Erin was a hurricane again 75 miles south-east of Pensacola. Winds were 80 miles per hour and pressure was 28.79inches. Erin peaked in this area with 90 mile per hour winds and lowest pres-sure of 28.74 inches, having made a strong Category 1 storm.
The second landfall was near Pensacola but 90 miles per hour winds werefelt as far north as Jackson, Mississippi (Figure 16-E).
On the 4th, Erin was 30 miles northeast of Jackson, Mississippi, movingnorthwest 10 miles per hour. She had 30 miles per hour winds and the lastadvisory was issued.
During the passage from the Bahamas to Florida, the 234 foot gambling/cruise ship “Club Royale” sank 90 miles east of Cape Canaveral with a lossof three crewmen. Six more people died in the Atlantic and Gulf of Mexico.Erin managed to dump heavy rains as far north as Illinois. She finally diedout in West Virginia after raining on Alabama, Mississippi, Tennessee, Ken-tucky, Ohio, and Indiana.
More than 150,000 people were without electricity in east/central Floridafor up to 10 days. Up to 12 inches of rain fell before any relief was felt. Dam-age was more than $700 million (Figure 16-F).
There was a slight reprieve of sorts as tropical depression 6 formed in theBay of Campeche but did nothing.
Category 4 Felix, Tropical Storm Gabrielle, Category 2 Humberto andCategory 2 Iris were playing around in the Atlantic in August and Septem-ber to keep things interesting. Tropical depression 11 was brewing in theFlorida Straits just north of the Cuban coast on the 22nd August.
On 23rd August at about 1800 “Jerry” was named and was about to makelandfall close to where Erin struck (Figure 17-A). The system, a very wettropical storm, took a track through Florida similar to Erin’s path (see Fig-
51
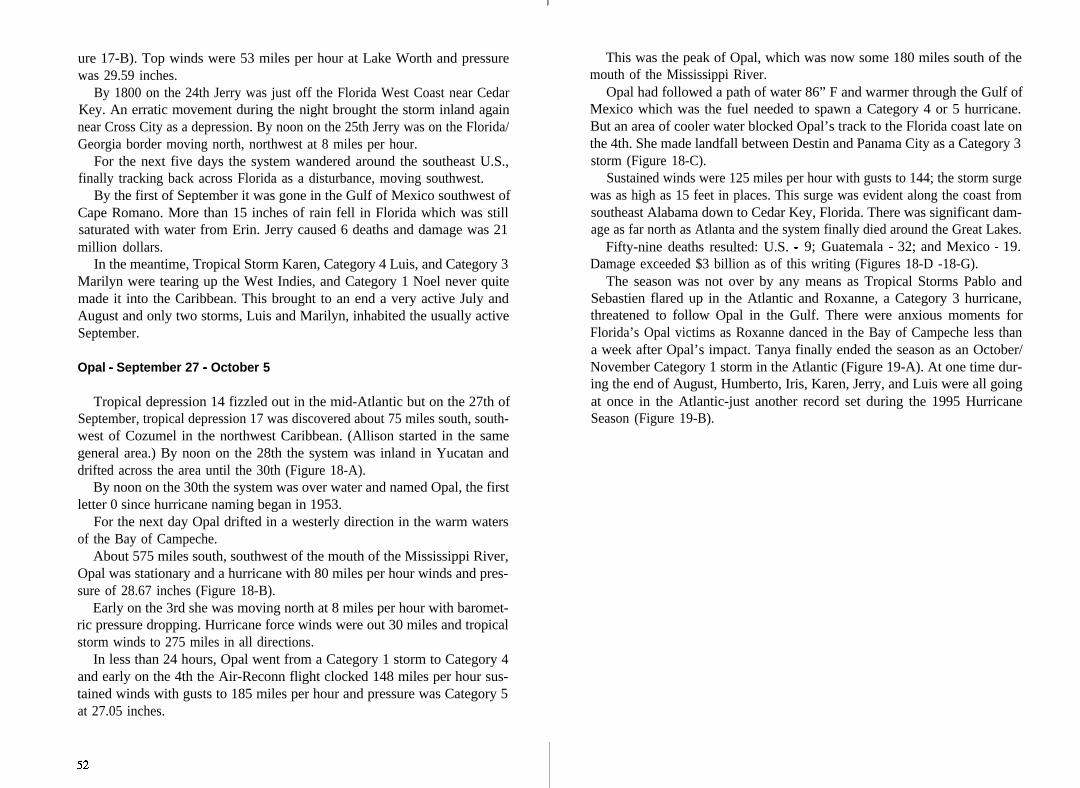
ure 17-B). Top winds were 53 miles per hour at Lake Worth and pressurewas 29.59 inches.
By 1800 on the 24th Jerry was just off the Florida West Coast near CedarKey. An erratic movement during the night brought the storm inland againnear Cross City as a depression. By noon on the 25th Jerry was on the Florida/Georgia border moving north, northwest at 8 miles per hour.
For the next five days the system wandered around the southeast U.S.,finally tracking back across Florida as a disturbance, moving southwest.
By the first of September it was gone in the Gulf of Mexico southwest ofCape Romano. More than 15 inches of rain fell in Florida which was stillsaturated with water from Erin. Jerry caused 6 deaths and damage was 21million dollars.
In the meantime, Tropical Storm Karen, Category 4 Luis, and Category 3Marilyn were tearing up the West Indies, and Category 1 Noel never quitemade it into the Caribbean. This brought to an end a very active July andAugust and only two storms, Luis and Marilyn, inhabited the usually activeSeptember.
Opal - September 27 - October 5
Tropical depression 14 fizzled out in the mid-Atlantic but on the 27th ofSeptember, tropical depression 17 was discovered about 75 miles south, south-west of Cozumel in the northwest Caribbean. (Allison started in the samegeneral area.) By noon on the 28th the system was inland in Yucatan anddrifted across the area until the 30th (Figure 18-A).
By noon on the 30th the system was over water and named Opal, the firstletter 0 since hurricane naming began in 1953.
For the next day Opal drifted in a westerly direction in the warm watersof the Bay of Campeche.
About 575 miles south, southwest of the mouth of the Mississippi River,Opal was stationary and a hurricane with 80 miles per hour winds and pres-sure of 28.67 inches (Figure 18-B).
Early on the 3rd she was moving north at 8 miles per hour with baromet-ric pressure dropping. Hurricane force winds were out 30 miles and tropicalstorm winds to 275 miles in all directions.
In less than 24 hours, Opal went from a Category 1 storm to Category 4and early on the 4th the Air-Reconn flight clocked 148 miles per hour sus-tained winds with gusts to 185 miles per hour and pressure was Category 5at 27.05 inches.
52
This was the peak of Opal, which was now some 180 miles south of themouth of the Mississippi River.
Opal had followed a path of water 86” F and warmer through the Gulf ofMexico which was the fuel needed to spawn a Category 4 or 5 hurricane.But an area of cooler water blocked Opal’s track to the Florida coast late onthe 4th. She made landfall between Destin and Panama City as a Category 3storm (Figure 18-C).
Sustained winds were 125 miles per hour with gusts to 144; the storm surgewas as high as 15 feet in places. This surge was evident along the coast fromsoutheast Alabama down to Cedar Key, Florida. There was significant dam-age as far north as Atlanta and the system finally died around the Great Lakes.
Fifty-nine deaths resulted: U.S. - 9; Guatemala - 32; and Mexico - 19.Damage exceeded $3 billion as of this writing (Figures 18-D -18-G).
The season was not over by any means as Tropical Storms Pablo andSebastien flared up in the Atlantic and Roxanne, a Category 3 hurricane,threatened to follow Opal in the Gulf. There were anxious moments forFlorida’s Opal victims as Roxanne danced in the Bay of Campeche less thana week after Opal’s impact. Tanya finally ended the season as an October/November Category 1 storm in the Atlantic (Figure 19-A). At one time dur-ing the end of August, Humberto, Iris, Karen, Jerry, and Luis were all goingat once in the Atlantic-just another record set during the 1995 HurricaneSeason (Figure 19-B).

Chapter 5
Hurricane Season of 1996
Dr. William Gray of Colorado State University predicted 11 named stormsfor the 1996 hurricane season; 7 would become hurricanes, and 3 of thosewould be major storms (Category 3,4, or 5 on the Saffir-Simpson Scale).
To date (30 November 1996) there have been 13 named storms; 9 havebecome hurricanes, and 6 were major storms (two Category 4 and four Cat-egory 3). The number of major storms is unusual: there are usually 2, onaverage, and there have only been 4 other years when this has happened.
Florida had one direct hit and two close calls, yet 7 storms threatened thestate.
The first threat was Bertha, in July, which came within 200 miles of Florida’snorth coast.
Edouard headed for the Sunshine State but turned north, well away fromthe coast.
Fran brought out warnings for the Bahamas, Florida, and north to the Caro-linas (see Plate 14) before finally curving north to hit the Carolinas.
Tropical storm Josephine started as tropical depression No. 10 in the SWgulf on October 4. The track was basically NE to a landfall in the Floridapanhandle on the evening of the 7th (see Plate 14). Winds of 65 miles perhour and a storm surge of 6-9 feet occurred in the Florida Big Bend areajust east of St. Marks. Nine tornadoes were reported across the state, and131 mobile homes were damaged, two dozen of them seriously in PutnamCounty, south of Jacksonville. Only three injuries were reported, a welcomelow; 100,000 households were without electricity for a short time. Damageestimated at $400,000 resulted from tornadoes alone. Sixteen counties opened36 shelters to about 1,900 people. Jacksonville got the most rain, nearly 13inches. Lowest barometric pressure measured was 28.97 inches, and peakwinds hit 70 miles per hour. Figure 20 shows the storm approaching Florida.
In October, Hurricane Lili started in the northwest Caribbean as TropicalDepression No. 12 in the same area as 1995’s Allison, Opal, and Roxanne.Original model forecasts tracked the storm across western Cuba and then toFlorida’s west-central coast. But by the 16th of October, the track was moreeast through the Florida Straits, the center of the storm missing Florida alto-gether. An approaching cold front saved the day. On the 17th, tropical stormwarnings were hoisted for the Florida Keys and the warnings remained throughthe 18th. Lili made landfall on the southern Cuban coast, but rain bands andtropical storm winds impacted Florida as far north as Cape Canaveral. Thestorm’s east-northeast track eventually took it deep into the North Atlanticand Europe, after much damage was sustained in Cuba and the Bahamas.
Marco ended the season as an erratic Category 1 hurricane in the Carib-bean in November.
54 55

When a Hurricane Watch is Issued
Appendix I
Hurricane Preparedness*
Be Prepared Before the Hurricane Season
.
.
.
.
.
.
.
.
.
.
.
.
Know the storm surge history and elevation of your area.Learn safe routes inland.Learn location of official shelters.Review needs and working condition of emergency equipment, such as
flashlights, battery-powered radios, etc.Ensure that enough non-perishable food and water supplies are on hand to
last for at least 2 weeks.Obtain and store materials such as plywood and plastic, necessary to prop-
erly secure your home.Check home for loose and clogged rain gutters and downspouts.Keep trees and shrubbery trimmed. Cut weak branches and trees that could
fall or bump against the house. When trimming, try to create a channelthrough the foliage to the center of the tree to allow for air flow.
Determine where to move your boat in an emergency.Review your insurance policy to ensure it provides adequate coverage.Individuals with special needs should contact their local office of emergency
management.For information and assistance with any of the above, contact your local
National Weather Service office, emergency management office, or Ameri-can Red Cross chapter.
*NOAA, 1993.
56
. Frequently monitor radio, TV, NOAA Weather Radio, or hurricane hotlinetelephone numbers for official bulletins of the storm’s progress.
. Fuel and service family vehicles.
. Inspect and secure mobile home tie downs.
. Prepare to cover all window and door openings with shutters or other shield-ing materials.
Check Food and Water Supplies
. Have clean, air-tight containers on hand to store at least 2 weeks of drink-ing water (14 gallons per person).
. Stock up on canned provisions.l Get a camping stove with fuel.l Keep a small cooler with frozen gel packs handy for packing refrigerated
items.l Check prescription medicines - obtain at least 10 days to 2 weeks supply.. Stock up on extra batteries for radios, flashlights and lanterns.l Prepare to store and secure outdoor lawn furniture and other loose, light-
weight objects, such as garbage cans, garden tools, potted plants, etc.l Check and replenish first-aid supplies.. Have an extra supply of cash on hand.
When a Hurricane Warning is issued
l Closely monitor radio, TV, NOAA Weather Radio, or hurricane hotline tele-phone numbers for official bulletins.
l Follow instructions issued by local officials. Leave immediately if orderedto do so.
l Complete preparation activities, such as putting up storm shutters, storingloose objects, etc.
l Evacuate areas that might be affected by storm surge flooding.l If evacuating, leave early (if possible, in daylight).l Leave mobile homes in any case.l Notify neighbors and a family member outside of the warned area of your
evacuation plans.
57
I’
II

Evacuation
Plan to evacuate if you:
. live in a mobile home. Do not stay in a mobile home under any circum-stances. They are unsafe in high wind and/or hurricane conditions, no mat-ter how well fastened to the ground.
. live on the coastline or on an offshore island, or live near a river or in aflood plain.
. live in a high rise. Hurricane winds are stronger at higher elevations. Glassdoors and windows may be blown out of their casings and weaken thestructure.
l stay with friends or relatives or at low-rise inland hotels or motels outsidethe flood zones. Leave early to avoid heavy traffic, roads blocked by earlyflood waters, and bridges impassible due to high winds.
. put food and water out for pets if you cannot take them with you. Publicshelters do not allow pets, nor do most motels/hotels.
. hurricane shelters will be available for people who have no other place togo. Shelters may be crowded and uncomfortable, with no privacy and noelectricity. Do not leave your home for a shelter until government offr-cials announce on radio and/or television that a particular shelter is open.
What to bring to a shelter:
. First aid kit; medicine; baby food and diapers; cards, games, books; toilet-ries; battery-powered radio; flashlight (per person); extra batteries; blan-kets or sleeping bags; identification, valuable papers (insurance), and cash.
If staying in a home:
. Reminder! Only stay in a home if you have not been ordered to leave. Ifyou ARE told to leave, do so immediately!
. Store water - Fill sterilized jugs and bottles with water for a two week sup-ply of drinking water. Fill bathtub and large containers with water for sani-tary purposes.
. Turn refrigerator to maximum cold and open only when necessary.
58
l Turn off utilities if told to do so by authorities. Turn off propane tanks. Un-plug small appliances.
l Stay inside a well constructed building. In structures, such as a home, ex-amine the building and plan in advance what you will do if winds becomestrong. Strong winds can produce deadly missiles and structural failure.If winds become strong:
l Stay away from windows and doors, even if they are covered. Take refugein small interior room, closet, or hallway. Take a battery-powered radio, aNOAA Weather Radio, and flashlight with you to your place of refuge.
l Close all interior doors. Secure and brace external doors, particularly doubleinward opening doors and garage doors.
l If you are in a two-story house, go to an interior first-floor room or base-ment, such as a bathroom, closet or under the stairs.
l If you are in a multiple story building and away from the water, go to thefirst or second floors and take refuge in the halls or other interior rooms,away from windows. Interior stairwells and the areas around elevator shaftsare generally the strongest part of a building.
l Lie on the floor under tables or other sturdy objects.l Be alert for tornadoes which often are spawned by hurricanes.
If the “EYE” of the hurricane should pass over your area, be aware thatthe improved weather conditions are temporary. The storm conditionswill return with winds coming from the opposite direction, sometimesin a period of just a few minutes or as long as an hour.
AFTER the storm passes:
l Stay in your protected area until announcements are made on the radio ortelevision that the dangerous winds have passed.
l If you have evacuated, do not return home until officials announce yourarea is ready. Remember, proof of residency may be required in order tore-enter evacuation areas.
l If your home or building has structural damage, do not enter until it ischecked by officials.
l Avoid using candles and other open flames indoors.l Beware of outdoor hazards - Avoid downed power lines and any water in
which they may be lying. Be alert for poisonous snakes, often driven fromtheir dens by high water. Beware of weakened bridges and washed out
59
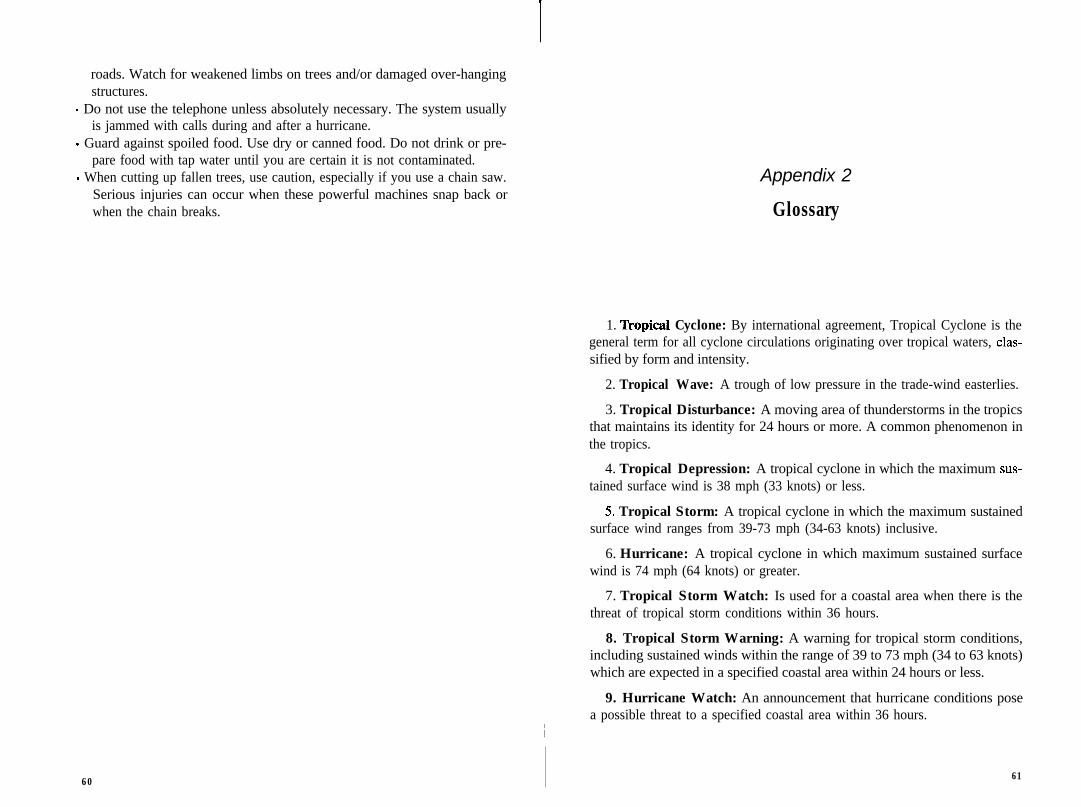
roads. Watch for weakened limbs on trees and/or damaged over-hangingstructures.
. Do not use the telephone unless absolutely necessary. The system usuallyis jammed with calls during and after a hurricane.
. Guard against spoiled food. Use dry or canned food. Do not drink or pre-pare food with tap water until you are certain it is not contaminated.
. When cutting up fallen trees, use caution, especially if you use a chain saw.Serious injuries can occur when these powerful machines snap back orwhen the chain breaks.
60 61
Appendix 2
Glossary
1. Tropical Cyclone: By international agreement, Tropical Cyclone is thegeneral term for all cyclone circulations originating over tropical waters, clas-sified by form and intensity.
2. Tropical Wave: A trough of low pressure in the trade-wind easterlies.
3. Tropical Disturbance: A moving area of thunderstorms in the tropicsthat maintains its identity for 24 hours or more. A common phenomenon inthe tropics.
4. Tropical Depression: A tropical cyclone in which the maximum sus-tained surface wind is 38 mph (33 knots) or less.
5. Tropical Storm: A tropical cyclone in which the maximum sustainedsurface wind ranges from 39-73 mph (34-63 knots) inclusive.
6. Hurricane: A tropical cyclone in which maximum sustained surfacewind is 74 mph (64 knots) or greater.
7. Tropical Storm Watch: Is used for a coastal area when there is thethreat of tropical storm conditions within 36 hours.
8. Tropical Storm Warning: A warning for tropical storm conditions,including sustained winds within the range of 39 to 73 mph (34 to 63 knots)which are expected in a specified coastal area within 24 hours or less.
9. Hurricane Watch: An announcement that hurricane conditions posea possible threat to a specified coastal area within 36 hours.
I
il

10. Hurricane Warning: A warning that sustained winds of 74 mph (64knots) or higher are expected in a specified coastal area within 24 hours orless.
11. Storm Surge: An abnormal rise of the sea along a shore as the re-sult, primarily, of the winds of a storm.
12. Flash Flood Watch: Means that flash flood conditions are possiblewithin the designated watch area - be alert.
References
13. Flash Flood Warning: Means a flash Rood has been reported or isimminent - take immediate action.
14. Small Craft Cautionary Statements: When a tropical cyclone threat-ens a coastal area, small craft operators are advised to remain in port or notto venture into the open sea.
Anon., 1926. Tropical Hurricane Spreads Disasters Along East Coast, Melbourne Jour-nal, Melbourne, Florida, July 27, 1926.
Anon., 1928. Northern Extremity of Tropical Hurricane Sweeps through Melbourne,Melbourne Times-Journal, Melbourne Florida, August 10, 1928.
Antonini, G.A., P.W. Box, E. Brady, M. Clarke, H.R. Ledesma, and J.L. Rahn. 1993.Location and Assessment of Hurricane Andrew Damaged Vessels on Biscayne Bayand Adjoining Shores. Florida Sea Grant College Program, Gainesville, FL 58 pp.
Bigelow, F.H., 1898. Features of Hurricanes (Originally published in Yearbook of theDepartment of Agriculture for 1898). Quoted In: West Indian Hurricanes by E.B.Garriott, Weather Bureau, Washington, D.C., 69 pp + tracking charts.
Clark, R.C. 1986a. The Impact of Hurricane Elena and TS Juan on Coastal Construc-tion in Florida. Beaches and Shores Post-Storm Report 85-3. Department of NaturalResources, Division of Beaches and Shores, State of Florida, Tallahassee, 142 pp.
Clark, R.C. 1986b. Hurricane Kate - Beaches and Shores Post-Storm Report 86- 1. De-partment of Natural Resources, Division of Beaches and Shores, State of Florida, Tal-lahassee, 114 pp.
Dunn, G.E. and B.I. Miller. 1964. Atlantic Hurricanes. Louisiana State University Press,Baton Rouge, 377 pp.
Dunn, G.E. and Staff 1967. Florida Hurricanes. Technical Memorandum WBTM SR-38, Environmental Sciences Services Administration, National Hurricane Center, CoralGables, Florida.
Frank, N., 1978. Hurricanes in Brevard County, Florida Toduy, Melbourne, Florida, Sun-day, June 4,1978.
Garriot, E.B., 1900. West Indian Hurricanes. Weather Bureau, Washington, D.C.Gray, W. M., 1990. Strong Association Between West African Rainfall and U.S. Land-
fall of Intense Hurricanes. Science, Volume 249, pp . 125 1-1256.
6362

Hebert, P.J., J.D. Jarrell, and M. Mayfield. 1995. The Deadliest, Costliest, and MostIntense United States Hurricanes of this Century (and other frequently requested hur-ricane facts). NOAA Technical Memorandum NWS NHC-3 1, National Oceanic andAtmospheric Administration, National Weather Service, National Hurricane Center,Coral Gables, Florida, 40 pp.
Holmes, G. W. 1876. Letter to a friend: F. A. Hopwood, Personal collection, Melbourne,Florida, 1985
National Climatic Center. 1954-1979. North Atlantic Tropical Cyclones Series (1954-1979). Climatological Data, National Summary Volumes, National Climatic Center,Asheville, North Carolina, each year paginated.
National Oceanic and Atmospheric Administration (NOAA), 1970-1979. ClimatologicalData, National Summary, Volume 21-30. No. 13 National Climatic Center, Asheville,North Carolina, unpaginated.
NOAA, 1982. Some Devastating North Atlantic Hurricanes of the 20th Century. U. S.Department of Commerce, NOAA, Washington, D.C., 14 pp.
NOAA, 1987. Tropical Cyclones of the North Atlantic Ocean, 1871- 1986. HistoricalClimatology Series 6-2, National Climatic Center, Asheville, North Carolina, 186 pp.
NOAA, 1993. “Hurricanes” A Familiarization Booklet, Revised April 1983, NOAA PA91001, National Oceanic and Atmospheric Administration, National Hurricane Cen-ter, Coral Gables, Florida, 36 pp.
Norton, G. 1949. Florida Hurricanes. Rev. ed. U.S. Weather Bureau Publication, Wash-ington, D.C., 6 pp. (Originally Florida Hurricanes by R.W. Gray, Monthly WeatherReview, Vol. 61, no. 1 [January 19331.)
Rabat, G. 1986. The City of Cocoa Beach, the First Sixty Years. Apollo Books, Winona,Minnesota, Page vii.
Simpson, R.H. and H. Riehl. 1981. The Hurricane and Its Impact. Louisiana State Uni-versity Press, Baton Rouge and London, 399 pp.
Sugg, A.L. 1966. The Hurricane Season of 1965. Monthly Weather Review, Volume 94,No. 3, pp. 183-191.
Sugg, A.L., L.G. Pardue, and R.L. Carrodus. 1971. Memorable Hurricanes of the UnitedStates since 1873. NOAA Technical Memorandum NWS SR-56, National Oceanicand Atmospheric Administration, National Weather Service, Southern Region, FortWorth, Texas, 52 pp.
Tannehill, I. R. 1938. Hurricanes, their Nature and History. Princeton University Press,Princeton, New Jersey, 304 pp.
U.S. Army Corps of Engineers. 1993. Hurricane Andrew Storm Summary and Impactson the Beachs of Florida, Special Report. Jacksonville District, Florida, 61 pp. plusseveral appendices.
U.S. Weather Bureau, Monthly and Annual Reports, 1897-1965. Climatological Data,Florida, April 1897-December 1965. National Climatic Center, Asheville, North Caro-lina, microfiche 112 fiche.
Yanaros, J., 1986. Personal Communication. Damage Caused by Hurricane in Ft. Pierce,1933, Melbourne, Florida.
Internet Addresses
http://gnv.ifas.ufl.edu/-seaweb/homepage/fsg.htm
http://nhc-hp3.nhc.noaa.gov/index.html
http://sunmlb.nws.fit.edu
http://www/ssec.wisc.edu
http://www.cnn.com/WEATHER/storm.center/storms.html
http://cirrus.sprl.umich.edu/wxnet/tropical.html
http://www.fit.edu/-jmwillia/hurricanes
http://typhoon.atmos.colostate.edu/
http://www.weather.com/
http://www.storm96.com/index.html
http://www.aer.corn/hurricane/hurricanes_95.html
http://www.met.fsu.edu/explores/tropical.html
http://rs560.cl.msu.edu./weather/
64


Table 2. The table below is presented here for reference only. It was used to classifyintensities of hurricanes through about 1970 and was replaced by the Saffir/SimpsonScale. (Adapted from Dunn and Miller, 1964)
Hurricane Classification in Use Prior to 1970
Hurricane Intensity Maximum Winds(mph)
Minimum CentralPressure (inches)
Minor 74 29.40Minimal 75-100 29.03-29.39Major’ 101-135 28.01-29.02Extreme* 136 28.00
Major Hurricane: A hurricane with winds 111 mph or more also referred to as aCategory 3 or higher hurricane as classified by the Saffir/Simpson Scale. Priorto 1970, this description was used.
Extreme Hurricane: An extreme hurricane, also called a “Great” hurricane, is ahurricane of great intensity (winds 125 mph or more) and great size (diameter ofhurricane wind 100 miles or more) and other factors such as minimum pressure,storm tides, destruction, and fatalities (Gray as revised by Norton, 1949). Theterm “Great Hurricane” was used to classify storms through 1970 and is not usedany more today. Norton (1949) classified 10 hurricanes as “Great” between 1880and 1948; they are listed below:
August 1880: Palm Beach - Lake OkeechobeeJune 1886: Apalachicola - TallahasseeOctober 1890: Key West - Fort MyersJuly 1916: Pensacola - MobileSeptember 1919: Key WestSeptember 1926: Miami - PensacolaSeptember 1928: Palm Beach - Lake OkeechobeeSeptember 1935: Great Labor Day Hurricane, Florida KeysOctober 1944: Key West - Tampa - JacksonvilleSeptember 1947: Ft. Lauderdale - Ft. Myers
Table 3. Number of hurricanes, tropical storms, and combined total storms by lo-year periods.
Average Hurricanes Tropical Storms Combined
1871-18801881-18901891-19001901-19101911-19201921-19301931-19401941-19501951-19601961-19701971-19801981-19901991-1996
TOTAL 7 4 7 9 184
11 118 116 49 45 13
12 83 108 33 13 86 6
21”21*2 2191013182013114
1112
*Includes 31 tropical cyclones of unknown intensity occurring between 1871 and1890.
68 69