Analysis of Flowback Water from Marcellus...
47
1 The world leader in serving science Analysis of Flowback Water from Marcellus Unconventional Gas Extraction Using IC and ICP-OES Richard Jack, Tetiana Kondratyuk, and John Stolz PITTCON ™ Conference & Expo March 3, 2014 OT70968_E 03/14
Transcript of Analysis of Flowback Water from Marcellus...
1
The world leader in serving science
Analysis of Flowback Water from Marcellus Unconventional Gas Extraction Using IC and ICP-OES
Richard Jack, Tetiana Kondratyuk, and John Stolz
PITTCON™ Conference & Expo
March 3, 2014
OT70968_E 03/14
2
Hydraulic Fracturing
• Method of extracting energy resources from unconventional
reservoirs, such as coalbeds, shales, and tight sands.
• Pressurized injection of a cocktail of water, chemical
additives, and proppants into geological formations, thereby
fracturing the formation and facilitating the recovery of natural
gas.
• After the fracturing event, the pressure is decreased and the
direction of fluid flow is reversed, allowing fracturing fluid and
naturally occurring substances to flow out of the well bore to
the surface. This mixture of fluids is called flowback.
• The hydraulic fracturing process mobilizes salts, metals, and
radioisotopes from the subsurface and returns hypersaline
flowback water to the surface.
3
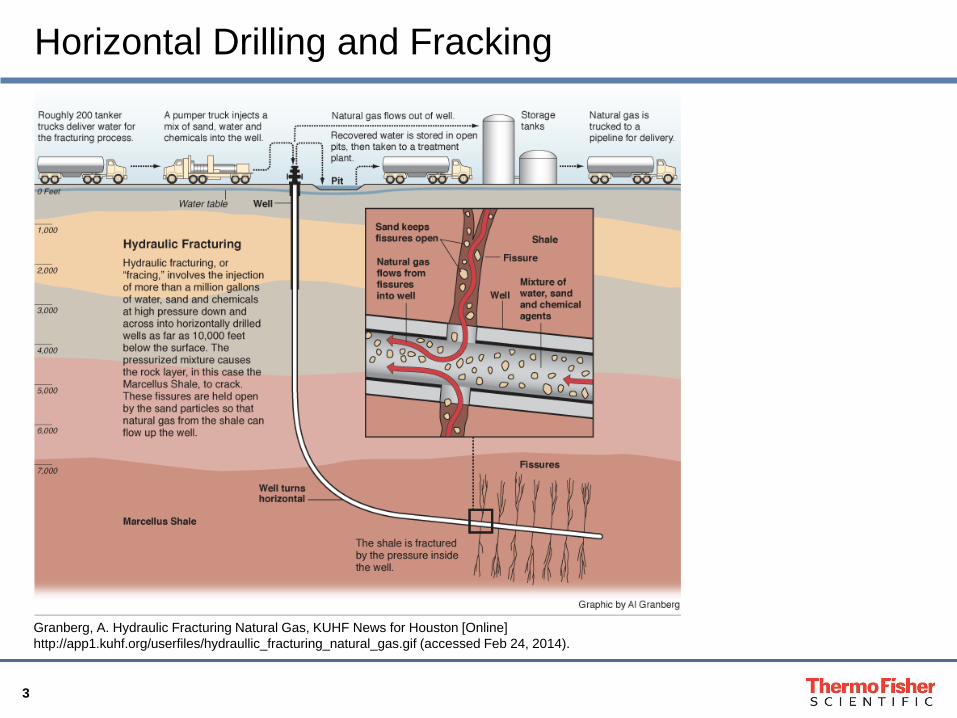
Granberg, A. Hydraulic Fracturing Natural Gas, KUHF News for Houston [Online]
http://app1.kuhf.org/userfiles/hydraullic_fracturing_natural_gas.gif (accessed Feb 24, 2014).
Horizontal Drilling and Fracking
4
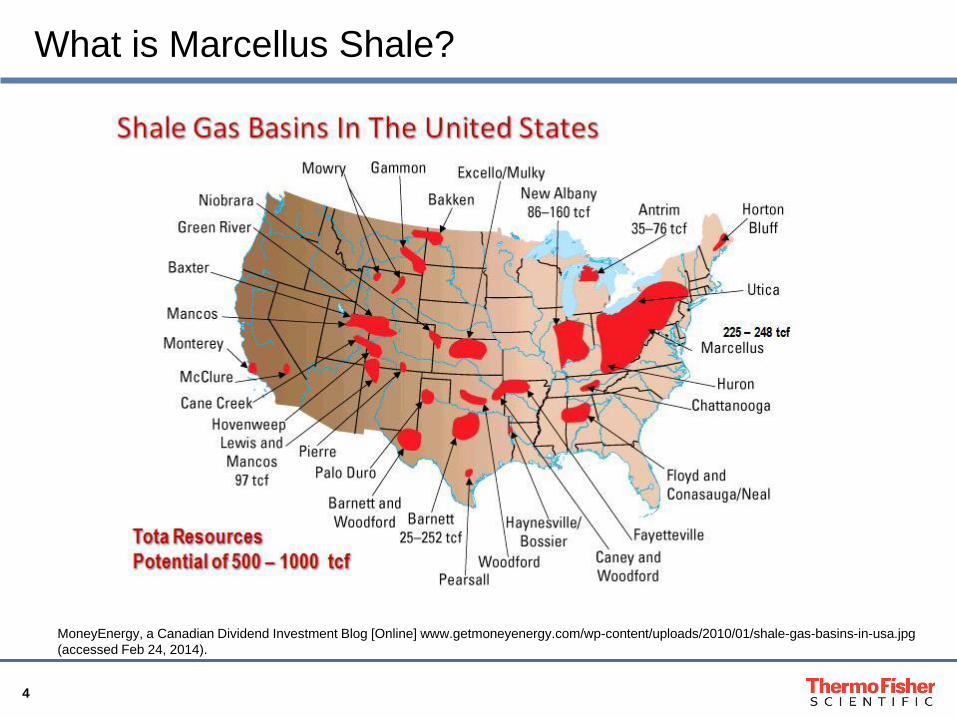
What is Marcellus Shale?
MoneyEnergy, a Canadian Dividend Investment Blog [Online] www.getmoneyenergy.com/wp-content/uploads/2010/01/shale-gas-basins-in-usa.jpg
(accessed Feb 24, 2014).
5
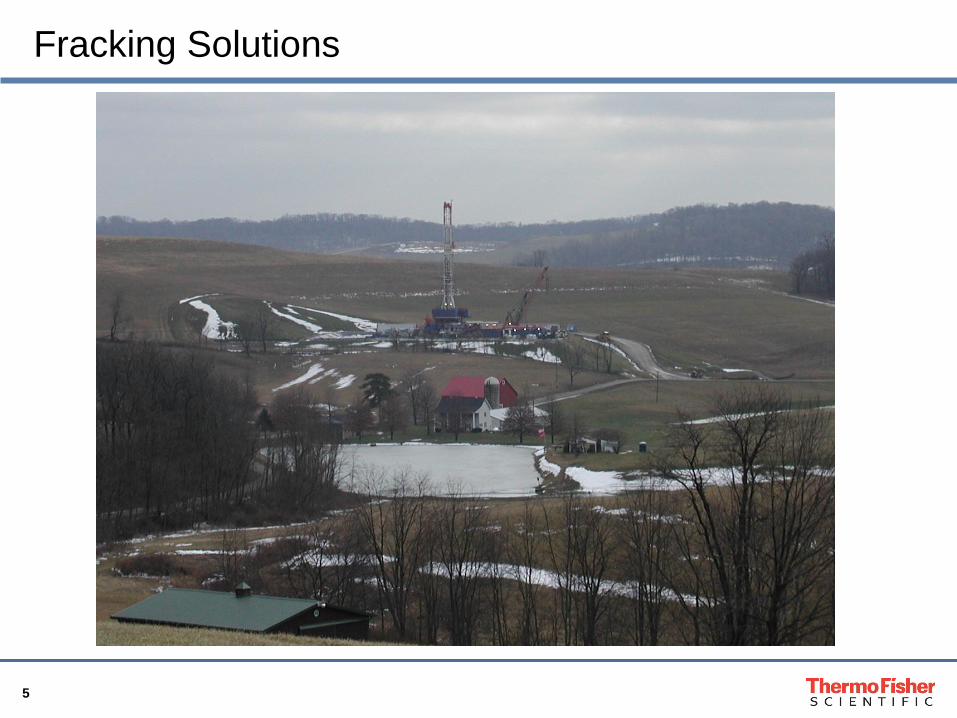
Fracking Solutions
6
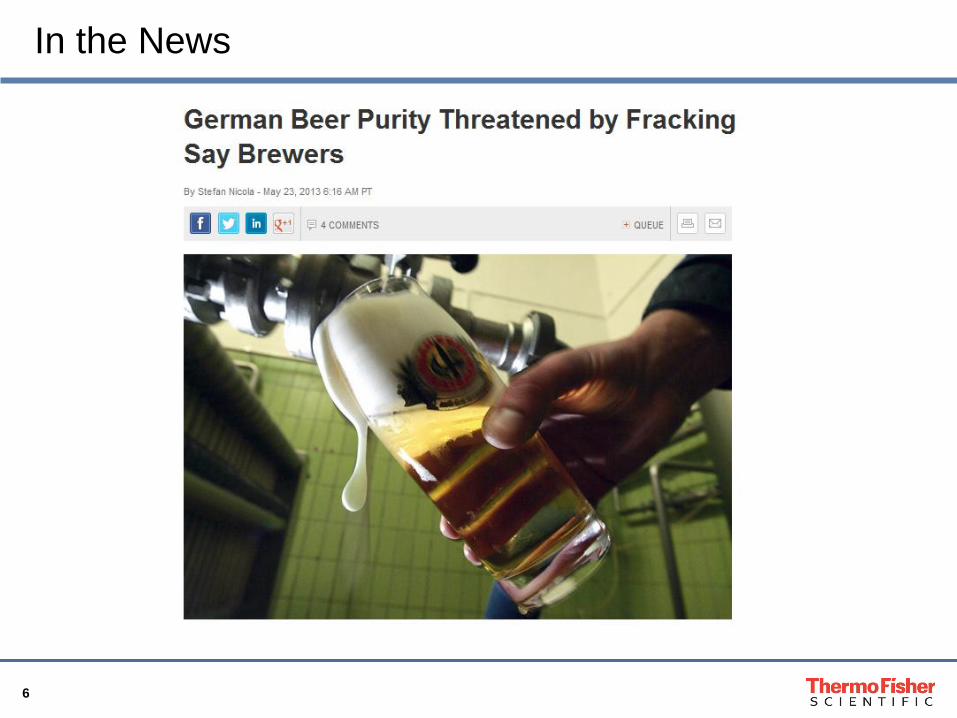
In the News
7
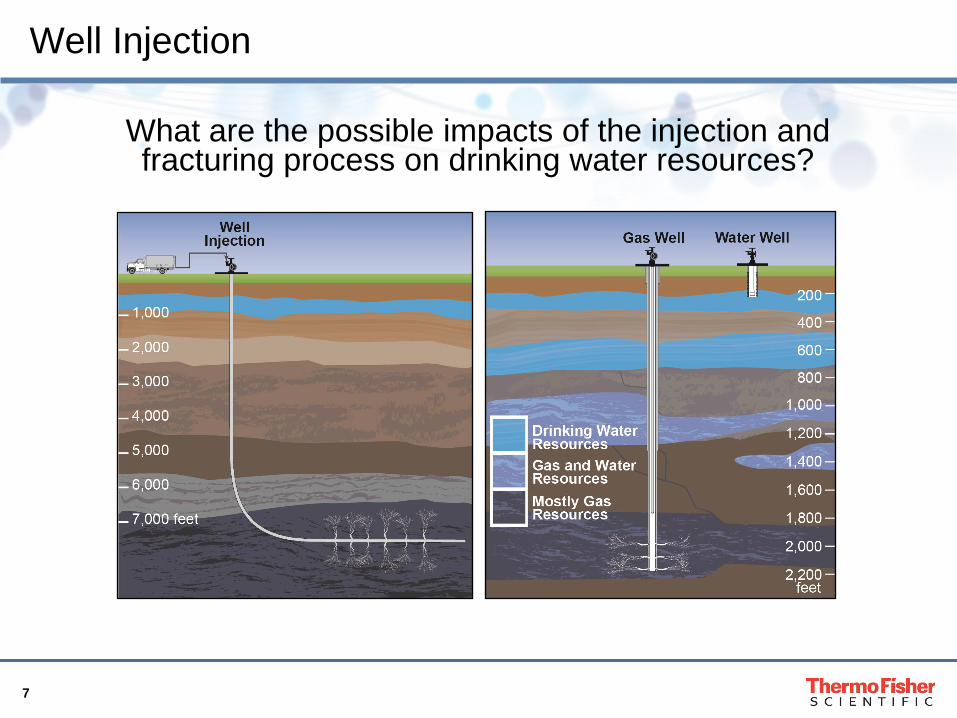
Well Injection
What are the possible impacts of the injection and fracturing process on drinking water resources?
8
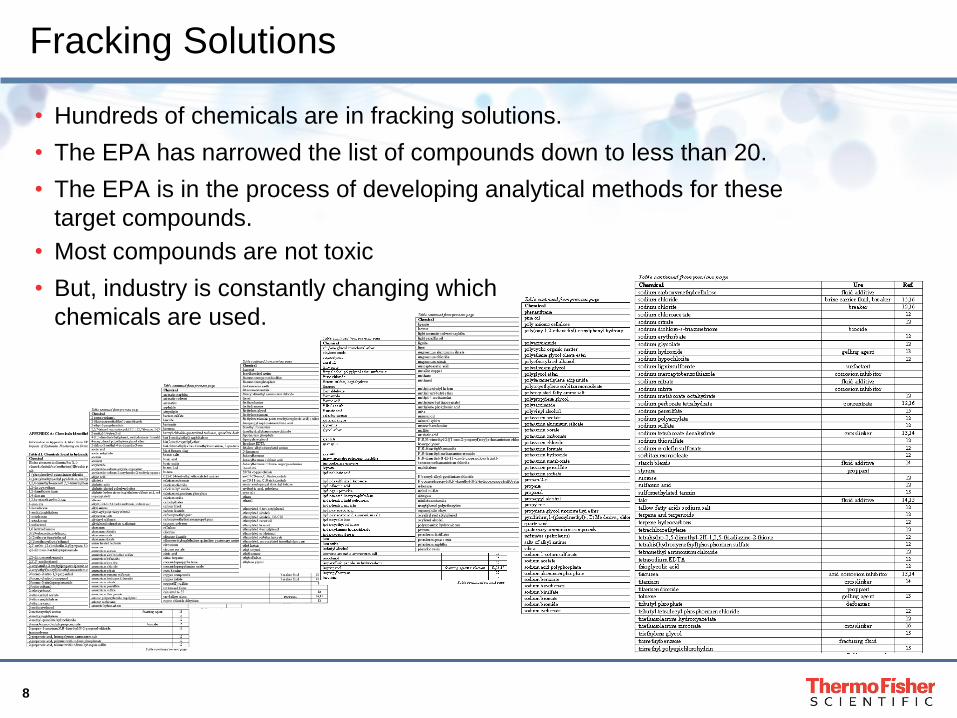
• Hundreds of chemicals are in fracking solutions.
• The EPA has narrowed the list of compounds down to less than 20.
• The EPA is in the process of developing analytical methods for these
target compounds.
• Most compounds are not toxic
• But, industry is constantly changing which
chemicals are used.
Fracking Solutions
9
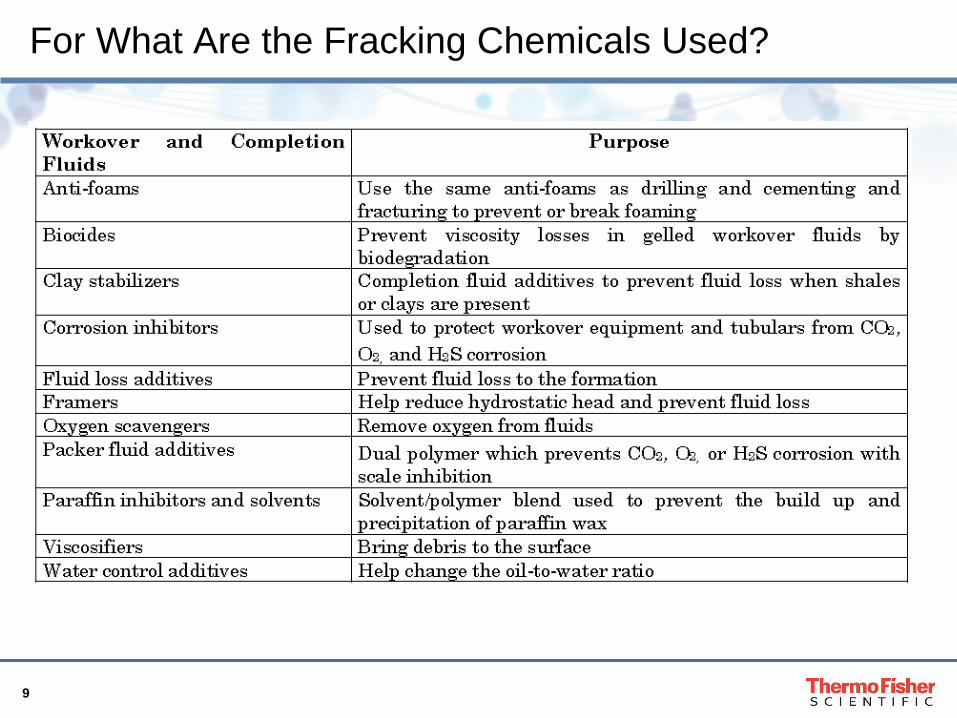
For What Are the Fracking Chemicals Used?

10
Injection Fluids
Flowback and
Produced Water
Glycols, Ethoxylated Alcohols, Alcohols, Alcohol Amines,
Amides, Aldehydes, Aromatic Hydrocarbons, Inorganic
Elements, Radionuclides, Halogens
Glycols, Ethoxylated Alcohols, Alcohols, Alcohol Amines,
Amides, Aldehydes, Aromatic Hydrocarbons
Water Use in Hydraulic
Fracturing Operations
EPA Overview of Analytical Method Research
11
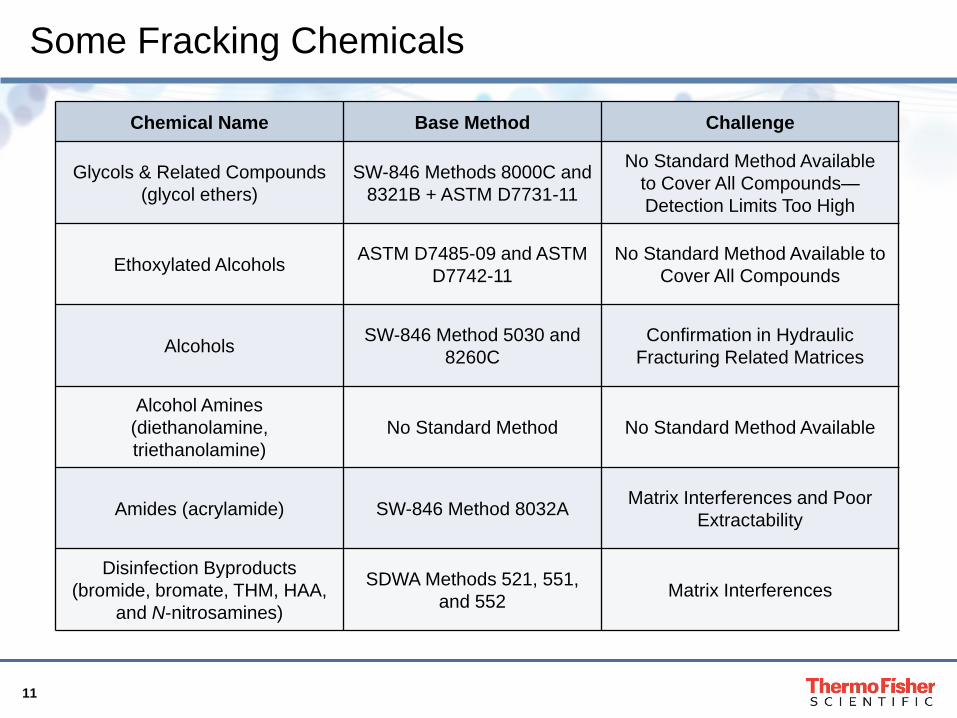
Chemical Name Base Method Challenge
Glycols & Related Compounds
(glycol ethers)
SW-846 Methods 8000C and
8321B + ASTM D7731-11
No Standard Method Available
to Cover All Compounds—
Detection Limits Too High
Ethoxylated Alcohols ASTM D7485-09 and ASTM
D7742-11
No Standard Method Available to
Cover All Compounds
Alcohols SW-846 Method 5030 and
8260C
Confirmation in Hydraulic
Fracturing Related Matrices
Alcohol Amines
(diethanolamine,
triethanolamine)
No Standard Method No Standard Method Available
Amides (acrylamide) SW-846 Method 8032A Matrix Interferences and Poor
Extractability
Disinfection Byproducts
(bromide, bromate, THM, HAA,
and N-nitrosamines)
SDWA Methods 521, 551,
and 552 Matrix Interferences
Some Fracking Chemicals
12
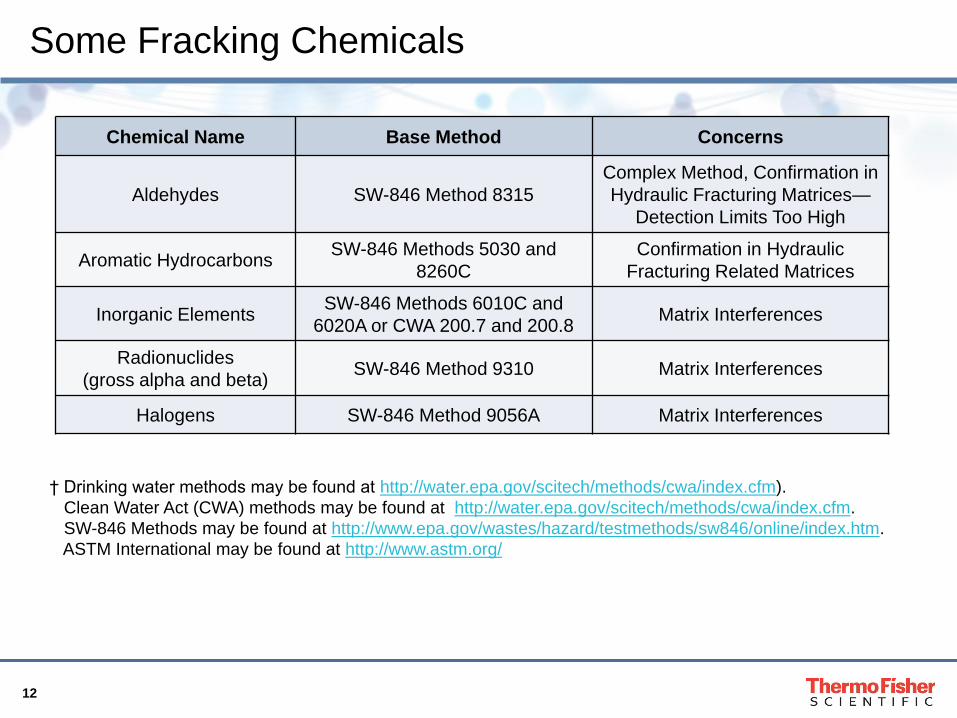
Chemical Name Base Method Concerns
Aldehydes SW-846 Method 8315
Complex Method, Confirmation in
Hydraulic Fracturing Matrices—
Detection Limits Too High
Aromatic Hydrocarbons SW-846 Methods 5030 and
8260C
Confirmation in Hydraulic
Fracturing Related Matrices
Inorganic Elements SW-846 Methods 6010C and
6020A or CWA 200.7 and 200.8 Matrix Interferences
Radionuclides
(gross alpha and beta) SW-846 Method 9310 Matrix Interferences
Halogens SW-846 Method 9056A Matrix Interferences
† Drinking water methods may be found at http://water.epa.gov/scitech/methods/cwa/index.cfm).
Clean Water Act (CWA) methods may be found at http://water.epa.gov/scitech/methods/cwa/index.cfm.
SW-846 Methods may be found at http://www.epa.gov/wastes/hazard/testmethods/sw846/online/index.htm.
ASTM International may be found at http://www.astm.org/
Some Fracking Chemicals
13
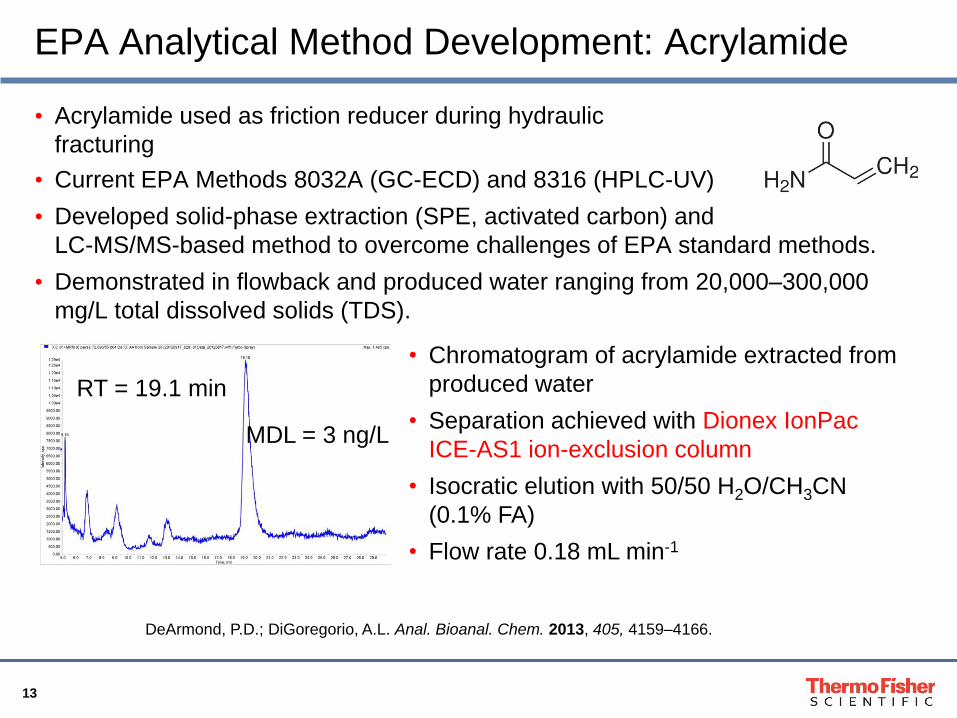
• Acrylamide used as friction reducer during hydraulic
fracturing
DeArmond, P.D.; DiGoregorio, A.L. Anal. Bioanal. Chem. 2013, 405, 4159–4166.
• Chromatogram of acrylamide extracted from
produced water
• Separation achieved with Dionex IonPac
ICE-AS1 ion-exclusion column
• Isocratic elution with 50/50 H2O/CH3CN
(0.1% FA)
• Flow rate 0.18 mL min-1
RT = 19.1 min
MDL = 3 ng/L
EPA Analytical Method Development: Acrylamide
• Current EPA Methods 8032A (GC-ECD) and 8316 (HPLC-UV)
• Developed solid-phase extraction (SPE, activated carbon) and
LC-MS/MS-based method to overcome challenges of EPA standard methods.
• Demonstrated in flowback and produced water ranging from 20,000–300,000
mg/L total dissolved solids (TDS).
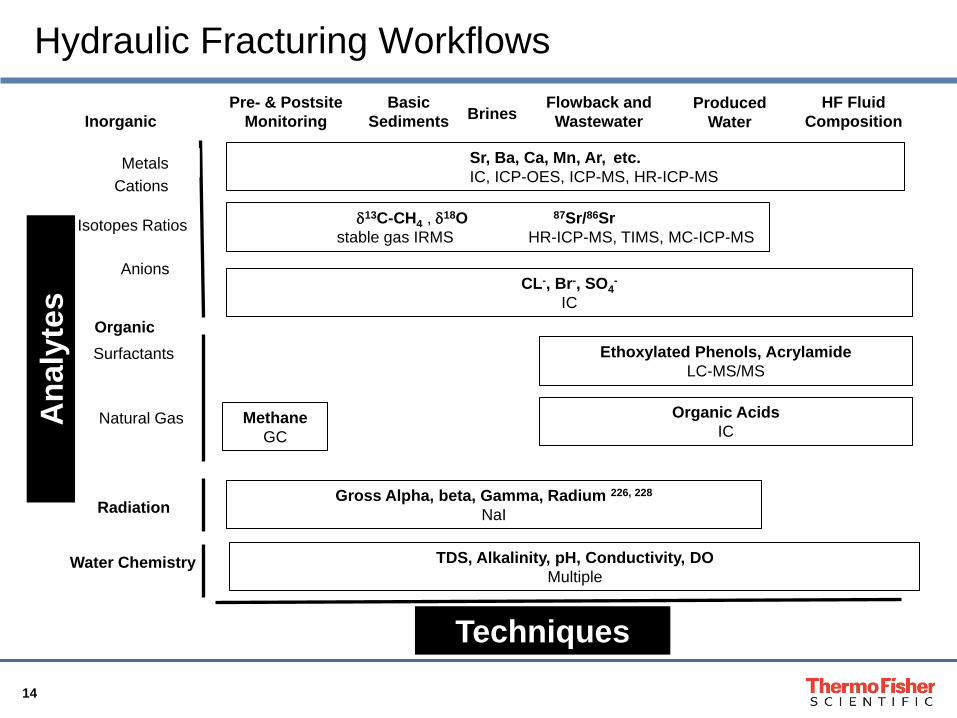
14
Inorganic
Organic
Techniques
Metals
Anions
Surfactants
CL-, Br-, SO4-
IC
Ethoxylated Phenols, Acrylamide
LC-MS/MS
Sr, Ba, Ca, Mn, Ar, etc.
IC, ICP-OES, ICP-MS, HR-ICP-MS Cations
Radiation
Water Chemistry
Basic
Sediments
HF Fluid
Composition
Flowback and
Wastewater Produced
Water
Pre- & Postsite
Monitoring
Natural Gas Methane
GC
Gross Alpha, beta, Gamma, Radium 226, 228
NaI
Isotopes Ratios
Organic Acids
IC
Brines
TDS, Alkalinity, pH, Conductivity, DO
Multiple
13C-CH4 , 18O 87Sr/86Sr
stable gas IRMS HR-ICP-MS, TIMS, MC-ICP-MS
Hydraulic Fracturing Workflows A
naly
tes
15
Aspects of Hydraulic Fracturing for Water Quality
• Constituents in shale gas extracted wastewater, such as total TDS, have been
found to be present at concentrations ranging from 280 mg/l to 345,000 mg/l.
• Chloride has been reported in concentrations up to 196,000 mg/l.
• TDS is not significantly removed by most conventional publicly owned treatment
works (POTW) sytems; therefore, pretreatment of the wastewater would be
required prior to discharge to the POTW. However, very little comprehensive data
have been collected nationwide on TDS treatment capability at POTWs.
• Common constituents of TDS include calcium and magnesium (also a measure of
hardness), phosphates, nitrates, sodium, potassium, sulfates, chloride, and even
barium, cadmium, and copper.
• Individual constituents of TDS may result in:
• POTW process inhibition in activated sludge
• Nitrification, and anaerobic digestion processes
• POTWs may exhibit these process inhibitions from these individual constituents
at concentrations that are several magnitudes lower than the composite TDS
found in shale gas wastewater.
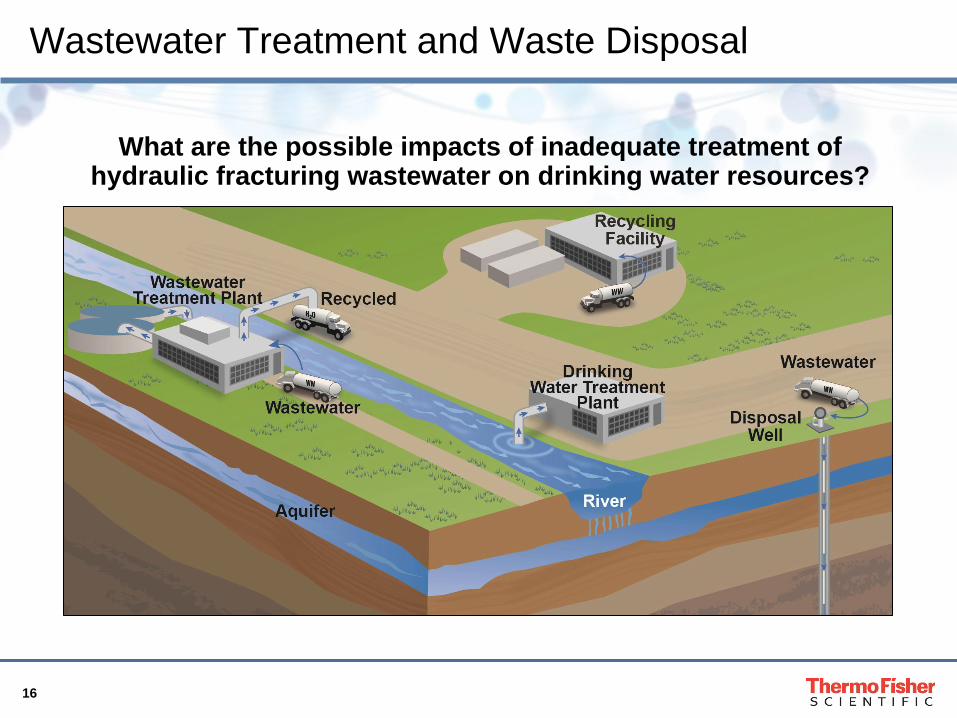
16
What are the possible impacts of inadequate treatment of hydraulic fracturing wastewater on drinking water resources?
Wastewater Treatment and Waste Disposal

17
Environmental Impact of Flowback Waters
• Because there is a significant possibility that shale gas wastewater may:
• Pass through the POTW and cause a permit violation
• Cause interference with the POTW’s operation
• Cause contamination of biosolids
• Acceptance of the waste is not advisable unless it’s effects on the
treatment system are well understood.
• Anions
• Bromide present in source water for drinking water utilities can lead to increased
disinfection byproducts
• Sulfate at 400–1000 mg/L, disrupting anaerobic digestion processes
• Chloride at 180 mg/L, disrupting nitrification processes
• High concentrations of chloride can disrupt biological treatment units
• Cations and Metals
• Toxicity
• Metals can precipitate (scaling) during the treatment process
• Contaminate biosolids and affect sludge disposal in landfills and farms.
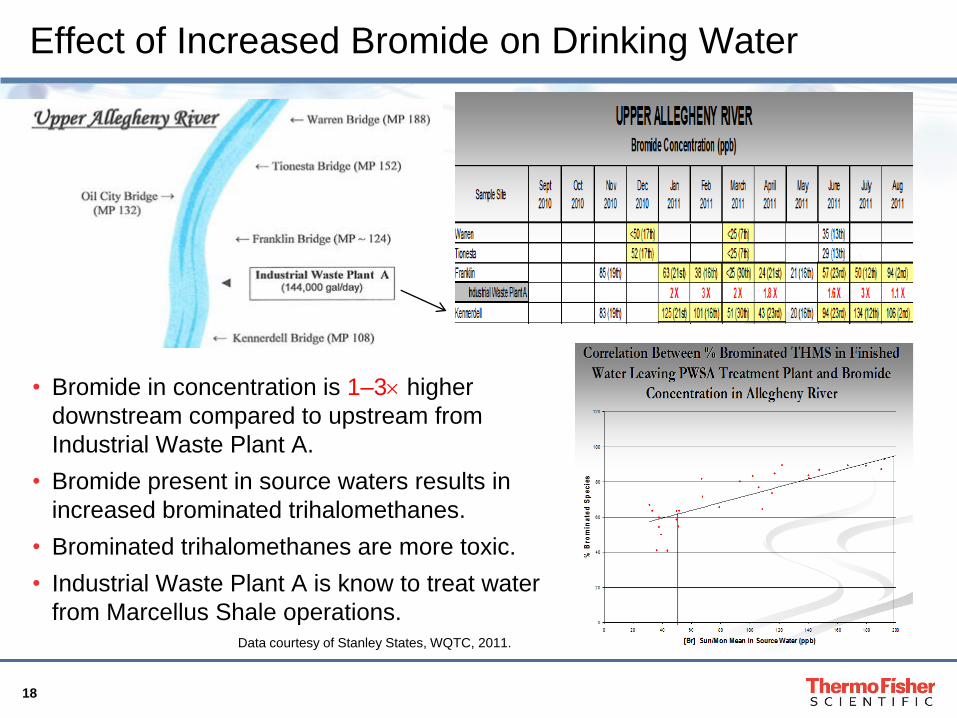
18
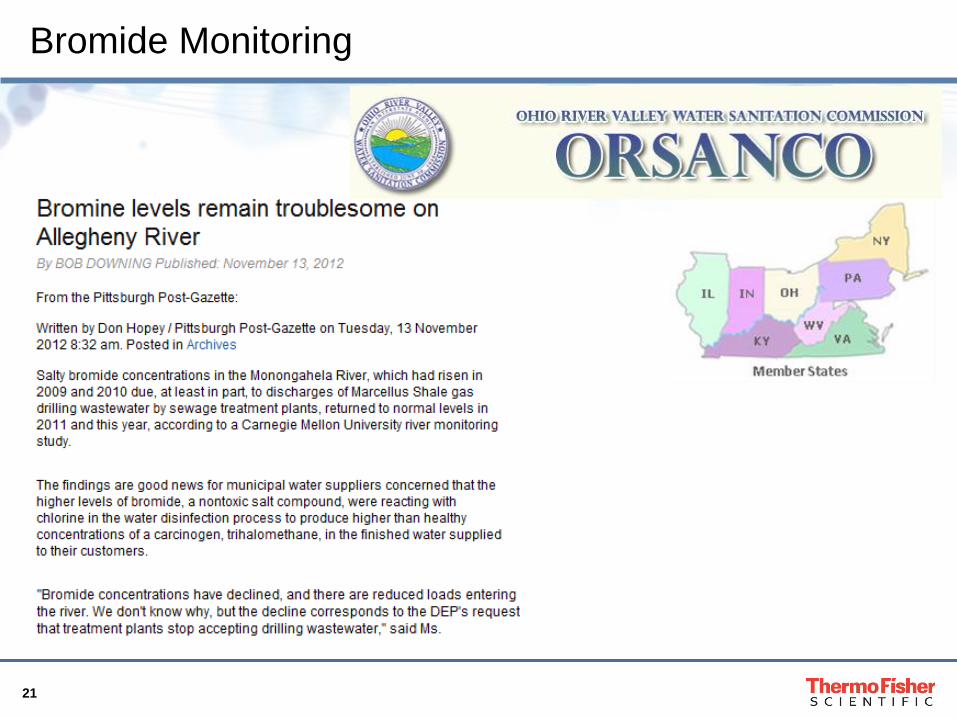
Effect of Increased Bromide on Drinking Water
• Bromide in concentration is 1–3 higher
downstream compared to upstream from
Industrial Waste Plant A.
• Bromide present in source waters results in
increased brominated trihalomethanes.
• Brominated trihalomethanes are more toxic.
• Industrial Waste Plant A is know to treat water
from Marcellus Shale operations. Data courtesy of Stanley States, WQTC, 2011.
19
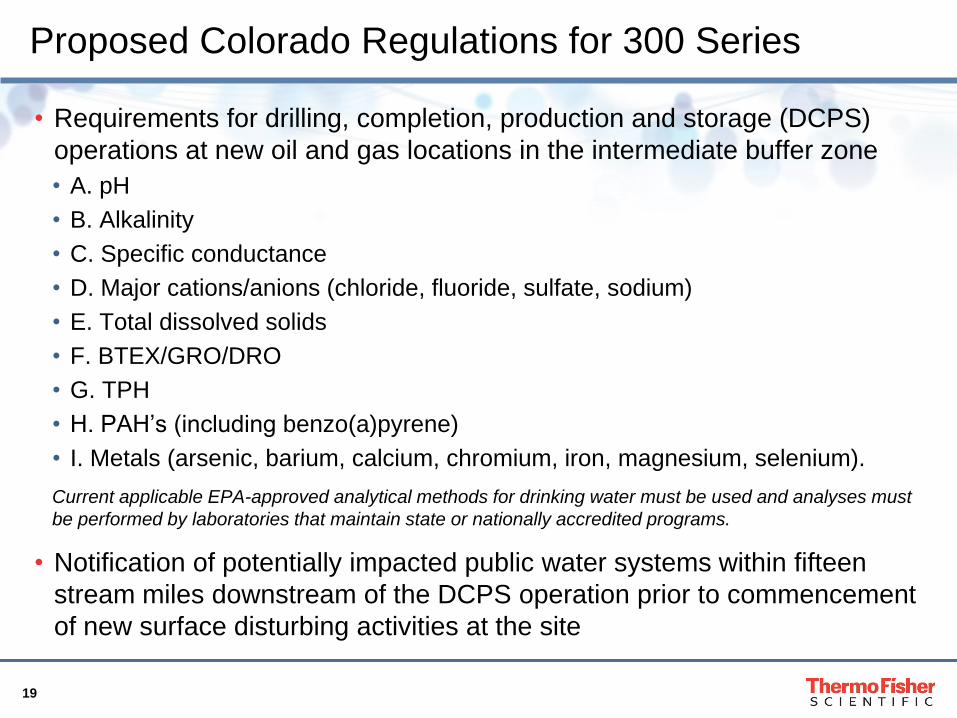
Proposed Colorado Regulations for 300 Series
• Requirements for drilling, completion, production and storage (DCPS)
operations at new oil and gas locations in the intermediate buffer zone
• A. pH
• B. Alkalinity
• C. Specific conductance
• D. Major cations/anions (chloride, fluoride, sulfate, sodium)
• E. Total dissolved solids
• F. BTEX/GRO/DRO
• G. TPH
• H. PAH’s (including benzo(a)pyrene)
• I. Metals (arsenic, barium, calcium, chromium, iron, magnesium, selenium).
Current applicable EPA-approved analytical methods for drinking water must be used and analyses must
be performed by laboratories that maintain state or nationally accredited programs.
• Notification of potentially impacted public water systems within fifteen
stream miles downstream of the DCPS operation prior to commencement
of new surface disturbing activities at the site
20
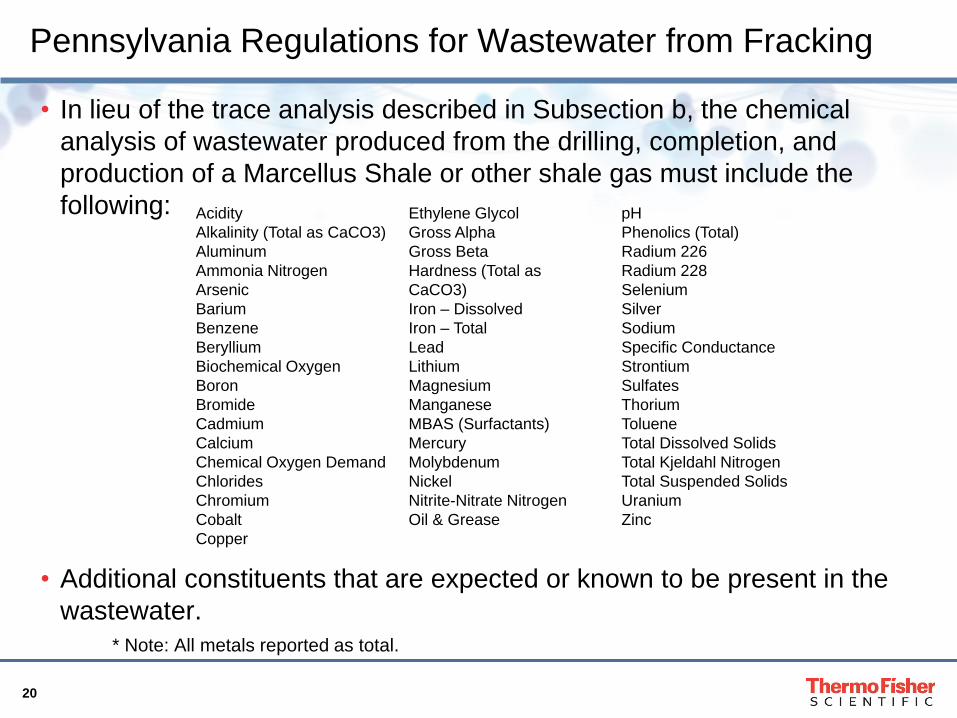
Pennsylvania Regulations for Wastewater from Fracking
• In lieu of the trace analysis described in Subsection b, the chemical
analysis of wastewater produced from the drilling, completion, and
production of a Marcellus Shale or other shale gas must include the
following:
• Additional constituents that are expected or known to be present in the
wastewater.
* Note: All metals reported as total.
Acidity
Alkalinity (Total as CaCO3)
Aluminum
Ammonia Nitrogen
Arsenic
Barium
Benzene
Beryllium
Biochemical Oxygen
Boron
Bromide
Cadmium
Calcium
Chemical Oxygen Demand
Chlorides
Chromium
Cobalt
Copper
Ethylene Glycol
Gross Alpha
Gross Beta
Hardness (Total as
CaCO3)
Iron – Dissolved
Iron – Total
Lead
Lithium
Magnesium
Manganese
MBAS (Surfactants)
Mercury
Molybdenum
Nickel
Nitrite-Nitrate Nitrogen
Oil & Grease
pH
Phenolics (Total)
Radium 226
Radium 228
Selenium
Silver
Sodium
Specific Conductance
Strontium
Sulfates
Thorium
Toluene
Total Dissolved Solids
Total Kjeldahl Nitrogen
Total Suspended Solids
Uranium
Zinc
21
Bromide Monitoring
22
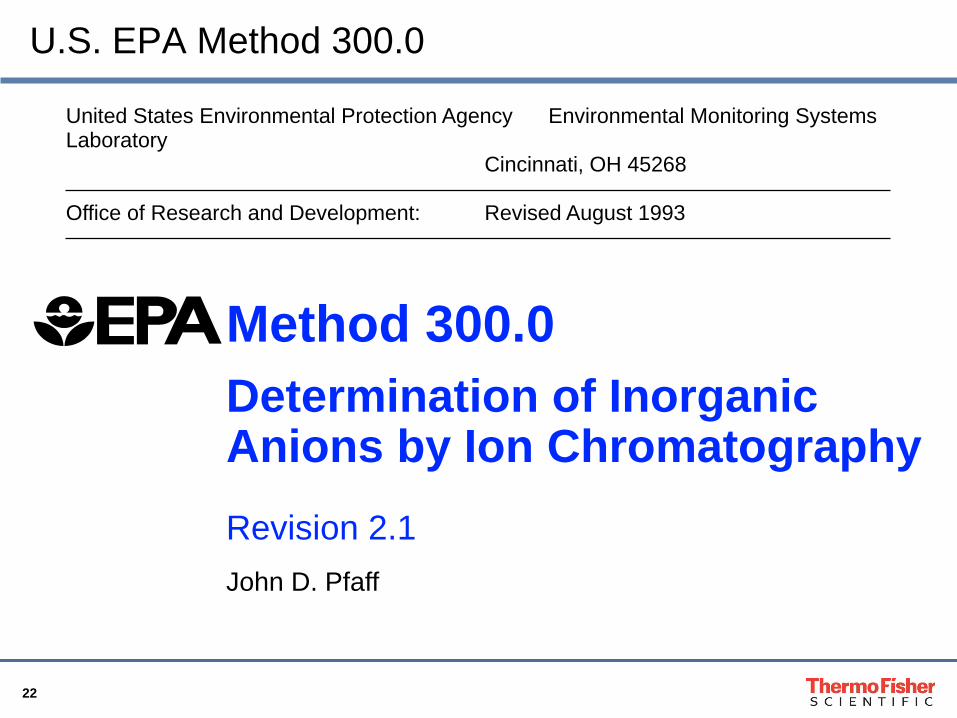
United States Environmental Protection Agency Environmental Monitoring Systems Laboratory Cincinnati, OH 45268 Office of Research and Development: Revised August 1993
Method 300.0
Determination of Inorganic Anions by Ion Chromatography Revision 2.1
John D. Pfaff
U.S. EPA Method 300.0
23
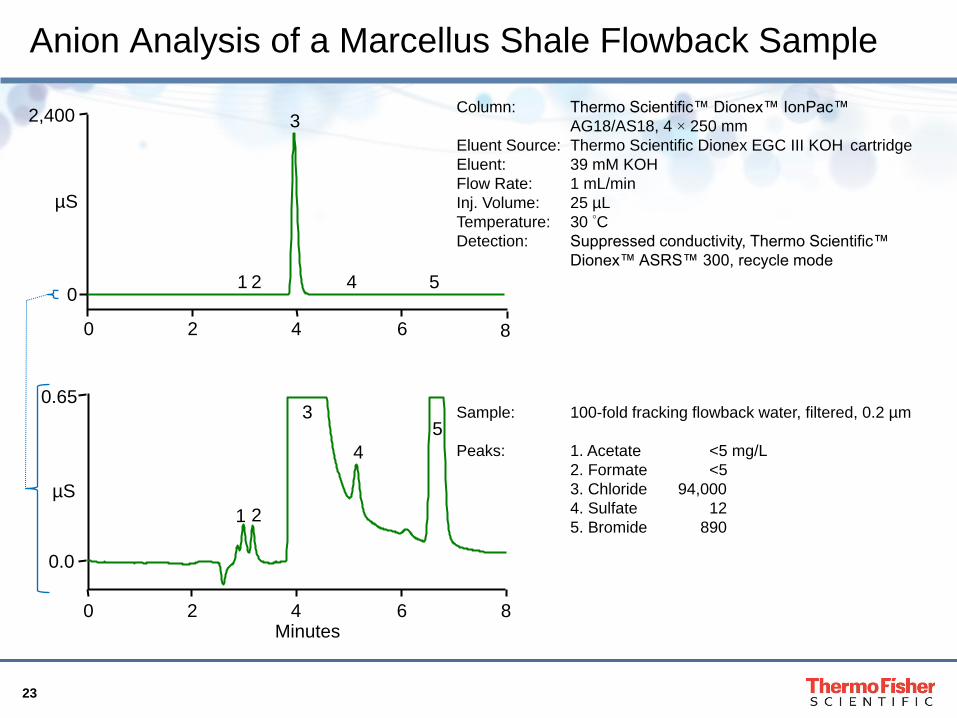
Anion Analysis of a Marcellus Shale Flowback Sample
0.0
0.65
µS
Minutes
0 2 4 8
0
2,400
µS
3 Column: Thermo Scientific™ Dionex™ IonPac™
AG18/AS18, 4 × 250 mm
Eluent Source: Thermo Scientific Dionex EGC III KOH cartridge
Eluent: 39 mM KOH
Flow Rate: 1 mL/min
Inj. Volume: 25 µL
Temperature: 30 °C
Detection: Suppressed conductivity, Thermo Scientific™
Dionex™ ASRS™ 300, recycle mode
1 2
3
4
5
6
0 2 4 8 6
5
4
1 2
Sample: 100-fold fracking flowback water, filtered, 0.2 µm
Peaks: 1. Acetate <5 mg/L
2. Formate <5
3. Chloride 94,000
4. Sulfate 12
5. Bromide 890
24
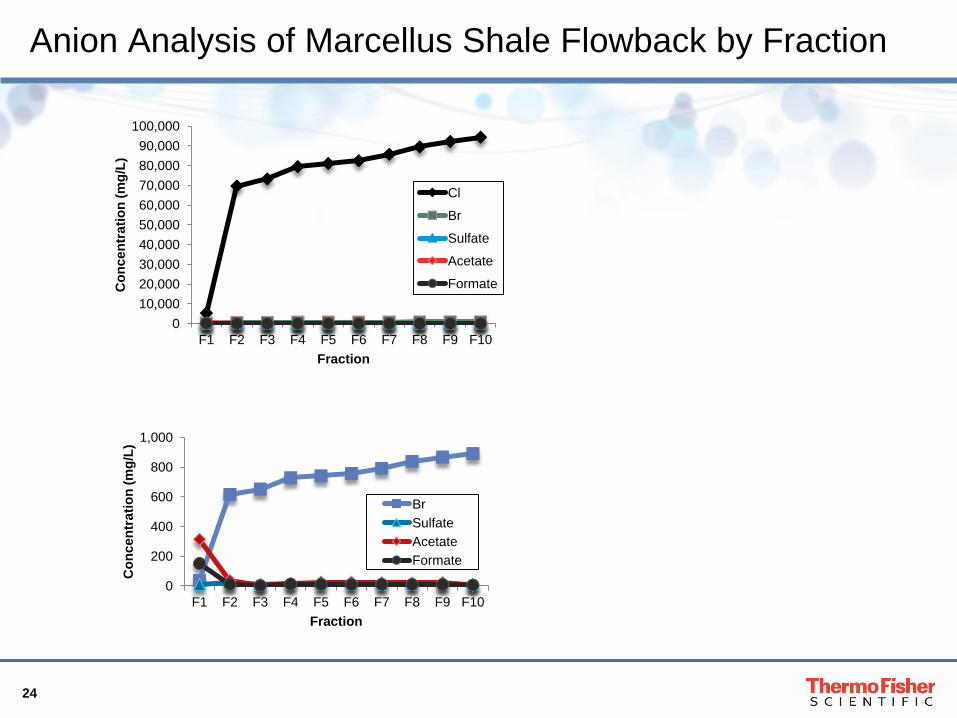
Anion Analysis of Marcellus Shale Flowback by Fraction
0
10,000
20,000
30,000
40,000
50,000
60,000
70,000
80,000
90,000
100,000
F1 F2 F3 F4 F5 F6 F7 F8 F9 F10
Co
nc
en
tra
tio
n (
mg
/L)
Fraction
Cl
Br
Sulfate
Acetate
Formate
0
200
400
600
800
1,000
F1 F2 F3 F4 F5 F6 F7 F8 F9 F10
Co
nc
en
tra
tio
n (
mg
/L)
Fraction
Br
Sulfate
Acetate
Formate
25
ICP-OES
26
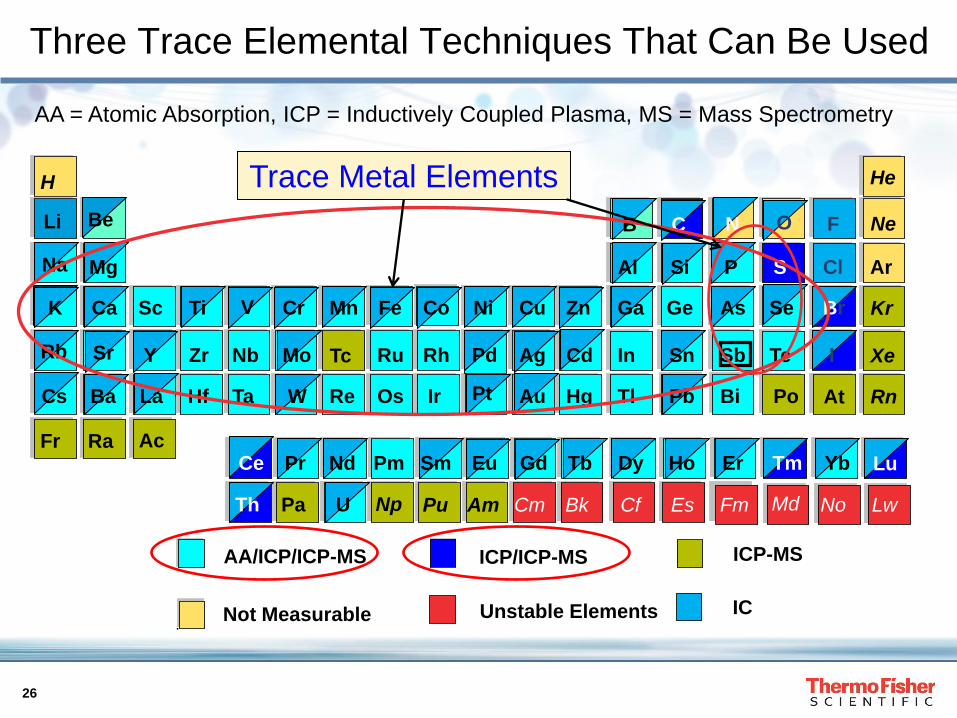
Three Trace Elemental Techniques That Can Be Used
H
Li
Fr Ra
Sc
Ac
Zr
Hf
Nb
Ta
Tc
Re
Ru
Os
Rh
Ir Hg
In
Tl
Ge
Sb
Bi
S
Te
Po
Cl
F
At
He
Ar
Ne
Kr
Xe
Rn
Pa Pu Am Cm Bk Cf Es Fm Md No Lw Np
Not Measurable
ICP-MS
Unstable Elements
AA/ICP/ICP-MS ICP/ICP-MS
IC
Na
K
Rb
Cs
Be
Mg
Ca
Sr
Ba
Y
La
Ti V Cr
Mo
W
Mn Fe Co Ni
Pd
Pt
Cu
Ag
Au
Zn
Cd
Al
Ga
Sn
Pb
B C O N
Br
I
Si P
As Se
Ce Pr
Th
Nd Pm Sm Eu Gd Tb Dy Ho Er Tm Yb Lu
U
Trace Metal Elements
AA = Atomic Absorption, ICP = Inductively Coupled Plasma, MS = Mass Spectrometry
27
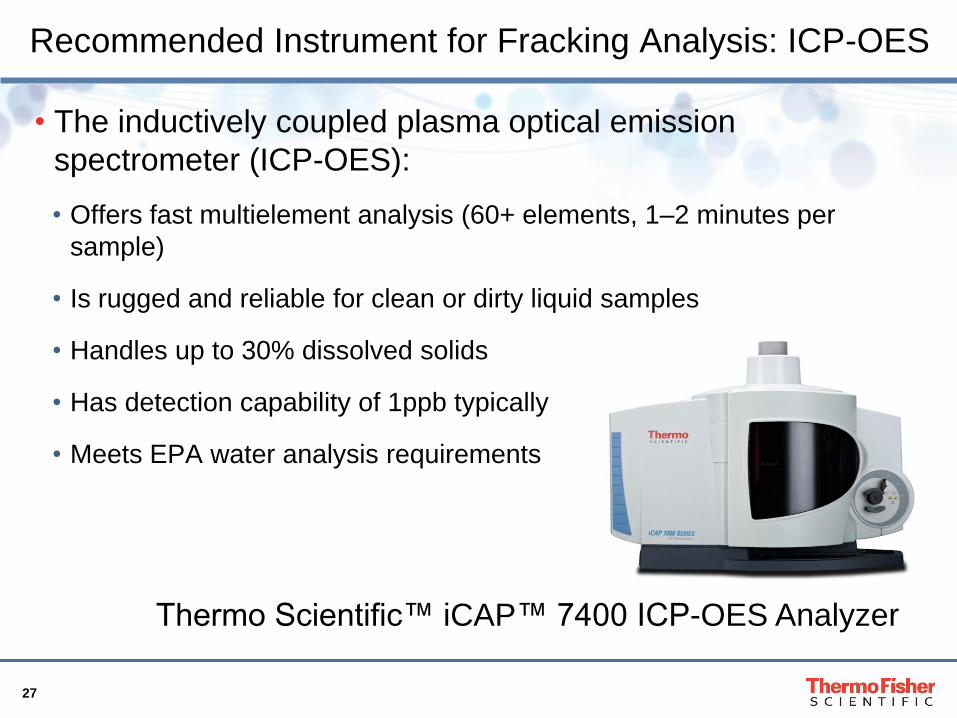
Recommended Instrument for Fracking Analysis: ICP-OES
• The inductively coupled plasma optical emission
spectrometer (ICP-OES):
• Offers fast multielement analysis (60+ elements, 1–2 minutes per
sample)
• Is rugged and reliable for clean or dirty liquid samples
• Handles up to 30% dissolved solids
• Has detection capability of 1ppb typically
• Meets EPA water analysis requirements
Thermo Scientific™ iCAP™ 7400 ICP-OES Analyzer
28
Handling Interferences with ICP-OES
• There are several types of interference in ICP-OES analysis
• Physical Interference
• High concentrations of dissolved solids contained in the sample reduce plasma
processing power for key analytes and cause excessive deposition on sample
introduction components
• Chemical Interference
• High concentrations of easily ionized elements (EIE) cause no linearity
• Spectral Interference
• False backgrounds are created by the sample matrix, i.e., high acid or salts
• Elements in the sample emit optical lines very close to those being measured
• Best Practices to Overcome These Effects
• Carefully pick the emission lines used to avoid many of the interferences
• Reduce the amount of dissolved solids in your sample
• Matrix match your samples, quality controls, and calibration standards, which
compensates for most matrix effects
• Use an internal standard such as Y, Sc, or Ge to compensate for suppression,
any additional matrix effects and drift.
29
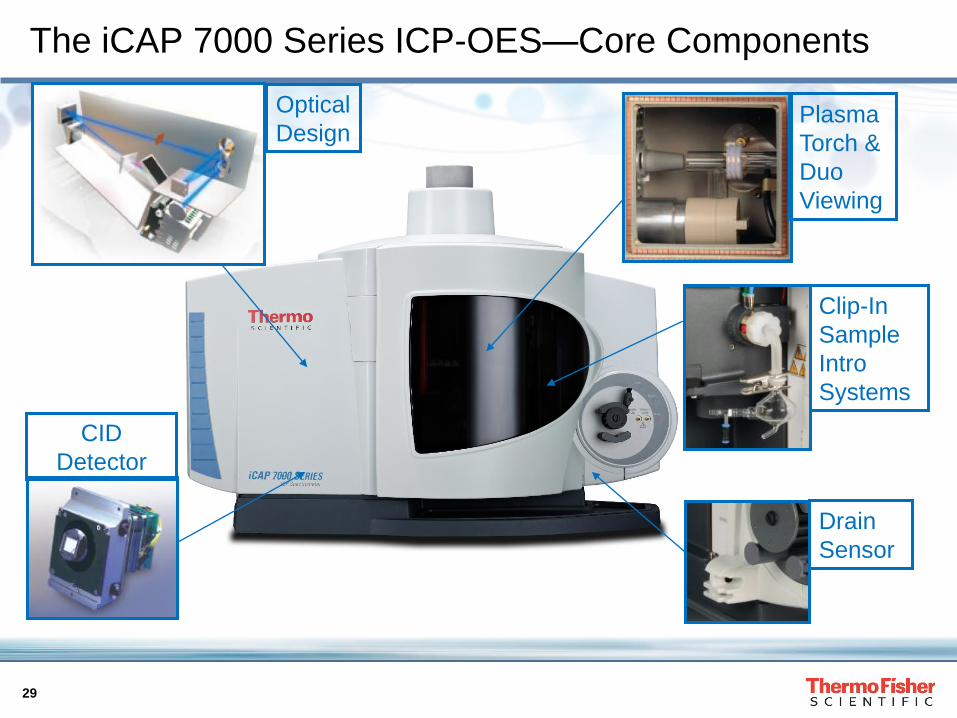
The iCAP 7000 Series ICP-OES—Core Components
Plasma
Torch &
Duo
Viewing
Clip-In
Sample
Intro
Systems
Drain
Sensor
CID
Detector
Optical
Design
30
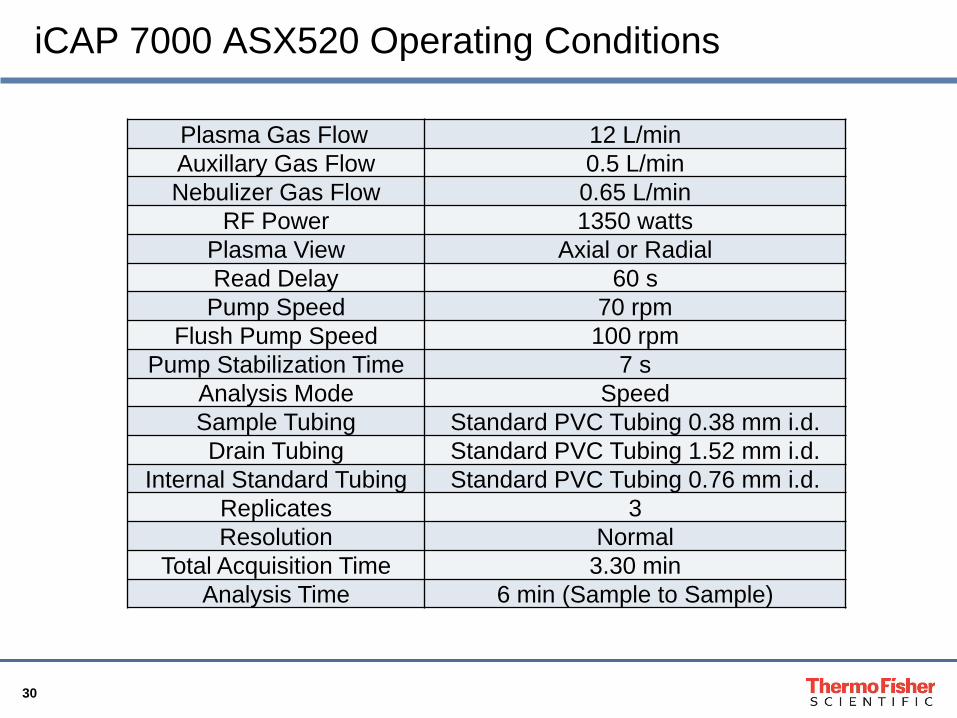
iCAP 7000 ASX520 Operating Conditions
Plasma Gas Flow 12 L/min
Auxillary Gas Flow 0.5 L/min
Nebulizer Gas Flow 0.65 L/min
RF Power 1350 watts
Plasma View Axial or Radial
Read Delay 60 s
Pump Speed 70 rpm
Flush Pump Speed 100 rpm
Pump Stabilization Time 7 s
Analysis Mode Speed
Sample Tubing Standard PVC Tubing 0.38 mm i.d.
Drain Tubing Standard PVC Tubing 1.52 mm i.d.
Internal Standard Tubing Standard PVC Tubing 0.76 mm i.d.
Replicates 3
Resolution Normal
Total Acquisition Time 3.30 min
Analysis Time 6 min (Sample to Sample)
31
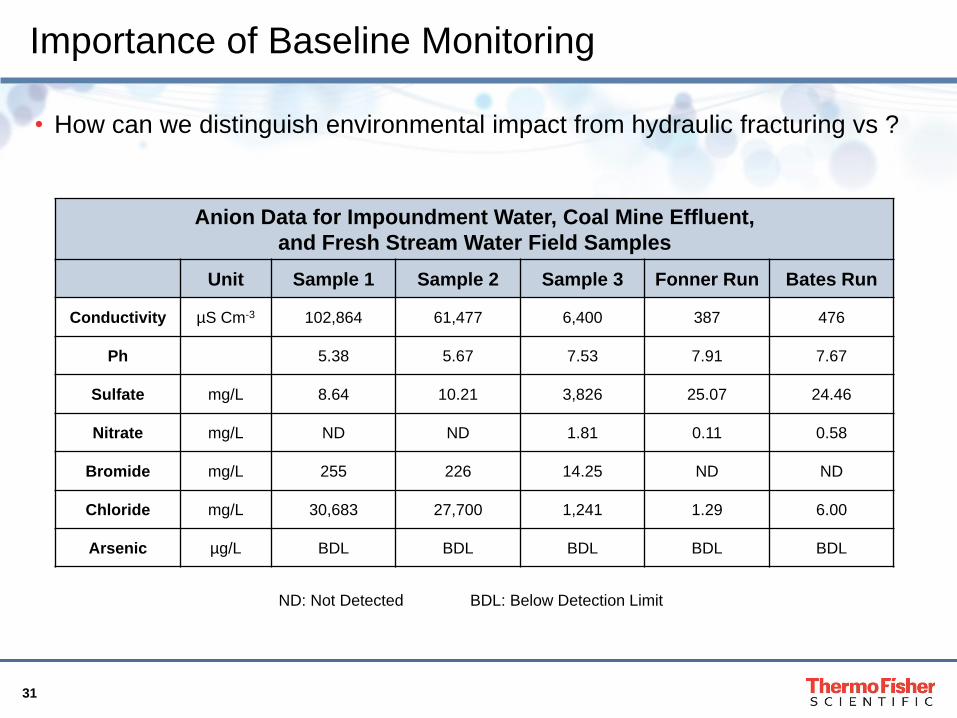
Importance of Baseline Monitoring
• How can we distinguish environmental impact from hydraulic fracturing vs ?
Anion Data for Impoundment Water, Coal Mine Effluent,
and Fresh Stream Water Field Samples
Unit Sample 1 Sample 2 Sample 3 Fonner Run Bates Run
Conductivity µS Cm-3 102,864 61,477 6,400 387 476
Ph 5.38 5.67 7.53 7.91 7.67
Sulfate mg/L 8.64 10.21 3,826 25.07 24.46
Nitrate mg/L ND ND 1.81 0.11 0.58
Bromide mg/L 255 226 14.25 ND ND
Chloride mg/L 30,683 27,700 1,241 1.29 6.00
Arsenic µg/L BDL BDL BDL BDL BDL
ND: Not Detected BDL: Below Detection Limit
32
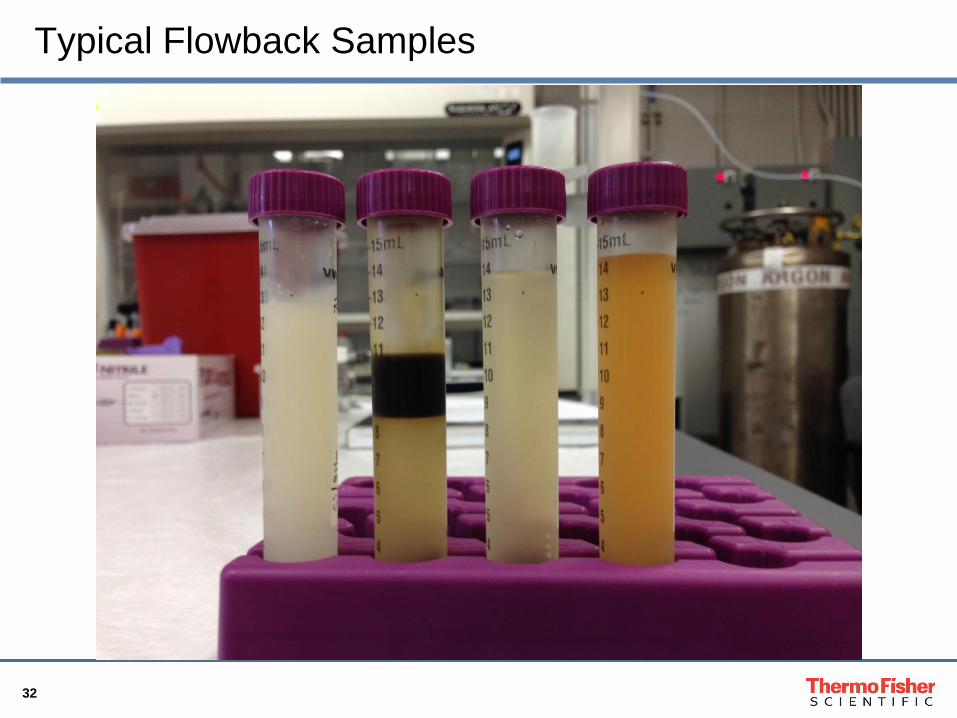
Typical Flowback Samples
33
0.0
10000.0
20000.0
30000.0
40000.0
50000.0
60000.0
70000.0
80000.0
90000.0
0 5 10 15 20 25 30
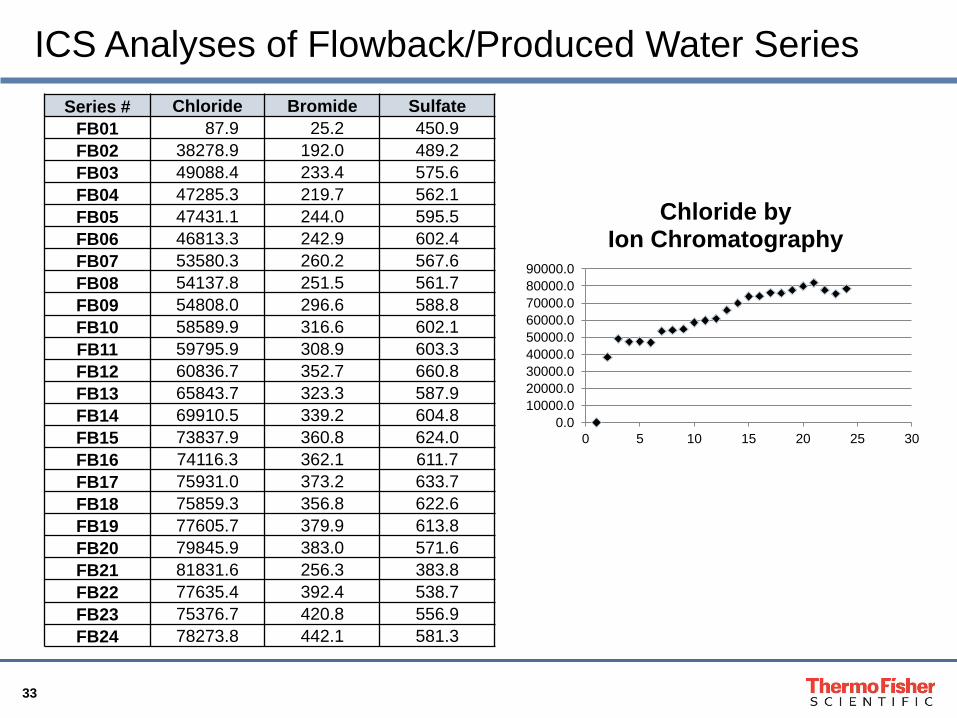
Chloride by Ion Chromatography
ICS Analyses of Flowback/Produced Water Series
Series # Chloride Bromide Sulfate
FB01 87.9 25.2 450.9
FB02 38278.9 192.0 489.2
FB03 49088.4 233.4 575.6
FB04 47285.3 219.7 562.1
FB05 47431.1 244.0 595.5
FB06 46813.3 242.9 602.4
FB07 53580.3 260.2 567.6
FB08 54137.8 251.5 561.7
FB09 54808.0 296.6 588.8
FB10 58589.9 316.6 602.1
FB11 59795.9 308.9 603.3
FB12 60836.7 352.7 660.8
FB13 65843.7 323.3 587.9
FB14 69910.5 339.2 604.8
FB15 73837.9 360.8 624.0
FB16 74116.3 362.1 611.7
FB17 75931.0 373.2 633.7
FB18 75859.3 356.8 622.6
FB19 77605.7 379.9 613.8
FB20 79845.9 383.0 571.6
FB21 81831.6 256.3 383.8
FB22 77635.4 392.4 538.7
FB23 75376.7 420.8 556.9
FB24 78273.8 442.1 581.3
34
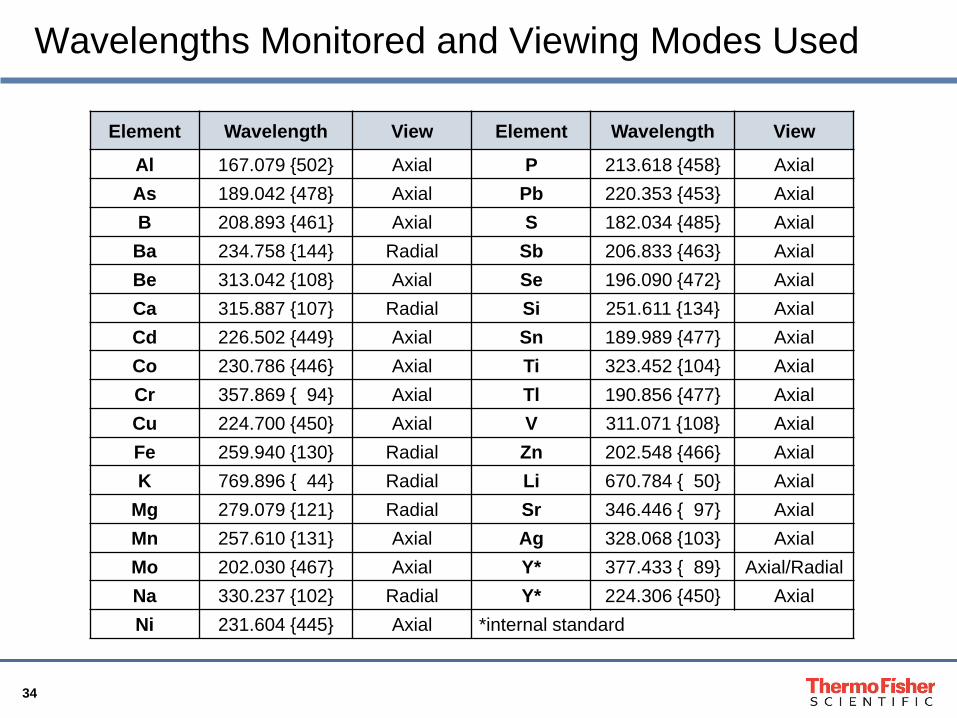
Wavelengths Monitored and Viewing Modes Used
Element Wavelength View Element Wavelength View
Al 167.079 {502} Axial P 213.618 {458} Axial
As 189.042 {478} Axial Pb 220.353 {453} Axial
B 208.893 {461} Axial S 182.034 {485} Axial
Ba 234.758 {144} Radial Sb 206.833 {463} Axial
Be 313.042 {108} Axial Se 196.090 {472} Axial
Ca 315.887 {107} Radial Si 251.611 {134} Axial
Cd 226.502 {449} Axial Sn 189.989 {477} Axial
Co 230.786 {446} Axial Ti 323.452 {104} Axial
Cr 357.869 { 94} Axial Tl 190.856 {477} Axial
Cu 224.700 {450} Axial V 311.071 {108} Axial
Fe 259.940 {130} Radial Zn 202.548 {466} Axial
K 769.896 { 44} Radial Li 670.784 { 50} Axial
Mg 279.079 {121} Radial Sr 346.446 { 97} Axial
Mn 257.610 {131} Axial Ag 328.068 {103} Axial
Mo 202.030 {467} Axial Y* 377.433 { 89} Axial/Radial
Na 330.237 {102} Radial Y* 224.306 {450} Axial
Ni 231.604 {445} Axial *internal standard
35
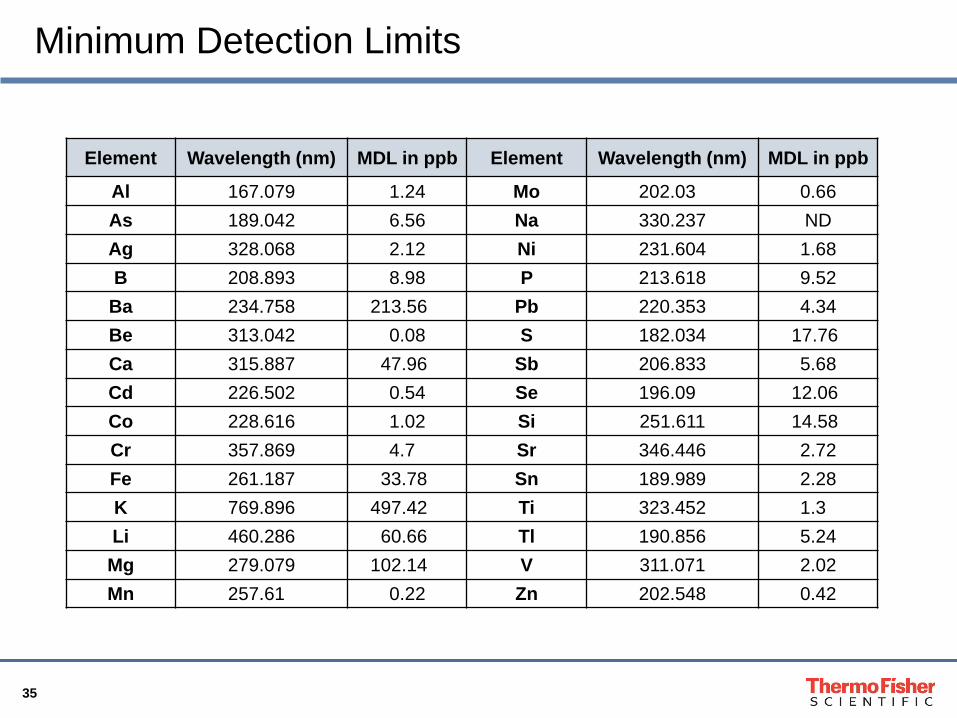
Minimum Detection Limits
Element Wavelength (nm) MDL in ppb Element Wavelength (nm) MDL in ppb
Al 167.079 1.24 Mo 202.030 0.66
As 189.042 6.56 Na 330.237 ND
Ag 328.068 2.12 Ni 231.604 1.68
B 208.893 8.98 P 213.618 9.52
Ba 234.758 213.56 Pb 220.353 4.34
Be 313.042 0.08 S 182.034 17.76
Ca 315.887 47.96 Sb 206.833 5.68
Cd 226.502 0.54 Se 196.090 12.06
Co 228.616 1.02 Si 251.611 14.58
Cr 357.869 4.70 Sr 346.446 2.72
Fe 261.187 33.78 Sn 189.989 2.28
K 769.896 497.42 Ti 323.452 1.30
Li 460.286 60.66 Tl 190.856 5.24
Mg 279.079 102.14 V 311.071 2.02
Mn 257.610 0.22 Zn 202.548 0.42

36
Typical Flowback Samples
37
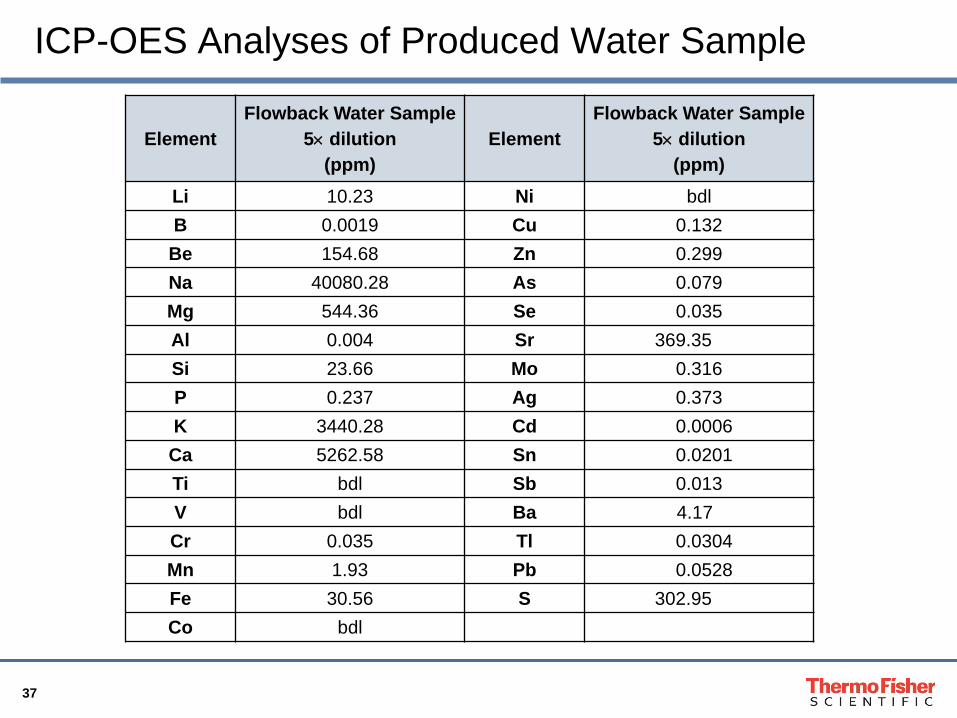
ICP-OES Analyses of Produced Water Sample
Element
Flowback Water Sample
5 dilution
(ppm)
Element
Flowback Water Sample
5 dilution
(ppm)
Li 10.23 Ni bdl
B 0.0019 Cu 0.132
Be 154.68 Zn 0.299
Na 40080.28 As 0.079
Mg 544.36 Se 0.035
Al 0.004 Sr 369.35
Si 23.66 Mo 0.316
P 0.237 Ag 0.373
K 3440.28 Cd 0.0006
Ca 5262.58 Sn 0.0201
Ti bdl Sb 0.013
V bdl Ba 4.17
Cr 0.035 Tl 0.0304
Mn 1.93 Pb 0.0528
Fe 30.56 S 302.95
Co bdl
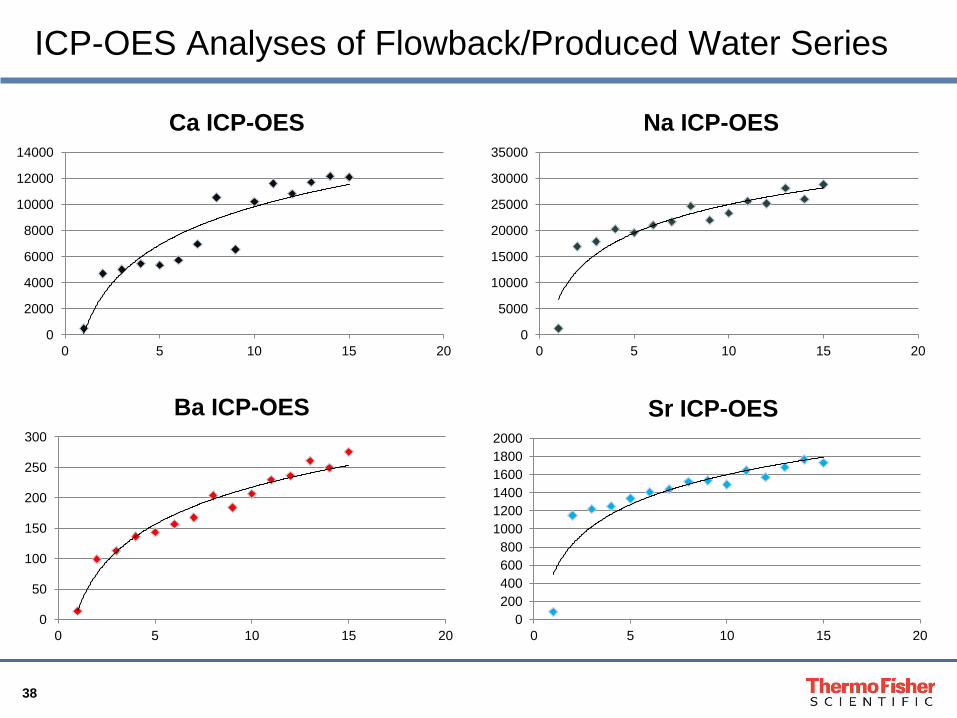
38
0
2000
4000
6000
8000
10000
12000
14000
0 5 10 15 20
Ca ICP-OES
0
50
100
150
200
250
300
0 5 10 15 20
Ba ICP-OES
0
5000
10000
15000
20000
25000
30000
35000
0 5 10 15 20
Na ICP-OES
0
200
400
600
800
1000
1200
1400
1600
1800
2000
0 5 10 15 20
Sr ICP-OES
ICP-OES Analyses of Flowback/Produced Water Series
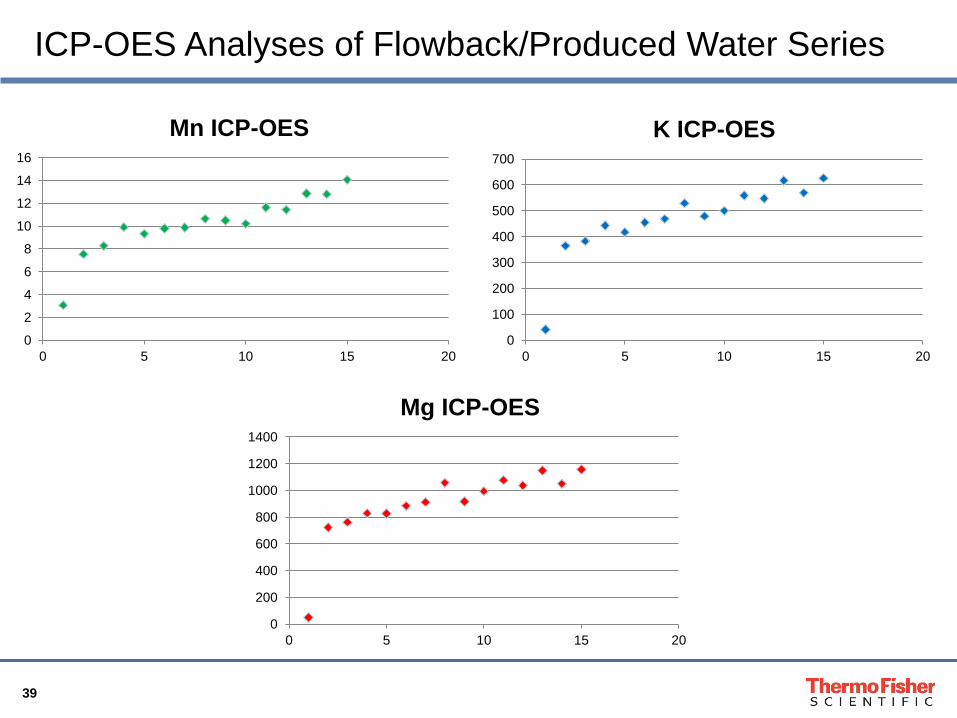
39
0
2
4
6
8
10
12
14
16
0 5 10 15 20
Mn ICP-OES
0
200
400
600
800
1000
1200
1400
0 5 10 15 20
Mg ICP-OES
0
100
200
300
400
500
600
700
0 5 10 15 20
K ICP-OES
ICP-OES Analyses of Flowback/Produced Water Series
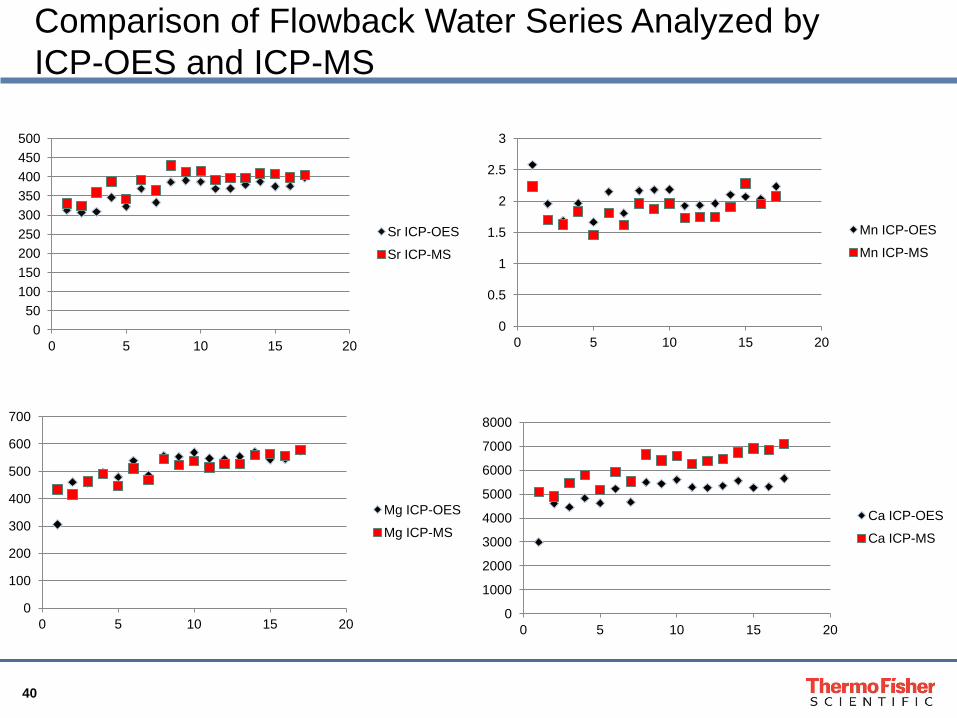
40
0
50
100
150
200
250
300
350
400
450
500
0 5 10 15 20
Sr ICP-OES
Sr ICP-MS
0
100
200
300
400
500
600
700
0 5 10 15 20
Mg ICP-OES
Mg ICP-MS
0
0.5
1
1.5
2
2.5
3
0 5 10 15 20
Mn ICP-OES
Mn ICP-MS
0
1000
2000
3000
4000
5000
6000
7000
8000
0 5 10 15 20
Ca ICP-OES
Ca ICP-MS
Comparison of Flowback Water Series Analyzed by
ICP-OES and ICP-MS
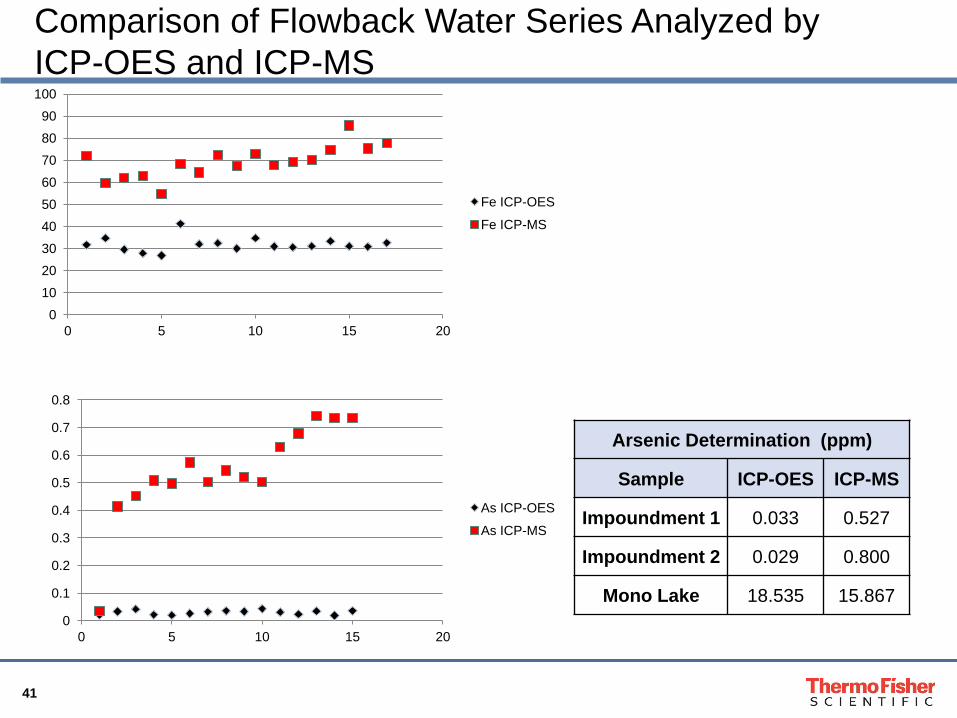
41
0
10
20
30
40
50
60
70
80
90
100
0 5 10 15 20
Fe ICP-OES
Fe ICP-MS
0
0.1
0.2
0.3
0.4
0.5
0.6
0.7
0.8
0 5 10 15 20
As ICP-OES
As ICP-MS
Comparison of Flowback Water Series Analyzed by
ICP-OES and ICP-MS
Arsenic Determination (ppm)
Sample ICP-OES ICP-MS
Impoundment 1 0.033 0.527
Impoundment 2 0.029 0.800
Mono Lake 18.535 15.867
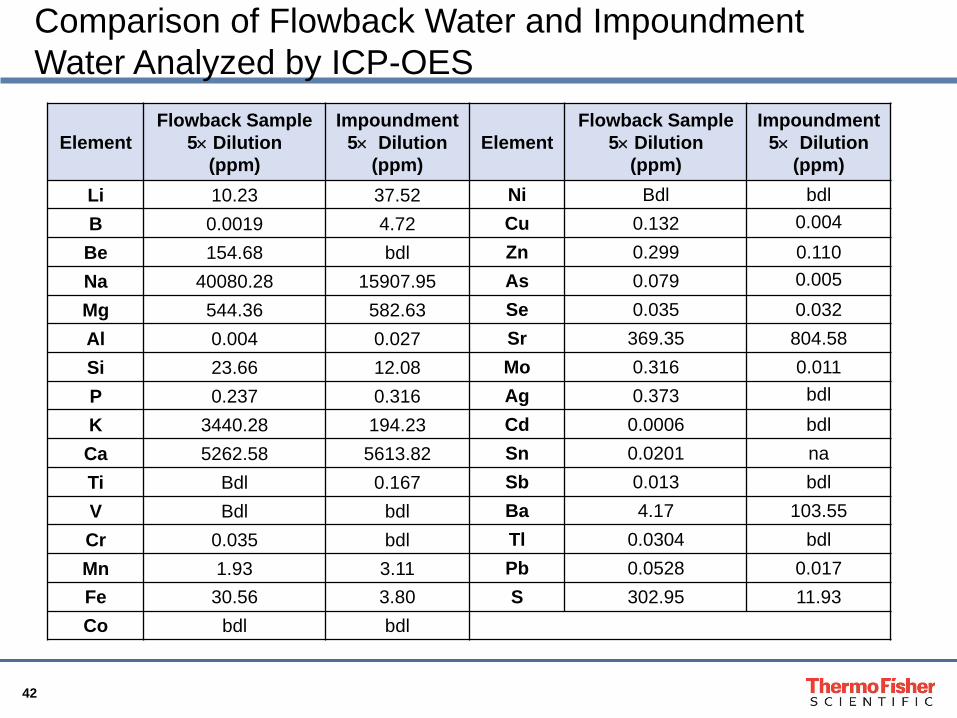
42
Comparison of Flowback Water and Impoundment
Water Analyzed by ICP-OES
Element
Flowback Sample
5 Dilution
(ppm)
Impoundment
5 Dilution
(ppm)
Element
Flowback Sample
5 Dilution
(ppm)
Impoundment
5 Dilution
(ppm)
Li 10.23 37.52 Ni Bdl bdl
B 0.0019 4.72 Cu 0.132 0.004
Be 154.68 bdl Zn 0.299 0.110
Na 40080.28 15907.95 As 0.079 0.005
Mg 544.36 582.63 Se 0.035 0.032
Al 0.004 0.027 Sr 369.35 804.58
Si 23.66 12.08 Mo 0.316 0.011
P 0.237 0.316 Ag 0.373 bdl
K 3440.28 194.23 Cd 0.0006 bdl
Ca 5262.58 5613.82 Sn 0.0201 na
Ti Bdl 0.167 Sb 0.013 bdl
V Bdl bdl Ba 4.17 103.55
Cr 0.035 bdl Tl 0.0304 bdl
Mn 1.93 3.11 Pb 0.0528 0.017
Fe 30.56 3.80 S 302.95 11.93
Co bdl bdl
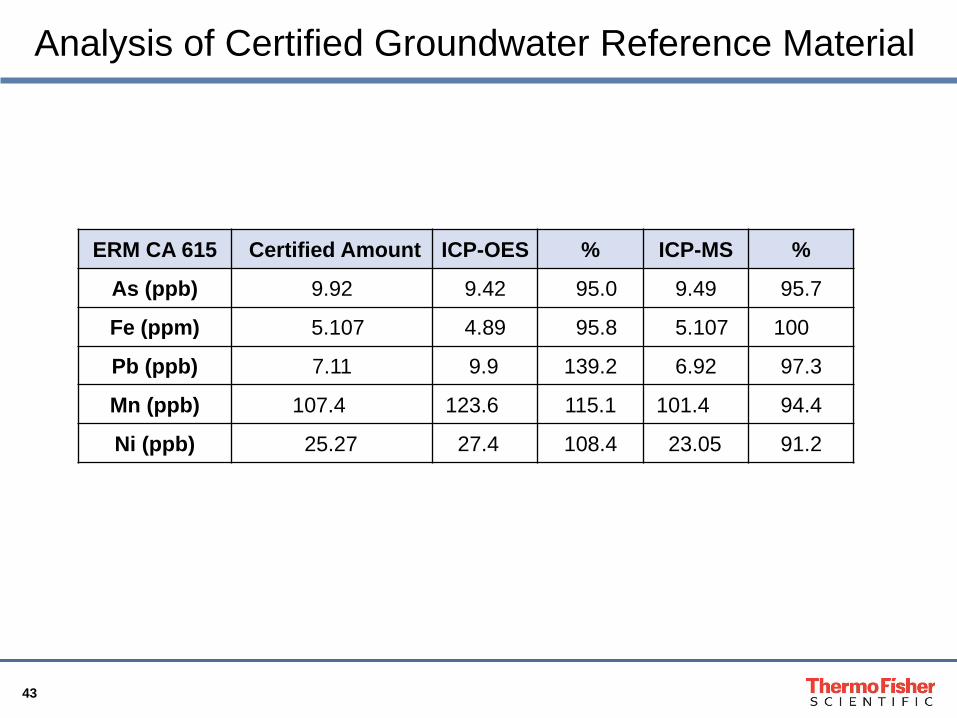
43
Analysis of Certified Groundwater Reference Material
ERM CA 615 Certified Amount ICP-OES % ICP-MS %
As (ppb) 9.92 9.42 95.0 9.49 95.7
Fe (ppm) 5.107 4.89 95.8 5.107 100
Pb (ppb) 7.11 9.9 139.2 6.92 97.3
Mn (ppb) 107.4 123.6 115.1 101.4 94.4
Ni (ppb) 25.27 27.4 108.4 23.05 91.2
44
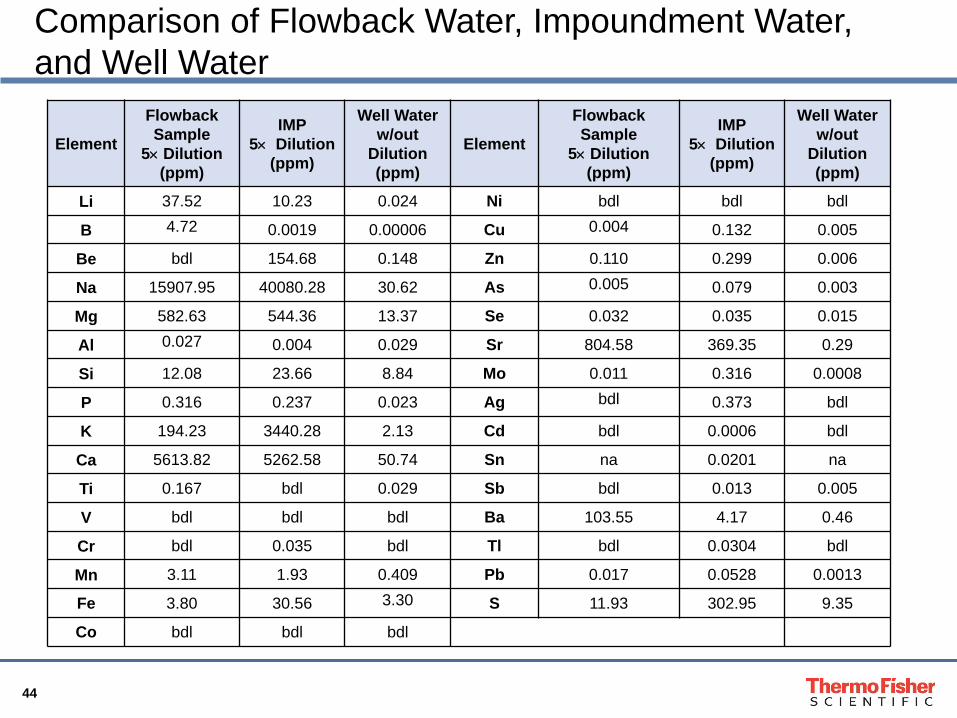
Comparison of Flowback Water, Impoundment Water,
and Well Water
Element
Flowback
Sample
5 Dilution
(ppm)
IMP
5 Dilution
(ppm)
Well Water
w/out
Dilution
(ppm)
Element
Flowback
Sample
5 Dilution
(ppm)
IMP
5 Dilution
(ppm)
Well Water
w/out
Dilution
(ppm)
Li 37.52 10.23 0.024 Ni bdl bdl bdl
B 4.72 0.0019 0.00006 Cu 0.004 0.132 0.005
Be bdl 154.68 0.148 Zn 0.110 0.299 0.006
Na 15907.95 40080.28 30.62 As 0.005 0.079 0.003
Mg 582.63 544.36 13.37 Se 0.032 0.035 0.015
Al 0.027 0.004 0.029 Sr 804.58 369.35 0.29
Si 12.08 23.66 8.84 Mo 0.011 0.316 0.0008
P 0.316 0.237 0.023 Ag bdl 0.373 bdl
K 194.23 3440.28 2.13 Cd bdl 0.0006 bdl
Ca 5613.82 5262.58 50.74 Sn na 0.0201 na
Ti 0.167 bdl 0.029 Sb bdl 0.013 0.005
V bdl bdl bdl Ba 103.55 4.17 0.46
Cr bdl 0.035 bdl Tl bdl 0.0304 bdl
Mn 3.11 1.93 0.409 Pb 0.017 0.0528 0.0013
Fe 3.80 30.56 3.30 S 11.93 302.95 9.35
Co bdl bdl bdl
45
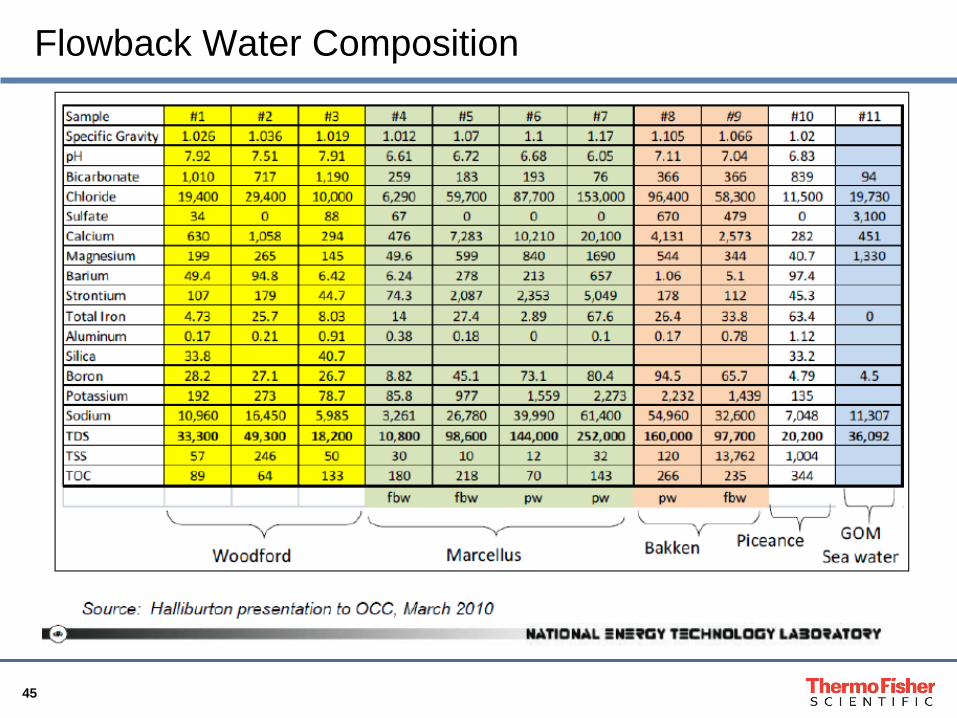
Flowback Water Composition
46
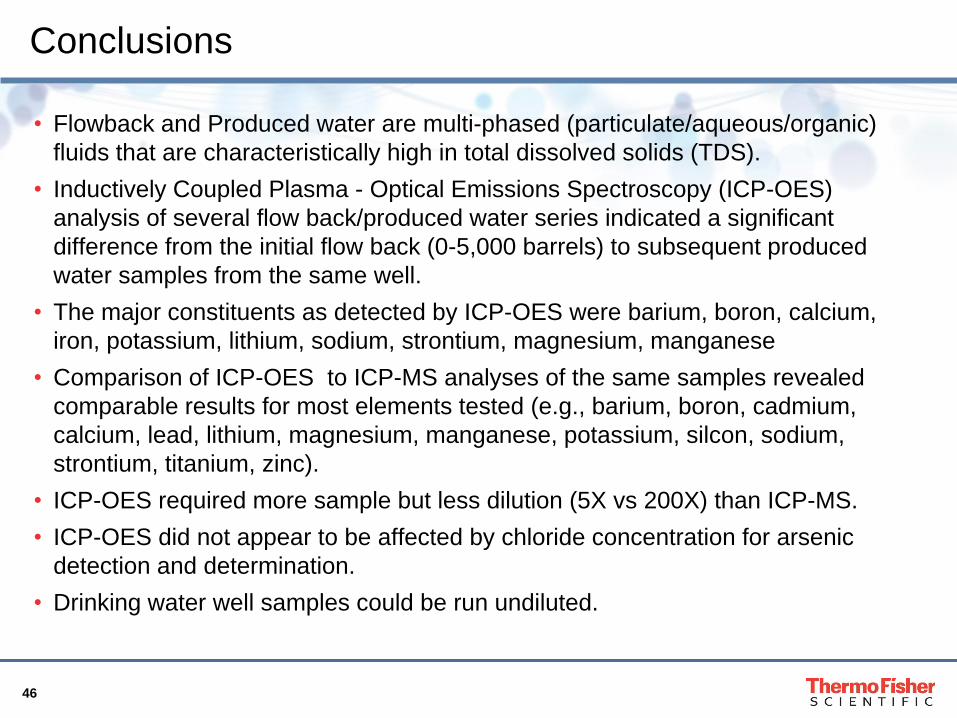
Conclusions
• Flowback and Produced water are multi-phased (particulate/aqueous/organic)
fluids that are characteristically high in total dissolved solids (TDS).
• Inductively Coupled Plasma - Optical Emissions Spectroscopy (ICP-OES)
analysis of several flow back/produced water series indicated a significant
difference from the initial flow back (0-5,000 barrels) to subsequent produced
water samples from the same well.
• The major constituents as detected by ICP-OES were barium, boron, calcium,
iron, potassium, lithium, sodium, strontium, magnesium, manganese
• Comparison of ICP-OES to ICP-MS analyses of the same samples revealed
comparable results for most elements tested (e.g., barium, boron, cadmium,
calcium, lead, lithium, magnesium, manganese, potassium, silcon, sodium,
strontium, titanium, zinc).
• ICP-OES required more sample but less dilution (5X vs 200X) than ICP-MS.
• ICP-OES did not appear to be affected by chloride concentration for arsenic
detection and determination.
• Drinking water well samples could be run undiluted.

47