Analysis of Desiccated PSPI-X and PSDI-X Inflators ... · Analysis of Desiccated PSPI-X and PSDI-X...
68
Analysis of Desiccated PSPI-X and PSDI-X Inflators Installed in Honda Vehicles
Transcript of Analysis of Desiccated PSPI-X and PSDI-X Inflators ... · Analysis of Desiccated PSPI-X and PSDI-X...

Analysis of Desiccated PSPI-X and PSDI-X Inflators Installed in Honda Vehicles

1900985.000 - 2467
Analysis of Desiccated PSPI-X and PSDI-X Inflators Installed in Honda Vehicles
Project Manager Subbaiah V. Malladi, Ph.D., P.E. Chief Technical Officer Exponent
May 2020
© Exponent, Inc.

1900985.000 – 2467 i
Contents
Page
CONTENTS I
LIST OF FIGURES III
LIST OF TABLES VII
ACRONYMS AND DEFINITIONS VIII
LIMITATIONS IX
EXECUTIVE SUMMARY X
INTRODUCTION 1
DESCRIPTION OF INFLATORS 4
AGING MECHANISMS 7
MEASUREMENTS AND TESTING 13
Inflator Headspace Relative Humidity: Indicator of Inflator Moisture Level 13
Mercury Intrusion Porosimetry: Determining Pore Size Range for Field-Relevant Aging 14
Mercury Intrusion Visualization: Monitoring Progression of Pore Formation 15
57 ml Bomb Test: Combustion Characteristics of Degraded Inflators 16
X-Ray Micro-Computed Tomography: Structural Characteristics of Pores 17
Grain Size Analysis: Features of Aged Propellants 20
Equilibrium Relative Humidity Characterization 21
Propellant Diffusivity 23
Moisture Ingress and Migration Measurements Through Seals 24
Field Survey 25
Laboratory Accelerated Aging of Inflators 27
MODELING OF MOISTURE DIFFUSION 29
Introduction 29
General Description of the Model 30
Moisture Movement Model 30
Diffusion Model 31
Results 32
Effective Flux 35
Field Simulations 38
MODELING FOR SERVICE LIFE PREDICTION 40
General Procedure for Service Life Prediction 40

1900985.000 – 2467 ii
Regional Predictions 45
Comparison of Time to Rupture for Non-Desiccated (PSPI, PSPI-6, and PSPI-L) and PSPI-X Inflators 46
FINDINGS 49
APPENDIX A: FIELD INFLATOR MONITORING AND CONTROLLED TESTING PROGRAM 50
Objectives 50
Background 50
Program Considerations 50
Monitoring Program Design 52
Stage 1 53
Stage 2 56
Stage 3 56
1900985.000 – 2467 iii
List of Figures
Page
Figure 1. Cross-sectional diagram of a PSPI-X inflator. 5
Figure 2. Cross-sectional diagram of a PSDI-X inflator. 6
Figure 3. MIP porosity growth vs. OD growth for 2004L propellants (orange) and 2004 propellants (blue) after field aging or laboratory accelerated cycling. Note that to date, porosity/OD growth has not been observed in 2004L propellants extracted from Honda field inflators. 7
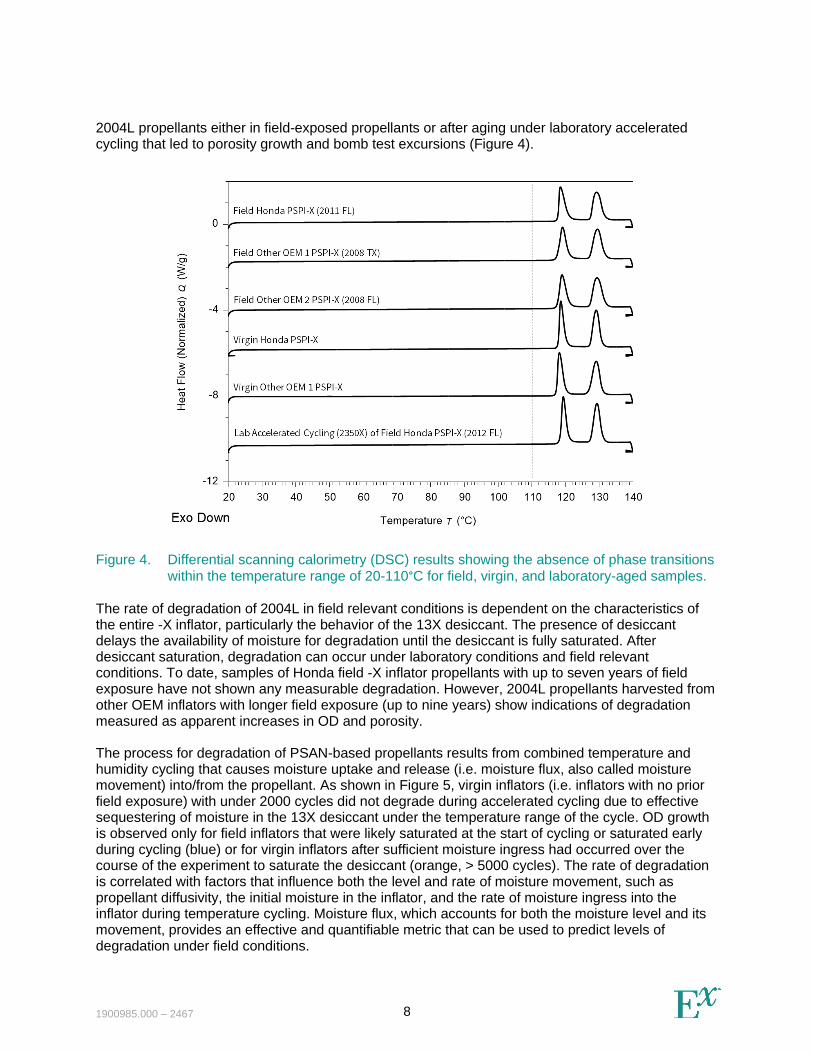
Figure 4. Differential scanning calorimetry (DSC) results showing the absence of phase transitions within the temperature range of 20-110°C for field, virgin, and laboratory-
aged samples. 8
Figure 5. Effect of desiccant saturation on the potential for degradation in field-relevant accelerated cycling. 9
Figure 6. Modes of degradation observed in the study of 2004L under various accelerated aging conditions. The plots at the bottom of each column represent MIP data indicative of the pore size distribution within the aged propellants. 11
Figure 7. Degradation observed in -X series inflators under laboratory accelerated cycling conditions leading to an inflator rupture. 12
Figure 8. MIP cumulative pore volume vs. wafer OD (in mm) for all PSPI-X inflators (field and laboratory-aged) demonstrating the strong correlation for the total volume of pores within 0.008 - 2.0 μm (dark blue bars). 15
Figure 9. X-ray CT scans of propellants aged under laboratory accelerated cycling in which mercury was intruded into the propellants up to 2000 psi, corresponding to a nominal pore diameter of 0.1 micron. Bright areas containing mercury are indicative of porosity. The evolution of an inhomogeneous distribution of pores is apparent throughout the aging process. Materials shown were conditioned prior to being assembled into the inflator and subsequently cycled to generate porosity. Initial inflator RH was measured as approximately 12% for inflators with saturated 13X and 25% for inflators with materials humidified at 40%. 16
Figure 10. Bomb test data with nominal pressure rise, high-pressure excursion and low-pressure excursion (left). Typical PSPI-X primary chamber deployment pressure (right). 17
Figure 11. Micro-CT scans of a selected region within a virgin tablet compared with a degraded tablet from laboratory accelerated aging. 18

1900985.000 – 2467 iv
Figure 12. Scanning electron microscopy (SEM) images of the OD surface of a virgin propellant vs. propellant aged via laboratory accelerated cycling (top). Demonstration of the physical constraints on OD only and ID only expansion scenarios (bottom). 19
Figure 13. Optical images, CT scans, and pressure traces of propellants partially burned during bomb testing. Burning was ceased via a burst disc nominally activated at 80 MPa. The images highlight the differences in surface roughness during the burning. 20
Figure 14. Representative segmentation on polished cross-sections of virgin vs. degraded 2004L propellants. Propellants were degraded in laboratory accelerated cycling. 21
Figure 15. Methods used in measuring the equilibrium sorption behavior of 2004L propellants. 22
Figure 16. Published relative humidity above various salt solutions (left). Diffusivity measurement setup (right). 23
Figure 17. Gravimetric diffusion experiments (plotted in black) and simulations with varying assumed moisture diffusivities. Two sequential experiments at different environmental conditions are shown. Experiment and simulations align at D2004L ∼3 × 10-11m2/s. 24
Figure 18. Example of the experimental method employed to measure moisture ingress and migration through inflator seals. 25
Figure 19. State of the field (moisture level and propellant degradation) for PSPI-X inflators. 26
Figure 20. State of the field (moisture level and propellant degradation) for PSDI-X inflators. 26
Figure 21. Overview of thermal cycling programs and observations of degradation. Field Honda and OEM 2 & 3 inflators were pulled from vehicles, and Takata Baseline and 40% RH conditioned inflators were assembled with saturated desiccant and propellants conditioned at elevated humidity as described in the text. 27
Figure 22. Differences in the observed degradation rate between the Takata Custom population and the field inflator population. 28
Figure 23. General model of inflator. 30
Figure 24. Model flow diagram. 31
Figure 25. Schematic of the 2004L diffusion model. 32
Figure 26. Results of diffusion simulation for 8-hour, 2-80°C cycling of the PSPI-X primary
chamber. 33
Figure 27. Spatial distribution of 2004L moisture flux for 1000 24-hour, 20-70°C cycles and 2800 4-hour, 2-80°C cycles. 33
Figure 28. Midplane moisture flux for 1000 24-hour, 20-70°C cycles and 2800 4-hour, 2-80°C
cycles. 34

1900985.000 – 2467 v
Figure 29. Degradation measured with cumulative pore volume plotted against bulk (mass-based) flux for Takata Custom inflators. 35
Figure 30. Illustration of affected volume differences for fast and slow cycles. 36
Figure 31. Illustration of affected volume differences for different form factors. 36
Figure 32. MIP pore volume and bomb test excursions for cycled field inflators correlated with effective flux for 4-hour, 2-70°C; 8-hour, 2-80°C; and 24-hour, 20-70°C cycles. Null
bomb test excursions correspond to MIP values for which a bomb test was not performed. 38
Figure 33. Results of PSPI-X effective flux simulations. 39
Figure 34. Results of PSDI-X effective flux simulations. 39
Figure 35. Weibull model fits for the time to saturation models for PSPI-X primary chamber and PSDI-X. A total of 920 PSPI-X field measurements from all sampled regions were used for fitting, of which 314 were determined to be effectively saturated (RH > 10%). A total of 806 PSDI-X field measurements from all sampled regions were used for fitting, of which only 13 were observed to be effectively saturated. 41
Figure 36. The regional effective flux accumulation rate in PSPI-X inflators after desiccant saturation calculated from the inflator moisture model at characteristic weather stations. 42
Figure 37. Distribution of percent of maximum exposure (i.e. growth rate) using 2004 wafers from MEAF data for 2004 inflators from south Florida (3052 samples of Beta inflators from locations with a latitude < 27.646530). 42
Figure 38. Relationship between MIP pore volume (0.008 - 2 µm) and effective flux based on laboratory accelerated cycling of PSPI-X wafers and PSDI-X tablets. The majority of measurements were for wafers, though limited data on tablets was also included. The effective flux for each point on the plot was based on inflator-level moisture modeling using initial moisture content and environmental cycling conditions. 43
Figure 39. The 3-parameter Weibull distribution model to predict bomb test excursions based on MIP pore volume. Bomb test data included in the analysis are for 2004 and 2004L wafers and tablets from field and laboratory accelerated cycling conditions for which MIP pore volume was measured. The Weibull distribution (black line) with the data (blue dots showing non-excursion = 0%, excursion = 100%; left). The count of inflators that would experience an excursion were predicted (black line) and compared to the actual count of observed excursions (blue dots; right). 44
Figure 40. The 2-parameter Weibull distribution model to predict inflator rupture based on MIP pore volume. Bomb test data included in the analysis are for 2004 and 2004L wafers and tablets from field and laboratory accelerated cycling conditions for which MIP pore volume was measured. The Weibull distribution is shown as the black line and the data points are shown as blue dots (left). The count of inflators that would experience a rupture were predicted (black line) and compared to the actual count of observed excursions pressures of < 40 MPa (blue dots, assumed ruptures; right). 44

1900985.000 – 2467 vi
Figure 41. Predictions of the probabilities of rupture (given a deployment) with age for PSPI-X inflators in different regions of the country. 45
Figure 42. Cumulative counts of ruptures versus age for PSPI, PSPI-L, and PSPI-6 non-Alpha inflators from Florida that were deployed by Takata and the predicted counts of ruptures using a 2-parameter Weibull distribution. 47
Figure 43. Probability of rupture if deployed versus age for PSPI, PSPI-6 and PSPI-L inflators (excluding Alpha inflators) from Florida vehicles (Takata data). For comparison, the predicted years in service to reach a 5% probability rate for PSPI-X inflators, if exposed to Miami weather, is shown (green dash). 48
Figure 44. Overview of the three proposed stages of the monitoring program. Stage 1 covers the initial collection, testing, and distribution of inflators among monitored aging environments: environmental chamber, Miami parked car, and Houston parked car (left). Stage 2 covers annual collection and testing of 100 inflators of each type for 10 years (center). Stage 3 covers the annual evaluation/testing of inflators in the monitored aging environments for 10 years (right). 52
Figure 45. Sequence of testing for laboratory evaluations of PSPI-X (left) and PSDI-X (right) inflators. Inflators being placed back in environmental chambers or test cars will not proceed to the step of live dissection. Full inflator deployment testing might be implemented on selected inflators, if deemed appropriate, and would occur in place of the live dissection and subsequent steps. 54

1900985.000 – 2467 vii
List of Tables
Page
Table 1. Affected volume ratio for various inflator types and cycle speeds. 37
Table 2. Flux normalizing factors 𝐶 based on the 24-hr, 20-70°C PSPI-X cycle. 37
Table 3. Predicted rupture rates based on 2-parameter Weibull distribution fit to Takata laboratory deployments of PSPI, PSPI-6 and PSPI-L inflators harvested from Florida (excluding Alpha inflators). 48

1900985.000 – 2467 viii
Acronyms and Definitions
AI Autoignition component
AIB Autoignition booster material used in Honda -X series inflators
BHT 5,5’-Bi-1H-tetrazole di-ammonium salt (fuel used in 2004 propellant)
BTA 1H-tetrazole-5-amine, N-1H-tetrazole-5-yl, monoammonium salt (fuel used in 2004L propellant)
CT Computed tomography, in the context of this report,3D imaging using X-rays
Desiccant Material that dries the air by absorbing moisture
Desiccated Inflators Inflators that contain desiccant; in this report, desiccated inflators refer to PSDI-X and PSPI-X inflators
MIP Mercury intrusion porosimetry; MIP pore volume is reported in mL/gram
Moisture Diffusivity A characteristic of a material that describes how quickly moisture can migrate through a material
Moisture Flux Mass flow of moisture through a surface
OD Outside Diameter
OEM Original equipment manufacturer
Propellant Material containing fuel and oxidizer in primary and secondary chambers that produces the gases that inflate the airbag
PSAN Phase-stabilized ammonium nitrate
Service Life For each distinct region and inflator type, the years during which an inflator rupture would be unlikely to occur within the local population of vehicles in service1
13X A desiccant used in PSDI-X and PSPI-X inflators
2004 Propellant used in older (non -X) mostly non-desiccated inflators
2004L Propellant used in PSDI-X and PSPI-X inflators
3110 A booster or propellant material used in select Takata inflators
5AT 5-amino tetrazole, the fuel used in the AIB and 3110 boosters
1 The service life is not intended to represent inflators that have been damaged in use or incorrectly manufactured.

1900985.000 – 2467 ix
Limitations
The findings presented herein are made to a reasonable degree of scientific certainty based on information possessed by Exponent as of the date of this report. In the future, Exponent may be asked to perform additional analysis. Exponent reserves the right to supplement, expand, or modify the findings in this report based on additional work or review of additional information.
The scope of this report may not be adequate for purposes other than those described in the beginning of the Executive Summary. Use of this report or the findings, conclusions, or recommendations presented herein for any other purpose is at the sole risk of the user.
1900985.000 – 2467 x
Executive Summary
Exponent was retained to investigate the characteristics of desiccant-containing (specifically PSPI-X and PSDI-X) inflators manufactured by Takata and installed in certain Honda vehicles. This work was an outgrowth of our prior investigations of non-desiccated Takata inflators, the results of which are summarized in a previous report.2 The earlier work encompassed several different versions of inflators, all of which contain phase-stabilized ammonium nitrate (PSAN) in the propellant. The results of that prior investigation included a computer model of moisture ingress/egress and moisture flux that, in conjunction with analysis of field-harvested inflators, was used to estimate the years of exposure until the first ruptures might be observed in different regions of the country.
While both non-desiccated and desiccated inflators use PSAN in the propellant, the other constituents of the propellant in these inflators are significantly different. Exponent evaluated these differences, along with other differences in inflator configuration that affect the rate of propellant degradation. The original computer model used to simulate moisture ingress/egress and moisture flux for non-desiccated inflators was adapted to accommodate these differences (“adapted computer model”). One of the principle differences found in our study was the low diffusivity of the propellant in the desiccated inflators, which initially limits moisture degradation to the outer surface. Consequently, Exponent added a propellant diffusivity module to the adapted computer model to track changes in moisture concentrations throughout the propellant material. Additionally, the numerical method used to quantify degradation was modified to reflect the non-uniform moisture flux within the body of the propellant.
Unlike the non-desiccated inflators studied earlier, no degradation was observed in the propellants of desiccated (PSPI-X and PSDI-X) inflators harvested from Honda and Acura vehicles in any of the field surveys performed. This is due, in part, to the presence of the desiccant, which has the effect of delaying any moisture-related degradation until the desiccant becomes saturated. In addition, the exposure time for those sampled field inflators in which the desiccant was found to be saturated was too short to result in measurable degradation. Exponent relied on laboratory accelerated testing to assess how propellants degrade in response to cyclic moisture and temperature changes and to estimate the level of degradation that would result in overpressure or rupture should the inflator be deployed.
The adapted computer model was used to calculate the cumulative effective moisture flux in the propellant over time for different regions of the United States. A stochastic methodology was then employed to account for variations in environmental exposure within a region and variations in the response of the propellant to a given exposure. The stochastic methodology included data from the laboratory accelerated testing to predict the probabilistic time when the first inflator deployment resulting in a rupture might be observed for different regions of the country.
Note that this Executive Summary does not contain all of Exponent’s technical evaluations, analyses, conclusions, and recommendations. The main body of this report is at all times the controlling document.
2 Investigation of Takata Inflator Ruptures, Exponent, Inc., July 2016.

1900985.000 – 2467 1
Introduction
Exponent was retained to investigate the characteristics of desiccant-containing inflators, specifically PSPI-X and PSDI-X inflators3 manufactured by Takata and installed in certain Honda vehicles. This work was an outgrowth of our prior investigations of non-desiccated Takata inflators, the results of which were summarized in a previous report.4 The earlier work included several different versions of inflators, all of which contain phase-stabilized ammonium nitrate (PSAN) in the propellant.
Our investigation began by examining what significant differences exist between the non-desiccated inflators studied earlier and the desiccated inflators that are the focus of this report. Differences found to have a material impact on the predicted behavior of the desiccated inflators are summarized below:
• The chemical makeup of the propellant material, which contains phase-stabilized ammonium nitrate (PSAN), differs in significant ways between non-desiccated and desiccated inflators with respect to moisture interactions. Principal among these different moisture interactions are the moisture diffusivity, the equilibrium relative humidity, and the moisture-carrying capacity.
• Desiccated inflators contain different materials and quantities of materials in the booster and propellant chambers, which affect moisture concentration within each chamber. Among these is a desiccant, known as 13X, which has the capacity to maintain a dry environment (~ 0% RH) within a chamber up to a particular moisture content.
• The geometries of the desiccated inflator materials are different. Desiccated passenger-side inflators have smaller propellant wafers than non-desiccated passenger-side inflators. Furthermore, none of the driver-side desiccated inflators contain the batwing-shaped propellant and separator that are present in some driver-side non-desiccated inflators.
• Other differences include the rates of moisture migration into or between compartments, inflator compartment geometries, and amount of propellant degradation that could cause overpressure or rupture.
In earlier work, Exponent developed a computer model capable of estimating the rate of degradation of propellant materials, allowing for predictions of when inflator overpressure or rupture might occur within the population of vehicles in the field. This modeling effort was validated by field data and cyclic testing. Exponent found during the earlier study that many field-returned inflators had degraded propellants, some of which could (or did) rupture the inflator housing if (or when) deployed. The cyclic testing (accelerated life testing) performed on non-desiccated inflators allowed Exponent to evaluate the rate of propellant degradation under controlled but varying laboratory conditions. The combination of field observations and accelerated life testing, along with laboratory measurements of the chemical and physical properties of the inflators and their contents, were used in the development and validation of the model. The model was used to rank order the risk of rupture based on location in the country where vehicles were operated.
3 In this report, the terms “desiccated inflators” or “-X inflators” refers only to PSPI-X and PSDI-X inflators.
4 Investigation of Takata Inflator Ruptures, Exponent, Inc., July 2016.

1900985.000 – 2467 2
Exponent confirmed that some of the earlier findings were applicable to the desiccated inflators, such as propellant porosity growth through moisture migration arising from humidity/temperature cycling, and moisture infiltration into and among different chambers inside the inflator. Exponent also confirmed that porosity growth in the desiccated inflator propellant, if it progressed sufficiently, could result in overpressure or rupture of the containment.
For desiccated inflators, the model developed from the previous study needed to be adjusted to accommodate the differences in inflator characteristics noted above. The additional experimental efforts in support of the modeling effort included characterizing the physical and chemical properties of the materials used in the inflator, measurements of rates of moisture infiltration between chambers, and the addition of a diffusivity model for the propellants.
Another factor that Exponent needed to address was the process of validating the model. Unlike non-desiccated inflators, in which propellant degradation resulting in pressure excursions or ruptures was found in some of the field-returned inflators, the sample of desiccated inflators harvested from Honda vehicles did not exhibit measurable degradation. This was partially due to the presence of the desiccant, which prevented any significant moisture flow into and out from the propellant until the desiccant material became saturated. Another factor was the limited time of exposure to field conditions. The desiccated inflators were substantially newer than the non-desiccated Honda inflators previously studied and thus had significantly less time for exposure to field conditions after the desiccant had saturated.
One approach taken for the model validation process was to evaluate desiccated Takata inflators removed from other OEM vehicles. The oldest of these inflators have approximately three years more exposure than the oldest Honda inflators. While the geometries and some of the compounds used in the other OEM inflators differ somewhat from Honda inflators, the propellant itself is the same as that used in Honda inflators. A few of the other OEM desiccated inflators examined in Exponent’s study exhibited some measurable degradation of the propellant. The second approach taken during the model validation process involved comparisons of model predictions to laboratory cycled inflator materials.
The metric previously used to correlate environmental exposure to inflator material degradation was the cumulative amount of moisture flowing into and out from wafers or tablets as a percent of the total wafer or tablet mass (moisture flux). This approach to calculating cumulative flux was modified for desiccated inflators because of the greatly reduced moisture diffusivity through the inflator wafers or tablets. With a low level of diffusivity, moisture flux does not penetrate far into the depth of the wafer or tablet during a diurnal cycle. Consequently, this moisture-affected zone is concentrated near the exposed surfaces and not distributed throughout the volume of the propellant, which was different from how moisture flux distributed through the propellants used in non-desiccated inflators during diurnal cycles. This phenomenon was even more prominent in accelerated life testing, in which shorter temperature/humidity cycles further reduced penetration of moisture fluctuations into the depth of the wafer or tablet. Exponent studied this in detail and developed a methodology that addresses the lower diffusivity materials contained in desiccated inflators. The methodology includes the development of a new element to the model: calculating the moisture concentrations at hundreds of points at every time interval within the propellant wafers or tablets. The moisture-affected zone is tracked for diurnal and accelerated cycle testing, and the cumulative moisture flux over the relevant region is calculated (called “effective flux” in this report).
Another critical difference between non-desiccated and desiccated propellants is the amount of degradation needed to cause an overpressure or potential rupture if deployed. In our analysis, Exponent did not assume that the cumulative moisture migration needed to cause a rupture is the same for desiccated and non-desiccated propellants. Instead, Exponent conducted ignition tests

1900985.000 – 2467 3
inside a small non-vented chamber (called “bomb tests”) on samples of wafers and tablets taken from cycled inflators in which degradation was quantified. The data on overpressure or rupture is limited due to the small number of inflators containing highly degraded propellant available for testing; none were inflators freshly harvested from the field because those inflators were not degraded to a significant extent. Using the complete set of available data, Exponent established a range of effective moisture flux that might be predicted to result in overpressure/rupture.
A further aspect of this study involved identifying the best measure for quantifying degradation. Through extensive studies, Exponent determined that the cumulative pore volume within a specified pore size range, as measured by mercury intrusion porosimetry (MIP), provided the most sensitive quantification of degradation. This technique can be applied effectively to both wafers (used in passenger-side inflators) and tablets (used in driver-side inflators) as a measure of degradation. Measurements of wafer diameter, while non-destructive and simple to perform, are not particularly sensitive to initial levels of degradation. Furthermore, outside diameter (OD) cannot be reliably used as a degradation measure for tablets because tablets are dimensionally much smaller than wafers. However, for some testing, such as periodically observing changes to the same wafer during laboratory temperature/humidity cycling, OD measurements provided a valuable tool for assessing changes in degradation.
Flux calculations from the adapted computer model were compared with measures of degradation and bomb testing to verify that the model can be used to predict when overpressure or rupture might occur for given environmental exposures. The model was applied to the population of vehicles in several states (including Florida, where both humidity and temperatures are more extreme). To predict at what time a rupture might occur in the population of vehicles, a stochastic approach to measured variations in exposure and degradation was used. Degradation of the propellant was not observed among the samples of Honda desiccated -X inflators that were harvested from the field. Estimating long-term field performance without having any available degraded inflators harvested from the field for use as a benchmark increases the uncertainty in the model predictions.
This report contains details of Exponent’s investigation, including descriptions of the inflators, aging mechanisms, types of measurements and tests performed, moisture diffusion modeling, and service life prediction modeling.
Honda indicated that further monitoring of the field performance of inflators and potential degradation will be undertaken using methodologies developed during this and the prior study. Appendix A includes a detailed proposal for field monitoring and controlled testing of desiccated -X inflators.

1900985.000 – 2467 4
Description of Inflators
The desiccated inflators that were studied for this report are referenced as PSPI-X (for passenger-side inflators) and PSDI-X (for driver-side inflators). The active propellant material in these inflators has the designation 2004L. The non-desiccated inflators studied previously have various designations, such as PSPI or PSPI-L (passenger side), and PSDI, PSDI-4 or PSDI-5 (driver side). The propellant in these prior inflators has the designation 2004. While both 2004 and 2004L propellant materials contain phase-stabilized ammonium nitrate (PSAN), their overall formulations differ significantly.
Inflators in the -X series are characterized by use of new Takata propellant materials, boosters, seal design, geometry, and the use of an internal desiccant that influences service life relative to the 2004-based inflators (as exemplified by a PSPI-L inflator). -X series inflators replaced existing 2004-based inflators in some applications, as well as satisfying other market-related performance specifications. The desiccant aided in initially maintaining lower internal moisture levels than non-desiccated 2004-based inflators. PSPI-X and PSDI-X inflators with manufacturing dates of 2011 and later were used in certain Honda vehicles. PSPI-X and PSDI-X inflators were put in service earlier for other OEMs (as early as 2008 for PSPI-X and 2010 for PSDI-X).
For the -X series inflators, the key characteristics that influence moisture movement properties, and hence inflator aging, are the presence of a desiccant, the moisture level of the inflator at the time of manufacture, and how moisture is exchanged among components after saturation of the desiccant. The desiccant effectively performs a final drying step of the propellant and headspace after assembly, maintaining a dry environment in the internal volume of the inflator until the desiccant reaches saturation. The effect of the desiccant is to maintain a low availability of moisture in the inflator to delay the onset of material aging from cyclic moisture migration.
The total moisture level in the inflator at the time of manufacture is controlled by the moisture in each of the ingredients—such as the 2004L propellant, AIB booster, and 13X—as well as the headspace water content. Unlike the predecessor 2004 material, 2004L does not have bentonite. Bentonite is an ingredient with a relatively high capacity to absorb moisture. The absence of bentonite in 2004L results in both a lower initial moisture content and a lower total moisture carrying capacity. In addition, the diffusivity of 2004L is lower than that of 2004, possibly due to the absence of bentonite. Similarly, the AIB booster does not have bentonite and has a low initial moisture content.
Other differences between the desiccated and non-desiccated inflators include:
• 2004L does not contain strontium nitrate, whereas 2004 does.
• The fuel in 2004L is BTA, whereas the fuel in 2004 is BHT.
• The desiccated passenger-side inflators have a cushion, whereas non-desiccated passenger-side inflators do not.
• The boosters in the desiccated inflators contain AIB, while the boosters in non-desiccated inflators contain the compound 3110, which contains bentonite.
• One similarity between desiccated and non-desiccated inflators that affects moisture concentration is the presence of the compound 5-amino tetrazole (5AT) in the booster materials (e.g. AIB or 3110). 5AT forms a hydrate at relative humidity levels above 35% at room temperature, requiring elevated temperature and low humidity to release its moisture.

1900985.000 – 2467 5
Thus, under typical field exposure conditions, 5AT hydrate formation limits the humidity available within the inflator because moisture exceeding this level would be sequestered in the hydrate.
Moisture exchange among the components depends on several key properties of the materials, particularly the moisture diffusivity in the propellant, the equilibrium relative humidity (ERH) of each material, and the resistance to moisture exchange among inflator chambers/subcompartments. Components exchange moisture with the environment (ingress) through inflator seals, and they exchange moisture among subcompartments across somewhat permeable barriers, such as internal tape seals and Tyvek seals.
A cross-sectional diagram of the key features of the PSPI-X inflator is provided in Figure 1, illustrating the features in PSAN-based inflators that are known to influence the service life. Overall features are similar to the previous 2004-based inflator design, including inflator sealing, the process of ignition, and the deployment process.
Figure 1. Cross-sectional diagram of a PSPI-X inflator.
A cross-sectional diagram of the key features of the PSDI-X inflator is provided in Figure 2, illustrating the features that are known to influence service life. PSDI-X inflators are similar to PSPI-X with respect to the material compositions and general properties, and hence they both have the potential for propellant aging. However, there are significant differences in inflator construction and inflator material geometry that change the rate of moisture exchange and therefore the rate of aging.

1900985.000 – 2467 6
Figure 2. Cross-sectional diagram of a PSDI-X inflator.
Significant elements of the design of PSDI-X inflators that are similar to PSPI-X inflators are the constituents of the inflator materials, namely AIB, the formulation of 2004L, and the presence of the desiccant 13X.
Elements of the design of PSDI-X inflators that are significantly different from PSPI-X inflators include:
• The form factor of the 2004L: approximately 7 mm diameter tablets in PSDI-X inflators and approximately 24 mm diameter wafer rings in PSPI-X inflators.
• Quantities of inflator components, including 2004L.
• Geometry, including the headspace of the PSDI-X inflators, which affects the total amount of moisture that can be exchanged during a temperature/humidity cycle.
• Environmental sealing: PSDI-X has nearly one-tenth the rate of moisture ingress of the PSPI-X inflators.
• A pathway for moisture exchange between the primary and secondary chambers exists in the PSDI-X inflator but not in the PSPI-X inflator.
• Gas generated by the secondary chamber vents into the primary chamber in the PSDI-X but vents externally in the PSPI-X inflator.
• The 13X is in the same chamber and in contact with the propellant in PSDI-X inflators, while in PSPI-X inflators the 13X is in the AI pouch. Additionally, depending on the generation of the inflator, 13X may also be in the booster chamber of PSPI-X inflators.

1900985.000 – 2467 7
Aging Mechanisms
In laboratory testing, 2004L propellant has been observed to undergo aging/degradation via porosity growth, as was previously observed for 2004 propellants. 2004L exposed to field-relevant moisture levels and temperature cycling has been observed to undergo pore volume growth as measured by mercury intrusion porosimetry (MIP) as well as physical dimensional growth measured as wafer outside diameter (OD) increase. Both methods provide a measure of propellant degradation. Figure 3 shows the probability of observing a pressure excursion increase with MIP porosity or OD growth above certain threshold levels for both 2004 and 2004L propellants. For both propellant types, degradation is positively correlated with moisture movement.
Figure 3. MIP porosity growth vs. OD growth for 2004L propellants (orange) and 2004 propellants (blue) after field aging or laboratory accelerated cycling. Note that to date, porosity/OD growth has not been observed in 2004L propellants extracted from Honda field inflators.
The potential for phase destabilization was investigated as a mechanism of porosity formation for 2004L propellants under field relevant aging, as had previously been investigated for 2004 propellants. Crystals of ammonium nitrate (AN), a major ingredient in both 2004 and 2004L propellants, are known to undergo volume changes during thermal cycling above/below approximately 30-50°C, which causes porosity formation and physical expansion of compacted AN
pellets after repeated cycling. Methods exist for preventing these volume changes in AN from occurring during field-relevant temperature ranges (e.g. up through 100°C), known as phase
stabilization. The method Takata used to form phase-stabilized ammonium nitrate (PSAN) was by co-crystallizing ammonium nitrate with approximately 10% potassium nitrate. This method is used in both 2004 and 2004L propellants. Differential scanning calorimetry (DSC), a technique used to identify the presence of phase transitions, confirmed that no phase transitions were observed in
1900985.000 – 2467 8
2004L propellants either in field-exposed propellants or after aging under laboratory accelerated cycling that led to porosity growth and bomb test excursions (Figure 4).
Figure 4. Differential scanning calorimetry (DSC) results showing the absence of phase transitions within the temperature range of 20-110°C for field, virgin, and laboratory-aged samples.
The rate of degradation of 2004L in field relevant conditions is dependent on the characteristics of the entire -X inflator, particularly the behavior of the 13X desiccant. The presence of desiccant delays the availability of moisture for degradation until the desiccant is fully saturated. After desiccant saturation, degradation can occur under laboratory conditions and field relevant conditions. To date, samples of Honda field -X inflator propellants with up to seven years of field exposure have not shown any measurable degradation. However, 2004L propellants harvested from other OEM inflators with longer field exposure (up to nine years) show indications of degradation measured as apparent increases in OD and porosity.
The process for degradation of PSAN-based propellants results from combined temperature and humidity cycling that causes moisture uptake and release (i.e. moisture flux, also called moisture movement) into/from the propellant. As shown in Figure 5, virgin inflators (i.e. inflators with no prior field exposure) with under 2000 cycles did not degrade during accelerated cycling due to effective sequestering of moisture in the 13X desiccant under the temperature range of the cycle. OD growth is observed only for field inflators that were likely saturated at the start of cycling or saturated early during cycling (blue) or for virgin inflators after sufficient moisture ingress had occurred over the course of the experiment to saturate the desiccant (orange, > 5000 cycles). The rate of degradation is correlated with factors that influence both the level and rate of moisture movement, such as propellant diffusivity, the initial moisture in the inflator, and the rate of moisture ingress into the inflator during temperature cycling. Moisture flux, which accounts for both the moisture level and its movement, provides an effective and quantifiable metric that can be used to predict levels of degradation under field conditions.

1900985.000 – 2467 9
Figure 5. Effect of desiccant saturation on the potential for degradation in field-relevant accelerated cycling.
The initial moisture content of the materials in desiccated inflators is typically lower than that in non-desiccated 2004-based inflators. This can be attributed primarily to the use of 2004L as the propellant and AIB as the booster material, neither of which contain bentonite. Bentonite, a constituent of 2004 and 3110, increases the moisture content of 2004-based inflators at initial manufacture and releases substantial moisture to the headspace during high temperature cycling. Both AIB and 3110 use 5AT as the fuel, a compound that is known to form hydrates above a threshold relative humidity (RH) (i.e. approximately 35% RH at room temperature). Thus, under normal field exposure for nominal operating conditions (e.g. no flood exposure), the 5AT will limit the amount of moisture available at room temperature.
The presence of 13X desiccant in -X inflators extracts any initial moisture from the propellant, the booster, and the headspace, initially resulting in propellant that is too dry to begin to degrade. The dry headspace in the inflator means that a moisture difference exists across the seals (between the headspace and the external environment) resulting in a net water ingress into the inflator. Thus, the desiccant maintains a dry headspace in the inflator for a finite time, limited by environmental characteristics, such as average regional absolute humidity, and inflator characteristics, such as the initial moisture content, the amount of desiccant, seal characteristics, etc. Measurements of the inflator headspace RH and the moisture content of the desiccant after live dissection were performed by both Exponent and Takata. These measurements indicate that in high absolute humidity environments, such as Florida, the desiccant can saturate with as little as 2 years of field exposure in PSPI-X inflators. Correspondingly, inflators from the high absolute humidity regions were observed to have room temperature headspace RH of ~35% after long-term exposure.
Once the headspace is no longer dry, the rates and quantities of uptake/release of moisture between the propellant and the headspace are fundamentally controlled by a diffusion process. The diffusivity of 2004L propellant in -X inflators was measured and observed to be significantly lower than that of

1900985.000 – 2467 10
2004 propellant. The presence of bentonite in 2004 likely plays a role in increasing the transport rate of moisture through the bulk of the propellant. The difference in diffusivity influences the magnitude and rate of moisture exchange between the headspace and propellant, and thus the magnitude of moisture flux per cycle. When moisture diffusivity is lower (i.e. in 2004L), the effect of moisture flux per cycle is concentrated near the surface for both diurnal and accelerated life cycle testing.
Communication rates among propellants within internal subcompartments of the inflator (i.e. among the booster chamber, AI pouch, and propellant chamber) are controlled by internal seals (e.g. Tyvek seals or aluminum tape seals). In -X series inflators, the materials are divided among one or two main propellant compartments, one or two booster compartments, and zero or two AI pouches.
In Honda PSPI-X inflators, each booster contains AIB and may contain 13X depending on the configuration. Each of the two AI pouches contains both AIB and 13X, and each propellant compartment contains only 2004L. For Honda PSPI-X inflators, a Tyvek seal is located between the propellant compartment and the booster/AI pouches, along with a tiny hole in the side of the AI pouch. The rate of moisture exchange among components across the barrier and tiny hole and the total quantity of moisture movement can depend on the cycle speed. Other OEM PSPI-X inflators use a metal foil in place of a Tyvek seal on the AI pouch. The metal foil is less permeable than the Tyvek seal, which further reduces the rate of moisture transport among the inflator compartments, although moisture exchange between the propellant and headspace still occurs.
In PSDI-X inflators, there is only one booster containing AIB, no AI pouch, and both the primary and secondary propellant compartments contain 2004L and 13X. Because the 13X desiccant and 2004L propellant tablets are in contact with each other in PSDI-X inflators, moisture exchange between 2004L and 13X can be significantly faster than in PSPI-X inflators. This can result in highly localized propellant damage at contact points due to deliquescence under fast temperature cycling conditions in laboratory testing, but this has not been observed to date in Honda PSDI-X inflators recovered from the field. For Honda PSDI-X inflators, the booster tube contains an aluminum tape seal that slows down moisture communication. The secondary compartment has a press-fit seal that has a higher moisture exchange rate with the primary compartment. Some other OEM inflators do not have a barrier between the booster compartment and the primary propellant chamber, reducing moisture transport resistance.
At the inflator level, the moisture ingress characteristics are determined by the sealing mechanisms, ultimately controlling the amount of time it takes for the inflator internal headspace humidity to equilibrate with the environment. PSPI-X and PSPI-L have similar sealing mechanisms (initiator O-ring, closure O-ring, and vent hole tape seals) and have similar rates of ingress/egress through these seals.
For PSDI-X, the sealing mechanisms include welding rather than the equivalent of the closure O-ring on PSPI-X/PSPI-L inflators, which appears to result in an ingress rate that is approximately an order of magnitude lower for PSDI-X than the PSPI-X inflators.
Both 2004 and 2004L propellants can degrade by various modes, which result in porosity degradation that can be observed by mercury intrusion porosimetry (MIP).5 These degradation
5 MIP is a technique that enables measurement of the pore volume associated with a characteristic pore diameter by
forcing mercury (a non-wetting fluid) into the pores at increasing pressure (see Measurements and Testing section).

1900985.000 – 2467 11
modes were evaluated to assess which mode(s) are experienced by desiccated -X inflators under field-relevant conditions. These modes are described below and shown in Figure 6.
• Mode 1 – Growth of only very small pores (typically < 0.1 micron) has been observed in very high temperature holds of some propellants. Porosity growth under these conditions is not field relevant because the temperatures under which this has been observed are well above those encountered in field conditions.
• Mode 2 – Growth of pores consistent with an MIP-based intermediate pore size range of 0.008-2 microns. The growth of pores in this range are correlated with growth of physical features such as wafer OD.
– This mode of degradation is correlated with the development of porosity sufficient to cause anomalous burning/excursions under conditions that may lead to inflator rupture.
– Mode 2 degradation occurs in field-relevant conditions.
• Mode 3 – Progressive growth of pores 2-10 microns, typically indicative of limited exposure to a high humidity condition, as was observed in some accelerated life cycle testing of custom-built PSPI-X inflators with high moisture content. Mode 3 was also observed in localized regions of direct contact of 13X with propellant tablets in some of the ‘other OEM’ PSDI-X inflators collected from the field.
• Mode 4 – More aggressive form of exposure to moisture than other modes and involves deliquescence. Porosity growth occurs notably in pore sizes greater than 10 microns. This mode has only been observed during fast cycling and not under any field relevant cycling conditions for -X inflators used in Honda vehicles.
Figure 6. Modes of degradation observed in the study of 2004L under various accelerated aging conditions. The plots at the bottom of each column represent MIP data indicative of the pore size distribution within the aged propellants.
Mode 2 degradation is capable of leading to anomalous burning of the 2004L propellant that can lead to overpressures or rupture of the inflator. After accelerated life testing (large temperature

1900985.000 – 2467 12
change, short duration cycles), bomb test pressure excursions and inflator ruptures were observed for PSPI-X propellants/inflators. Bomb test pressure excursions for propellants from cycled PSDI-X inflators were observed as well. Figure 7 shows the internal chamber pressure traces during inflator deployment for a field PSPI-X inflator from a Florida vehicle that was subsequently cycled without modification in a 4-hour, 2-80°C temperature cycle for 2350 cycles. Under these conditions, the
propellant wafers were observed to have increased OD by CT and the primary chamber ruptured during deployment. MIP analysis of related inflators from the same cycling conditions demonstrated that only Mode 2 type degradation was present in the propellant.
Figure 7. Degradation observed in -X series inflators under laboratory accelerated cycling conditions leading to an inflator rupture.

1900985.000 – 2467 13
Measurements and Testing
As in the analysis of non-desiccated inflators, the evaluation of propellant aging in desiccated inflators requires calculating the cumulative moisture content changes in the propellant with each temperature/humidity cycle. The changes in moisture content depend on the same factors that affect non-desiccated inflators, including equilibrium relative humidity over the range of temperatures of interest for all inflator materials, the geometry of the propellant and headspace for each chamber, the permeability to moisture infiltration into the inflator and between chambers, and environmental temperature and humidity conditions, among other factors. In addition, knowledge of the propellant burning characteristics and porosity changes with cumulative moisture flux is needed to establish limiting exposure conditions that could lead to potential overpressure or rupture during deployment. The primary techniques from prior studies were used, including Karl Fischer (KF) titration (to measure water content), methods to measure equilibrium relative humidity (ERH), dimensional analysis (e.g. wafer OD), mercury intrusion porosimetry (MIP), 57 mL chamber bomb testing, and full inflator deployments. In addition, the behavior of the desiccant and differences in the moisture transport properties of the two propellants necessitated new techniques to gain further insight into the aging process. As part of the process of understanding the development of porosity, new and different methods of analysis were employed, including CT visualization of propellants after having MIP performed, micro-CT, and grain size analyses on virgin and aged propellants to investigate the effects of aging on grain size. This section discusses these techniques and the insight provided into aging of 2004L propellants.
Desiccated inflators harvested from the field exhibited minimal to no degradation. The absence of significant degradation in field inflators necessitated the development of additional field-relevant accelerated cycling programs and analysis techniques to provide a means for relating environmental exposure to propellant degradation rates. At the end of this section, the results of the aging programs are discussed.
Inflator Headspace Relative Humidity: Indicator of Inflator Moisture Level
Initial studies of inflator headspace relative humidity (RH) were performed and indicated that until the desiccant (13X) became saturated, the headspace RH would be low. The relatively low moisture-carrying capacity of the 2004L and AIB materials in desiccated inflators, as well as the complex moisture sorption behavior of 13X, render a complete live dissection followed by KF titration of each component less efficient than measuring inflator RH for determining the current condition of a given inflator and its propensity for experiencing some level of propellant degradation.
The simplicity of the inflator RH measurement makes it a highly efficient screening procedure for identifying whether propellant degradation may have started. In desiccated inflators, when the headspace RH is 0%, no propellant degradation is possible under field-relevant conditions because all the moisture available for exchange/movement is effectively sequestered in the 13X desiccant. When the headspace RH exceeds 0%, propellant degradation can begin because free moisture is available for movement into and out of the 2004L propellant. After extended exposure in the field, the inflator has a room temperature RH that is characteristic of the environment from which it was recovered. The equilibrium RH at room temperature is limited by the formation of hydrates in the booster, though for brief periods during cycling, the RH can rise above the hydrate-forming level because the moisture is not absorbed instantly into the AIB and 2004L materials. Importantly, in
1900985.000 – 2467 14
laboratory testing, the rate of propellant degradation (i.e. porosity growth per cycle) increases with increasing inflator RH.
Mercury Intrusion Porosimetry: Determining Pore Size Range for Field-Relevant Aging
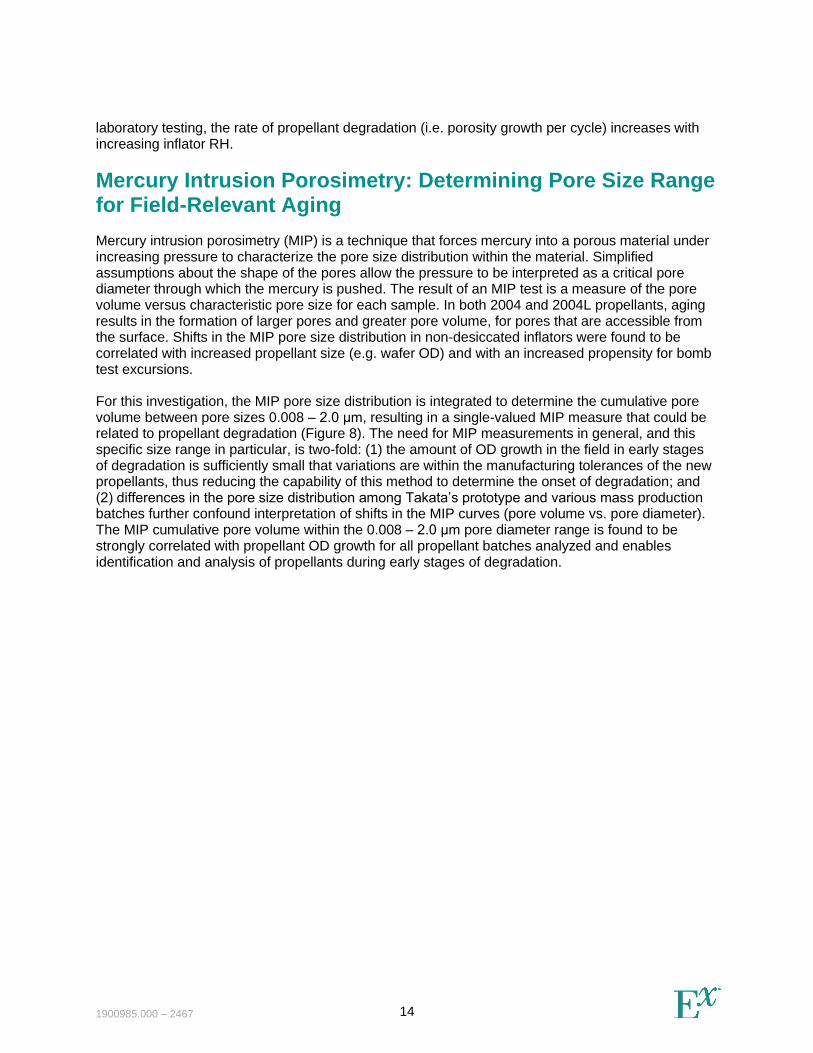
Mercury intrusion porosimetry (MIP) is a technique that forces mercury into a porous material under increasing pressure to characterize the pore size distribution within the material. Simplified assumptions about the shape of the pores allow the pressure to be interpreted as a critical pore diameter through which the mercury is pushed. The result of an MIP test is a measure of the pore volume versus characteristic pore size for each sample. In both 2004 and 2004L propellants, aging results in the formation of larger pores and greater pore volume, for pores that are accessible from the surface. Shifts in the MIP pore size distribution in non-desiccated inflators were found to be correlated with increased propellant size (e.g. wafer OD) and with an increased propensity for bomb test excursions.
For this investigation, the MIP pore size distribution is integrated to determine the cumulative pore volume between pore sizes 0.008 – 2.0 μm, resulting in a single-valued MIP measure that could be related to propellant degradation (Figure 8). The need for MIP measurements in general, and this specific size range in particular, is two-fold: (1) the amount of OD growth in the field in early stages of degradation is sufficiently small that variations are within the manufacturing tolerances of the new propellants, thus reducing the capability of this method to determine the onset of degradation; and (2) differences in the pore size distribution among Takata’s prototype and various mass production batches further confound interpretation of shifts in the MIP curves (pore volume vs. pore diameter). The MIP cumulative pore volume within the 0.008 – 2.0 μm pore diameter range is found to be strongly correlated with propellant OD growth for all propellant batches analyzed and enables identification and analysis of propellants during early stages of degradation.

1900985.000 – 2467 15
Figure 8. MIP cumulative pore volume vs. wafer OD (in mm) for all PSPI-X inflators (field and laboratory-aged) demonstrating the strong correlation for the total volume of pores within 0.008 - 2.0 μm (dark blue bars).
Mercury Intrusion Visualization: Monitoring Progression of Pore Formation
The MIP technique was further extended to monitor the progression of porosity growth within propellants by combining this technique with X-ray computed tomography (CT). The mercury provides a very strong contrast to the propellant material due to its relatively high absorption of X-ray radiation. The CT scans of propellants previously subjected to MIP allow for a three-dimensional visualization of the extent of porosity in different regions of the material. By making assumptions about the attenuation of X-rays with mercury concentration, the local porosity can be estimated from the brightness of each voxel (a voxel is a volume element for which the X-ray intensity has been assessed through the CT process). Thus, a CT scan with a nominally 10 - 20 μm voxel resolution on a typical laboratory CT instrument can provide information about the localized porosity, even for pores less than a micron in size.
Using this technique, the complex, inhomogeneous nature of the propellants and the progression of porosity growth with age can be observed directly (Figure 9). This analysis provides strong evidence that pore formation initiates at the outer boundary of the propellant, confirming the need to address the inhomogeneity of propellant degradation, including the faster degradation rate at the surface. This will be further discussed in the modeling section of this report.


1900985.000 – 2467 17
Figure 10 shows bomb test data from wafers recovered from one virgin and two cycled PSPI-X inflators. In the nominal wafer bomb test with virgin wafers, the rate of pressure rise remains relatively constant before tapering off near the peak. In the bomb tests of cycled wafers, a pressure excursion is observed as a significant increase in the slope of the curve. The increase in rate of pressure rise corresponds to an increase in the burn rate. In the high-pressure excursion, the excursion occurs at a pressure of approximately 70 MPa with this sample. If the pressures during the tests had remained below ~70 MPa, no excursion would have been observed. Propellant with bomb test pressure excursions of this type are not expected to cause an overpressure (or rupture) when deployed in an inflator because the inflator operation pressure is typically near or below 45 MPa. In the low-pressure excursion, the increased burn rate occurs within operating pressures of the inflator. This means that had the inflator with this propellant been deployed, overpressure or rupture could have occurred.
Figure 10. Bomb test data with nominal pressure rise, high-pressure excursion and low-pressure excursion (left). Typical PSPI-X primary chamber deployment pressure (right).
X-Ray Micro-Computed Tomography: Structural Characteristics of Pores
To understand the shape and distribution of pores at submicron resolution, a high-resolution method was employed to visualize the propellant microstructure directly by micro-computed tomography (micro-CT) (Figure 11). The technique was only practical over a narrow field of view (~1 mm3) but revealed that the total porosity increases during aging by growth of pore clusters of increasing size and complexity rather than by shrinking of grains.

1900985.000 – 2467 18
Figure 11. Micro-CT scans of a selected region within a virgin tablet compared with a degraded tablet from laboratory accelerated aging.
The porosity at the surface can be visualized directly with scanning electron microscopy. At the surface, inter- and intra-granular cracks can be identified at many locations (Figure 12). Generation of these cracks is consistent with a process in which the propellant wafer or tablet expands in size through increased spacing between grains. The expansion is driven by moisture movement through the surface. Increasing the spacing between grains through cracking (pore formation) is first observed by MIP CT visualization around the outer diameter (Figure 9). Expansion of the inner diameter is constrained by the adjacent inner layers (Figure 12). Thus, porosity growth on the outer diameter would be expected to occur more rapidly than on the inner diameter.
1900985.000 – 2467 19
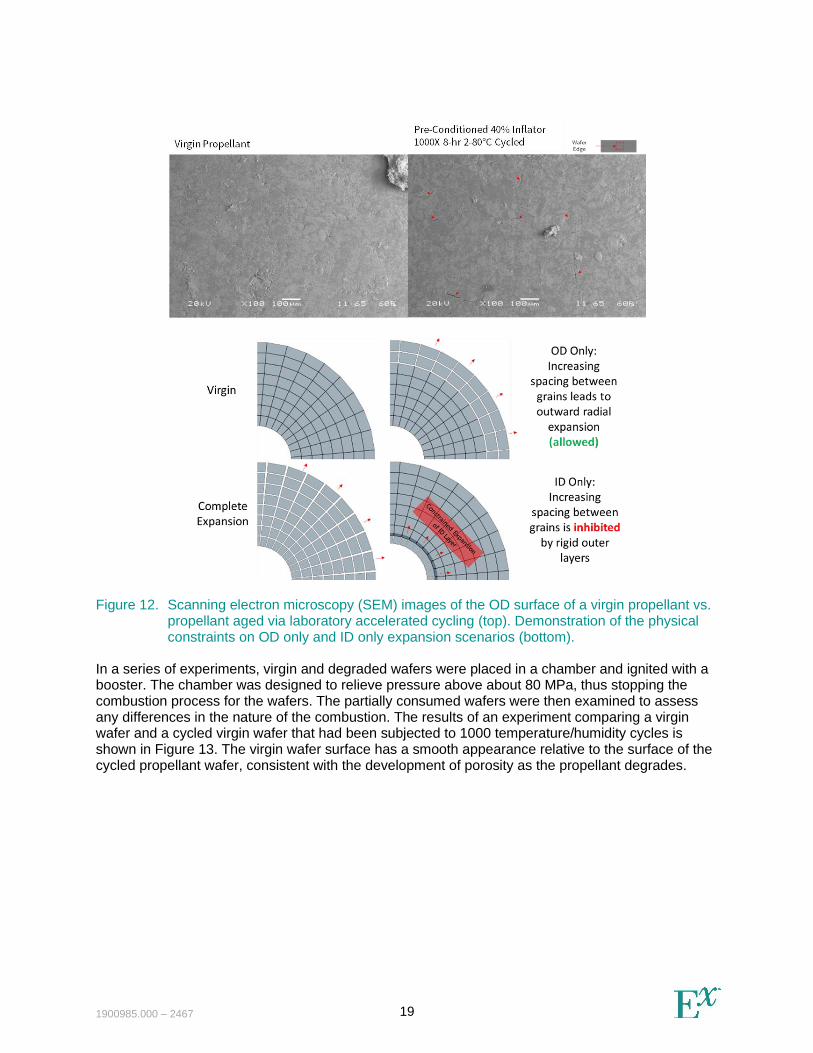
Figure 12. Scanning electron microscopy (SEM) images of the OD surface of a virgin propellant vs. propellant aged via laboratory accelerated cycling (top). Demonstration of the physical constraints on OD only and ID only expansion scenarios (bottom).
In a series of experiments, virgin and degraded wafers were placed in a chamber and ignited with a booster. The chamber was designed to relieve pressure above about 80 MPa, thus stopping the combustion process for the wafers. The partially consumed wafers were then examined to assess any differences in the nature of the combustion. The results of an experiment comparing a virgin wafer and a cycled virgin wafer that had been subjected to 1000 temperature/humidity cycles is shown in Figure 13. The virgin wafer surface has a smooth appearance relative to the surface of the cycled propellant wafer, consistent with the development of porosity as the propellant degrades.

1900985.000 – 2467 20
Figure 13. Optical images, CT scans, and pressure traces of propellants partially burned during bomb testing. Burning was ceased via a burst disc nominally activated at 80 MPa. The images highlight the differences in surface roughness during the burning.
Grain Size Analysis: Features of Aged Propellants
Grain size image segmentation (a technique used to study grains in metals) was performed at different locations within polished cross-sections of virgin and degraded propellants. The purpose of this analysis was to assess whether pore formation was the result of coalescing of adjacent grains. Because wafers and tablets are compressed, some voids can exist at grain boundaries. Coalesced grains might be expected to result in larger pores. While a small shift in the grain size distribution (to smaller equivalent diameters) is visually discernable (see Figure 14), such a shift is not considered statistically significant. The grain size analysis did not provide evidence to support grain coalescence as the process by which pores form during temperature and humidity cycling.

1900985.000 – 2467 21
Figure 14. Representative segmentation on polished cross-sections of virgin vs. degraded 2004L propellants. Propellants were degraded in laboratory accelerated cycling.
Equilibrium Relative Humidity Characterization
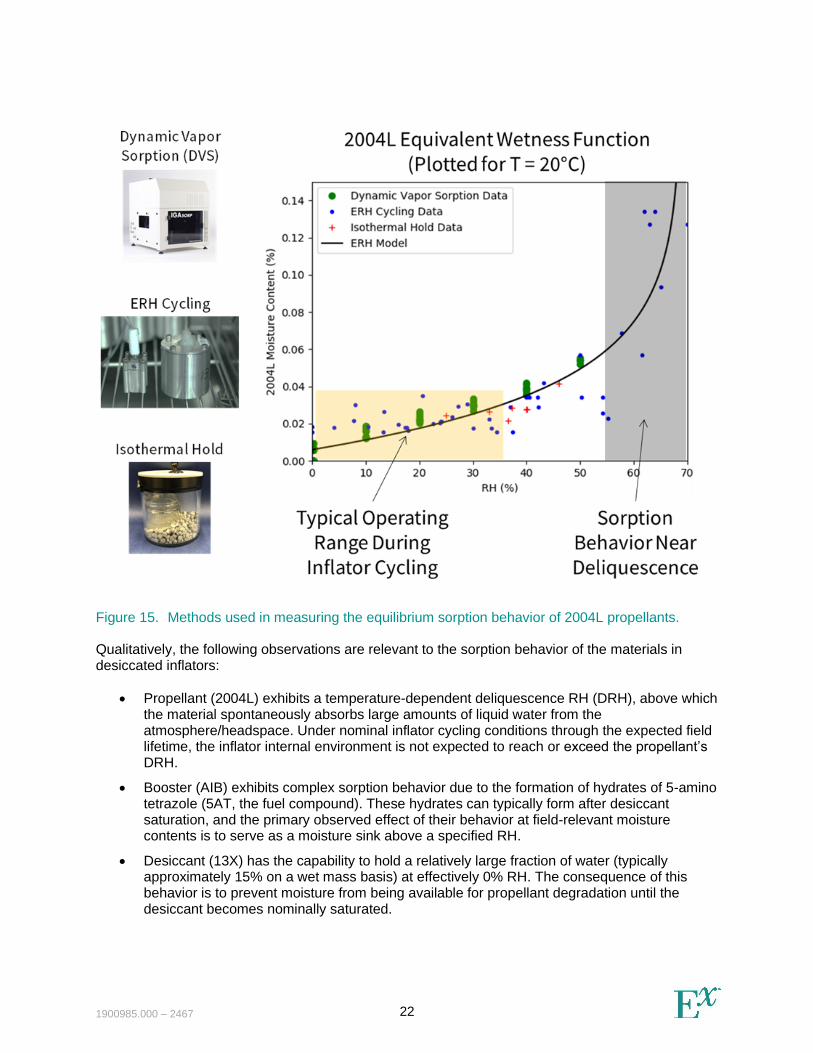
Modeling moisture exchange among components within inflators requires quantifying the equilibrium relative humidity for different temperature and surface moisture conditions. The fundamental moisture equilibrium properties were measured for each of the inflator materials using a combination of techniques, including closed chamber equilibrium relative humidity (ERH) cycling (as was done previously in the non-desiccated inflator analysis), dynamic vapor sorption (DVS), and isothermal holds of materials in an RH-controlled headspace followed by KF titration (Figure 15). Using these techniques, relationships between moisture content, temperature, and relative humidity were formulated. These formulations were derived for operating conditions expected to occur in field-relevant conditions. Some variations in these properties were noted from test sample to test sample, but the variation was not a significant factor in the end result of the modeling.
1900985.000 – 2467 22
Figure 15. Methods used in measuring the equilibrium sorption behavior of 2004L propellants.
Qualitatively, the following observations are relevant to the sorption behavior of the materials in desiccated inflators:
• Propellant (2004L) exhibits a temperature-dependent deliquescence RH (DRH), above which the material spontaneously absorbs large amounts of liquid water from the atmosphere/headspace. Under nominal inflator cycling conditions through the expected field lifetime, the inflator internal environment is not expected to reach or exceed the propellant’s DRH.
• Booster (AIB) exhibits complex sorption behavior due to the formation of hydrates of 5-amino tetrazole (5AT, the fuel compound). These hydrates can typically form after desiccant saturation, and the primary observed effect of their behavior at field-relevant moisture contents is to serve as a moisture sink above a specified RH.
• Desiccant (13X) has the capability to hold a relatively large fraction of water (typically approximately 15% on a wet mass basis) at effectively 0% RH. The consequence of this behavior is to prevent moisture from being available for propellant degradation until the desiccant becomes nominally saturated.

1900985.000 – 2467 23
Propellant Diffusivity
The diffusivity of 2004L propellant was determined gravimetrically by measuring the rate of mass uptake or the loss of moisture under constant relative humidity conditions. Samples of propellant, pre-conditioned at a constant RH, were placed in a mesh basket on an analytical balance with a resolution of 0.01 mg. The balance was placed within an environmental chamber to maintain constant temperature. Relative humidity was held constant using a saturated salt solution of magnesium nitrate, magnesium chloride or lithium chloride. The published RH properties of these salts are shown in Figure 16. Temperature, humidity, and the mass of the sample were monitored during the test until a constant mass was achieved, which indicated that the wafers and headspace were in equilibrium and no more moisture transport was taking place. A schematic of the measurement setup is shown in Figure 16.
The gravimetric uptake experiments were simulated using a numerical diffusion equation solver by prescribing a fixed RH boundary condition and computing moisture uptake/release over time. Simulations were performed for varying diffusivities and the calculated change in mass was compared to the measurements for different RH conditions, as shown in Figure 17. The diffusivity of
the 2004L wafers was determined to be 𝐷2004𝐿 ∼ 3 × 10⁻¹¹𝑚2/𝑠.
Figure 16. Published relative humidity above various salt solutions (left). Diffusivity measurement setup (right).

1900985.000 – 2467 24
Figure 17. Gravimetric diffusion experiments (plotted in black) and simulations with varying assumed moisture diffusivities. Two sequential experiments at different environmental
conditions are shown. Experiment and simulations align at 𝐷2004𝐿 ∼ 3 × 10⁻¹¹𝑚2/𝑠.
Moisture Ingress and Migration Measurements Through Seals
Moisture ingress tests were performed to quantify the rates at which moisture migrates into the inflator through external seals, and the rates of migration through seals between compartments within the inflator. Examples of how the ingress experiments were performed are shown in Figure 18. This technique was previously used to determine ingress rates through seals for non-desiccated inflators. The results of these experiments were rates of moisture migration through the seal per unit difference in absolute humidity.
The concept behind these experiments was to place a small, pre-weighed breathable container of 13X inside a test chamber (composed of a section of an inflator). The chamber was designed so that the only route for moisture migration was through the specific seal being studied. The test chamber was then placed in an environment with high constant relative humidity (90%) and constant temperature. The temperature was typically elevated (65°C) to ensure a high absolute humidity
gradient across the seal of interest. At the end of the test period, the test chamber was opened and the 13X container was weighed. The rate of infiltration through the seal was calculated based on the change in weight of the 13X, the relative difference in absolute humidity across the seal, and the duration of the experiment,

1900985.000 – 2467 25
Figure 18. Example of the experimental method employed to measure moisture ingress and migration through inflator seals.
Moisture migration between inflator subcompartments was measured by placing the subcompartments (e.g. booster chamber or AI pouch) in a controlled high humidity environment and directly weighing over time. The subcompartments were dissected from live inflators in a manner that preserved the relevant communication paths (e.g. the Tyvek seal on a PSPI-X booster vent). The presence of booster material and/or desiccant maintained the internal headspace humidity of the subcompartment at a level known from the component ERH characteristics, allowing the absolute humidity gradient to be calculated. From repeated mass measurements over time after steady mass uptake was observed, the rate of moisture migration through the subcompartment seal was calculated.
Field Survey
To monitor the state of inflators in the field and to investigate potential field-relevant modes of degradation, a collection program was initiated to gather inflators from vehicles within targeted regions of the country. Field parts were collected by Honda from vehicles brought to the dealership. In addition, Exponent harvested additional inflators from vehicles in salvage yards. The region of the country assigned to each inflator was based on the last known location for the vehicle. The inflator age was based on its date of manufacture and date of collection. For Honda inflators, manufacturing dates of 2011 or later for PSPI-X and 2011 or later for PSDI-X inflators were collected. For other vehicle makes, the manufacturing years varied.
The headspace RH was measured to efficiently infer the moisture level in all inflators. The last known location and inflator age were used in combination with the RH measurements to determine the region and age dependence of desiccant saturation. A subset of inflators was then selected for dissection, typically those with the greatest field exposure and highest moisture level, with the goal of identifying any early signs of degradation.
For PSPI-X inflators, the only evidence of MIP/OD-based degradation was observed in 9-year-old inflators from another OEM. No measurable degradation based on MIP or OD could be observed in Honda inflators to date (Figure 19). For Honda inflators, substantial levels of inflator saturation in the population were observed starting at about 4 years of exposure in the field (see Figure 19).

1900985.000 – 2467 26
Figure 19. State of the field (moisture level and propellant degradation) for PSPI-X inflators.
For PSDI-X inflators, only slight evidence of MIP degradation was observed in 8-year-old other OEM inflators, whereas no degradation based on MIP or OD was observed in Honda inflators measured to date (Figure 20). Desiccant saturation in Honda PSDI-X inflators is observed to be significantly slower compared to other OEM PSDI-X and Honda PSPI-X inflators. This is likely due to different ingress characteristics and sealing mechanisms, such as the aluminum tape seal between the booster and primary chamber in Honda PSDI-X inflators that is omitted in other OEM PSDI-X inflators.
Figure 20. State of the field (moisture level and propellant degradation) for PSDI-X inflators.
1900985.000 – 2467 27
Laboratory Accelerated Aging of Inflators
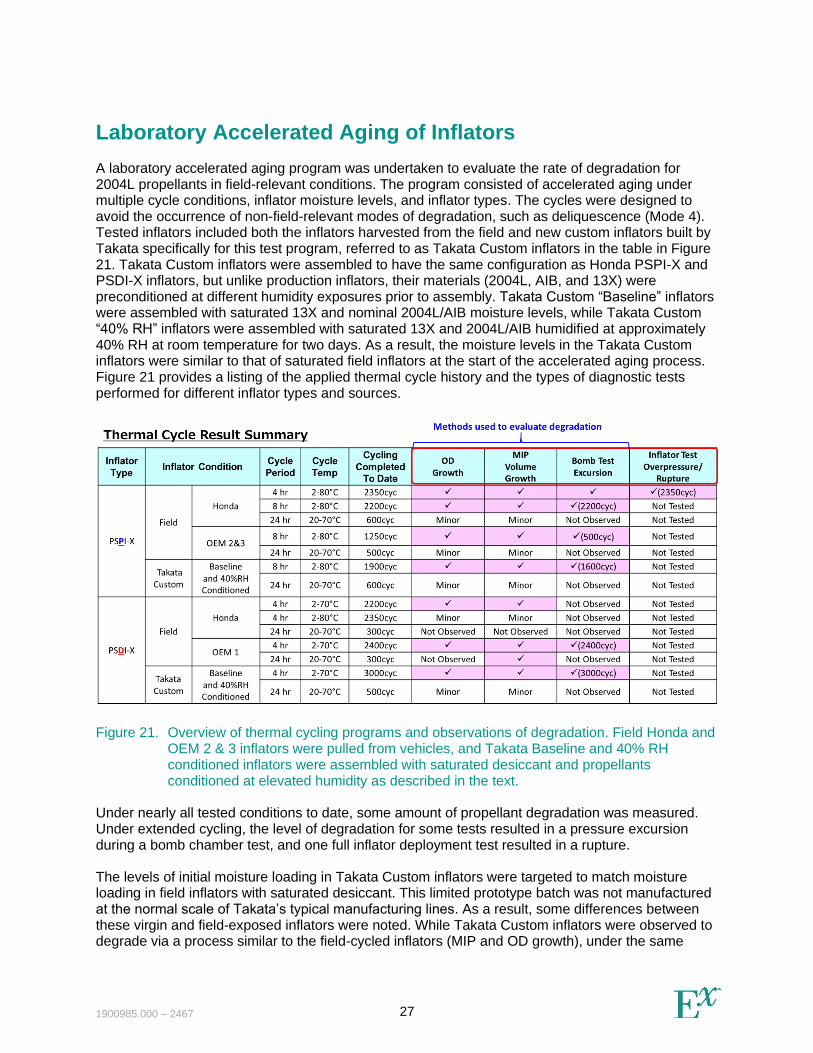
A laboratory accelerated aging program was undertaken to evaluate the rate of degradation for 2004L propellants in field-relevant conditions. The program consisted of accelerated aging under multiple cycle conditions, inflator moisture levels, and inflator types. The cycles were designed to avoid the occurrence of non-field-relevant modes of degradation, such as deliquescence (Mode 4). Tested inflators included both the inflators harvested from the field and new custom inflators built by Takata specifically for this test program, referred to as Takata Custom inflators in the table in Figure 21. Takata Custom inflators were assembled to have the same configuration as Honda PSPI-X and PSDI-X inflators, but unlike production inflators, their materials (2004L, AIB, and 13X) were preconditioned at different humidity exposures prior to assembly. Takata Custom “Baseline” inflators were assembled with saturated 13X and nominal 2004L/AIB moisture levels, while Takata Custom “40% RH” inflators were assembled with saturated 13X and 2004L/AIB humidified at approximately 40% RH at room temperature for two days. As a result, the moisture levels in the Takata Custom inflators were similar to that of saturated field inflators at the start of the accelerated aging process. Figure 21 provides a listing of the applied thermal cycle history and the types of diagnostic tests performed for different inflator types and sources.
Figure 21. Overview of thermal cycling programs and observations of degradation. Field Honda and OEM 2 & 3 inflators were pulled from vehicles, and Takata Baseline and 40% RH conditioned inflators were assembled with saturated desiccant and propellants conditioned at elevated humidity as described in the text.
Under nearly all tested conditions to date, some amount of propellant degradation was measured. Under extended cycling, the level of degradation for some tests resulted in a pressure excursion during a bomb chamber test, and one full inflator deployment test resulted in a rupture.
The levels of initial moisture loading in Takata Custom inflators were targeted to match moisture loading in field inflators with saturated desiccant. This limited prototype batch was not manufactured at the normal scale of Takata’s typical manufacturing lines. As a result, some differences between these virgin and field-exposed inflators were noted. While Takata Custom inflators were observed to degrade via a process similar to the field-cycled inflators (MIP and OD growth), under the same

1900985.000 – 2467 28
cycling conditions, the rate of degradation for Takata Custom inflators was generally faster than inflators harvested from the field that were subjected to thermal cycling (Figure 22). The Takata Custom inflators were prepared differently than mass production inflators, specifically with respect to material moisture control and compaction, and other differences may also exist.
Figure 22. Differences in the observed degradation rate between the Takata Custom population and the field inflator population.
During the accelerated aging programs, inflators developed varying levels of degradation (i.e. OD or MIP growth). To normalize the observed degradation across different accelerated cycling conditions, the cumulative moisture movement through the propellant was quantified via modeling. The results of different cycling conditions were then combined and used to develop correlations between cumulative moisture flux and the onset of pressure excursions or ruptures. Because the Takata Custom inflators had different degradation rates than inflators harvested from the field, only field inflator populations were used for predictions of field-relevant degradation rates.

1900985.000 – 2467 29
Modeling of Moisture Diffusion
Introduction
In the original model presented in the July 2016 report,6 moisture transport between components (propellant, booster, autoignition), chambers (primary, secondary, boosters, autoignition pouch), and the environment was calculated for non-desiccated, 2004-based inflators. It was demonstrated that moisture movement—or flux in and out of 2004 propellants—was correlated with porosity growth in the propellant. Propellant moisture flux was calculated for multiple weather stations within the United States. Using a combination of field data and calculated moisture flux, the minimum amount of moisture flux with the potential to result in rupture was found to be about 8%.
The composition of 2004L propellant used in desiccated inflators (PSPI-X and PSDI-X) differs from the composition of the previously studied 2004 propellant. One of the significant differences between the materials is the rate at which moisture can migrate through the bulk of the material, a process known as diffusion. Moisture diffuses so slowly through 2004L propellant that moisture concentrations within the bulk of the wafers or tablets do not reach equilibrium during diurnal cycles, and much less so during accelerated life testing in which even shorter cycles are used. To properly account for the effects of diffusion, a new module was added that models the distribution of moisture concentrations and changes to the distribution with time within the propellant. This section describes how the diffusion process was modeled and how it was integrated into the model of the entire inflator.
As part of the update to the original model, the bulk ERH and moisture uptake were measured for each of the components of -X desiccated inflators, including 2004L propellant, AIB booster/autoignition material, and 13X desiccant. 13X was not part of the original model but was added to the updated model as a new element. The measurements of propellant diffusivity indicate that 2004L diffusivity was about 10x slower than the diffusivity for 2004 propellant. Consequently, moisture does not fully penetrate the 2004L propellant even in long (diurnal) cycle times. The low diffusivity of 2004L means that moisture concentrations do not become uniform throughout the bulk of the material under meaningful cycle times. To account for the effects of spatial variability within the propellant, a numerical “diffusivity model” was developed for the propellant instead of the bulk wetness and moisture uptake used in the 2004 model. The diffusivity model was added to the full inflator model to compute spatially-resolved propellant moisture content and moisture transpiration from the surface of the propellant. Due to the lack of measured field degradation, the flux calculated by the model was correlated to propellant degradation, and to overpressure and rupture of laboratory-cycled field inflator samples. The model was applied to predict moisture flux for PSPI-X and PSDI-X inflators cycled under controlled laboratory conditions with cycle speeds ranging from 4 to 24 hours. Based on these simulations, the rate of degradation did not scale with bulk moisture flux in the propellant in a consistent manner across different cycle speeds, with faster cycles (shorter cycle period) undergoing much faster degradation.
With the very low diffusivity measured for 2004L, the spatially-resolved model indicates that under fast cycling, a much smaller volume of propellant is affected by moisture flux. The flux per unit mass calculation was revised to reflect only the volume of propellant affected by the moisture flux. This revised measure was labeled “effective flux”. Re-scaling the total moisture flux per unit mass in this
6 Investigation of Takata Inflator Ruptures, Exponent, Inc., July 2016.


1900985.000 – 2467 31
calculates the inflator temperature. Based on these temperatures, the model calculates moisture movement between inflator components and the headspaces, and moisture migration through the bulk of the propellant. In addition, moisture ingress from the environment and moisture movement between chambers are also calculated at each time step.
Figure 24. Model flow diagram.
Diffusion Model
In the original model for non-desiccated 2004 inflators, the moisture content of 2004 propellant was treated as bulk material with a uniform, average moisture content. An empirically-derived moisture uptake rate was calculated. To develop a deeper understanding of the effects of moisture flux and the distribution of moisture within the slow diffusivity 2004L propellant, a two-dimensional, axisymmetric diffusion model of the 2004L propellant was incorporated into the inflator model. In this model, a half cross-section of a 2004L tablet or wafer is discretized into 22 cells radially and 11 cells vertically, assuming symmetry around the rotational axis of the wafer or tablet and about the horizontal midline of the propellant, as shown in Figure 25.
In the diffusion model, the boundary condition is defined by setting the surface moisture content to the equilibrium wetness (EW) that would produce an ERH equal to the headspace relative humidity. This ensures that the surface moisture content of the wafer/tablet is always in equilibrium with the headspace. The distribution of the moisture within the propellant and the moisture uptake is then computed by solving the axisymmetric diffusion equation:

1900985.000 – 2467 32
𝜕𝑐
𝜕𝑡= 𝐷 (
𝜕2𝑐
𝜕𝑟2+1
𝑟
𝜕𝑐
𝜕𝑟+𝜕2𝑐
𝜕𝑧2)
where c is the concentration in mass of water per unit volume (the code is executed in SI units), D is the diffusivity of water within the material (units of length squared per time), t is time, r is the radial coordinate (distance perpendicular to the axis of symmetry), and z is the axial coordinate (position in the thickness direction of the wafer, parallel to the axis of symmetry).
Figure 25. Schematic of the 2004L diffusion model.
In addition to the bulk propellant moisture content and propellant moisture flux, the diffusivity model calculates a spatially resolved flux and moisture content at each model time step.
Results
Propellant flux, primary chamber RH, absolute humidity (AH), 2004L moisture content, and 13X moisture content are shown in Figure 26 for the 8-hour, 2-80°C cycle of a PSPI-X primary chamber
with initial inflator RH conditions of 0, 10, 20 and 30%. Initially, the flux per cycle is higher for inflators with higher initial RH. However, over time the inflators equilibrate with the environment such that after about 2000 cycles, all inflators have at most approximately 20% RH and similar additional flux per cycle. Simulations were also performed for the faster 4-hour, 2-80°C cycle and the slower
24-hour, 20-70°C cycle. Figure 27 shows the distribution of moisture flux within PSPI-X wafers under the 4-hour and 24-hour cycles, respectively. Flux penetrates much deeper into the propellant in the slower cycle, while it is concentrated at the surface during fast cycling. The midplane flux for both cycle types is shown in Figure 28. Similar simulations were performed for all 4-hour, 8-hour and 24-hour cycle times for field and Custom PSPI-X and PSDI-X inflators.

1900985.000 – 2467 33
Figure 26. Results of diffusion simulation for 8-hour, 2-80°C cycling of the PSPI-X primary chamber.
Figure 27. Spatial distribution of 2004L moisture flux for 1000 24-hour, 20-70°C cycles and 2800 4-hour, 2-80°C cycles.

1900985.000 – 2467 34
Figure 28. Midplane moisture flux for 1000 24-hour, 20-70°C cycles and 2800 4-hour, 2-80°C
cycles.
In Figure 29, the measured cumulative pore volume is plotted against the total mass-based flux for Custom PSPI-X and PSDI-X inflators exposed to different cycle conditions. The rate of degradation using total mass-based flux is sensitive to the nature of the cycling and the form factor of the propellant, and thus was not adequate for predicting the amount of cumulative flux that results in overpressure or rupture. In the analysis shown in Figure 29, the Takata Custom inflator population was chosen because all the propellants were produced in the same batch and thus had a consistent starting point.

1900985.000 – 2467 35
Figure 29. Degradation measured with cumulative pore volume plotted against bulk (mass-based) flux for Takata Custom inflators.
Effective Flux
For faster cycles, the total moisture flux is concentrated in a smaller region close to the surface of the propellant tablet or wafer. Similarly, small tablets have a significantly higher surface area to volume ratio; thus, for the same cycle speed, the flux is spread out over a larger fraction of the volume of the propellant. Schematics of this difference are shown in Figure 30 and Figure 31.
To account for the concentration of flux during fast cycling, the affected volume of the propellant (𝑣𝑒𝑓𝑓) was defined as the volume of propellant where the flux is greater than 50% of the total flux into
the propellant. Mathematically, this can be computed by integrating around the wafer:
𝑣𝑒𝑓𝑓 = ∫ℎ(𝑟𝐹𝑙𝑢𝑥>0.5𝐹𝑙𝑢𝑥𝑀𝑎𝑥) × 2𝜋𝑟 𝑑𝑟
where ℎ(𝑟𝐹𝑙𝑢𝑥>0.5𝐹𝑙𝑢𝑥𝑀𝑎𝑥) is the height of affected material at each radial point.
To normalize for different propellant form factors, the effective volume ratio is defined as:
𝑆 =𝑣𝑒𝑓𝑓
𝑉2004𝐿
where 𝑉2004𝐿 is the total propellant volume. A table of these effective volume ratios for various cycle conditions is given in Table 1.
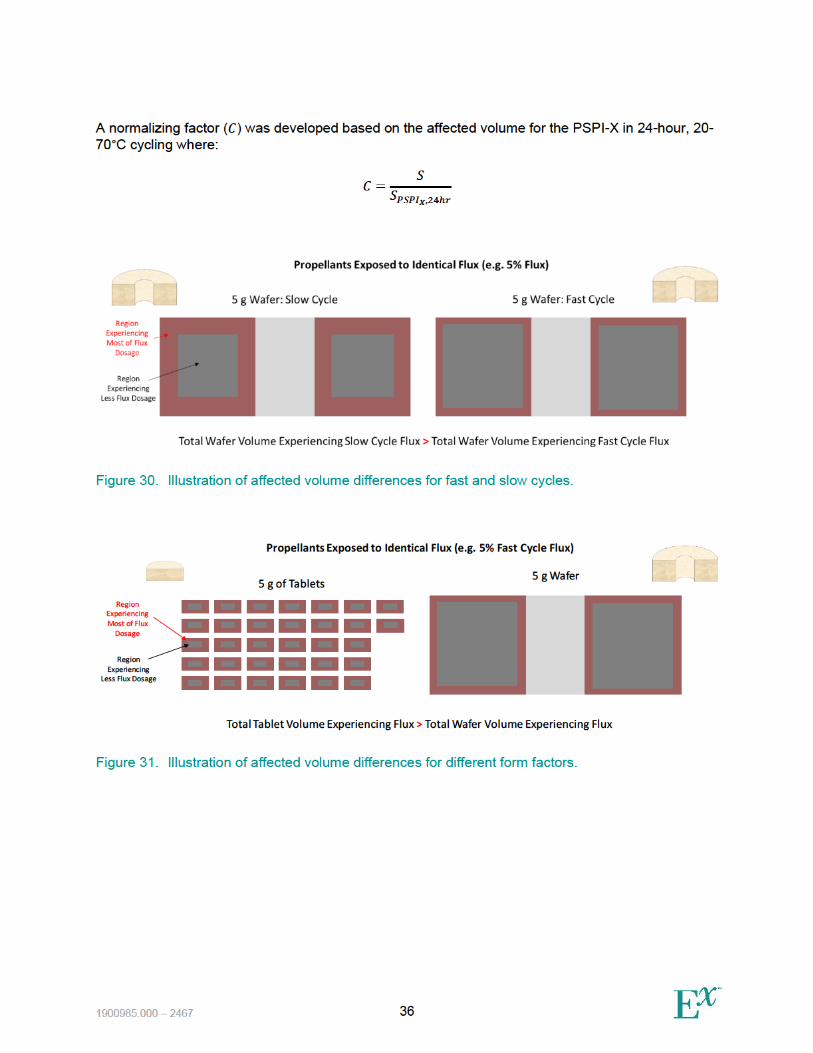


1900985.000 – 2467 38
Figure 32. MIP pore volume and bomb test excursions for cycled field inflators correlated with effective flux for 4-hour, 2-70°C; 8-hour, 2-80°C; and 24-hour, 20-70°C cycles. Null bomb
test excursions correspond to MIP values for which a bomb test was not performed.
Field Simulations
Effective flux calculations were performed using either 16 or 24 years of exposure for all 50 US states and Puerto Rico for the weather station in the state with the highest inflator moisture flux (as calculated with the non-diffusion-based model presented in the June 2016 report). In addition, effective flux calculations were performed for specific cities, including Miami, Florida; Los Angeles, California; and Seattle, Washington. Results of these simulations for specific cities are presented in Figure 33 and Figure 34, in which the variation across climate and inflator types can be clearly observed. For both inflator types, Miami saturates first with rising RH predicted in ~1.5 years in PSPI-X inflators and after ~5 years in PSDI-X inflators in the worst-case conditions. Among the three cities mentioned above, Seattle saturates in the longest period of time and has the lowest increase in flux with time after saturation. When comparing PSDI-X to PSPI-X, the PSDI-X has slower saturation in all locations due to the lower rates of moisture migration through the inflator seals.
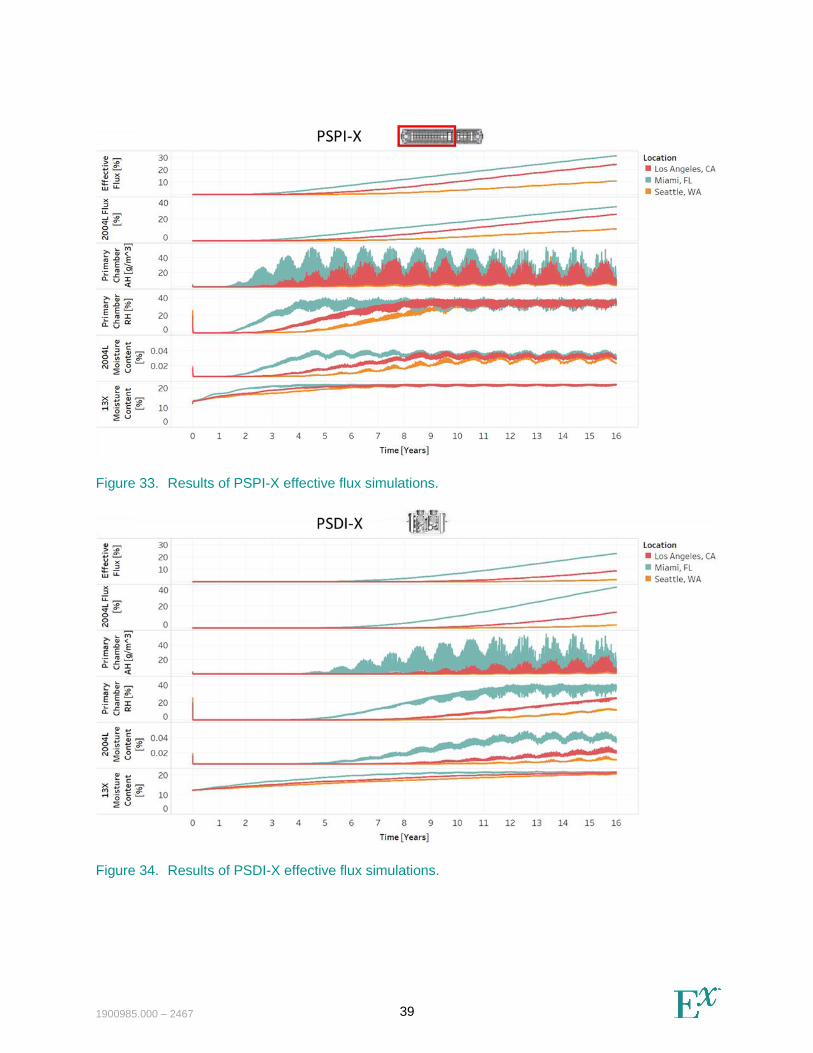
1900985.000 – 2467 39
Figure 33. Results of PSPI-X effective flux simulations.
Figure 34. Results of PSDI-X effective flux simulations.

1900985.000 – 2467 40
Modeling for Service Life Prediction
Due to the lack of propellant degradation in the available field samples of desiccated Honda inflators, a method was needed to predict the regionally-dependent service life of a population of inflators. Field data from both 2004 and 2004L propellant inflators demonstrate large variability in the moisture levels, exposure conditions, and extent of degradation, even for similarly-aged inflators from the same regions of the country. To model this variability, a Monte Carlo approach was taken that predicts the time-dependent probability of observing a bomb test excursion or a rupture based on the primary underlying random processes fit to the data available to date.
The general procedure employed involves a stepwise process as described below. The processes for propellant degradation leading to potential rupture are similar for both PSPI-X and PSDI-X inflators. However, there are less field and laboratory data for Honda PSDI-X inflators, in part due to the significantly smaller proportion of field inflators that were found to be saturated at the time of testing. The precision of any extrapolation-based method, including the Monte Carlo approach employed here, is necessarily limited by the absence of field ruptures. However, the modeling approach used to evaluate the -X inflators is a consistent methodology that can integrate the available laboratory and field data using a combined physics- and statistics-based approach. This methodology incorporates what is known about inflator characteristics and extrapolates that knowledge into the future using reasoned engineering assumptions.
General Procedure for Service Life Prediction
The following steps were employed to model each process involved in the service life prediction procedure. The procedures for passenger and driver inflators were similar, with the primary difference being the underlying data used for each step:
1. For a given total time in service (e.g. 10 years), the time to saturation was calculated using a 2-parameter Weibull model that was fit to field inflator RH measurements across all regions, adjusting for an absolute humidity (AH) characteristic of the region. A random variable was used to estimate the saturation time using this model. The fit to field measurements is shown in Figure 35. The time in service while saturated was then calculated (e.g. 3 years to saturation, leaving 7 years to simulate OD growth).

1900985.000 – 2467 41
Figure 35. Weibull model fits for the time to saturation models for PSPI-X primary chamber and PSDI-X. A total of 920 PSPI-X field measurements from all sampled regions were used for fitting, of which 314 were determined to be effectively saturated (RH > 10%). A total of 806 PSDI-X field measurements from all sampled regions were used for fitting, of which only 13 were observed to be effectively saturated.
2. A predicted MIP pore volume was then calculated as follows:
a. The maximum effective flux per year at a specific location was calculated using the inflator model and local weather station data (Figure 36).
b. The adjusted effective flux per year was then calculated by multiplying the maximum effective flux per year with a randomly-selected percent of full exposure value generated from available Master Engineering Analysis File (MEAF) data for 2004 propellant passenger inflators (Figure 37).
c. The accumulated adjusted effective flux was calculated by multiplying the adjusted effective flux per year (Step 2b) by the time in service while saturated (Step 1).
d. A correlation between MIP pore volume and effective flux was derived using 2004L wafer and tablet data and cyclic testing. This correlation was used to convert the accumulated adjusted effective flux to predicted MIP pore volume (Figure 38).

1900985.000 – 2467 42
Figure 36. The regional effective flux accumulation rate in PSPI-X inflators after desiccant saturation calculated from the inflator moisture model at characteristic weather stations.
Figure 37. Distribution of percent of maximum exposure (i.e. growth rate) using 2004 wafers from MEAF data for 2004 inflators from south Florida (3052 samples of Beta inflators from locations with a latitude < 27.646530).

1900985.000 – 2467 43
Figure 38. Relationship between MIP pore volume (0.008 - 2 µm) and effective flux based on laboratory accelerated cycling of PSPI-X wafers and PSDI-X tablets. The majority of measurements were for wafers, though limited data on tablets was also included. The effective flux for each point on the plot was based on inflator-level moisture modeling using initial moisture content and environmental cycling conditions.
3. The probabilities of excursion and rupture for a given MIP pore volume were calculated using bomb tests of 2004 and 2004L wafers and tablets. Bomb test excursion pressures represent the level of degradation in the propellant. The higher the propellant degradation, the lower the bomb test excursion pressure. The nominal operating pressures for PSPI-X and PSDI-X are 40-45 MPa and 45-50 MPa, respectively. Propellant with bomb test excursion pressures above these pressures will not show any excursion/overpressure when deployed in an inflator. Propellants with bomb test excursion pressures slightly below the maximum nominal operating pressure of the inflator will create an overpressure in the inflator, and those with an excursion pressure substantially below the nominal operating pressure can create an overpressure sufficient to cause inflator rupture. The difference between overpressure versus rupture as an outcome cannot be determined solely from the bomb tests. Other factors, such as inflator headspace and the rate of gasification, can affect whether the excursion would have resulted in rupture or a bulged inflator. For the purposes of probability estimates, any bomb test excursion pressure under 40 MPa was considered to be an inflator rupture, as a conservative assumption. A 3-parameter Weibull model was fit to bomb test data, with and without excursions, to predict the probability of excursion given MIP pore volume (Step 2d) (Figure 39). Next, a 2-parameter Weibull curve was fit to bomb test data with excursions to predict the probability of rupture (excursion pressure < 40 MPa), given an excursion, as a function of MIP pore volume. Further refinements may be possible as more data is collected, such as through a field-monitoring program.

1900985.000 – 2467 44
Figure 39. The 3-parameter Weibull distribution model to predict bomb test excursions based on MIP pore volume. Bomb test data included in the analysis are for 2004 and 2004L wafers and tablets from field and laboratory accelerated cycling conditions for which MIP pore volume was measured. The Weibull distribution (black line) with the data (blue dots showing non-excursion = 0%, excursion = 100%; left). The count of inflators that would experience an excursion were predicted (black line) and compared to the actual count of observed excursions (blue dots; right).
Figure 40. The 2-parameter Weibull distribution model to predict inflator rupture based on MIP pore volume. Bomb test data included in the analysis are for 2004 and 2004L wafers and tablets from field and laboratory accelerated cycling conditions for which MIP pore volume was measured. The Weibull distribution is shown as the black line and the data points are shown as blue dots (left). The count of inflators that would experience a rupture were predicted (black line) and compared to the actual count of observed excursions pressures of < 40 MPa (blue dots, assumed ruptures; right).

1900985.000 – 2467 45
4. The probability of rupture (Step 3) was used to predict the number of projected airbag ruptures each calendar year for inflators installed as original equipment in Honda vehicles registered in Florida. The prediction considered the projected vehicle populations in different calendar years (using registration data and conservative estimates of vehicle registration attrition), along with the rate of airbag deployments per year (from Florida crash data). The 10% and 90% predictions of ruptures assume a binomial distribution that considered the numbers of expected airbag deployments and the probability of rupture.
Regional Predictions
Daily and yearly temperature and humidity fluctuations vary across different regions of the country. Using data from local weather stations, the probability of inflator rupture (if deployed) versus age can be estimated for a specific region. Figure 41 shows a comparison of the probabilities of rupture for PSPI-X inflators with age for five locations in the United States. Miami, Florida, being a hot and humid location, tends to have among the fastest predicted rate of degradation of 2004L when compared with other locations.
Figure 41. Predictions of the probabilities of rupture (given a deployment) with age for PSPI-X inflators in different regions of the country.
To predict how many vehicles will have a deployment and rupture each calendar year, the estimated probabilities of rupture with age (based on the Monte Carlo modeling for each state) can be

1900985.000 – 2467 46
combined with: (1) the current registered populations of vehicles in those states; (2) the expected rates of vehicle attrition with age; and (3) the estimated yearly rate of vehicles with an airbag deployment. A relevant benchmark for prediction is the time to the potential occurrence of the first field rupture. This prediction of time is challenging for multiple reasons, including the complexity of the processes and the limited availability of field data showing degradation, resulting in uncertainty in accurately predicting the tails of the underlying probability distributions.
• Regions of the country, such as Florida, which have elevated humidity and warmer temperature cycles, as well as a large vehicle population, are predicted to have among the earliest incidence of an inflator rupture. For the population of PSPI-X inflators installed as original equipment within the fleet of vehicles in Florida (assuming south Florida weather), the first inflator rupture is not expected before the year 2027.7
• For other states, the time for the first inflator rupture will vary with weather and the vehicle populations in those states. For example, for vehicles in New York, no PSPI-X inflator ruptures are expected before the year 2035.
Ongoing monitoring would provide improved resolution on low frequency events at the tails of the probability distribution to refine the predictions and to improve the ability to detect early onset of degradation. For PSDI-X inflators, insufficient data are available to provide reasonable predictions on the service life. However, based on available field data and modeling, the probability of having sufficient degradation in a PSDI-X inflator that it would rupture if deployed8 is expected to be lower than for equivalently aged PSPI-X inflators.
Comparison of Time to Rupture for Non-Desiccated (PSPI, PSPI-6, and PSPI-L) and PSPI-X Inflators
The purpose of this section is to compare the modeled times to rupture for desiccated PSPI-X inflators, with observed rupture rates for non-desiccated passenger inflators containing 2004 propellant (PSPI, PSPI-6, and PSPI-L) studied in the prior report. As previously discussed, no Honda PSPI-X inflators harvested from the field exhibited any measurable degradation and thus would not have ruptured had they been deployed. However, for PSPI, PSPI-6, and PSPI-L inflators, Takata deployed thousands of inflators of different ages that were harvested from different regions of the United States. Among the Takata test data, ruptures were observed in laboratory deployments of non-desiccated, non-Alpha PSPI, PSPI-6, and PSPI-L inflators, which had aged up to 14 years in Florida at the time of harvesting.9 Within this population of nearly 23,000 laboratory deployed inflators, 283 were reported to have ruptured.
A 2-parameter Weibull distribution was fit to Takata’s non-desiccated inflator rupture data. A comparison of the actual cumulative counts of ruptures versus age to the counts predicted by the Weibull distribution is shown in Figure 42. The Weibull distribution reasonably describes the actual
7 This calculation assumes: an annual vehicle attrition rate of 2% per year, a rate of passenger-side airbag deployments of
0.17% per registered vehicle per year (based on historical Florida crash data for the population of vehicles with PSPI-X inflators), and a 90% confidence interval for counts of ruptures (assuming a binomial distribution that considers the numbers of expected airbag deployments, as discussed in the previous section.)
8 Note that there is a higher rate of driver-side inflator deployments than passenger-side deployments. Further, the
populations of vehicles containing PSDI-X and PSPI-X inflators differs from state to state.
9 Included in this set were inflators installed in Honda vehicles, as well as in BMW, Chrysler, Ford, GM, Mazda, Nissan,
Subaru and Toyota vehicles.

1900985.000 – 2467 47
rupture data collected by Takata for non-desiccated inflators. The calculated rupture rate for these non-desiccated inflators is shown in Table 3. From this table, about 5% of 18-year-old non-Alpha, non-desiccated PSPI, PSPI-6, and PSPI-L inflators harvested from Florida would rupture had they been deployed.
To compare these data with PSPI-X inflators, the Monte Carlo simulation for PSPI-X inflators was run. The simulation found that to reach the same 5% rate of rupture would take an estimated 25 years in service, as shown in Figure 43. The accuracy of this prediction is limited by the lack of observed degradation within the population of tested Honda inflators harvested from the field. This time period could be updated as more data becomes available from an ongoing field monitoring program of PSPI-X inflators, such as the program discussed in Appendix A, if at some point in time propellant degradation is detected in field-returned inflators. However, based on the data available to date, for the population of -X inflators installed as original equipment within the fleet of vehicles in south Florida, an inflator rupture during field use is not expected before the year 2027.
Figure 42. Cumulative counts of ruptures versus age for PSPI, PSPI-L, and PSPI-6 non-Alpha inflators from Florida that were deployed by Takata and the predicted counts of ruptures using a 2-parameter Weibull distribution.


1900985.000 – 2467 49
Findings
• The 2004L propellant will not start degrading until after the desiccant material saturates with moisture. The time for this to occur depends on several factors that include initial moisture content and environmental exposure. On average, PSPI-X inflators were found to saturate in about 4 years in Florida while PSDI-X inflators are predicted to saturate in about 8 years. Time to saturation will be longer for other regions.
• After the desiccant saturates and with continued cyclic environmental exposure, -X inflators may begin to degrade. The rate of degradation is highly dependent on the environmental conditions to which the inflator is exposed.
• The rate of degradation of PSPI-X inflators after desiccant saturation is predicted to be slower than the degradation rate for PSPI-L inflators under similar environmental conditions.
• At certain levels of degradation for both PSPI-X and PSDI-X inflators, validated by laboratory testing, -X inflators begin to have the potential for overpressure. Above this threshold, the probability and magnitude of overpressure increase with increasing level of degradation. Higher magnitudes of overpressure may eventually result in inflator rupture if deployed.
• Variations in degradation rates were found within the field population of 2004-based inflators in a particular region. Using this field data, statistical models of exposure were prepared to represent these variations in moisture influx and environmental exposure and applied for prediction of degradation in 2004L-based inflators.
• Regions of the country, such as south Florida, which have elevated humidity and warmer temperature cycles, are predicted to have among the fastest rate of desiccant saturation and inflator material degradation. For the population of -X inflators installed as original equipment within the fleet of Florida vehicles (assuming south Florida weather), inflator rupture is not expected before the year 2027. In other areas, the simulation results show longer periods until the first rupture is predicted. For example, in New York, the first rupture is not expected before the year 2035.
• At present, for both PSPI-X and PSDI-X inflators, these predictions of inflator service life (or when rupture might occur) are subject to uncertainty because none of the sampled Honda field inflators in this study had any measurable level of degradation. This uncertainty can be reduced and the time to first inflator rupture updated as additional field inflators are collected and analyzed in future years.

1900985.000 - 2467 50
Appendix A: Field Inflator Monitoring and Controlled Testing Program
Objectives
The objectives of a field monitoring and controlled testing program are two-fold. First, the data collected would be used to further validate and refine the models used for predicting regional performance and degradation of inflators. A more refined set of models will result in more precise predictions on when (or if) inflators in different regions have degraded to the point where overpressure/rupture could result if they were deployed. This prediction capability would serve as an early warning in the event that a recall is needed. Second, the data collected in this program will allow for regularly scheduled assessments of the current conditions of field inflators and provide an independent check on whether degradation to the point of overpressure or rupture might be expected among the population of in-use vehicles.
Background
Unlike 2004-based inflators, -X series inflators have insufficient field data on porosity growth after desiccant saturation to document and track field degradation progression. Information on field degradation with time would enable refined lifetime estimations for various regions. The degradation modeling completed to date does not show an imminent rupture probability for passenger or driver -X inflators. The modeling uses a combination of measured physical and chemical properties, fundamental engineering principles, stochastic modeling of environmental exposure conditions, accelerated life cyclic testing, and measurements of degradation that include desiccant saturation, propellant porosity/diameter growth, and pressure profiles during bomb testing or inflator deployment. Further validation of the model and possible refinements can be achieved as more data are collected regarding the rate of porosity growth in response to long-term real-world environmental conditions or controlled long-term temperature cycling. In the case of Honda PSDI-X inflators, in which only a small fraction of inflators were found to have reached fully saturated condition, data from the monitoring program would serve to strengthen the analyses on this important initial stage of inflator aging (time to saturation).
Program Considerations
The proposed testing approach is designed based on the knowledge base of degradation characteristics of 2004L materials in PSPI-X and PSDI-X inflators learned from laboratory accelerated aging programs and fundamental testing. These activities will include the following general considerations and measurement techniques:
1. Samples will be collected from the oldest available inflators in targeted regions. From modeling of inflator moisture flux for different regions of the country (using weather station data), the locations most conducive to propellant degradation and having sufficient sample size are coastal southern regions of Florida and south Texas. Depending on findings from the monitoring program, inflators from other regions may also be collected and studied to augment the analysis, particularly for validating the model’s predictions for regional differences. Sample collection and handling is described in a subsequent section.

1900985.000 - 2467 51
2. Evaluation of the collected inflators will use techniques described in this report. The key lessons from the studies performed to date, as applied to this monitoring program, are described below.
– MIP porosity measurements are the most sensitive measure of propellant degradation among the techniques studied. In particular, MIP Mode 2 growth was found to be a sensitive measure of degradation correlated with the propensity for abnormal combustion that may lead to overpressure or rupture of an inflator, had that inflator been deployed. MIP measurements of field inflators over time, in conjunction with bomb testing, would provide additional data to validate and refine the model, and thus improve the capability of the model to predict when overpressures or ruptures might occur in the future. MIP measurements require live dissection of inflators and destructive testing on the wafer(s) being measured. Consequently, full inflator testing on a dissected inflator is not possible.
– OD measurements (useful only for PSPI-X inflators) are less sensitive than MIP growth to degradation since the amount of OD growth with degradation is small. Furthermore, early signs of degradation cannot be readily distinguished from the variability in the original, as-formed wafer diameter. Nevertheless, non-destructive OD measurements can be made on intact PSPI-X inflators via CT-scanning and serve as a basis for identifying those inflators with higher levels of degraded propellant. As mentioned earlier in the report, the tablets in PSDI-X inflators are too small to effectively measure OD growth.
– Inflator RH measurements allow for rapid screening of inflators that have the potential for degradation (i.e. show RH above desiccant saturation). Under steady state and controlled temperature conditions, the internal humidity of the inflator is indicative of the quantity of moisture available to age the propellant when subjected to temperature cycling. The accumulation of inflator RH statistics over time also allows for refinement of the time-to-saturation models. The technique employed preserves the inflator for either subsequent dissection, deployment, or ongoing aging.
– Bomb testing is a tool to assess whether overpressure or rupture might have occurred in an inflator if it had been deployed. Bomb tests can be performed on a sample of propellants once an inflator has been dissected. A bomb test is a useful surrogate for full inflator testing. Bomb testing can be performed to assess how the observed degradation (observed in other wafers from the same inflator) might relate to overpressure or rupture of an inflator. Bomb testing would typically be performed on wafers or tablets where the extent of porosity growth as measured by MIP has exceeded a certain threshold.
– Deployments of intact inflators are of relatively low value for predicting the progression of propellant degradation over time. Deployments of intact inflators having advanced levels of propellant degradation can provide a final verification of model predictions of their behavior (i.e. whether overpressure or rupture would result.) Note that pressure profiles from full inflator deployments are not particularly sensitive to degradation until the degradation has significantly progressed beyond a threshold level. More sensitive testing, such as MIP (which can detect initial stages of degradation) cannot be performed prior to full inflator testing because to access and test the wafers requires dissection of the inflator and destructive testing of the wafers. Thus, MIP measurements followed by bomb testing can provide both the extent of degradation and an assessment of potential overpressure and/or rupture. Therefore, inflator dissections are generally preferred instead of full inflator testing.
– The weights and moisture contents of inflator constituents (propellant, desiccant, AIB) can be acquired for comparisons with model predictions. Moisture content


1900985.000 - 2467 53
Stage 1
In the first stage, 320 PSPI-X and 320 PSDI-X inflators will be collected from the oldest model year Honda vehicles available in south Florida and south Texas. All PSPI-X inflators will have their RH measured. PSPI-X inflators will be CT-scanned to non-destructively measure the wafer diameters. Inflators will then be either dissected for laboratory testing, placed in an environmental test chamber for accelerated life testing, or placed within cars in Miami or Houston for life testing under harsh (i.e. maximal real exposure) but continuously monitored environmental conditions. This stage is described in more detail below.
• From this collection of inflators, the 50 PSPI-X inflators and 50 PSDI-X inflators judged to be the most degraded (either by laboratory measurements or by age) will be identified.
– For PSPI-X inflators, those inflators with the largest measured wafer diameters (by CT-scan) will be chosen as potentially showing signs of degradation. If fewer than 50 PSPI-X inflators have measured wafer diameters that exhibit possible growth, then the oldest remaining inflators with saturated desiccants (as measured by headspace RH) will be chosen.
– For PSDI-X inflators, the RH in the headspace of all collected units will be measured via a hole created through the vent hole seals. The 50 inflators with the highest measured headspace RH will be chosen. If more than 50 inflators have headspace RHs indicative of saturated desiccant or fewer than 50 inflators have any measurable headspace RH (i.e. RH above 0%), then the oldest inflators among those remaining will be chosen.
• Twenty of each inflator will be subject to further laboratory evaluation. The laboratory evaluation will proceed as illustrated in Figure 45. The primary difference between the workflows for PSPI-X and PSDI-X inflators is that CT scanning and OD measurements will not be performed on the PSDI-X inflators. The testing plan will prioritize inflator dissections; however, if deemed appropriate, full inflator deployments may be performed on a subset of the inflators. For a full inflator deployment, the inflator primary and secondary chambers are instrumented with high-speed pressure sensors and the inflator is deployed. Note that if a full inflator deployment is performed, live dissection and the subsequent steps outlined above cannot be performed.

1900985.000 - 2467 54
Figure 45. Sequence of testing for laboratory evaluations of PSPI-X (left) and PSDI-X (right) inflators. Inflators being placed back in environmental chambers or test cars will not proceed to the step of live dissection. Full inflator deployment testing might be implemented on selected inflators, if deemed appropriate, and would occur in place of the live dissection and subsequent steps.
– Laboratory Testing of PSPI-X inflators:
▪ Headspace RH and CT scans for diameter measurements will have already been performed as part of the screening process.
▪ Live dissection will be performed on the inflator.
▪ Inflator constituents will be removed and weighed.
▪ Wafer outside diameter (OD) will be physically measured.
▪ If moisture content is desired, the desiccant, AIB and/or sample wafer(s) will be sent for KF titration to quantify moisture content.
▪ At least one wafer from each inflator will be sent for MIP. Depending on whether porosity growth was observed in the MIP testing, additional testing may be performed.
▪ Bomb testing may be performed on selected wafers from the inflators where degradation was observed. Bomb testing is useful for assessing whether overpressures might have occurred had that inflator been deployed and whether the overpressure would have been sufficient to potentially rupture the housing.
▪ MIP visualization may be performed on a wafer. MIP testing will first be performed at prescribed mercury pressure(s). The wafer will then be subjected to a CT scan. CT scans are useful for assessing the extent and distribution of porosity within the wafer.

1900985.000 - 2467 55
▪ If some anomalous characteristics are observed, such as surface artifacts or unusual results from the CT scans or bomb tests, additional laboratory examinations might be performed to better understand what was observed. These laboratory examinations could include scanning electron microscopy, energy dispersive spectroscopy, micro-CT scanning, or diffusivity measurements.
▪ Alternatively, if deemed appropriate, a full inflator deployment may be performed. For a full inflator deployment, the inflator primary and secondary chambers are instrumented with high-speed pressure sensors and the inflator stages deployed. Note that if a full inflator deployment is performed, live dissection and the subsequent steps outlined above cannot be performed.
– Laboratory Testing of PSDI-X inflators:
▪ RH headspace measurements will already have been performed as part of the screening process.
▪ Live dissection will be performed on the inflator.
▪ Inflator constituents will be removed and weighed.
▪ If moisture content is desired, the desiccant, AIB and sample tablets will be sent for KF titration to quantify moisture content.
▪ A sample of tablets from each inflator will be sent for MIP. Depending on whether porosity growth was observed in the MIP testing, additional testing may be performed.
▪ Bomb testing may be performed on tablets from selected inflators where degradation was observed. Bomb testing is useful for assessing whether overpressures might have occurred had that inflator been deployed and whether the overpressure would have been sufficient to potentially rupture the housing.
▪ MIP visualization may be performed on a tablet. MIP testing will first be performed at prescribed mercury pressure(s). The tablet will then be subjected to a CT scan. CT scans are useful for assessing the extent and distribution of porosity within the tablets.
▪ If some anomalous characteristics are observed, such as surface artifacts or unusual results from the CT scans or bomb tests, additional laboratory examinations might be performed to better understand what was observed. These laboratory examinations could include scanning electron microscopy, energy dispersive spectroscopy, micro-CT scanning, or diffusivity measurements.
▪ Alternatively, if deemed appropriate, a full inflator deployment may be performed. For a full inflator deployment, the inflator housing is instrumented with high-speed pressure sensors and the inflator deployed. Note that if a full inflator deployment is performed, live dissection and the subsequent steps outlined above cannot be performed.
• Distribution of Remaining Inflators for Stage 1
– Ten of each known or suspected most-degraded inflators, plus 90 of the remaining inflators of each type, will be placed in an environmental chamber set to an 8-hour, 2-80°C temperature cycle. Thus, the environmental chamber(s) will contain 100 PSPI-X and 100 PSDI-X inflators, ten of which will be among the most degraded, either known or suspected, for each inflator type.

1900985.000 - 2467 56
– The remaining twenty known or suspected most-degraded inflators of each type will be placed inside dark-colored cars that will be permanently parked outdoors, facing south. Cars will be placed in parking lots in Miami, Florida and Houston, Texas. Ten of each inflator of each type will be placed in Miami-based cars and ten of each type in Houston-based cars. As shown in Figure 44 (Stage 1), the rest of the 180 inflators of each type will be divided and placed within the Miami and Houston cars, with 90 in Miami and 90 in Houston. Thus, each city will start with cars having 100 inflators of each type; 10 known or suspected to be most-degraded and 90 other inflators.
▪ Cars will be instrumented such that temperature and humidity measurements outside the car and within the passenger compartment can be collected.
▪ Temperature sensors will be placed on the housings of the inflators currently installed in the driver and passenger sides. In addition, temperature sensors will be placed on the housings of a sample of PSPI-X and PSDI-X inflators that are stored within the passenger compartment.
▪ Temperature and humidity readings will be collected and stored every five minutes.
Stage 2
In the second stage, 200 total inflators (100 PSPI-X and 100 PSDI-X) will be collected each year from the oldest cars available in south Florida and south Texas. These samples will be fully analyzed as illustrated in Figure 45. This will continue for 10 years.
• The measurements obtained from this portion of the study will be useful in evaluating the distribution of degradation extent (if any) within the populations of inflators from in-use vehicles and to detect possible early indicators of degradation that might be sufficient to lead to overpressure or rupture had the inflators been deployed.
Stage 3
In the third stage, inflators will be temporarily removed each year from the environmental chambers and parked cars. RH measurements and CT scans (for PSPI-X), and RH measurements (for PSDI-X) will be taken on each inflator. From the measurements, ten PSPI-X inflators from the environmental chamber and ten PSDI-X inflators from each of the Miami and Houston parked cars will be selected for further laboratory testing. The remaining inflators will be returned to their respective test sites (i.e. environmental chamber, Miami or Houston parked cars). This annual evaluation will continue for 10 years. Inflators for laboratory testing will be selected to represent a cross-section of the potential extents of degradation available within the samples. One of each inflator judged to be among the most degraded at the start of testing should be evaluated each year.
The inflators chosen for further laboratory testing will be fully analyzed as illustrated in Figure 45.
The measurements obtained from this portion of the study will be useful in comparisons with the degradation extent of inflators that were currently installed in actively used vehicles (Stage 2), as well as inflators subjected to accelerated life testing (environmental chamber cycling).