![1 Building Atoms - Period 3 Na Mg Al Si P S Cl Ar 1s 2 2s 2 2p 6 3s 1 [Ne]3s 1 1s 2 2s 2 2p 6 3s 2 [Ne]3s 2 1s 2 2s 2 2p 6 3s 2 3p 1 [Ne]3s 2 3p 1 1s 2.](https://static.fdocuments.us/doc/165x107/56649d445503460f94a20e8c/1-building-atoms-period-3-na-mg-al-si-p-s-cl-ar-1s-2-2s-2-2p-6-3s-1-ne3s.jpg)
Analysis of 24-Hour Pump Test in Well NC-EWDP-3S, …
26
Analysis of 24-Hour Pump Test in Well NC-EWDP-3S, Near Yucca Mountain, Nevada Prepared for: Nye County Department of Natural Resources and Federal Facilities, Nuclear Waste Repository Project Office, Grant No. DE-FC08-98NV-12083 Prepared by: Questa Engineering Corporation January 2002 NWRPO-2002-01
Transcript of Analysis of 24-Hour Pump Test in Well NC-EWDP-3S, …

Analysis of 24-Hour Pump Test in Well NC-EWDP-3S, Near Yucca Mountain, Nevada
Prepared for: Nye County Department of Natural Resources and Federal Facilities,
Nuclear Waste Repository Project Office, Grant No. DE-FC08-98NV-12083
Prepared by: Questa Engineering Corporation
January 2002
NWRPO-2002-01

Analysis of 24-Hour Pump Test in Well NC-EWDP-3S, Near Yucca Mountain, Nevada
NWRPO-2002-01 January 2002
Analysis of 24-Hour Pump Test in Well NC-EWDP-3S, Near Yucca Mountain, Nevada
NWRPO-2002-01 iii January 2002
CONTENTS
Page
1.0 INTRODUCTION ................................................................................................................... 1
2.0 TEST RESULTS...................................................................................................................... 1 2.1 TEST PROCEDURES AND DESCRIPTION ................................................................ 1 2.2 PUMPING WELL RECOVERY ANALYSIS ................................................................ 2
2.2.1 Model Analysis .................................................................................................... 2 2.2.2 Reason for Pressure Support................................................................................ 3
2.3 OBSERVATION WELL RECOVERY ANALYSIS ...................................................... 4
3.0 CONCLUSIONS ..................................................................................................................... 5
4.0 REFERENCES ........................................................................................................................ 5
Analysis of 24-Hour Pump Test in Well NC-EWDP-3S, Near Yucca Mountain, Nevada
NWRPO-2002-01 iv January 2002
FIGURES
1. Completion Diagram for Well NC-EWDP-3S 2. Completion Diagram for Well NC-EWDP-3D 3. Measured Pumping Rates and Depths to Water for Well NC-EWDP-3S Before,
During, and After the 24-Hour Pump Test 4. Log-Log Diagnostic Plot Comparing Model Results to the Actual Well
NC-EWDP-3S Recovery Response 5. Semilog Plot Comparing Model Results to the Actual Well NC-EWDP-3S
Recovery Response 6. Cartesian Plot Comparing Model Results to the Actual Well NC-EWDP-3S
Recovery Response 7. Measured Depth to Water at Well NC-EWDP-3D Using MOSDAXTM and Well
Sounders 8. Measured Depths to Water for Observation Well NC-EWDP-3D and Pumping
Rates in Well NC-EWDP-3S Before, During, and After the 24-Hour Pump Test 9. Log-Log Diagnostic Plot Comparing Model Results to the Actual Well
NC-EWDP-3D Interference Response 10. Semilog Plot Comparing Model Results to the Actual Well NC-EWDP-3D
Interference Response 11. Cartesian Plot Comparing Model Results to the Actual Well NC-EWDP-3D
Interference Response
ATTACHMENT
1. Well Test Analysis Quality Control Checklist
Analysis of 24-Hour Pump Test in Well NC-EWDP-3S, Near Yucca Mountain, Nevada
NWRPO-2002-01 v January 2002
ACRONYMS AND ABBREVIATIONS
ft feet gal. gallons gpm gallons per minute hr. hours L liters m meters min. minutes Pa Pascals psi pounds per square inch psia pounds per square inch absolute
Analysis of 24-Hour Pump Test in Well NC-EWDP-3S, Near Yucca Mountain, Nevada
NWRPO-2002-01 vi January 2002
INTENTIONALLY LEFT BLANK
Analysis of 24-Hour Pump Test in Well NC-EWDP-3S, Near Yucca Mountain, Nevada
NWRPO-2002-01 1 January 2002
1.0 INTRODUCTION
In early April 2001, a 24-hr. pump test with a 2-hr. recovery period was conducted in well NC-EWDP-3S to determine aquifer properties, such as permeability and well efficiency. During the NC-EWDP-3S pump test and recovery, pressures were monitored in the adjacent well NC-EWDP-3D to evaluate inter-well communication. This report presents the results, analysis, and interpretation of the aquifer pump test.
2.0 TEST RESULTS
Beginning on April 5, 2001, a 24-hr. pump test with a 2-hr. recovery period was run in well NC-EWDP-3S to determine the hydraulic properties of the aquifer connected to the well. On the ground surface, well NC-EWDP-3S is located approximately 11 ft (3.4 m) from well NC-EWDP-3D. At the bottom of NC-EWDP-3S (550 ft, or 167.6 m), the wells are separated by approximately 18 ft (5.5 m).
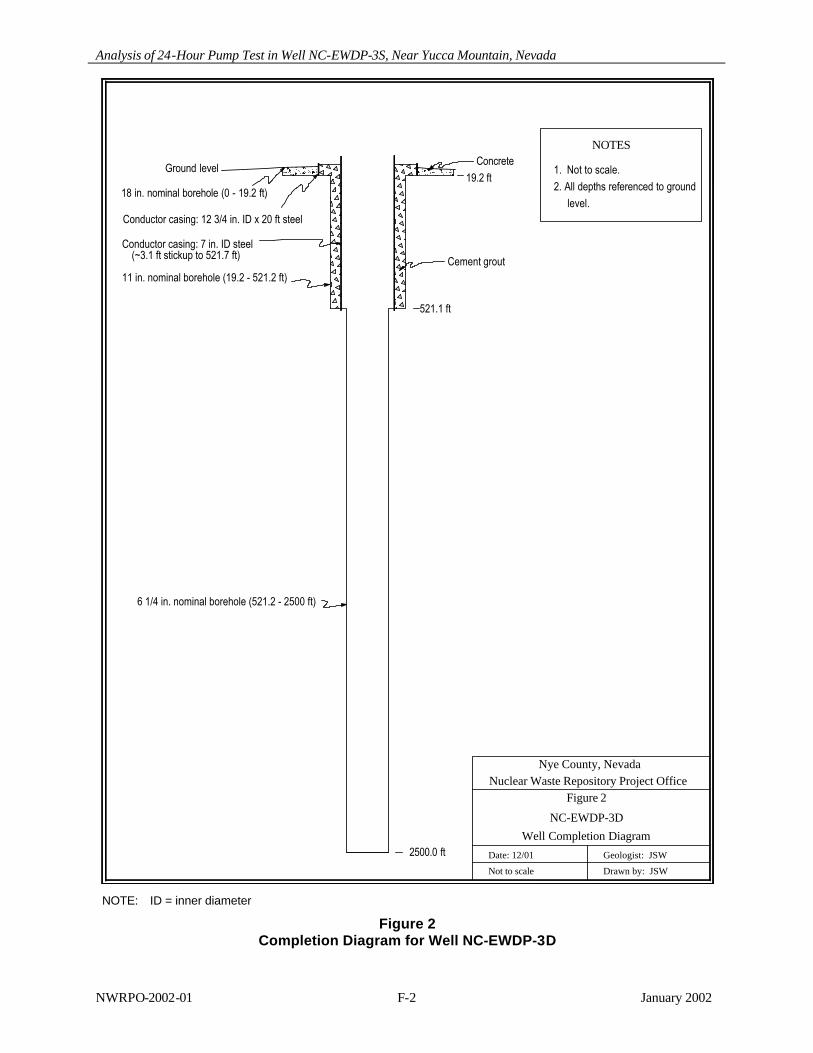
MOSDAX pressure sensors were placed above the submersible pump in well NC-EWDP-3S and below the water table in the nearest offset well (NC-EWDP-3D) to measure the pressure response to pumping. The depth interval tested in well NC-EWDP-3S is an open-hole section from 295 to 550 ft (89.9 to 167.6 m) (Figure 1). Well NC-EWDP-3D is an open hole from 521 to 2,500 ft (158.8 to 762.0 m) (Figure 2).
Previous spinner logging and pump-spinner testing of well NC-EWDP-3D prior to installing the present conductor casing to 521 ft (158.8 m) indicated significant inflow (permeability) from 397 to 426 ft (121.0 to 129.8 m) and limited inflow (low permeability) from the remaining portion of the borehole (i.e., the present open-hole region) (Questa Engineering Corporation, 1999).
2.1 TEST PROCEDURES AND DESCRIPTION
A 24-hr. pump test was designed for well NC-EWDP-3S to determine the transmissivity and well efficiency. Beginning at 12:11 p.m. on April 5, 2001, the well was pumped at an average rate of 27.3 gpm (103.3 L/min.) for 24 hr. Total production during the test was approximately 39,000 gal. (about 148,000 L) and the maximum drawdown in well NC-EWDP-3S was 25.3 ft (7.71 m). The pressure response to pumping was monitored in pumping well NC-EWDP-3S and in the NC-EWDP-3D observation well. Upon cessation of pumping, pressures also were monitored during a 2-hr. recovery period in well NC-EWDP-3S, and for 48 hr. in well NC-EWDP-3D.
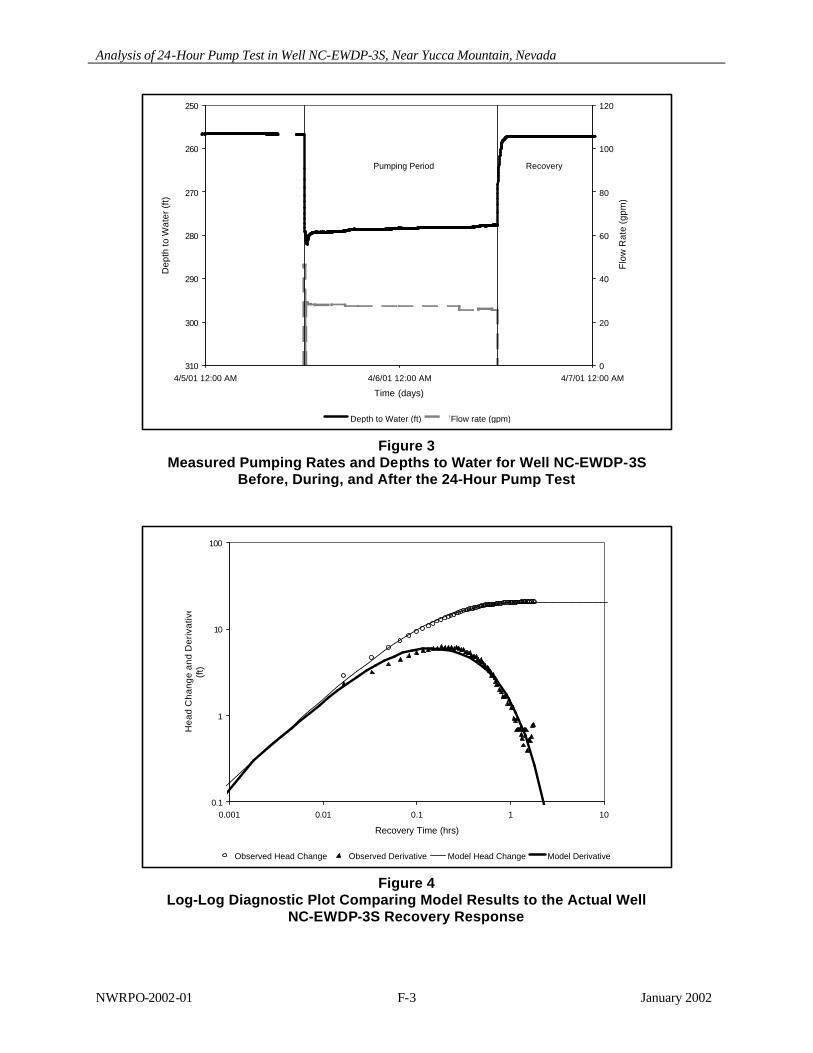
The measured pumping rates and computed depths to water in well NC-EWDP-3S before, during, and following the 24-hr. pump test are shown in Figure 3. Pump rates were obtained using a 50 gal. (189.3 L) drum and a stopwatch. The depth to water was determined from pressures recorded by a MOSDAX pressure sensor placed above the pump. Barometric pressure was also recorded by a MOSDAX pressure sensor, and a nominal water density of 0.43275 psi/ft was used to convert from psia to water depth.
Analysis of 24-Hour Pump Test in Well NC-EWDP-3S, Near Yucca Mountain, Nevada
NWRPO-2002-01 2 January 2002
Because of pumping rate variations and wellbore effects during the pumping portion of the test, recovery data are considered to be most useful for both pumping and observation well analyses discussed in the following sections. A Well Test Analysis Quality Control Checklist is included as Attachment 1. This checklist documents the analysis procedure used and the results obtained.
2.2 PUMPING WELL RECOVERY ANALYSIS
After obtaining the test data and verifying quality control, the first step in the test interpretation procedure was to prepare a log-log diagnostic plot of drawdown head change versus pumping time (Figure 4). In addition to the measured response, the logarithmic derivative of the drawdown was also computed and plotted using a technique described by Horne (1997). This type of plot provides important information regarding possible flow regimes, including, for example:
• An initial unit slope (+1 slope) (usually within the first few seconds or minutes of pumping) on the drawdown head change and the derivative indicates wellbore storage.
• A later flat line (0 slope) in the derivative response indicates radial cylindrical flow. The distance between the drawdown curve and the derivative curve is a measure of wellbore efficiency or skin effect.
• Multiple stable flat regions can be caused by flow barriers or multiple layers.
• A positive half slope (+½ slope) on the derivative response indicates linear flow between barriers. The distance to the barriers is determined from the time needed to reach the derivative half slope, with closer boundaries causing the half slope to develop more quickly.
• A negative half slope (-½ slope) on the derivative response indicates spherical or hemispherical flow.
• A rapidly declining derivative trending to zero is indicative of pressure support at greater distance from the well, or through vertical leakage or delayed yield.
Several different flow regimes are evident from inspection of the log-log plot (Figure 4) for well NC-EWDP-3S. The effects of wellbore storage and well efficiency dominated the very early time response, up to about 0.02 hr. The change in head then rose steadily to a stable level, while the derivative peaked and then declined continuously, with no indication of derivative slope stabilization. The declining derivative at late times is indicative of pressure support.
2.2.1 Model Analysis
The next step in the analysis was to prepare a test interpretation based on a conceptual model identified from reviewing the diagnostic plot (Figure 4) and the well history. Well test analysts generally begin an analysis with the simplest model possible. In this case, that was an equivalent single-layer model with pressure support, as described in the previous section. The drawdown head changes and derivative response were analyzed using the SAPHIR computer-assisted
Analysis of 24-Hour Pump Test in Well NC-EWDP-3S, Near Yucca Mountain, Nevada
NWRPO-2002-01 3 January 2002
well test analysis program (Kappa Engineering, 1999). SAPHIR includes the standard methods of well test analysis, as well as hundreds of different models for the wellbore, different flow regimes, different types of boundaries, multiple layers, and other factors affecting flow. After a preliminary interpretation was selected, the test parameters were varied to determine a “best fit” using nonlinear regression techniques. The match results were examined on log-log (Figure 4), semilog (Figure 5), and Cartesian plots (Figure 6).
The best match was obtained with a transmissivity of 173 ft2/day (16.1 m2/day), corresponding to an average permeability of 0.17 darcy (1.7 x 10⁻¹³ m2) over the 287 ft (87.5 m) saturated interval thickness. The pressure support was modeled by assuming a well in the center of a constant pressure square, with the sides being 21 ft (6.4 m) from the well. Because of the effects of pressure support, it was not possible to determine the well efficiency, so the well efficiency was assumed to be 100% (skin factor of zero). A square, constant pressure boundary was used to facilitate evaluation of the NC-EWDP-3D interference response with the same model (Section 2.3).
An effective compressibility corresponding to a specific yield was used for this analysis. An effective porosity of 2.1% was used based on the analysis of the NC-EWDP-3D interference response (Section 2.3). The distance to the constant pressure boundaries is strongly dependent on the compressibility and porosity values. It also depends on the assumed geometry of the system. Essentially equivalent results were achieved with a circular constant boundary at a distance of 23 ft (7.0 m), or with two parallel constant pressure boundaries 18 ft (5.5 m) from the well, or with other combinations, as long as there was substantial pressure support near the well.
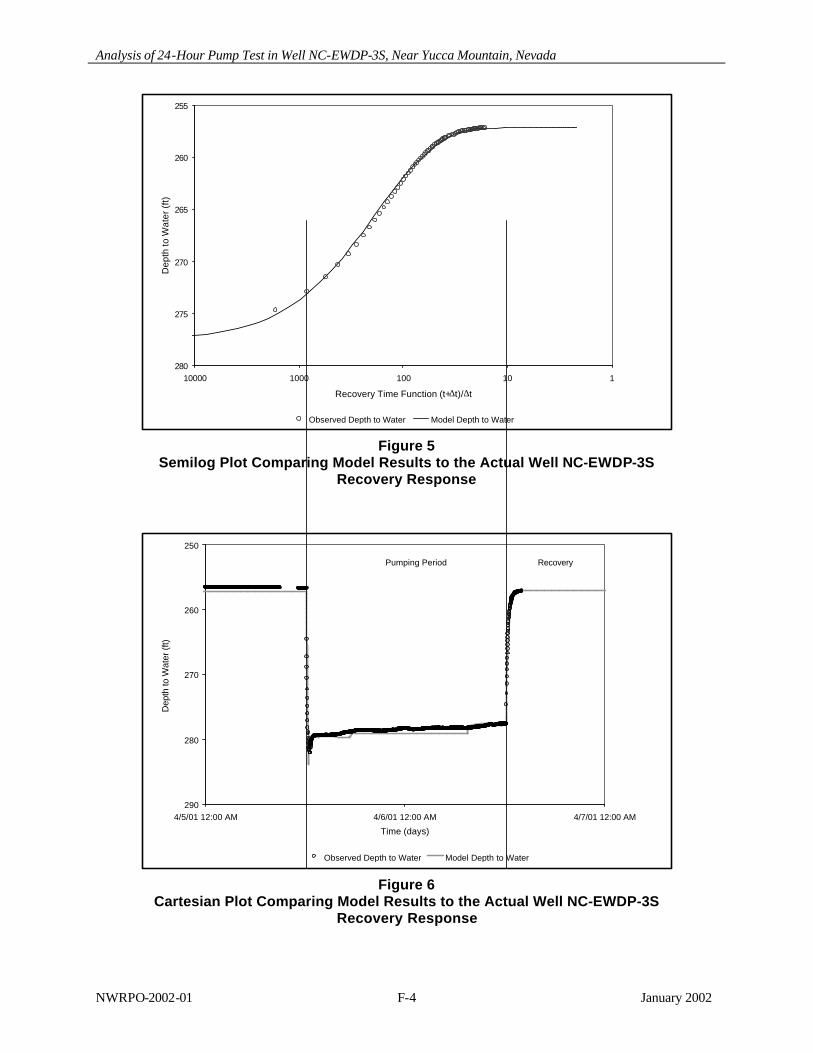
Using the match parameters for the square boundaries with constant pressure, a very good match of the head change and derivative response during this test was achieved (Figure 4). A good match was also obtained on the semilog plot (Figure 5). The influence of the pressure support caused the head change to continuously decrease, so that it was not possible to select a suitable straight line for a Cooper-Jacob analysis (Cooper and Jacob, 1946). The Cartesian plot for the model (Figure 6) shows an excellent match during both the pump test and the recovery period.
2.2.2 Reason for Pressure Support
A review of the history of operations at wells NC-EWDP-3S and -3D suggests a likely cause of the pressure support apparent on the NC-EWDP-3S well test. NC-EWDP-3S was the first well drilled at this location. Well NC-EWDP-3D was subsequently drilled with a shallow temporary casing to 397 ft (121.0 m). Aquifer tests in well NC-EWDP-3D in 1999 indicated a permeability of 13.6 darcy (1.37 x 10⁻¹¹ m2) and hemispherical flow coming from the 397 to 426 ft (121.0 to 129.8 m) depth interval, immediately below the temporary conductor casing (Questa Engineering Corporation, 1999). Moreover, this same testing showed that depths below 426 ft (129.8 m) produced very little water, indicating a relatively low permeability. Well NC-EWDP-3S was not tested at that time.
Later, the temporary casing was removed and well NC-EWDP-3D was cleaned out and permanent conductor casing was cemented deeper in the well, to a depth of 521 ft (158.8 m). In addition, because of concerns related to excessive air flow from well NC-EWDP-3S while working on well NC-EWDP-3D, a grout hole was emplaced near NC-EWDP-3S, and cement
Analysis of 24-Hour Pump Test in Well NC-EWDP-3S, Near Yucca Mountain, Nevada
NWRPO-2002-01 4 January 2002
grout was pumped into the shallow aquifer. Thus, the zone that had demonstrated high permeability previously in well NC-EWDP-3D in pump-spinner tests (Questa Engineering Corporation, 1999) is now located behind casing and is likely plugged with cement in the region around these wells of interest. Moreover, the thick interval currently exposed in the open hole was previously shown to have a lower permeability (Questa Engineering Corporation, 1999).
In summary, the conceptual picture of the aquifer conditions in the area of wells NC-EWDP-3S and -3D is as follows. The grout injection created a region of substantially reduced permeability near these wells. Outside that region, there is much higher permeability and transmissivity of the magnitude indicated on the 1999 test of well NC-EWDP-3D. It is this higher permeability region outside the grouted volume that provided the pressure support observed on the April 2001 test. This hypothesis is compatible with both the April 2001 test behavior and the results of the previous NC-EWDP-3D testing.
2.3 OBSERVATION WELL RECOVERY ANALYSIS
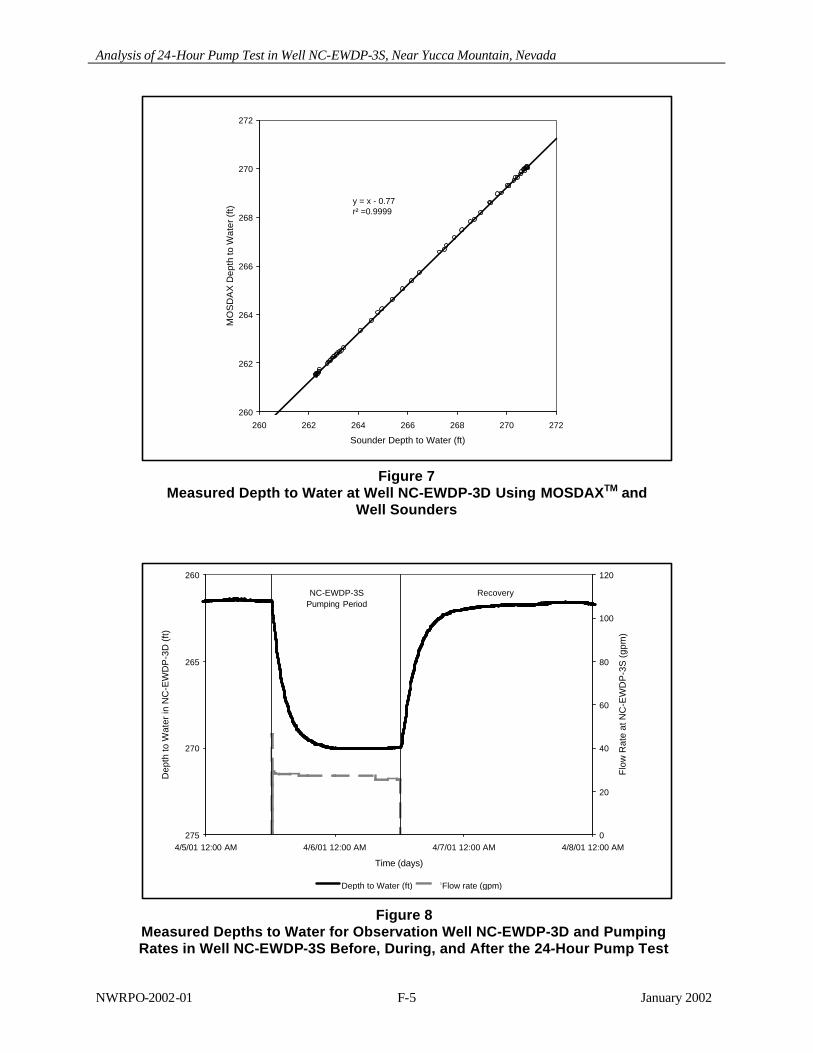
In addition to computing water levels in well NC-EWDP-3D from MOSDAX pressure sensor data, water levels were also recorded using a sounder. The sounder data and the water levels computed from the MOSDAX measurements are nearly identical, except the sounder readings are 0.77±0.03 ft (0.23±0.01 m) deeper than the MOSDAX results (Figure 7). The difference may in part be due to the effect of borehole deviation on the sounder data. Because of the excellent correlation between the two methods, and the greater data frequency available with the MOSDAX readings, the MOSDAX data were used for analysis.
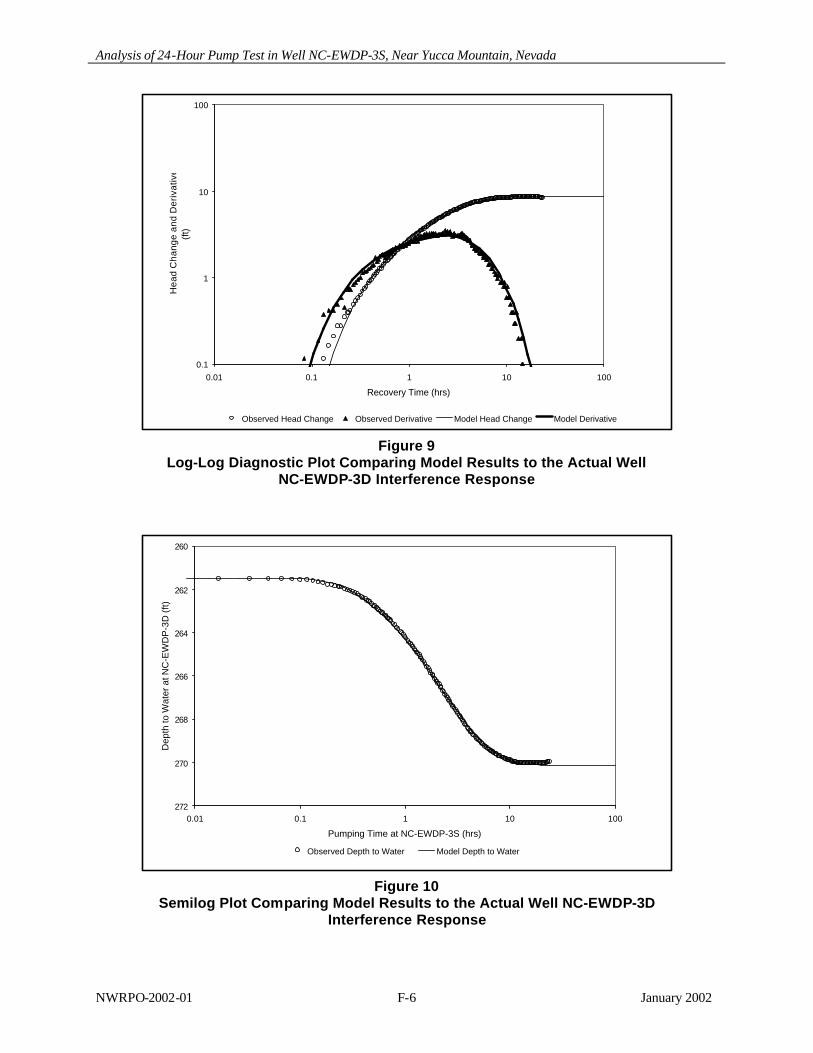
The interference response at well NC-EWDP-3D as a result of pumping well NC-EWDP-3S provided a useful data set for analysis (Figure 8). The head changes and derivative response during recovery were analyzed using the SAPHIR computer-assisted well test analysis program (Kappa Engineering, 1999). Simulated recovery data were compared to measured recovery data on log-log (Figure 9), semilog (Figure 10), and Cartesian plots (Figure 11). The best match was obtained with a transmissivity of 115 ft2/day (10.7 m2/day), corresponding to an average inter-well permeability of 0.11 darcy (1.1 x 10⁻¹³ m2) using the full 287 ft (87.5 m) saturated interval thickness at well NC-EWDP-3S. The pressure support was modeled by assuming a well in the center of a constant pressure square, with the sides being 55 ft (16.8 m) from the well.
In addition to determining the permeability, interference testing also permits calculation of the effective porosity-compressibility product. The computed effective porosity-compressibility product from the NC-EWDP-3D interference response was 0.00017 psi-1 (2.89 x 10⁻⁸ Pa-1). The porosity-compressibility product is large enough to indicate that the system is acting as an unconfined aquifer rather than as a confined aquifer, which in general will exhibit a much lower porosity-compressibility product. For example, if a reasonable unconfined aquifer compressibility of 0.00805 psi-1 (1.37 x 10⁻⁶ Pa-1) is assumed, the computed effective porosity is 0.021 (2.1%). This value appears to be within a reasonable order of magnitude. If, on the other hand, a typical confined aquifer compressibility of approximately 0.000010 to 0.00010 psi-1 (1.7 x 10⁻¹⁰ to 1.7 x 10⁻⁹ Pa-1) is assumed, the computed effective porosity would have to be 1.7 to 17 (170% to 1,700%), which is physically impossible. Accordingly, it is inferred that the system is acting unconfined, with an effective porosity of approximately 2%.

Analysis of 24-Hour Pump Test in Well NC-EWDP-3S, Near Yucca Mountain, Nevada
NWRPO-2002-01 5 January 2002
The computed inter-well permeability between NC-EWDP-3S and -3D was 0.11 darcy (1.1 x 10⁻¹³ m2), which is 65% of the computed average permeability around well NC-EWDP-3S (0.17 darcy, or 1.7 x 10⁻¹³ m2). The computed distance to the constant pressure boundaries for the NC-EWDP-3D response (55 ft, or 16.8 m) is 2.6 times the computed distance to the constant pressure boundaries for the NC-EWDP-3S response (21 ft, or 6.4 m). These differences are considered to be within the range of likely error of the methodology applied, in as much as the effects of grouting should be expected to vary substantially both laterally and vertically. In any case, these modeling results are consistent with a localized severe permeability reduction caused by grouting, with much higher permeability a significant distance away from the wells.
3.0 CONCLUSIONS
A 24-hr. pump test was conducted to determine aquifer properties near well NC-EWDP-3S. Analysis of the test indicated the presence of a severely damaged zone in the immediate vicinity of the well, which is consistent with the operations history indicating grout was injected in the aquifer near this well. The test was analyzed using an equivalent single-layer system, with the well being located in the center of a square with constant pressure boundaries. The total transmissivity of the aquifer connected to well NC-EWDP-3S is 173 ft2/day (16.1 m2/day), corresponding to an average permeability of 0.17 darcy (1.7 x 10⁻¹³ m2) over the 287 ft (87.5 m) saturated interval thickness. The pressure support was modeled by assuming a well in the center of a constant pressure square, with the sides being 21 ft (6.4 m) from the well. The estimated distance to the barriers should be considered approximate because of uncertainties in average compressibility and other factors.
Heads were monitored in an offset well (NC-EWDP-3D) to measure potential interference. The best match was obtained with a transmissivity of 115 ft2/day (10.7 m2/day), corresponding to an average inter-well permeability of 0.11 darcy (1.1 x 10⁻¹³ m2) using the full 287 ft (87.5 m) saturated interval thickness at well NC-EWDP-3S. The pressure support was modeled by assuming a well in the center of a constant pressure square, with the sides being 55 ft (16.8 m) from the well. The interference response indicates that the system is acting unconfined, with an effective porosity of approximately 2%.
The difference between the active well results and the observation well results are considered to be within the range of likely error of the methodology applied, in as much as the effects of grouting should be expected to vary substantially both laterally and vertically. In summary, modeling data support the conceptual model of a localized severe permeability reduction caused by grouting, with much higher permeability a significant distance away from the wells.
The general test methodology is applicable for use on future wells.
4.0 REFERENCES
Cooper, H.H. and C.E. Jacob. 1946. “A Generalized Graphical Method for Evaluating Formation Constants and Summarizing Well Field History.” Trans., AGU, v. 27, pp. 526-534. Washington, D.C.: American Geophysical Union.
Analysis of 24-Hour Pump Test in Well NC-EWDP-3S, Near Yucca Mountain, Nevada
NWRPO-2002-01 6 January 2002
Horne, R. 1997. Modern Well Test Analysis, A Computer-Aided Approach. p. 80. Palo Alto, California: Petroway, Inc.
Kappa Engineering. 1999. Saphir Well Test Interpretation Software, Version 2.30 Update Notes. Dallas, Texas: Kappa North America, Inc.
Questa Engineering Corporation. 1999. Analysis of Pre-Completion Pressure Testing in Borehole NC-EWDP-3D, Yucca Mountain, Nevada. Pahrump, Nevada: Nuclear Waste Repository Project Office. 18 p.
Analysis of 24-Hour Pump Test in Well NC-EWDP-3S, Near Yucca Mountain, Nevada
NWRPO-2002-01 January 2002
FIGURES

Analysis of 24-Hour Pump Test in Well NC-EWDP-3S, Near Yucca Mountain, Nevada
NWRPO-2002-01 January 2002
INTENTIONALLY LEFT BLANK

Analysis of 24-Hour Pump Test in Well NC-EWDP-3S, Near Yucca Mountain, Nevada
NWRPO-2002-01 January 2002 F-1
NOTE: OD = outer diameter; ID = inner diameter Figure 1
Completion Diagram for Well NC-EWDP-3S
Well casing: 6 5/8 in. OD x 6 in. ID steel
Nye County, Nevada
Figure 1
NC-EWDP-3S
Well Completion Diagram
Nuclear Waste Repository Project Office
Bentonite grout
8/12 mesh sand
Date: 12/01
Not to scale
Geologist: AJM/JSW
Drawn by: JSW
Ground Level
Well screen: 0.02 in. slots,5.1 in. /ft open area
NOTES
295.0 ft
238.5 ft
269.8 ft
249.8 ft
550.0 ft
Open hole below 294.8 ft
6 in. nominal borehole(293.3 - 550.0 ft)
223.5 ft
274.1 ft
(293.3 - 295.0 ft)10 5/8 in. nominal borehole
(0 - 293.3 ft)11 in. nominal borehole
Cement grout
2
Cement and bentonite grout
flush threaded.
2. All depths referenced to
3. All casing and screen is
1. Not to scale.
ground level.
(3.0 ft stickup to 294.8 ft)
Analysis of 24-Hour Pump Test in Well NC-EWDP-3S, Near Yucca Mountain, Nevada
NWRPO-2002-01 January 2002 F-2
NOTE: ID = inner diameter
Figure 2 Completion Diagram for Well NC-EWDP-3D
Conductor casing: 12 3/4 in. ID x 20 ft steel
Nye County, Nevada
Figure 2
NC-EWDP-3DWell Completion Diagram
Nuclear Waste Repository Project Office
Cement grout
Date: 12/01
Not to scale
Geologist: JSW
Drawn by: JSW
Ground level
NOTES
521.1 ft
19.2 ft
2500.0 ft
6 1/4 in. nominal borehole (521.2 - 2500 ft)
2. All depths referenced to ground1. Not to scale.
level.
11 in. nominal borehole (19.2 - 521.2 ft)
18 in. nominal borehole (0 - 19.2 ft)
Conductor casing: 7 in. ID steel
Concrete
(~3.1 ft stickup to 521.7 ft)
Analysis of 24-Hour Pump Test in Well NC-EWDP-3S, Near Yucca Mountain, Nevada
NWRPO-2002-01 January 2002 F-3
Figure 3 Measured Pumping Rates and Depths to Water for Well NC-EWDP-3S
Before, During, and After the 24-Hour Pump Test
Figure 4 Log-Log Diagnostic Plot Comparing Model Results to the Actual Well
NC-EWDP-3S Recovery Response
250
260
270
280
290
300
3104/5/01 12:00 AM 4/6/01 12:00 AM 4/7/01 12:00 AM
Time (days)
Dep
th to
Wat
er (f
t)
0
20
40
60
80
100
120
Flo
w R
ate
(gpm
)
Depth to Water (ft) Flow rate (gpm)
Pumping Period Recovery
0.1
1
10
100
0.001 0.01 0.1 1 10
Recovery Time (hrs)
Hea
d C
hang
e an
d D
eriv
ativ
e(ft
)
Observed Head Change Observed Derivative Model Head Change Model Derivative
Analysis of 24-Hour Pump Test in Well NC-EWDP-3S, Near Yucca Mountain, Nevada
NWRPO-2002-01 January 2002 F-4
Figure 5 Semilog Plot Comparing Model Results to the Actual Well NC-EWDP-3S
Recovery Response
Figure 6 Cartesian Plot Comparing Model Results to the Actual Well NC-EWDP-3S
Recovery Response
250
260
270
280
2904/5/01 12:00 AM 4/6/01 12:00 AM 4/7/01 12:00 AM
Time (days)
Dep
th to
Wat
er (f
t)
Observed Depth to Water Model Depth to Water
Pumping Period Recovery
255
260
265
270
275
280110100100010000
Recovery Time Function (t+∆t)/∆t
Dep
th to
Wat
er (f
t)
Observed Depth to Water Model Depth to Water
Analysis of 24-Hour Pump Test in Well NC-EWDP-3S, Near Yucca Mountain, Nevada
NWRPO-2002-01 January 2002 F-5
Figure 7 Measured Depth to Water at Well NC-EWDP-3D Using MOSDAXTM and
Well Sounders
Figure 8 Measured Depths to Water for Observation Well NC-EWDP-3D and Pumping Rates in Well NC-EWDP-3S Before, During, and After the 24-Hour Pump Test
260
262
264
266
268
270
272
260 262 264 266 268 270 272
Sounder Depth to Water (ft)
MO
SD
AX
Dep
th to
Wat
er (f
t)
y = x - 0.77r² =0.9999
260
265
270
2754/5/01 12:00 AM 4/6/01 12:00 AM 4/7/01 12:00 AM 4/8/01 12:00 AM
Time (days)
Dep
th to
Wat
er in
NC
-EW
DP
-3D
(ft)
0
20
40
60
80
100
120
Flo
w R
ate
at N
C-E
WD
P-3
S (g
pm)
Depth to Water (ft) Flow rate (gpm)
NC-EWDP-3SPumping Period
Recovery
Analysis of 24-Hour Pump Test in Well NC-EWDP-3S, Near Yucca Mountain, Nevada
NWRPO-2002-01 January 2002 F-6
Figure 9 Log-Log Diagnostic Plot Comparing Model Results to the Actual Well
NC-EWDP-3D Interference Response
Figure 10 Semilog Plot Comparing Model Results to the Actual Well NC-EWDP-3D
Interference Response
0.1
1
10
100
0.01 0.1 1 10 100
Recovery Time (hrs)
Hea
d C
hang
e an
d D
eriv
ativ
e(ft
)
Observed Head Change Observed Derivative Model Head Change Model Derivative
260
262
264
266
268
270
2720.01 0.1 1 10 100
Pumping Time at NC-EWDP-3S (hrs)
Dep
th to
Wat
er a
t NC
-EW
DP
-3D
(ft)
Observed Depth to Water Model Depth to Water

Analysis of 24-Hour Pump Test in Well NC-EWDP-3S, Near Yucca Mountain, Nevada
NWRPO-2002-01 January 2002 F-7
Figure 11 Cartesian Plot Comparing Model Results to the Actual Well NC-EWDP-3D
Interference Response
260
262
264
266
268
270
2724/5/01 12:00 AM 4/6/01 12:00 AM 4/7/01 12:00 AM
Time (days)
Dep
th to
Wat
er (f
t)
Observed Depth to Water Model Depth to Water
NC-EWDP-3SPumping Period
Recovery

Analysis of 24-Hour Pump Test in Well NC-EWDP-3S, Near Yucca Mountain, Nevada
NWRPO-2002-01 January 2002 F-8
INTENTIONALLY LEFT BLANK
Analysis of 24-Hour Pump Test in Well NC-EWDP-3S, Near Yucca Mountain, Nevada
NWRPO-2002-01 January 2002
ATTACHMENT 1 WELL TEST ANALYSIS QUALITY CONTROL CHECKLIST

Analysis of 24-Hour Pump Test in Well NC-EWDP-3S, Near Yucca Mountain, Nevada
NWRPO-2002-01 January 2002
INTENTIONALLY LEFT BLANK
Analysis of 24-Hour Pump Test in Well NC-EWDP-3S, Near Yucca Mountain, Nevada
NWRPO-2002-01 January 2002 Attachment-1
Attachment 1
Well Test Analysis Quality Control Checklist
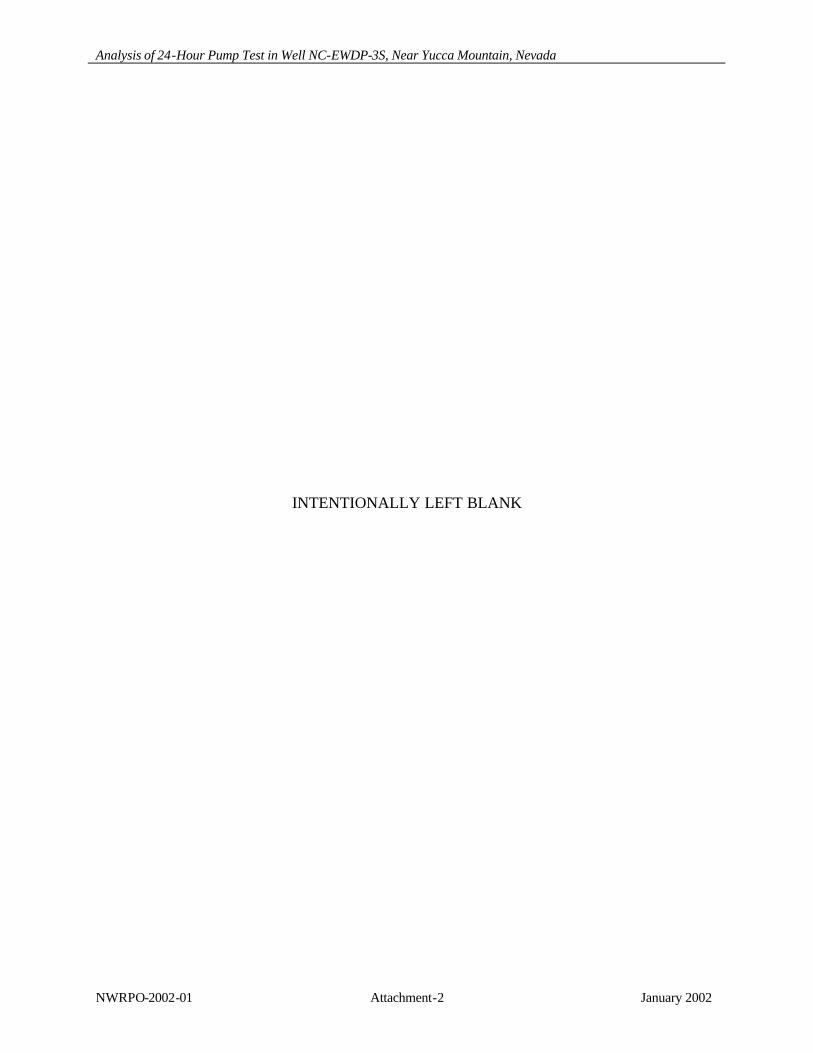
Test InformationBorehole: NC-EWDP-3S Interval Tested: Open hole section 295-550 ftTest Date: April 5-6, 2001 Datum: 283.15 ft below ground for ProbeTest Type: 24 hr.Pump test / 2 hr. Recovery Observation Well: NC-EWDP-3DRemarks: Test response appears to show constant pressure boundaries
Source of DataPressure File: 3S4.CSV Source: e-mail, J Walker w/ Nye Co.Gauge Type: Westbay #2323 (-3S), #2454 (-3D) Units: psia & degrees CRate File: Hand Input Source: Nye County Field Notebook Flow Meter Type: 50 gal. Drum and Stopwatch Units: GPM, converted to BPD
AssumptionsValue Units Source Comments
Height 287 ft Logs Water Level to TDPorosity 2.1% -3D Interference Reworked TuffViscosity 0.7688 cp Saphir Software valueWellbore Radius 0.25 ft est Nominal Bit SizeCompressibility 0.00805 psi -1 Calculated Unconfined = 1/ (0.433 X 287)Compressibility 5.0 X 10⁻⁵ psi -1 Assumed Confined - EstimatedTemperature 90 deg F Assumed EstimatedS -Storage Coefficient 0.021 ft/ft -3D Interference
ResultsCartesian Plot Analysis: Attach PlotLength of Flow: 24 hrs Steady State? Yes Pseudo-Steady State? NoRemarks: Data reach steady state
Log-Log Plot Analysis: Attach PlotFlow Regimes Noted: (Circle Appropriate Types; Include Flow Regime Plot if Appropriate)
Wellbore Storage Bilinear Linear Radial Spherical OtherRemarks: Well shows effect of pressure support, modeled as constant pressure square.
Analysis ProceduresSoftware Utilized: Kappa-Saphir File Name: 3SActive_Rev03.ks3 Location: QEC NetworkSoftware Utilized: Kappa-Saphir File Name: 3DResponse_Rev03.ks3 Location: QEC NetworkSoftware Utilized: Kappa-Saphir File Name: 3DResponse_Rev03a.ks3 Location: QEC Network
Result Summary (Include Units)T - Transmissivity: 173 ft2/d Initial Pressure: 24.8 psi, (256.8 ft below ground)Permeability: 0.17 darcy Final Flowing Pressure: 15.7 psi, (277.6 ft below ground)Skin: 0 assumed Extrapolated Pressure: 24.7 psi, (256.9 ft below ground)Effective Flow Time: 24 hours Radius of Investigation: 21 ftAverage Flow Rate: 27.3 gpm, 936 bpd Distance to Boundary: 21, 21, 21, 21 ftTotal Flow Volume: 39,000 gal, 929 bbls Effective Storativity for Zero Skin: X 10- ft/ft NA
Remarks: Analysis indicates damaged permeability in vicinity of well, probably due to grouting.Match made with constant pressure boundary.Interference response at NC-EWDP-3D shows slightly lower permeability.
Analyzed by: Dave O. Cox Analysis Date: 12/21/2001
WELL TEST ANALYSIS QUALITY CONTROL CHECKLIST
NYE COUNTY NUCLEAR WASTE REPOSITORY OFFICEINDEPENDENT SCIENTIFIC INVESTIGATION
YUCCA MOUNTAIN, NEVADA
Analysis of 24-Hour Pump Test in Well NC-EWDP-3S, Near Yucca Mountain, Nevada
NWRPO-2002-01 January 2002 Attachment-2
INTENTIONALLY LEFT BLANK


![Rcsomx Scheduling b- a “Nc~.work of C;o~~3113[]13icalio]3s ...](https://static.fdocuments.us/doc/165x107/587caa6d1a28ab96428b9528/rcsomx-scheduling-b-a-ncwork-of-co311313icalio3s-.jpg)