Analysis of 2009 Statewide Assessment Results
34
Analysis of 2009 Statewide Assessment Results Vincent Caputo Assistant Superintendent November 17, 2009
-
Upload
asher-rose -
Category
Documents
-
view
36 -
download
0
description
Analysis of 2009 Statewide Assessment Results. Vincent Caputo Assistant Superintendent November 17, 2009. Overview of Statewide Assessments. New Jersey Assessment of Skills and Knowledge (NJASK 3 to 8) Language Arts, Mathematics, and Science (Science in grades 4 and 8 only) - PowerPoint PPT Presentation
Transcript of Analysis of 2009 Statewide Assessment Results

Analysis of 2009 Statewide Assessment Results
Vincent CaputoAssistant Superintendent
November 17, 2009
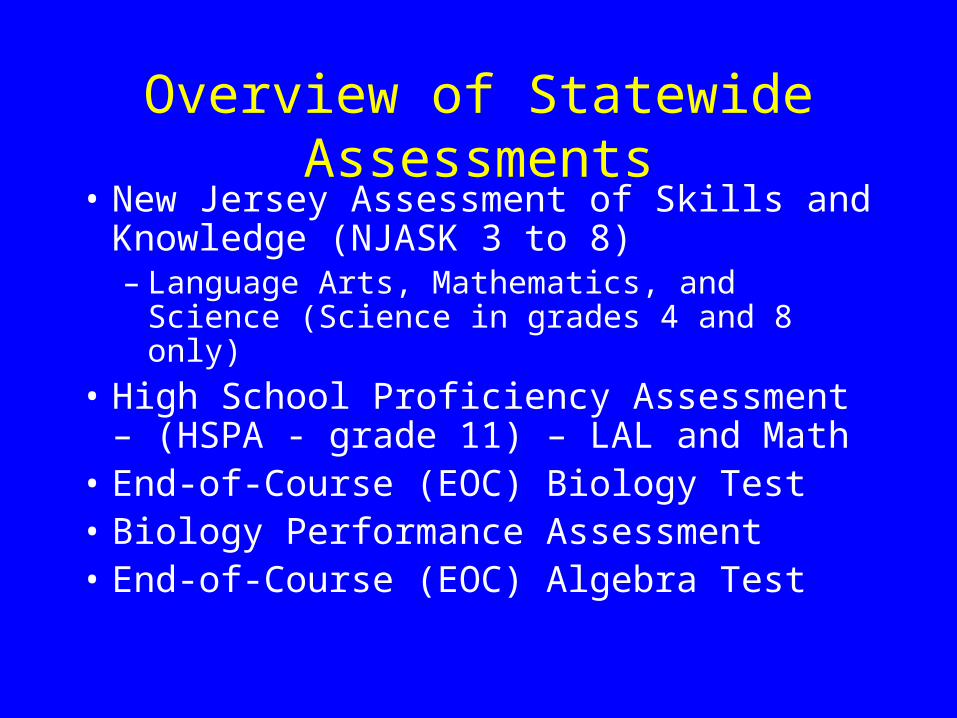
Overview of Statewide Assessments• New Jersey Assessment of Skills and
Knowledge (NJASK 3 to 8)– Language Arts, Mathematics, and Science
(Science in grades 4 and 8 only)
• High School Proficiency Assessment – (HSPA - grade 11) – LAL and Math
• End-of-Course (EOC) Biology Test• Biology Performance Assessment• End-of-Course (EOC) Algebra Test
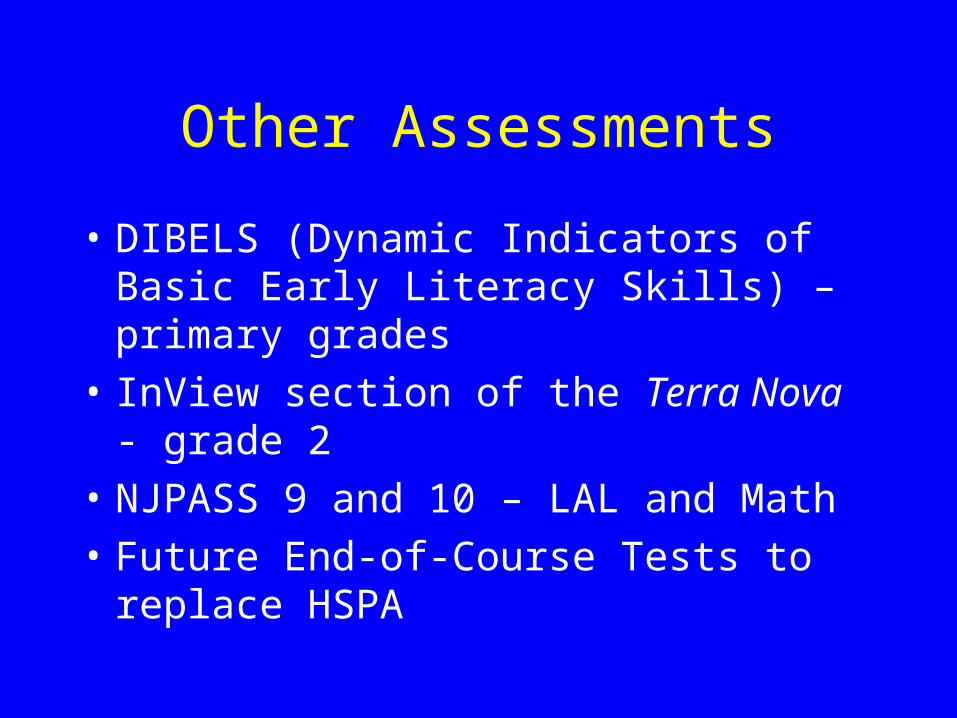
Other Assessments
• DIBELS (Dynamic Indicators of Basic Early Literacy Skills) – primary grades
• InView section of the Terra Nova - grade 2
• NJPASS 9 and 10 – LAL and Math
• Future End-of-Course Tests to replace HSPA

New Proficiency Levels: Higher Standards for NJASK 3, 4
• Completely redesigned tests to provide better information on mastery of NJCCCS
• “Raised the bar”
• More students statewide in the “partially proficient” category

New Proficiency Levels: Higher Standards for NJASK 3, 4
• Example of impact: (grade 3 LAL)– 2008: 40 points; 16
correct for score of 200– 2009: 50 points; 25
correct for score of 200
See table for comparisons of statewide proficiency rates
2008 2009
LAL3 86% 62%
LAL4 83% 62%
Math3 87% 75%
Math4 85% 74%

NJASK 3 Language Arts Literacy
• Mean score = 210.3
• Total Proficiency = 73.2%– Advanced Proficient (Scale score 250+) = 4.2%– Proficient (Scale score 200-249)= 69.0%
Note: Percentages are rounded and may not total to 100%

NJASK 3 Mathematics
• Mean score = 227.1
• Total Proficiency = 79.2%– Advanced Proficient (Scale score 250+) =
30.4%– Proficient (Scale score 200-249)= 48.8%

NJASK 3 LAL and Math:Comparison to DFG and State
0102030405060708090
100
LAL Math
ClarkDFG-FGState

NJASK 4 Language Arts Literacy
• Mean score = 211.8
• Total Proficiency = 71.4%– Advanced Proficient (Scale score 250+) = 6.2%– Proficient (Scale score 200-249)= 65.2%

NJASK 4 Mathematics
• Mean score = 225.6
• Total Proficiency = 78.3%– Advanced Proficient (Scale score 250+) =
24.8%– Proficient (Scale score 200-249)= 53.4%
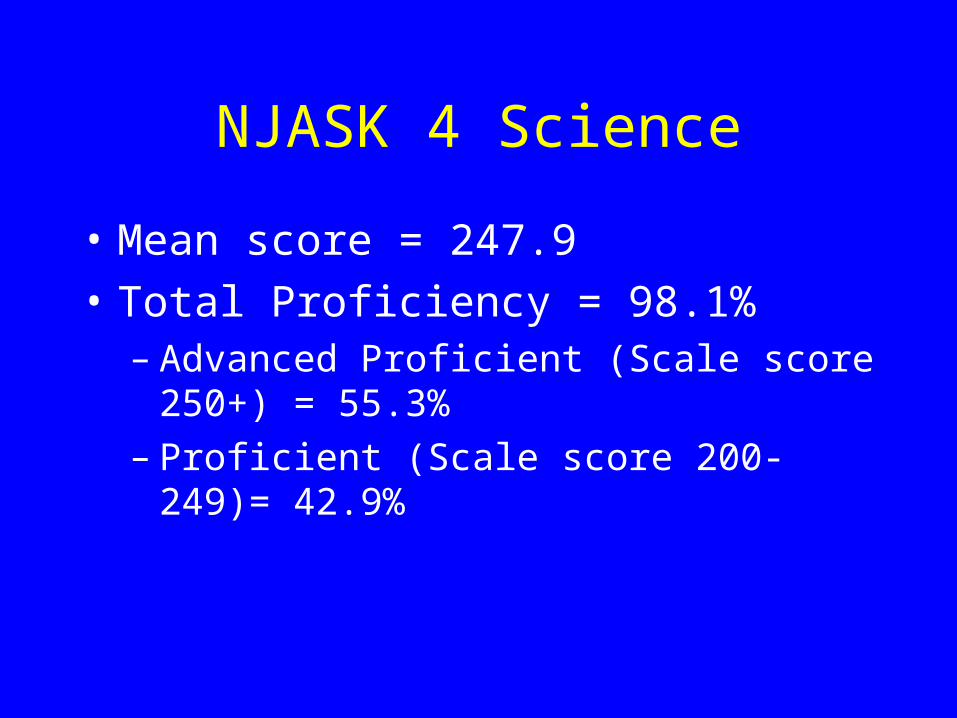
NJASK 4 Science
• Mean score = 247.9
• Total Proficiency = 98.1%– Advanced Proficient (Scale score 250+) =
55.3%– Proficient (Scale score 200-249)= 42.9%
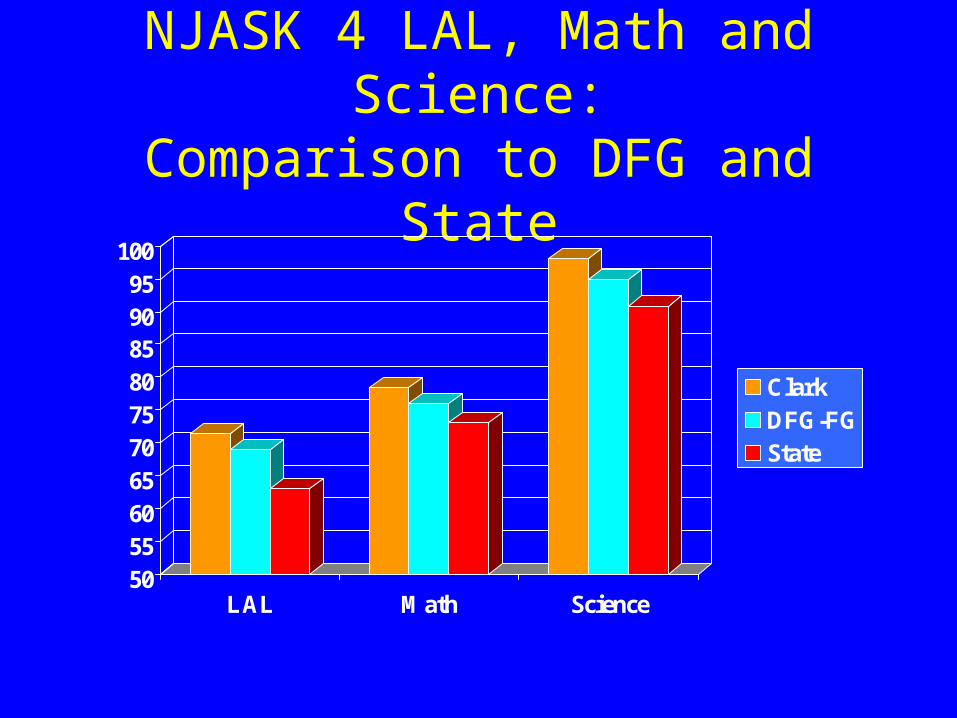
NJASK 4 LAL, Math and Science:Comparison to DFG and State
50556065707580859095
100
LAL Math Science
ClarkDFG-FGState

NJASK 5 Language Arts Literacy
• Mean score = 212.5
• Total Proficiency = 74.7%– Advanced Proficient (Scale score 250+) = 6.9%– Proficient (Scale score 200-249)= 67.8%

NJASK 5 Mathematics
• Mean score = 226.4
• Total Proficiency = 77.6%– Advanced Proficient (Scale score 250+) =
26.4%– Proficient (Scale score 200-249)= 51.1%

NJASK 5 LAL and Math:Comparison to DFG and State
0
10
20
30
40
50
60
70
80
90
LAL Math
ClarkDFG-FGState
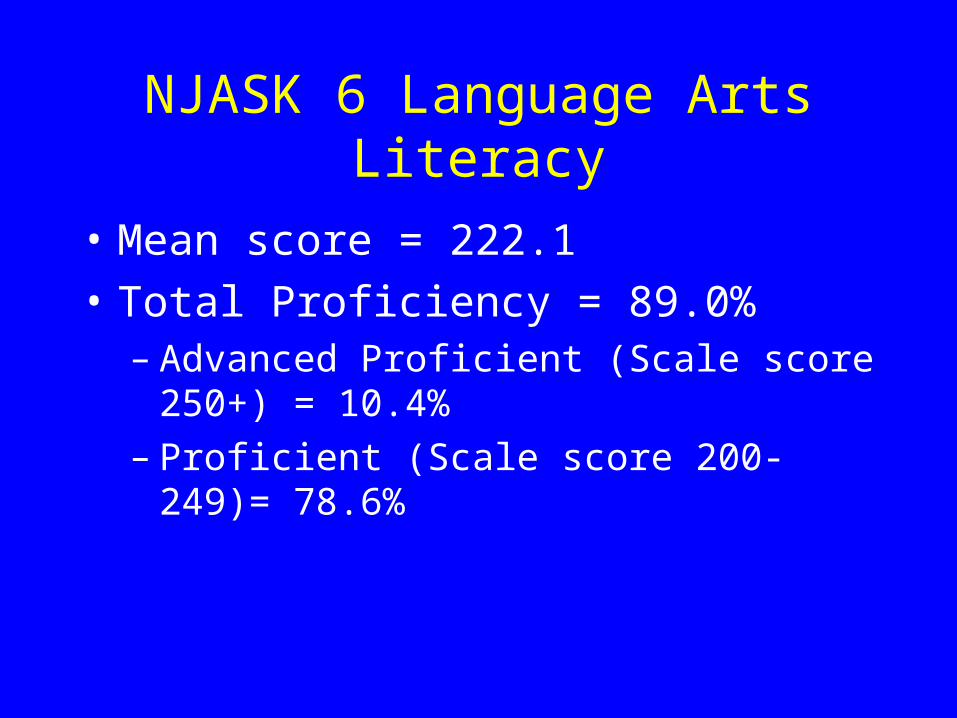
NJASK 6 Language Arts Literacy
• Mean score = 222.1
• Total Proficiency = 89.0%– Advanced Proficient (Scale score 250+) =
10.4%– Proficient (Scale score 200-249)= 78.6%

NJASK 6 Mathematics
• Mean score = 227.1
• Total Proficiency = 79.9%– Advanced Proficient (Scale score 250+) =
25.3%– Proficient (Scale score 200-249)= 54.6%

NJASK 6 LAL and Math:Comparison to DFG and State
25
35
45
55
65
75
85
95
LAL Math
ClarkDFG-FGState
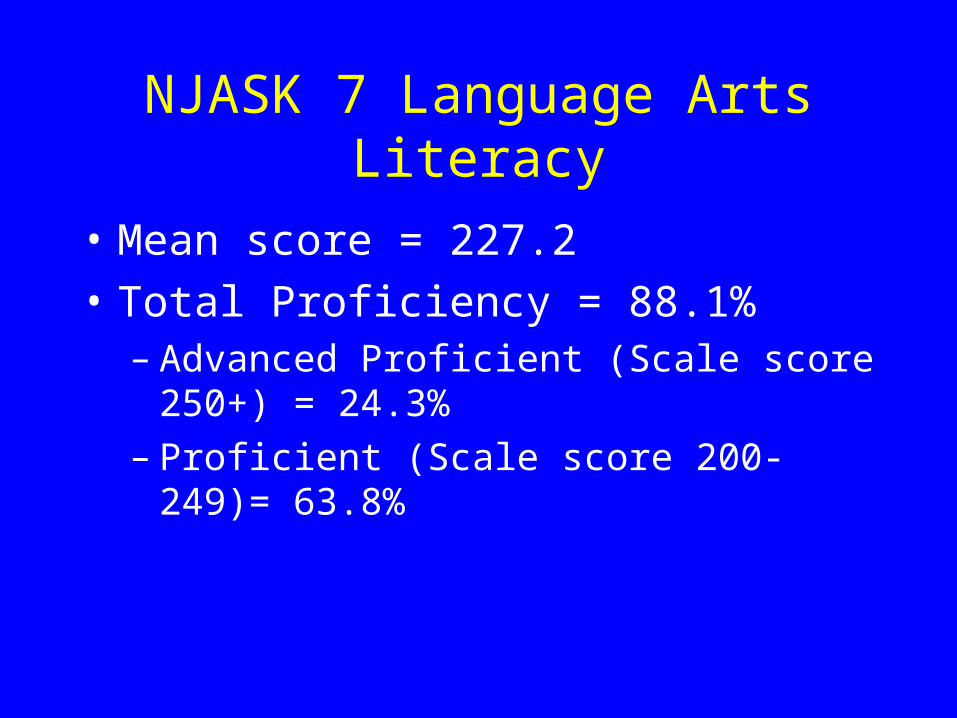
NJASK 7 Language Arts Literacy
• Mean score = 227.2
• Total Proficiency = 88.1%– Advanced Proficient (Scale score 250+) =
24.3%– Proficient (Scale score 200-249)= 63.8%

NJASK 7 Mathematics
• Mean score = 221.9
• Total Proficiency = 74.6%– Advanced Proficient (Scale score 250+) =
28.2%– Proficient (Scale score 200-249)= 46.3%

NJASK 7 LAL and Math:Comparison to DFG and State
50
55
60
65
70
75
80
85
90
LAL Math
ClarkDFG-FGState

NJASK 8 Language Arts Literacy
• Mean score = 231.0
• Total Proficiency = 97.0%– Advanced Proficient (Scale score 250+) =
14.9%– Proficient (Scale score 200-249)= 82.1%

NJASK 8 Mathematics
• Mean score = 229.7
• Total Proficiency = 86.5%– Advanced Proficient (Scale score 250+) =
32.5%– Proficient (Scale score 200-249)= 54%

NJASK 8 Science
• Mean score = 245.5
• Total Proficiency = 96.5%– Advanced Proficient (Scale score 250+) =
42.3%– Proficient (Scale score 200-249)= 54.2%

NJASK 8 LAL, Math, Science:Comparison to DFG and State
50556065707580859095
100
LAL Math Science
ClarkDFG-FGState

HSPA Language Arts Literacy
• Mean score = 229.8
• Total Proficiency = 92.1%– Advanced Proficient (Scale score 250+) =
15.8%– Proficient (Scale score 200-249)= 76.3%

HSPA Mathematics
• Mean score = 224.4
• Total Proficiency = 81.4%– Advanced Proficient (Scale score 250+) =
17.7%– Proficient (Scale score 200-249)= 63.7%

HSPA LAL and Math:Comparison to DFG and State
50
55
60
65
70
75
80
85
90
95
LAL Math
ClarkDFG-FGState

EOC Biology (raw scores):Comparison to DFG and State
29.5
30
30.5
31
31.5
32
32.5
33
EOC Biology
ClarkDFG-FGState

What are we doing to ensure student success?
• Differentiated instruction: “one size does not fit all”
• Standards-based curriculum planning
• Flexible scheduling with basic skills
• Better use of data to inform instruction
• Focused professional development for teachers and administrators

Summary:Comparison to previous performance
Areas of improvementNJASK 5,6,7,8 LAL: mean scores
NJASK 5,6,7 LAL: %Adv Prof
NJASK 4 Sci: mean and %AdvProf
NJASK 5,6,7 Math: %AdvProf
NJASK 8 Math: mean and %AdvPr
NJASK 8 Science: mean
HSPA LAL: mean
Areas of concernNJASK 3 Math
NJASK 5 Math
NJASK 4 LAL
NJASK 7 Math
HSPA Math

Summary:Comparison to DFG-FG
Above DFG-FG averages•NJASK 3 LAL
•NJASK 4 LAL
•NJASK 4 Math
•NJASK 4 Science
•NJASK 5 LAL
•NJASK 6 LAL
•NJASK 6 Math
•NJASK 7 LAL
•NJASK 7 Math
•NJASK 8 LAL
•NJASK 8 Math
•NJASK 8 Science
•HSPA LAL
•HSPA Math
•EOC Biology
Below DFG-FG averages•NJASK 3 Math
•NJASK 5 Math
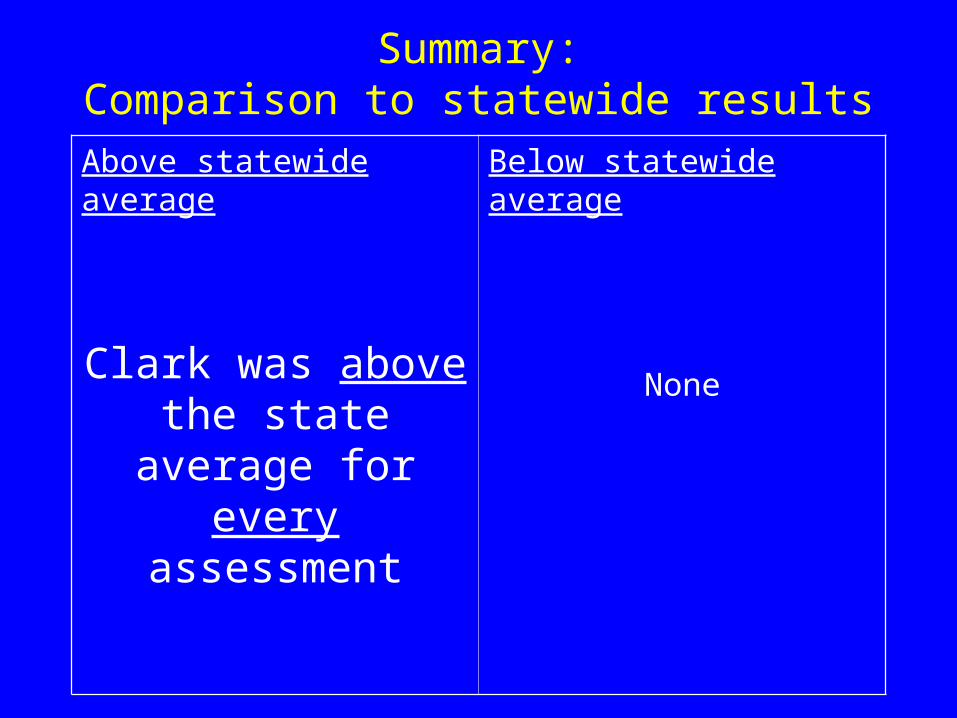
Summary:Comparison to statewide results
Above statewide average
Clark was above the state average for every
assessment
Below statewide average
None

Thanks!
• Renae LaPrete, Interim Superintendent
• District Administrators
• Teachers
• Education Services Personnel
• Parents