2014 Statewide Community Needs...
30
NEVADA DEPARTMENT of HEALTH and HUMAN SERVICES Brian Sandoval, Governor Michael J. Willden, Director 2014 Statewide Community Needs Assessment Conducted on behalf of the Grants Management Advisory Committee by the DHHS Grants Management Unit
Transcript of 2014 Statewide Community Needs...

NNEEVVAADDAA DDEEPPAARRTTMMEENNTT ooff
HHEEAALLTTHH aanndd HHUUMMAANN SSEERRVVIICCEESS
Brian Sandoval, Governor
Michael J. Willden, Director
2014 Statewide Community Needs Assessment
Conducted on behalf of the Grants Management
Advisory Committee by the DHHS Grants Management Unit

2014 Statewide Community Needs Assessment (GMAC/GMU) Page 2
Fund for a Healthy Nevada
2014 Statewide Community Needs Assessment
Conducted on behalf of the Grants Management Advisory Committee by the Department of Health and Human Services Grants Management Unit
Background In accordance with Nevada Revised Statute (NRS) 439.630(6), the Grants Management Advisory Committee (GMAC) is required to solicit public input regarding community needs in even-numbered years and use the information to recommend future funding priorities for the Fund for a Healthy Nevada (FHN). The Grants Management Unit in the Director’s Office of the Department of Health and Human Services (DHHS-DO GMU) provides staff support to the GMAC and has conducted a statewide needs assessment on its behalf. The results of the assessment are the subject of this report. Under NRS 439.630(6), the Commission on Aging (CoA) and the Commission on Services for Persons with Disabilities (CSPD) are also required to assess needs and make recommendations regarding use of the FHN. These two commissions are affiliated with the Division of Aging and Disability Services (ADSD). All three advisory bodies must submit recommendations to the DHHS Director by June 30, 2014, for consideration in the budgeting process for State Fiscal Years (SFY) 2016 and 2017. In addition to the recommendations tendered by the three bodies, the Director must (1) ensure that money expended from the FHN is not used to supplant existing methods of funding available to public agencies and (2) consider how the funds may be used to maximize federal and other resources [NRS 439.630(1)(j) and (k)]. The 2014 Statewide Community Needs Assessment is the second conducted by the DHHS-DO GMU on behalf of the GMAC. The first occurred in 2012 after the 2011 Legislature amended NRS 439.630 to eliminate specific funding allocations for program areas listed in the FHN and broaden the original provision for Children’s Health to include programs that “improve the health and well-being of residents of this State.” This category is now referred to as Wellness. The GMAC’s scope of authority as an advisory body includes:
Wellness [NRS 439.630(1)(g)] and
Services for Persons with Disabilities [NRS 439.630(1)(h)].

2014 Statewide Community Needs Assessment (GMAC/GMU) Page 3
Overview of the Needs Assessment Process The DHHS-DO GMU opened a survey online and in paper format on March 11, 2014. A total of 2,398 responses were received by the closing date of April 30, 2014. Of these, 195 (8%) were submitted in Spanish. These were translated and entered into the online system along with the English responses.
The first question was ultimately the most useful part of the survey. Respondents were asked: “If you could choose only one service to receive money from the Fund for a Healthy Nevada, what would it be?” This was an open-ended question with no listed services to choose from or checkmark. The intent was to allow respondents freedom of thought, and it essentially built the foundation for this report.
The second question asked respondents to read through a list of currently funded services and check no more than 10 they would like to see continued.
Questions three through eight were opportunities for respondents to share their ideas about new or different services that should be considered.
Questions nine through 12 collected demographic information about respondents including family characteristics and county of residence.
The DHHS-DO GMU also worked with community partners to conduct nine public forums across the state. Altogether, 147 people – the majority service providers – participated in the sessions.
Caliente – Caliente City Hall – March 6th
Carson City – Ron Wood Family Resource Center – April 23rd
Elko – Nevada Department of Public Safety – May 1st
Fallon – Old Post Office – May 1st
Las Vegas – Pearson Center – April 24th
Mesquite – Mesquite Senior Center – April 22nd
Reno – Washoe County School District Family Resource Center – April 25th
Winnemucca – Humboldt General Hospital – April 29th

2014 Statewide Community Needs Assessment (GMAC/GMU) Page 4
The ninth public forum was conducted as part of the regular quarterly meeting of the GMAC on March 13, 2014. Video-conference locations included the Nevada State Legislature in Carson City, the Grant Sawyer Building in Las Vegas and Great Basin College in Elko. At each forum (with the exception of Caliente), each participant was asked to write the top three needs in their community on post-it notes. The notes were then categorized by major service area. After group discussion, participants prioritized the needs by pasting colored stickers next to the major service area or the specific needs they supported. Each participant was provided with three of these stickers, which they could choose to distribute among multiple needs or just one need. The ideas the participants originally shared were not always the ideas they ultimately supported. In Caliente, with just three community leaders in attendance, the standard procedure evolved into a less formal, but very dynamic, group discussion. (See the Appendix for additional details about the public forums.)
Top Needs Results of the 2014 Statewide Community Needs Assessment are documented through the tables on the following pages. The first table (below) lists the top four major service categories identified by those who participated in the needs assessment. As the data shows, whether an individual submitted a survey or participated in a forum, the same four service categories emerged as the top priorities and in the same rank order. Ten other service categories were identified but only those listed on the next page received more than 10% support. (See the Appendix for additional details.)

2014 Statewide Community Needs Assessment (GMAC/GMU) Page 5
Top Four Service Categories Cited by Survey Respondents and Forum Participants
Rank Survey Support
Forum Support
Major Service Category
1 31.9% 26.2% Health / Mental Health
2 23.5% 24.0% Family Support
3 16.6% 11.8% Food Security
4 10.9% 10.8% Support for Persons with Disabilities and their Caregivers
Note that responses concerning Health and Mental Health were deliberately combined to create one category. During public forums, participants pointed out that an individual’s health and mental health needs often overlap. The State has also recognized this, and the 2013 Legislature merged two Divisions into one – Public and Behavioral Health. Nevertheless, as part of the analysis of survey and forum results, the two disciplines were separated to determine whether this would affect the overall outcome. The exercise ranked Family Support first (23.5%) followed by Health (22.9%), Food Security (16.6%), Support for Persons with Disabilities and their Caregivers (10.8%) and, in fifth position, Mental Health (9.0%). Even standing alone, Mental Health ranked more than 5% higher than the sixth ranked need – Education. Further analysis of the survey results documented that the four major service categories listed in the chart above ranked highest regardless of geography, and regardless of whether the respondent identified him/herself as a service provider. However, the order that the categories appear on the list did vary by area. (As noted, only the surveys were used for these comparisons.)
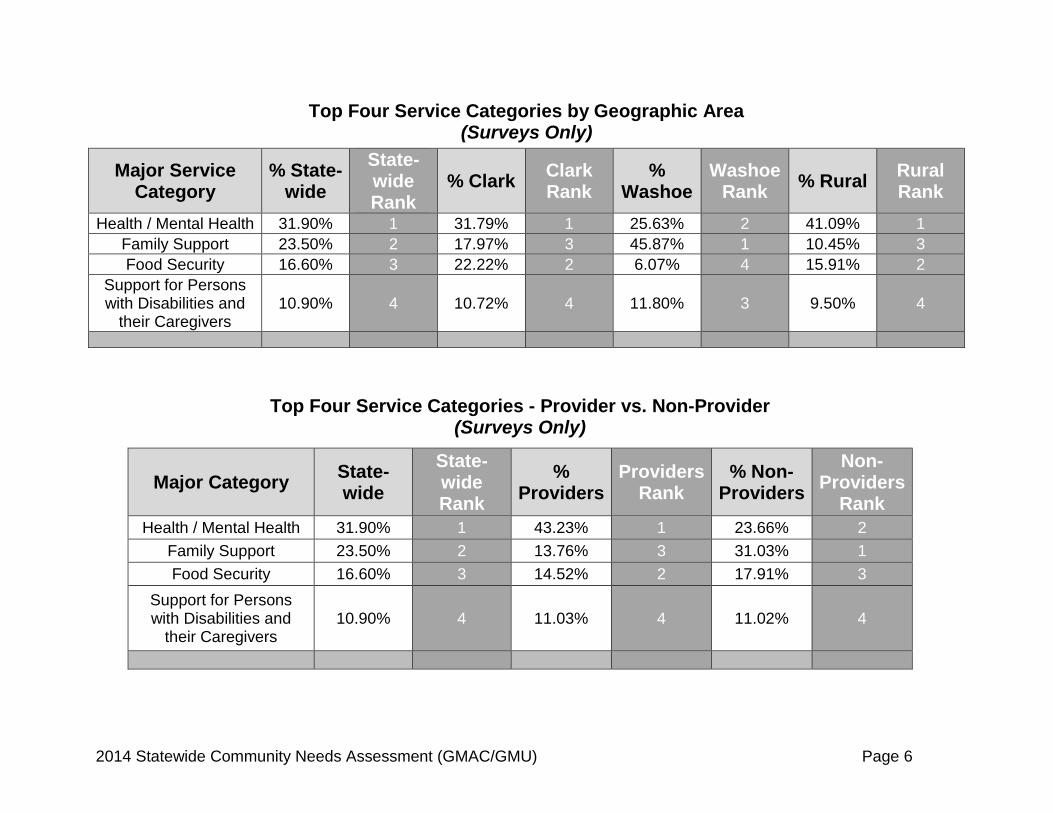
2014 Statewide Community Needs Assessment (GMAC/GMU) Page 6
Top Four Service Categories by Geographic Area (Surveys Only)
Major Service Category
% State- wide
State- wide Rank
% Clark Clark Rank
% Washoe
Washoe Rank
% Rural Rural Rank
Health / Mental Health 31.90% 1 31.79% 1 25.63% 2 41.09% 1
Family Support 23.50% 2 17.97% 3 45.87% 1 10.45% 3
Food Security 16.60% 3 22.22% 2 6.07% 4 15.91% 2
Support for Persons with Disabilities and
their Caregivers 10.90% 4 10.72% 4 11.80% 3 9.50% 4
Top Four Service Categories - Provider vs. Non-Provider (Surveys Only)
Major Category State- wide
State- wide Rank
% Providers
Providers Rank
% Non-Providers
Non-Providers
Rank
Health / Mental Health 31.90% 1 43.23% 1 23.66% 2
Family Support 23.50% 2 13.76% 3 31.03% 1
Food Security 16.60% 3 14.52% 2 17.91% 3
Support for Persons with Disabilities and
their Caregivers 10.90% 4 11.03% 4 11.02% 4

2014 Statewide Community Needs Assessment (GMAC/GMU) Page 7
Specific Services
The charts on the next four pages drill down into the specific kinds of services survey respondents and forum participants supported.
First Column: Following the overall name of some services, further explanation is provided in parentheses. This column also includes services listed in gray, italicized type. These are the services specifically identified by survey respondents and public forum participants. They are listed in the order they were most frequently cited.
Second Column: This shows the rank of the overall service within the category. Ranking was based on the frequency the overall service was cited.
Third Column: This column identifies state agency responsibility and whether any FHN money currently supports the services.
Fourth Column: If there is no FHN support for a service, or the service is supported both by FHN and another major resource, that information is included in the fourth column. Dollar figures for other funding sources are not included.

2014 Statewide Community Needs Assessment (GMAC/GMU) Page 8
HEALTH / MENTAL HEALTH Top Services Specified by Respondents
Most Frequently Requested Services Rank Responsible State
Agencies and SFY14 FHN Funding
Other Sources of Support and Oversight
Mental Health – Services for children and teens, substance abuse, suicide prevention, behavioral services, increased access, affordable, bilingual, veterans, seniors, housing
1
• Child and Family Services - $444,000
• Public and Behavioral Health - $4,031,467 • DHHS-DO GMU -
$132,362
Tobacco – Prevention/education especially for teens, smoke-free workplaces and casinos, cessation
2 • Public and Behavioral
Health - $980,048
Dental / Oral Health Care – Preventive, free or low-cost, special needs, more Medicaid providers
3 • Aging and Disability
Services – YTD $134,538 ¹
• Health Care Financing and Policy • Public and Behavioral Health
Immunization – Primarily children but also adults 4 • Public and Behavioral
Health - $500,000
Health/Wellness – Nutrition education, fitness, disease and obesity prevention, teen pregnancy prevention
5 • Public and Behavioral Health
Improved Access – Public health nurses, rural services, primary physicians, physicians accepting Medicare/Medicaid, emergency, bilingual, undocumented, rehab hospitals
6 • DHHS-DO GMU -
$56,000 • Public and Behavioral Health
• Health Care Financing and Policy
Help With Costs – Senior Rx, Disability Rx, increased Medicaid benefits/eligibility, low-cost, sliding scale or free clinics
7
• Aging and Disability
Services - $4,534,010 ¹ • DHHS-DO GMU -
$132,039
• Health Care Financing and Policy • Public and Behavioral Health
¹ A total of $4,668,948 in FHN money was allocated to Aging and Disability Services in FY14 to support the Senior Rx and Disability Rx programs.
As of May 2014, $134,538 has been spent for dental benefits so far. For purposes of this report, this amount was deducted from the total allocation and the balance was applied to prescription services. Actual spending for prescriptions may differ from the allocated amount.

2014 Statewide Community Needs Assessment (GMAC/GMU) Page 9
FAMILY SUPPORT Top Services Specified by Respondents
Most Frequently Requested Services Rank Responsible State
Agencies and SFY14 FHN Funding
Other Sources of Support and Oversight
Family Resource Centers – (Information and assistance, case management, supportive programs for families and individuals of all ages)
1 • DHHS-DO GMU -
$1,300,000
Differential Response – (Prevention of child abuse and neglect through crisis intervention and case management)
2 • DHHS-DO GMU -
$1,420,000
Information and Assistance – Outreach/Awareness, Nevada 211, Office of Consumer Health Assistance, Family Resource Centers, Aging and Disability Resource Centers
3 • DHHS-DO-GMU - $500,000 • DHHS Director's Office
• Aging and Disability Services
Child Care – Subsidies, licensed care facilities, help with care when seeking employment
4 • Division of Welfare and
Supportive Services

2014 Statewide Community Needs Assessment (GMAC/GMU) Page 10
FOOD SECURITY Top Services Specified by Respondents
Most Frequently Requested Services Rank Responsible State
Agencies and SFY14 FHN Funding
Other Sources of Support and Oversight
Food Pantries and Food Banks 1 • DHHS-DO GMU - $2,012,433
Nutrition – Access to nutritious foods, nutrition education 2
• Public and Behavioral
Health
• Welfare and Supportive
Services
Children – School breakfast, lunch, summer meals, weekend backpacks, after-school snacks
3 • Department of Agriculture
Supplemental Nutrition Assistance Program (SNAP) – Increase in benefits, expansion to unserved populations, relaxed eligibility, outreach
4 • Welfare and Supportive
Services - $287,567 (Outreach Only)
Home-Delivered Meals for Seniors 5 • Aging and Disability
Services
Women Infants and Children (WIC) – Supplemental food, nutrition education, breastfeeding support, health referrals
6
• Public and Behavioral
Health

2014 Statewide Community Needs Assessment (GMAC/GMU) Page 11
SUPPORT FOR PERSONS WITH DISABILITIES AND THEIR CAREGIVERS Top Services Specified by Respondents
Most Frequently Requested Services Rank Responsible State
Agencies and SFY14 FHN Funding
Other Sources of Support and Oversight
Respite Care – (Payment to ensure that those who care for persons with disabilities get an occasional break) – Children, adults, seniors, evening/weekend service
1 • DHHS-DO GMU - $650,000
• Aging and Disability Services - $198,857 ¹
• Aging and Disability Services
Positive Behavior Support – (Training to teach parents and other caregivers how to improve difficult behaviors caused by disabilities)
2 • DHHS-DO GMU - $325,000 • Aging and Disability
Services
Independent Living – Housing, home modifications, transportation, assistive technology, education, career opportunities, life skills training, blind training centers, legal assistance
3 • DHHS-DO GMU - $325,000 • Aging and Disability
Services
Autism – Applied behavioral analysis, therapy, treatment, careers, general support
4 • Aging and Disability Services -
$2,265,120
In-Home Services – Payment for family caregivers, general support
5 • Aging and Disability
Services
Traumatic Brain Injury – Rehabilitative therapy 6 • Aging and Disability Services -
$1,695,265
Family Preservation – (Cash assistance to help low-income families keep persons with severe or profound disabilities at home instead of placement in an institution)
7 • Aging and Disability Services -
$1,200,000
¹ Note that, with one caveat, Aging and Disability Services receives no FHN funds for Respite Care, Positive Behavior Support or Independent
Living for persons under the age of 60. The one caveat is that respite can be provided for persons younger than 60 if they have a diagnosis of dementia or Alzheimer's Disease. Aging and Disability Services estimates that about 20% of the $994,283 in FHN funds that are used for respite supports individuals who meet this criteria.

2014 Statewide Community Needs Assessment (GMAC/GMU) Page 12
Support for Current Services Question 2 of the survey asked respondents to choose up to 10 services currently funded through the Fund for a Healthy Nevada that should continue to be supported. A total of 2,329 respondents answered this question. While respondents were invited to choose up to 10 services for continued support, the average number of choices per respondent was actually 7.5. By design, each percentage and count listed in the chart below stands alone. Category totals are immaterial because the number of responses in each category was driven, at least in part, by the number of choices within the category. For example, only 13% of the responses (2,300 of 17,478) supported the two choices under Food Security. Yet, Food Pantries received the second highest percentage of support overall at 57.3%.
Support for Current Services
Survey respondents were asked to choose from one to 10 services that the DHHS-DO GMU currently funds and should continue funding.
Response Percent
Response Count
HEALTH / MENTAL HEALTH
Mental health services for children and youth 59.0% 1,373
Free or low-cost medical services for individuals and families without another resource 50.1% 1,167
Childhood Immunization 38.6% 900
Health Care Costs - Help finding insurance or another payment source 33.9% 789
Suicide Prevention 31.1% 725
Tobacco use prevention and cessation 17.6% 411
FAMILY SUPPORT
Family Resource Centers – A network of 22 centers around the state that individuals and families (of all ages and abilities) can call or visit to get information about services
56.0% 1,305
Child Abuse and Neglect - Prevention through crisis intervention and case management (Differential Response) 50.5% 1,176
Case Management – Assessment of an individual’s or a family’s situation and personal help resolving a wide range of problems
36.0% 839
Nevada 2-1-1 – A call center that people can contact 24 hours a day, seven days a week to get information about health and human services (an online directory is also available)
22.5% 523

2014 Statewide Community Needs Assessment (GMAC/GMU) Page 13
Support for Current Services, Continued Response
Percent Response
Count
FOOD SECURITY
Food Pantries 57.3% 1,334
Hunger One-Stop Shops 41.5% 966
SUPPORT FOR PERSONS WITH DISABILITIES AND THEIR CAREGIVERS
Transportation for Persons with Disabilities – Rides to medical appointments, the grocery store, appointments with social service providers, jobs and elsewhere in the community
38.9% 907
Family Preservation – Cash assistance to help low-income families keep persons with severe or profound disabilities at home (instead of placement in an institution)
34.9% 813
Respite Care – Payment to provide those who care for persons with disabilities get an occasional break 34.2% 797
Transitional Housing – To help persons with disabilities who are homeless, or are at risk of being placed in an institution, find and keep accessible housing
33.2% 773
Independent Living Service for Persons with Disabilities – Help learning the skills needed to live independently (for example, training a person with a visual impairment how to prepare a meal)
30.5% 710
Positive Behavior Support – Training to teach parents and other caregivers how to improve difficult behaviors caused by disabilities
28.0% 651
Autism - In-home therapy programs 22.3% 520
Adaptive Resources – To help persons with disabilities get and keep a job or live independently (for example, by providing a special computer program and then training the person how to use it)
21.5% 500
Traumatic Brain Injury - Rehabilitative therapy 12.8% 299
Answered Question 2,329
Total Choices 17,478
Average Number of Choices per Respondent 7.5
Note: Prescription Drug Help for Seniors and Persons with Disabilities (Senior Rx and Disability Rx) was also a choice on the list. Of the respondents who answered this question, 927 (39.8%) supported continued funding. This information was not included in the chart above because this service is actually managed by the Aging and Disability Services Division; not the DHHS-DO GMU.

2014 Statewide Community Needs Assessment (GMAC/GMU) Page 14
New Ideas The online and paper survey provided opportunities for respondents to share their ideas about new or different services that should be considered. The vast majority of responses were essentially requests for more funding of services already in place. However, some different ideas emerged and trends were noted. Following are services that could be evaluated for possible inclusion in future Requests for Applications issued by the DHHS-DO GMU and other state agencies.
Community, co-op and neighborhood gardens to help address hunger.
More food pantries located where families gather (e.g., Family Resource Centers and schools).
Nutrition education (e.g., cooking, nutrition, shopping on a budget, saving with coupons) to address both hunger and health.
Exercise (e.g., free gym/fitness memberships, more walking paths, school participation) to improve health and wellness.
Telemedicine services, especially in rural/frontier communities.
Programs to support grandparents raising grandchildren.
Programs that utilize parents as mentors for other parents, including parents caring for children with disabilities.
Education for caregivers of any person with a special need (child, adult or senior).
Common Threads Lack of transportation was a common thread across all survey answers, regardless of service category. Individuals and families, whether able-bodied or coping with disabilities, cannot travel to essential services. This is a particularly troublesome barrier in rural and frontier communities but is present in urban areas as well. As a category, assistance with transportation for able-bodied persons ranked ninth among survey respondents and sixth among forum participants. Lack of information about available services was another common theme. As one of the top seven priorities identified in the 2012 needs assessment, more stable funding was established for Nevada 2-1-1 and an Information and Referral (I&R) Strategic Plan was developed. The 2014 assessment sent a clear message that continued work in this field is needed to improve current I&R programs and conduct substantially more outreach and awareness activities. Ideas about how to accomplish that include media campaigns, internet presence, community meetings, and distributing literature at physicians’ offices, hospitals, schools, churches and libraries.

2014 Statewide Community Needs Assessment (GMAC/GMU) Page 15
Integration of services and the inter-connectedness of need were cited by many survey respondents and forum participants. People in need of assistance must visit and apply to multiple agencies to address all of their issues. One-stop shops and training case workers to take a wholistic approach to assisting clients were named as possible solutions.
Needs Assessment Results Compared to Nevada 2-1-1 Data As noted previously, survey results were sorted and compared to determine whether geographic location or the respondent’s status as a service provider made a difference in priority ranking. Results were also compared with data collected by Nevada 2-1-1 in Calendar Year 2013. As the chart below indicates, the top three categories in the needs assessment matched three of the top five referral categories tracked by Nevada 2-1-1. Services for Persons with Disabilities and their Caregivers was tracked by Nevada 2-1-1 as part of Individual, Family and Community Support.
Nevada 2-1-1 Top Needs / Referrals 2013
Problem / Need Response
Percent Response
Count
Housing and Utilities (includes rental assistance) 28.8% 22,279
Health Care / Mental Health 18.8% 14,569
Food and Meals 16.6% 12,854
Legal, Consumer and Public Safety 10.4% 8,091
Individual, Family and Community Support 7.4% 5,707
Other Government / Economic Services 5.4% 4,161
Transportation 3.8% 2,926
Employment 3.5% 2,723
Clothing, Personal and Household 2.0% 1,539
Education 1.4% 1,115
Information Services 0.7% 515
Volunteers and Donations 0.6% 472
Income Support and Assistance 0.5% 412
Disaster Services 0.1% 88
TOTALS 100.0% 77,451

2014 Statewide Community Needs Assessment (GMAC/GMU) Page 16
Demographic Characteristics Not all survey respondents provided information about themselves or their families. However, those who did offered a glimpse of their household characteristics. Forum participants were not asked to provide this information.
Characteristics of Respondent and/or Family Members Respondent Represented
How would you describe yourself and/or your family? Mark all items that apply.
Response Percent
Response Count
Family with children ages 0 – 4 years 26.3% 490
Family with children ages 5 – 12 years 31.8% 592
Family with children ages 13 – 18 years 26.1% 487
Family with children with special needs 11.4% 212
Senior Citizen (age 55+) 33.4% 622
Adult with a disability 14.9% 278
Veteran with a disability 5.5% 103
Child or youth with a disability 6.3% 118
Someone who provides care for a child with special needs 9.6% 179
Someone who provides care for a senior citizen 10.4% 194
Someone who provides care for an individual with a disability 11.5% 214
Other 15.9% 297
Number of Survey Respondents Who Answered 1,864
Total Number of Characteristics Marked (Not Including "Other") 3,489
Average Number of Characteristics Marked by Each Respondent 1.9

2014 Statewide Community Needs Assessment (GMAC/GMU) Page 17
Demographic Analysis As previously noted in this document, geography and whether the respondent identified him/herself as a service provider altered the four major service categories only in terms of ranking on the list. The top four remained the top four regardless. Similar comparisons were made based on family characteristics. The following most notable differences were identified but do not affect the overall outcome of the needs assessment. A negative percent means the category received less support than the statewide percentage and a positive percent means it received more support.
Demographic Group Health / Mental Health
Family Support
Food Security
Support for Persons
with Disabilities and their
Caregivers
Support for
Seniors¹
Statewide Percentage 31.9% 23.5% 16.6% 10.9% 2.7%
Families with children ages 0 - 18 -7% +12% -3%
Families caring for children with special needs -9% -3% +17%
Adult with Disability or Veteran with Disability (respondent or household member)
-5% -5% +6% +3%
Senior age 55+ (respondent or household member)
+8% -8% +5% -4%
Caregivers of senior or someone with disability -2% -11% +4% +7% +3%
¹ As a category, Support for Seniors ranked sixth among survey respondents and eighth among forum participants. The additional support among
those who provide care for seniors or someone with a disability still placed the category as sixth overall.

2014 Statewide Community Needs Assessment (GMAC/GMU) Page 18
County of Residence A little more than half of the survey respondents marked Clark County as their residence. Washoe County came in at 27.7% and all other counties accounted for 21.5% of the survey responses. Again, this data reflects only survey responses, not forum attendance.
Residence of Survey Respondents
County Response Percent
Response Count
Carson 3.9% 87
Churchill 1.8% 39
Clark 51.0% 1,124
Douglas 2.7% 60
Elko 3.7% 81
Esmeralda 0.0% 1
Eureka 0.1% 2
Humboldt 2.9% 64
Lander 0.1% 3
Lincoln 0.2% 4
Lyon 1.8% 39
Mineral 1.4% 30
Nye 1.8% 39
Pershing 0.7% 15
Storey 0.1% 2
Washoe 27.7% 610
White Pine 0.3% 6
Answered Question 2,206
Skipped Question 192
Rural - 21.5%
Washoe - 27.7%
Clark - 51%
Respondents by County

2014 Statewide Community Needs Assessment (GMAC/GMU) Page 19
Acknowledgements The DHHS-DO GMU wishes to thank the community partners who hosted and/or helped to coordinate public forums in eight communities across the state. Thanks also go to all those who completed online surveys, submitted paper surveys and/or participated in public forums. Without this input, the GMAC could not meet its statutory mandate to conduct an assessment. More importantly, the DHHS-DO GMU could not achieve its vision, mission and goals.
"The vision of the DHHS Grants Management Unit is to be a valued partner in strengthening the ability of communities to respond to human service needs."
"The mission of the Grants Management Unit is to strengthen families, promote
healthy outcomes, and support individuals to achieve self-sufficiency by working in partnership with community agencies."
Appendix
The following pages provide more detail about the 2014 Statewide Community Needs Assessment.
Lists of all service categories cited by survey respondents and forum participants – ranked statewide, ranked geographically and ranked based on whether the respondent indicated he/she was a service provider.
Details about public forums including the number and percentage of participants who supported particular service categories and any special details about each forum.
2012 funding priority recommendations adopted by the Grants Management Advisory Committee.
A chart listing the uses of Fund for a Healthy Nevada money by the Aging and Disability Services Division.
The most current fiscal reconciliation sheet listing FY14 allocations for the Fund for a Healthy Nevada.

2014 Statewide Community Needs Assessment (GMAC/GMU) Page 20
All Service Categories Cited by Survey Respondents and Forum Participants
Rank (Surveys)
Percent of Responses (Surveys)
Rank (Forums)
Percent of Responses (Forums)
Major Service Category Most Frequently Requested
Services Administration and
Oversight
1 31.9% 1 26.2% Health / Mental Health
Mental health including substance abuse and suicide
prevention, tobacco use prevention/cessation, dental
care, immunization, health/wellness, improved
access, help with costs, women’s health, disease-specific services,
services for children
• Public and Behavioral Health • DHHS-DO GMU
2 23.5% 2 24.0% Family Support Family Resource Centers,
Differential Response, child care
• DHHS-DO GMU
• Welfare and Supportive Services
3 16.6% 3 11.8% Food Security
Food pantries, food banks, nutrition, meal/snack programs
for children, Supplemental Nutrition Assistance Program
(SNAP), home-delivered meals for seniors, Women Infants and
Children (WIC)
• DHHS-DO GMU
• Welfare and Supportive Services • Public and Behavioral Health
4 10.9% 4 10.8% Support for Persons with
Disabilities and their Caregivers
Respite care, Positive Behavior Support, independent living, autism, in-home services,
Traumatic Brain Injury, Family Preservation
• DHHS-DO GMU
• Aging and Disability Services
5 4.0% 9 2.5% Education
Early Childhood Education, college grants/scholarships,
special education, English as a Second Language, computer
classes
• Department of Education • Nevada System of Higher
Education
6 2.7% 8 2.7% Support for Senior Citizens
Transportation, prescription help, home care, independent living, employment, legal, protective
services, veterans
• Aging and Disability Services

2014 Statewide Community Needs Assessment (GMAC/GMU) Page 21
All Service Categories Cited by Survey Respondents and Forum Participants, Continued
Rank (Surveys)
Percent of Responses (Surveys)
Rank (Forums)
Percent of Responses (Forums)
Major Service Category
Most Frequently Requested Services
Administration and Oversight
7 2.4% 5 6.9% Housing Affordable housing, subsidized,
transitional, senior, young mothers, supportive living
• U.S. Department of Housing and
Urban Development
8 1.9% 10 2.2% Youth Enrichment After-school programs, recreation
and drop-in centers, general youth enrichment
• City / County Governments • Community-Based Organizations
9 1.4% 6 5.2% Transportation Rural transportation, bus passes,
help with car insurance, automobile costs
• Department of Transportation • Community-Based Organizations
10 1.2% 11 2.2% Safety Prevention of domestic violence, child abuse, elder abuse, general
safety
• Child and Family Services • DHHS-DO GMU
• Aging and Disability Services • State and Local Law Enforcement
11 1.1% 13 0.7% Employment/Training More jobs, help finding jobs,
training
• Department of Employment Rehabilitation and Training
• Community-Based Organizations
12 1.0% 12 1.5% Cash Assistance Help with rent and utility bills, general need for increased
income regardless of source
• Welfare and Supportive Services • Community-Based Organizations
13 0.9% 14 0.5% Recreation Low-cost sports, out-of-town
trips, parks, bike paths, community pools
• City / County Governments • Aging and Disability Services
• Community-Based Organizations
14 0.7% 7 2.9% Homeless Services Shelters for special populations,
shower houses, housing
• DHHS Director's Office • Multiple State and Local Agencies • Community-Based Organizations

2014 Statewide Community Needs Assessment (GMAC/GMU) Page 22
All Service Categories by Geographic Area (Surveys Only)
Major Category State- wide
State- wide Rank
% Clark Clark Rank
% Washoe
Washoe Rank
% Rural Rural Rank
Health / Mental Health 31.90% 1 31.79% 1 25.63% 2 41.09% 1
Family Support 23.50% 2 17.97% 3 45.87% 1 10.45% 3
Food Security 16.60% 3 22.22% 2 6.07% 4 15.91% 2
Support for Persons with Disabilities and their
Caregivers 10.90% 4 10.72% 4 11.80% 3 9.50% 4
Education 4.00% 5 4.15% 5 2.87% 5 3.80% 7
Support for Senior Citizens
2.70% 6 2.03% 7 1.85% 6 4.75% 5
Housing 2.40% 7 2.71% 6 1.52% 7 2.38% 8
Youth Enrichment 1.90% 8 1.55% 9 0.84% 9 4.28% 6
Transportation 1.40% 9 1.64% 8 0.34% 11 2.14% 9
Safety 1.20% 10 0.87% 13 1.52% 8 1.19% 10
Employment/Training 1.10% 11 1.26% 10 0.84% 10 1.19% 11
Cash Assistance 1.00% 12 1.26% 11 0.34% 12 0.95% 14
Recreation 0.90% 13 0.97% 12 0.34% 13 1.19% 12
Homeless Services 0.70% 14 0.87% 14 0.17% 14 1.19% 13

2014 Statewide Community Needs Assessment (GMAC/GMU) Page 23
All Service Categories - Provider vs. Non-Provider (Surveys Only)
Major Category Statewide Statewide
Rank %
Providers Providers
Rank % Non-
Providers
Non-Providers
Rank
Health / Mental Health 31.90% 1 43.23% 1 23.66% 2
Family Support 23.50% 2 13.76% 3 31.03% 1
Food Security 16.60% 3 14.52% 2 17.91% 3
Support for Persons with Disabilities and their
Caregivers 10.90% 4 11.03% 4 11.02% 4
Education 4.00% 5 4.37% 5 3.64% 5
Support for Senior Citizens 2.70% 6 3.28% 6 2.01% 7
Housing 2.40% 7 1.64% 9 2.97% 6
Youth Enrichment 1.90% 8 2.40% 7 1.44% 8
Transportation 1.40% 10 1.42% 10 1.44% 9
Safety 1.20% 11 1.42% 11 0.77% 15
Employment/Training 1.10% 12 1.09% 12 1.15% 10
Cash Assistance 1.00% 13 0.66% 13 0.96% 13
Recreation 0.90% 14 0.66% 14 1.05% 12
Homeless Services 0.70% 15 0.55% 15 0.96% 14

2014 Statewide Community Needs Assessment (GMAC/GMU) Page 24
Results of Public Forums
Major Service Category Caliente
[3]
Carson City
[8]
Elko
[20]
Fallon
[20]
GMAC
[16]
Las Vegas
[24]
Mesquite
[14]
Reno
[26]
Winne- mucca
[16]
Totals
[147]
Percent of Total
Health / Mental Health 3 6 23 12 10 17 17 8 11 107 26.23%
Family Support 12 10 6 25 1 26 18 98 24.02%
Food Security 3 6 3 3 9 4 3 16 1 48 11.76%
Support for Persons with Disabilities and their
Caregivers 3 3 9 4 4 2 18 1 44 10.78%
Housing 3 8 4 4 9 28 6.86%
Transportation 10 7 4 21 5.15%
Homeless 8 1 3 12 2.94%
Support for Senior Citizens 3 2 5 1 11 2.70%
Education 1 5 4 10 2.45%
Youth Enrichment 3 5 1 9 2.21%
Safety 5 2 1 1 9 2.21%
Cash Assistance 6 6 1.47%
Employment/Training 1 1 1 3 0.74%
Recreation 2 2 0.49%
15 16 60 56 40 65 33 75 48 408 100.00%

2014 Statewide Community Needs Assessment (GMAC/GMU) Page 25
Highlights of Public Forums
Caliente – In Caliente, three community leaders participated in a discussion that began by identifying individual needs such as hunger and mental health but ended with a vision for a youth center that would address many needs. Children and youth could drop in, obtain help with homework, find support or counseling, take part in snacks or meals, and participate in recreational activities. A variety of funding sources might be pursued to bring the idea to fruition. Carson City – In Carson City, two needs were cited that did not receive significant attention elsewhere. Special assistance for individuals and families who do not speak English and/or are undocumented was discussed at length. As one participant explained, these barriers magnify the same needs that English-speaking citizens experience. Meanwhile, bike paths, walking paths and other recreational opportunities were identified as important ways to improve health. This concept is included in the Carson City Community Health Assessment published in June 2012 (available online at “gethealthycarsoncity.org”). Elko – In Elko, forum participants emphasized that there are not enough health care providers in the community and agreed that adding public health nurses would help alleviate the situation. Transportation was a connected need since many community residents must travel to Reno for health care. One participant observed that there is a perception the road from Reno to Elko is longer than the road from Elko to Reno because, under normal circumstances, no one would travel 290 miles to the northeast just to see a doctor. Fallon – In Fallon, a number of service providers who attended the forum became aware of community services that had previously been unknown to them. Contact information was exchanged, and many planned to attend future meetings of a local human services networking group. Las Vegas – In Las Vegas, participants supported health care especially for the uninsured, undocumented and under-served. As part of support for families, the point was made that parents need help with child care costs when they are looking for employment in addition to receiving subsidies after they secure a job. Mesquite – In Mesquite, significant support was expressed for smoke-free schools, workplaces, casinos and the city as a whole. Participants also asked for education on the dangers of second-hand smoke and tobacco use in general. Reno – In Reno, forum participants saw first-hand the inter-connectedness of service. The mother of a child with autism shared that the family’s quality of life mproved dramatically with the help of the Positive Behavior Support program.

2014 Statewide Community Needs Assessment (GMAC/GMU) Page 26
Minutes later, when she learned that the respite care her family receives from another program also relies on grants from the Fund for a Healthy Nevada, she expressed support for continuing that service as well.
Winnemucca – In Winnemucca, forum participants cited everything from cultural opportunities to emergency services when discussing the pressing need for more family support in that community. As in some other rural areas, transportation
was cited as a need not just for seniors and persons with disabilities but for the population in general. Simply getting to work is a challenge for some residents.

2014 Statewide Community Needs Assessment (GMAC/GMU) Page 27
Final Recommendations of the GMAC/GMU
Community Needs Assessment 2012 Senate Bill (SB) 421 required the Grants Management Advisory Committee (GMAC), Commission on Aging (CoA) and the Commission on Services for Persons with Disabilities (CSPD) to seek community input on the needs of Nevada citizens. This input was to be considered when developing recommendations to the Director of the Department of Health and Human Services (DHHS) for the allocation of funds administered under the Fund for a Healthy Nevada (FHN). In response to the SB 421 mandate, the Grants Management Unit (GMU), on behalf of the GMAC, sought input from Nevada communities through the use of:
A written survey which received 3,059 responses; A summary of a previous written survey administered through the Community Services Block Grant (CSBG)
programs in the spring of 2011 that received 2,976 responses, and
Fourteen public forums held across the state, drawing 372 participants. The following table provides a summary of the top seven results, in order of priority, identified by each survey method through the assessment process.

2014 Statewide Community Needs Assessment (GMAC/GMU) Page 28
Table I: Executive Summary – Comparison of survey input sources
After a review of the GMU’s Statewide Assessment, oral presentations from the CoA and CSPD regarding the results of their assessments, and extensive discussion through both an Ad Hoc Subcommittee and the June 14, 2012, GMAC meeting, the committee reached the consensus that the priorities should be limited to four primary areas of focus. The following recommendations were made. Primary Priorities
Food Insecurity with objectives to meet short/immediate, medium and long term needs.
Health Care with an emphasis on dental care, mental health, tobacco control, alcohol and obesity related conditions, suicide and childhood immunization.
Family Supports with a focus on children, seniors and other vulnerable populations.
Help Finding information to include 2-1-1, education and outreach, and information and referral.
SURVEY MONKEY PROVIDER RESPONSES
SURVEY MONKEY COMMUNITY MEMBER
RESPONSES
COMMUNITY SERVICES BLOCK GRANT PROGRAM
SURVEY
PUBLIC FORUMS
Food Health Care Health Care Health Care
Transportation Dental Care Dental Care Family Supports: Children & Seniors
Health Care Food Food Housing
Help Finding Information
Help Finding Employment
Help Finding Employment
Education
Housing Utilities Transportation Transportation
Dental Care Housing Housing Help Finding Employment
Help Finding Employment
Help Finding Information
Utilities Mental Health & Substance Abuse

2014 Statewide Community Needs Assessment (GMAC/GMU) Page 29
Secondary Priorities
Transportation
Help Finding Employment
Housing
Education
Utilities In addition, the following strategies were recommended to encourage systemic change. These would be addressed in the FY14-15 Request for Application (RFA).
The secondary priorities should be addressed as components in grant-funded projects as appropriate. For example, if a proposed project is centered on access to health care but transportation to appointments is a barrier, then the grant applicant would need to address this need. This approach recognizes the interconnectedness of service.
Collaboration should be expanded to include new public/private partnerships.
All grant-funded projects should be required to do outreach and marketing for 2-1-1, as well as education and outreach in general.
Family Resource Centers (FRC) are already in place and should be considered as a service delivery method.
Project sustainability must be addressed in all proposals.
Projects need to identify and maximize the benefits available through under-utilized resources, both private and public, e.g., the Supplemental Nutrition Assistance Program (SNAP).
Consider programs currently supported by funding streams that fall within the GMAC’s scope of work. Are the services provided by these programs effective, impacting the community and do they fit the priorities identified by the GMAC?

2014 Statewide Community Needs Assessment (GMAC/GMU) Page 30
Balance Forward from Previous Year: 46,439,371
Use Category
Administrative
Costs
Program
Costs Total
439.630 (c) - Senior Rx (168,411) (4,065,142) (4,233,553)
439.630 (d) - Senior IL (244,387) (4,981,030) (5,225,417)
439.630 (e) - Assisted Living - (200,000) (200,000)
439.630 (f) - Cessation: - (980,048) (980,048)
439.630 (g) - Wellness: (216,772) - (216,772)
- Suicide Prevention - (500,000) (500,000)
- Hunger - (2,300,000) (2,300,000)
- Immunization - (500,000) (500,000)
- 2-1-1 Support - (500,000) (500,000)
- Health Access - (300,000) (300,000)
- Nevada Health Information Exchange - (56,000) (56,000)
- Children's Mental Health - (444,000) (444,000)
- Differential Response (66,917) (1,420,000) (1,486,917)
- Family Resource Centers (61,262) (1,300,000) (1,361,262)
- SNAMHS - PACT - (300,000) (300,000)
- SNAMHS - Home Visiting Program - (325,000) (325,000)
- SNAMHS - Housing and Housing Supports (300,000) (300,000)
- MH Set-Aside Dvoskin Recommendations - (1,000,000) (1,000,000)
- NNAMHS - Home Visiting Program - - -
- Lakes Crossing Additional Beds - (875,655) (875,655)
- SAPTA (FY14 Special Allocation Only) - (730,812) (730,812)
439.630 (h) - Disability Services (61,262) - (61,262)
- Respite - (650,000) (650,000)
- Positive Behavior Support - (325,000) (325,000)
- Independent Living Grants - (325,000) (325,000)
- Traumatic Brain Injury - (1,695,265) (1,695,265)
- Autism - (2,265,120) (2,265,120)
- Family Preservation - (1,200,000) (1,200,000)
439.630 (i) - Disability Rx (20,815) (603,806) (624,621)
Transfer to Millinnium Scholarship (1085) (13,534) - (13,534)
Treasurer's Admin Expenditures (59,079) - (59,079)
Total Expenditures: (912,438) (28,141,878) (29,054,316)
Revenue:
- April 2014 Payment 23,416,163
- Prior Year Funds Returned to FHN 69,299
- Treasurer's Interest 52,690
Total Revenue: 23,538,152
Balance Forward to Next Year: 40,923,207
Tobacco Settlement Fund
Department of Health and Human Services
Fiscal Year 2014