Analysis and Interpretation - NEW NEW
19
Performance of FII Activity over the period of 2004-2013: year Gross purchase(cr Gross sa!es(cr "et Investments(cr 2004 185672 146706.8 38965.2 2005 286021.4 238840.9 47180.5 2006 475624.9 439084.1 36540.8 2007 814877.9 743392 71485.9 2008 721607 774594.3 -52987.3 2009 624239.7 540814.7 83425 2010 766283.2 633017.1 133266.1 2011 611055.6 613770.8 -2715.2 2012 669184.4 540823.9 128360.5 2013 794231.7 681264.7 112967 #ota! $%4&'%'& $3$230%3 $%)4&&$ *hart: FII Investments FII Investments Interpretation: From the above table we can find Performance of F !ctivit" over the #eriod of 2004-2013. From 2004 to 2013 we can ob$erve that increa$ed the %ro$$ #&rcha$e$ and the %ro$$ $ale$ in increa $ed when we com#are to inve$ tment $ on %ro$$ #&rcha $e$. 'hi$ i$ ver" #o$$ibl e im#act of $ale$ on %ro$$ #&rcha$e$.
-
Upload
saiyuvatech -
Category
Documents
-
view
219 -
download
0
Transcript of Analysis and Interpretation - NEW NEW

7/24/2019 Analysis and Interpretation - NEW NEW
http://slidepdf.com/reader/full/analysis-and-interpretation-new-new 1/19
Performance of FII Activity over the period of 2004-2013:
year
Gross
purchase(cr
Gross
sa!es(cr
"et
Investments(cr
2004 185672 146706.8 38965.2
2005 286021.4 238840.9 47180.52006 475624.9 439084.1 36540.8
2007 814877.9 743392 71485.9
2008 721607 774594.3 -52987.3
2009 624239.7 540814.7 83425
2010 766283.2 633017.1 133266.1
2011 611055.6 613770.8 -2715.2
2012 669184.4 540823.9 128360.5
2013 794231.7 681264.7 112967#ota! $%4&'%'& $3$230%3 $%)4&&$
*hart:
FII Investments
FII Investments
Interpretation:
From the above table we can find Performance of F !ctivit" over the #eriod of 2004-2013.
From 2004 to 2013 we can ob$erve that increa$ed the %ro$$ #&rcha$e$ and the %ro$$ $ale$ in
increa$ed when we com#are to inve$tment$ on %ro$$ #&rcha$e$. 'hi$ i$ ver" #o$$ible im#act of $ale$ on %ro$$ #&rcha$e$.
7/24/2019 Analysis and Interpretation - NEW NEW
http://slidepdf.com/reader/full/analysis-and-interpretation-new-new 2/19
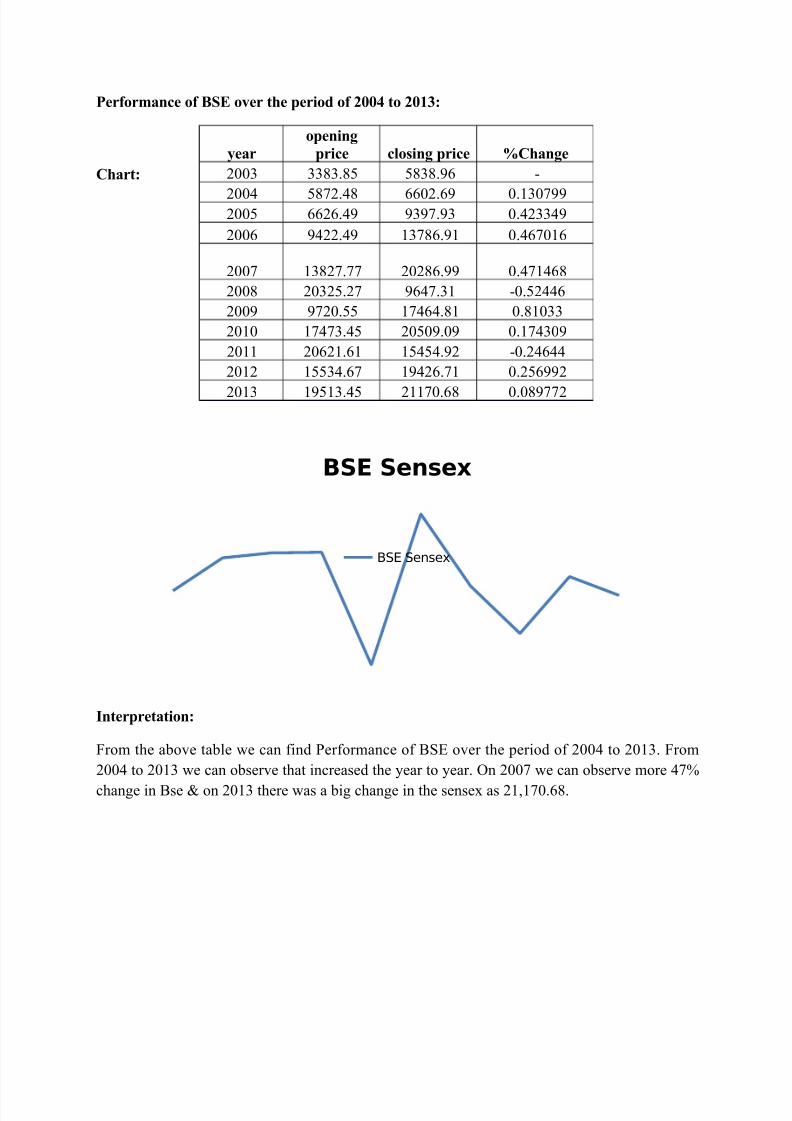
Performance of +, over the period of 2004 to 2013:
*hart:
BSE Sensex
BSE Sensex
Interpretation:
From the above table we can find Performance of ()* over the #eriod of 2004 to 2013. From
2004 to 2013 we can ob$erve that increa$ed the "ear to "ear. +n 2007 we can ob$erve more 47,
chan%e in ($e on 2013 there wa$ a bi% chan%e in the $en$e a$ 21/170.68.
year
openin.
price c!osin. price
/*han.e
2003 3383.85 5838.96 -
2004 5872.48 6602.69 0.1307992005 6626.49 9397.93 0.423349
2006 9422.49 13786.91 0.467016
2007 13827.77 20286.99 0.471468
2008 20325.27 9647.31 -0.52446
2009 9720.55 17464.81 0.81033
2010 17473.45 20509.09 0.174309
2011 20621.61 15454.92 -0.24644
2012 15534.67 19426.71 0.256992
2013 19513.45 21170.68 0.089772
7/24/2019 Analysis and Interpretation - NEW NEW
http://slidepdf.com/reader/full/analysis-and-interpretation-new-new 3/19
7/24/2019 Analysis and Interpretation - NEW NEW
http://slidepdf.com/reader/full/analysis-and-interpretation-new-new 4/19
F!uctuations for +, *!osin. prices over the period 2004-2013:
ear +,*!osin. prices F!uctuation
2003 5838.96 -
2004 6602.69 763.73
2005 9397.93 2795.24
2006 13786.91 4388.98
2007 20286.99 6500.08
2008 9647.31 -10639.7
2009 17464.81 7817.5
2010 20509.09 3044.282011 15454.92 -5054.17
2012 19426.71 3971.79
2013 21170.68 1743.97
*hart:
BSE Senesx Closing Prices
uctuation
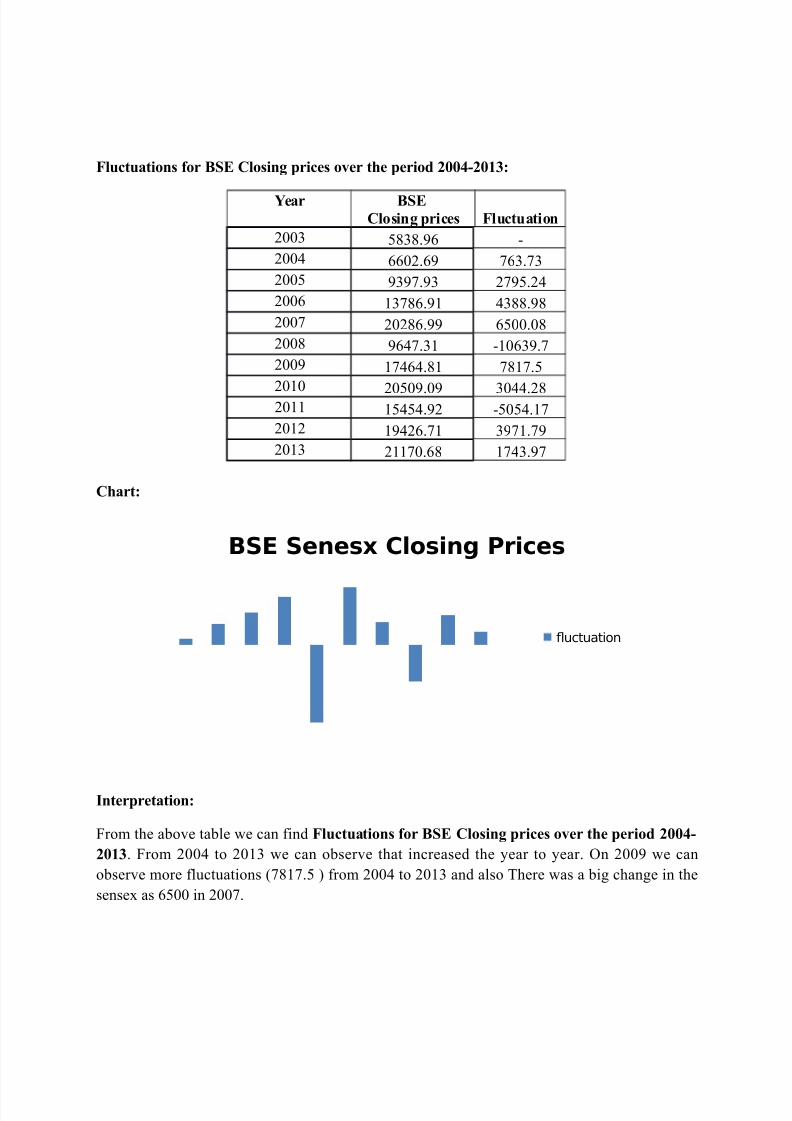
Interpretation:
From the above table we can find F!uctuations for +, *!osin. prices over the period 2004-
2013. From 2004 to 2013 we can ob$erve that increa$ed the "ear to "ear. +n 2009 we can
ob$erve more fl&ct&ation$ 7817.5 from 2004 to 2013 and al$o 'here wa$ a bi% chan%e in the
$en$e a$ 6500 in 2007.

7/24/2019 Analysis and Interpretation - NEW NEW
http://slidepdf.com/reader/full/analysis-and-interpretation-new-new 5/19
7/24/2019 Analysis and Interpretation - NEW NEW
http://slidepdf.com/reader/full/analysis-and-interpretation-new-new 6/19
F!uctuations for ", *!osin. prices over the period 2004-2013:
year
,9P *"6 "ifty
*!osin. prices
F!uctuation
2003 1879.7 -
2004 2080.5 200.8
2005 2836.55 756.05
2006 3966.4 1129.85
2007 6138.6 2172.2
2008 2959.15 -3179.45
2009 5201.05 2241.9
2010 6134.5 933.45
2011 4624.3 -1510.2
2012 5905.11280.8
2013 6304 398.9
*hart:
NSE Closing price
F!uctuation
7/24/2019 Analysis and Interpretation - NEW NEW
http://slidepdf.com/reader/full/analysis-and-interpretation-new-new 7/19
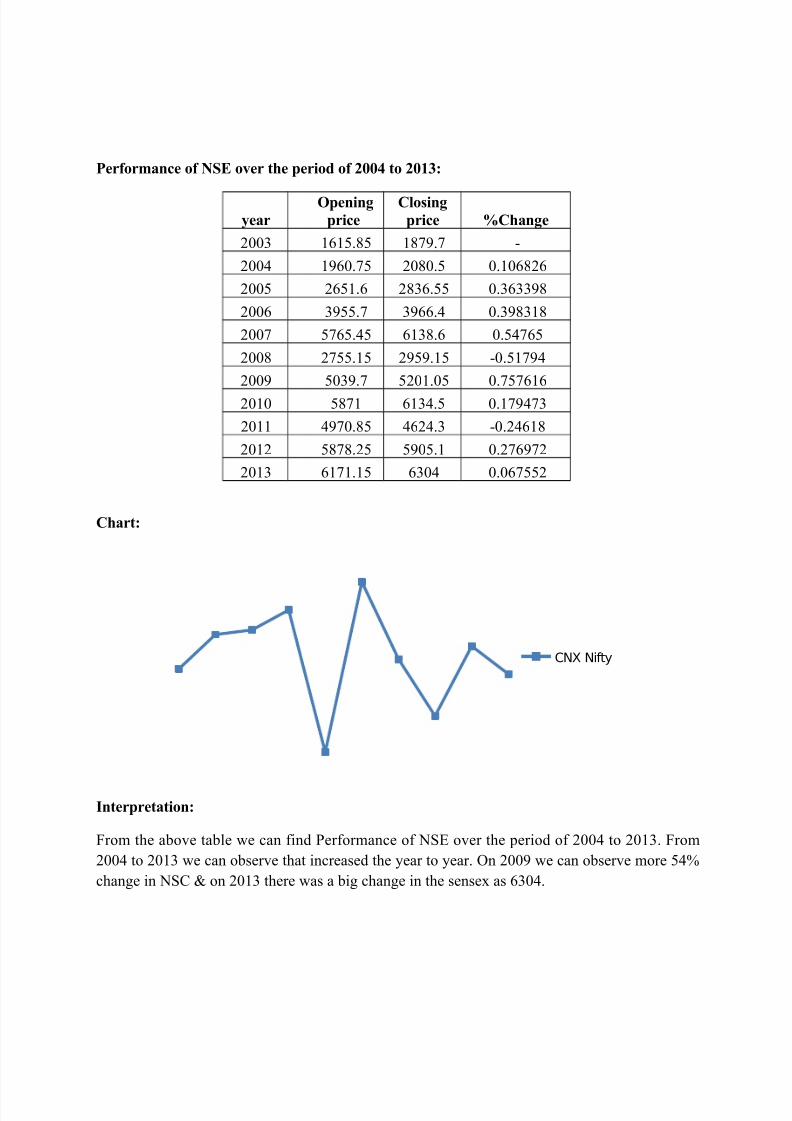
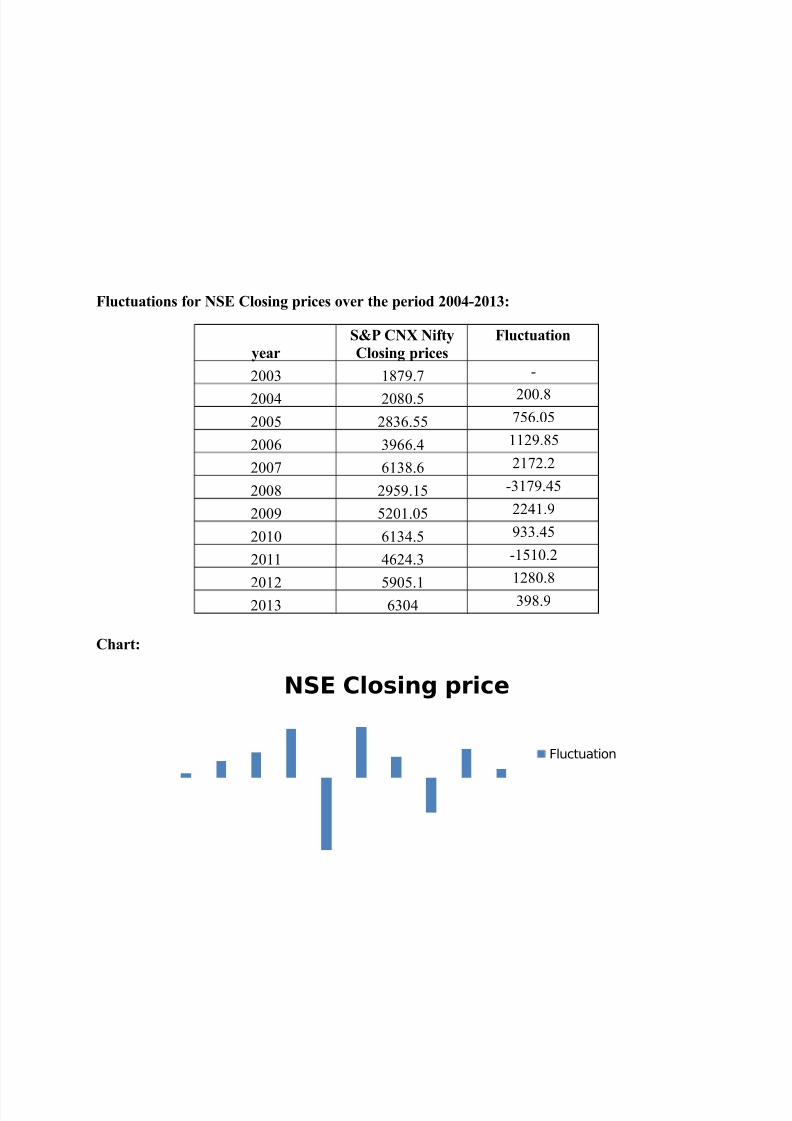
Interpretation:
From the above table we can find F!uctuations for ",* *!osin. prices over the period 2004-
2013. From 2004 to 2013 we can ob$erve that increa$ed the "ear to "ear. +n 2009 we can
ob$erve more fl&ct&ation$ 2241.9 from 2004 to 2013 and al$o 'here wa$ a bi% chan%e in the
$en$e a$ 2172.2 in 2007.
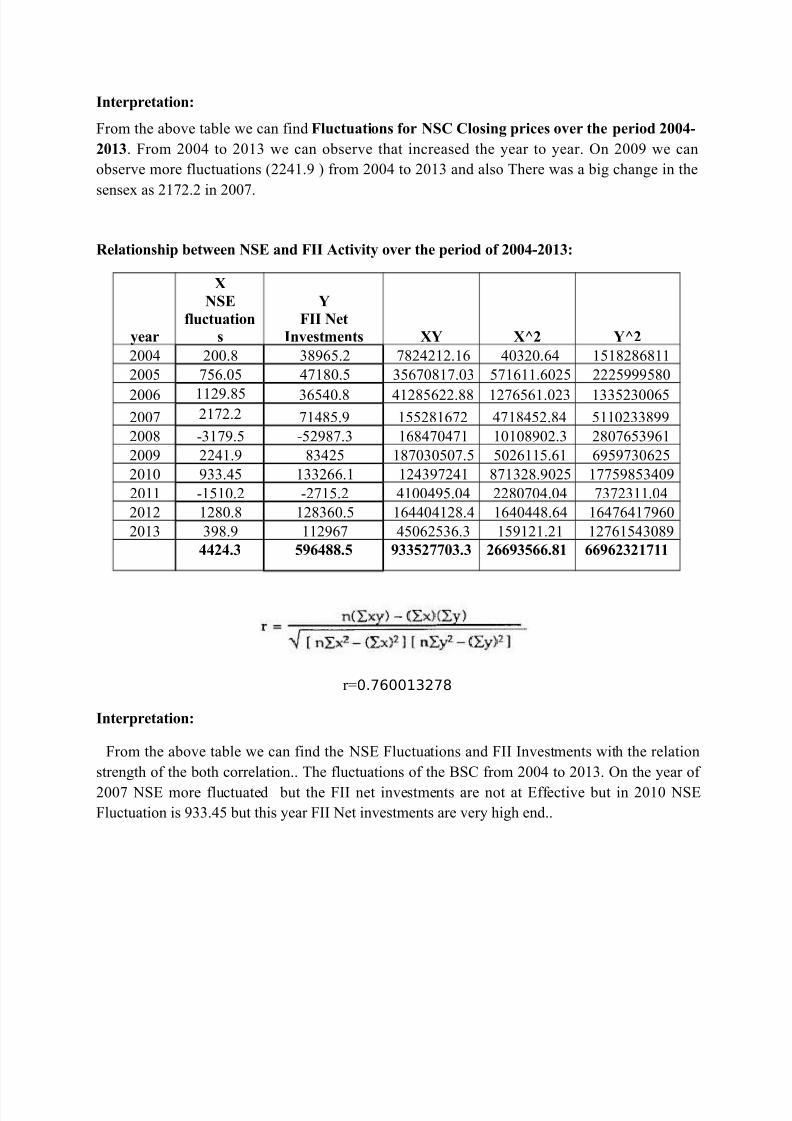
e!ationship eteen ", and FII Activity over the period of 2004-2013:
year
6
",
f!uctuation
s
FII "et
Investments 6 672 72
2004 200.8 38965.2 7824212.16 40320.64 1518286811
2005 756.05 47180.5 35670817.03 571611.6025 2225999580
2006 1129.85 36540.8 41285622.88 1276561.023 1335230065
2007 2172.2 71485.9 155281672 4718452.84 5110233899
2008 -3179.5 -52987.3 168470471 10108902.3 2807653961
2009 2241.9 83425 187030507.5 5026115.61 6959730625
2010 933.45 133266.1 124397241 871328.9025 17759853409
2011 -1510.2 -2715.2 4100495.04 2280704.04 7372311.04
2012 1280.8 128360.5 164404128.4 1640448.64 16476417960
2013 398.9 112967 45062536.3 159121.21 12761543089
44243 $%)4&&$ %33$2''033 2))%3$))&1 ))%)2321'11
r0.76001"7#
Interpretation:
From the above table we can find the )* Fl&ct&ation$ and F nve$tment$ with the relation
$tren%th of the both correlation.. 'he fl&ct&ation$ of the () from 2004 to 2013. +n the "ear of
2007 )* more fl&ct&ated b&t the F net inve$tment$ are not at *ffective b&t in 2010 )*
Fl&ct&ation i$ 933.45 b&t thi$ "ear F et inve$tment$ are ver" hi%h end..

7/24/2019 Analysis and Interpretation - NEW NEW
http://slidepdf.com/reader/full/analysis-and-interpretation-new-new 8/19
e!ationship eteen FIIs Purchase and FIIs sa!es on moments of ,",6 for the ear
2010-2011:
;onth +se
FII
Purchases
FII
,a!es
FII
"et +se (/
FII Purchases
(/
FII
,a!es (/
arch
17527.7
7 59692.57
44900.2
4
14792.3
3 - - -
!#ril
17558.7
1 55061.05
52393.6
8 2667.37
0.00176519
9 -0.077589556 0.16689087
a"16944.6
3 49588.0461659.1
6 -12071.1 -0.03497296 -0.09939894 0.17684347
&ne 17700.9 51878.01
44164.0
6 7713.95
0.04463183
9 0.046179885 -0.2837389
&l"17868.2
9 52571.2144030.1
5 8541.060.00945658
1 0.013362116 -0.0030321
!&%&$t
17971.1
2 56120.24
48582.9
4 7537.3
0.00575488
8 0.067509004 0.10340165
)e#tember
20069.1
2 74920.16
52444.5
2
22475.6
4 0.116742863 0.334993578 0.07948428
+ctober
20032.3
4 77706.1
63318.0
4
14388.0
6 -0.00183267 0.037185452 0.20733377
ovember
19521.2
5 79726.26
74375.3
9 5350.87 -0.02551325 0.025997444 0.17463191
ecember
20509.0
9 52683.49
53405.6
8 -722.19
0.05060331
7 -0.339195266 -0.2819442
an&ar"18327.7
6 57526.0766429.6
7 -8903.6 -0.10635918 0.09191836 0.243869
Febr&ar" 17823.4 57097.91 64311.3 -7213.39 -0.02751891 -0.007442886 -0.0318889
arch
19445.2
2 52192.02
44215.1
3 7976.89
0.09099386
2 -0.085920658 -0.3124827
*orre!ation 00%41'42%$ -0)213&2'
*hart:

7/24/2019 Analysis and Interpretation - NEW NEW
http://slidepdf.com/reader/full/analysis-and-interpretation-new-new 9/19
BSE $ c%an&e
FII 'u(c%ases)$*
FII Sa!es)$*
Interpretation:
• Interpretation : above table and chart indicatin% vol&me$ of Forei%n n$tit&tional nve$tor$ for
the "ear 2010-2011. t$ clearl" $howin% $en$e $hown 60, %rowth. !nd we can $ee1500 #oint$
variation toward$ b&lli$h one. +ther than &ne 2010 and a" 2010 remainin% month$ #&rch$e$
are increa$ed than $ale$. :hen con$iderin% mar;et information b" vario&$ anal"$t$ / )en$e
$how$ #o$itive im#act when F<) #&rcha$e$ increa$ed/ b&t it$ not onl" the factor for the %rowth
of ,",6 for thi$ #artic&lar #eriod.
• !bove %ra#h indicatin% correlation between #&rcha$e$ of F=$/ $ale$ of F=$ and moment$ of
,",6. :e can $ee abnormal fl&ct&ation$ in #&rcha$e$ and $ale$ b&t not in )en$e/ beca&$e
)en$e #erformance not onl" de#end$ on F<) / there are $o man" factor$ li;e >P >rowth/
nflation/ m#act of international mar;et$/ im#act of financial re$<$ and #olitical im#act. am
concl&din% )en$e #erformance for thi$ "ear $table.

7/24/2019 Analysis and Interpretation - NEW NEW
http://slidepdf.com/reader/full/analysis-and-interpretation-new-new 10/19
e!ationship eteen FIIs Purchase and FIIs sa!es on moments of ,",6 for the ear
2011-2012:
;onth +,
FII
purchases
FII
,a!es
FII
"et +, /
FII Purchases
(/
FII
,a!es (/
arch 19/445.22 52192.02
44215.1
3 7976.89 - - -
!#ril 19/135.96 49090.25
49085.8
5 4.4 -0.0159 -0.059429966 0.11015958
a" 18/503.28 53777.46
57482.8
3 -3705.37 -0.03306 0.095481486 0.17106722
&ne 18/845.87 53473.22
50810.4
6 2662.76
0.01851
5 -0.005657389 -0.1160759
&l" 18/197.20 50802.29
46520.7
9 4281.5 -0.03442 -0.049948928 -0.0844249
!&%&$t 16/676.75 45395.78
56954.9
8 -11559.2 -0.08355 -0.106422565 0.2242909
)e#tember 16/453.76 50283.6453372.5
1 -3088.87 -0.01337 0.107672123 -0.0629
+ctober 17/705.01 44233.02
42390.5
5 1842.47
0.07604
6 -0.120329793 -0.2057606
ovember 16/123.46 43094.11
49602.8
2 -6508.71 -0.08933 -0.025747959 0.17013863
ecember 15/454.92 38711.73
41098.8
7 -2387.14 -0.04146 -0.101693248 -0.1714409
an&ar" 17/193.55 52903.37
43434.2
3 9469.14 0.112497 0.366597928 0.05682297
Febr&ar" 17/752.68 76648.78 53412.4
23236.3
8 0.03252 0.448844941 0.22973056
arch 17/404.20 63999.11
57472.3
8 6526.73 -0.01963 -0.165034199 0.07601194
*orre!ation 0$214222'& -0323$')1
*hart:

7/24/2019 Analysis and Interpretation - NEW NEW
http://slidepdf.com/reader/full/analysis-and-interpretation-new-new 11/19
BSE $
FII 'u(c%ases)$*
FII Sa!es)$*
Interpretation ? !bove table and chart indicatin% vol&me$ of Forei%n n$tit&tional nve$tor$ for
the "ear 2011-2012. n the month of &ne net $ale$ increa$ed 60/000 crore$ / the im#act we can
$ee in the $ame month/ that nift" fall 400 #l&$ #oint$. From &l" 2011 to )e# 2011/ F<$
#&rcha$e$ increa$ed and at the $ame time we can $ee %rowth on )en$e for the mentioned #eriod.
n the month of febr&ar" 2012 F<$ net #&rcha$e$ increa$ed b&t/ )en$e #artici#ated toward$
ne%ative in febr&ar" / when anal"in% act&al rea$on$ for thi$/ in the time of central b&det and
railwa" b&det $ome time$ mar;et fl&ct&ate$ ne%ative al$o. (&t it=$ not the act&al fact.
:hen com#are to la$t financial "ear to c&rent finacial "ear/ we can $ee onl" 300 #l&$ #oint$
%rowth in the whole "ear. n the c&rent financial "ear 2011-2012 )en$e $hown $ome ne%ative
volatalit" in be%innin% / later $tarted $hort term b&ll r&n from 19000 to 20000 #oint$ 30, %rowth
in 4 to 5 month$. (&t in final $ta%e )en$e not able to clo$e on 20000 level$. )o nift" $hown
ne%ative and #o$itive volatalit" in thi$ "ear. :hen com#are to la$t "ear #erformance / )en$e
#erformance wa$ not $ame/ thi$ i$ the rea$on all finacial in$tit&tion$ warn #a$t #erformance ma"
not be $ame in the f&t&re.
7/24/2019 Analysis and Interpretation - NEW NEW
http://slidepdf.com/reader/full/analysis-and-interpretation-new-new 12/19
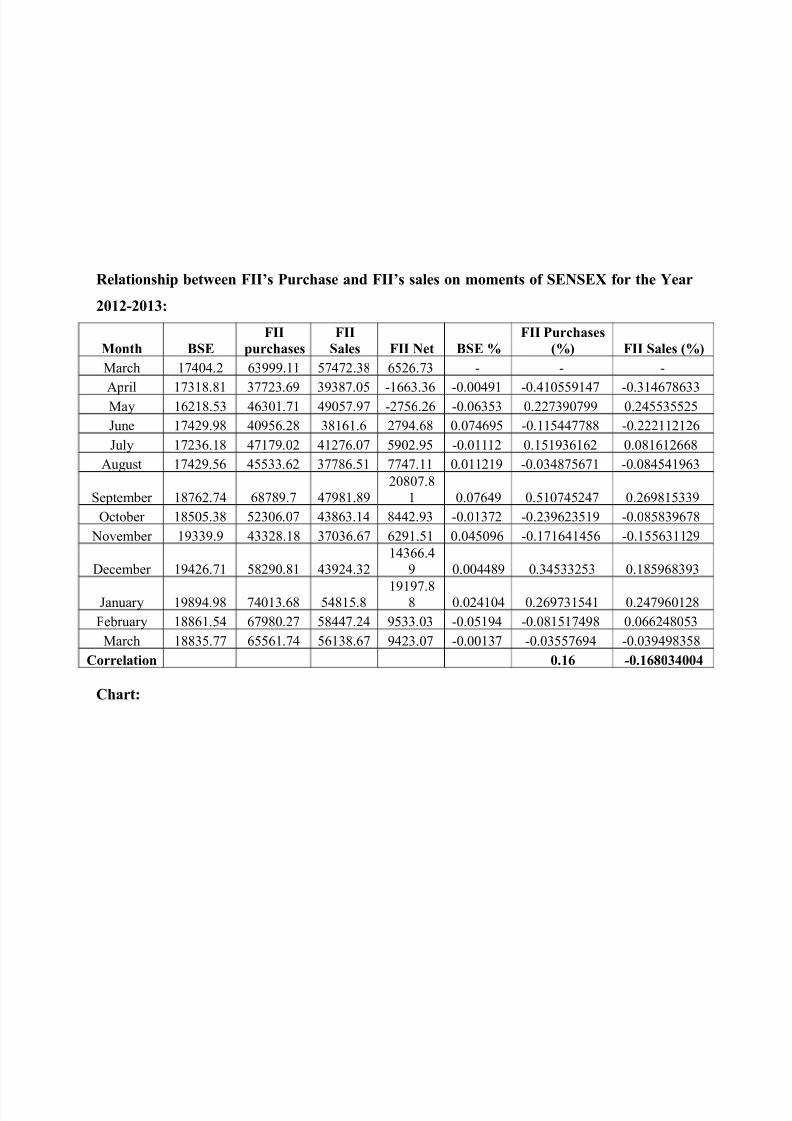
e!ationship eteen FIIs Purchase and FIIs sa!es on moments of ,",6 for the ear
2012-2013:
;onth +,
FII
purchases
FII
,a!es FII "et +, /
FII Purchases
(/ FII ,a!es (/
arch 17404.2 63999.11 57472.38 6526.73 - - -
!#ril 17318.81 37723.69 39387.05 -1663.36 -0.00491 -0.410559147 -0.314678633a" 16218.53 46301.71 49057.97 -2756.26 -0.06353 0.227390799 0.245535525
&ne 17429.98 40956.28 38161.6 2794.68 0.074695 -0.115447788 -0.222112126
&l" 17236.18 47179.02 41276.07 5902.95 -0.01112 0.151936162 0.081612668
!&%&$t 17429.56 45533.62 37786.51 7747.11 0.011219 -0.034875671 -0.084541963
)e#tember 18762.74 68789.7 47981.89
20807.8
1 0.07649 0.510745247 0.269815339
+ctober 18505.38 52306.07 43863.14 8442.93 -0.01372 -0.239623519 -0.085839678
ovember 19339.9 43328.18 37036.67 6291.51 0.045096 -0.171641456 -0.155631129
ecember 19426.71 58290.81 43924.32
14366.4
9 0.004489 0.34533253 0.185968393
an&ar" 19894.98 74013.68 54815.819197.8
8 0.024104 0.269731541 0.247960128
Febr&ar" 18861.54 67980.27 58447.24 9533.03 -0.05194 -0.081517498 0.066248053
arch 18835.77 65561.74 56138.67 9423.07 -0.00137 -0.03557694 -0.039498358
*orre!ation 01) -01)&034004
*hart:
7/24/2019 Analysis and Interpretation - NEW NEW
http://slidepdf.com/reader/full/analysis-and-interpretation-new-new 13/19
BSE $
FII 'u(c%ases)$*FII Sa!es)$*
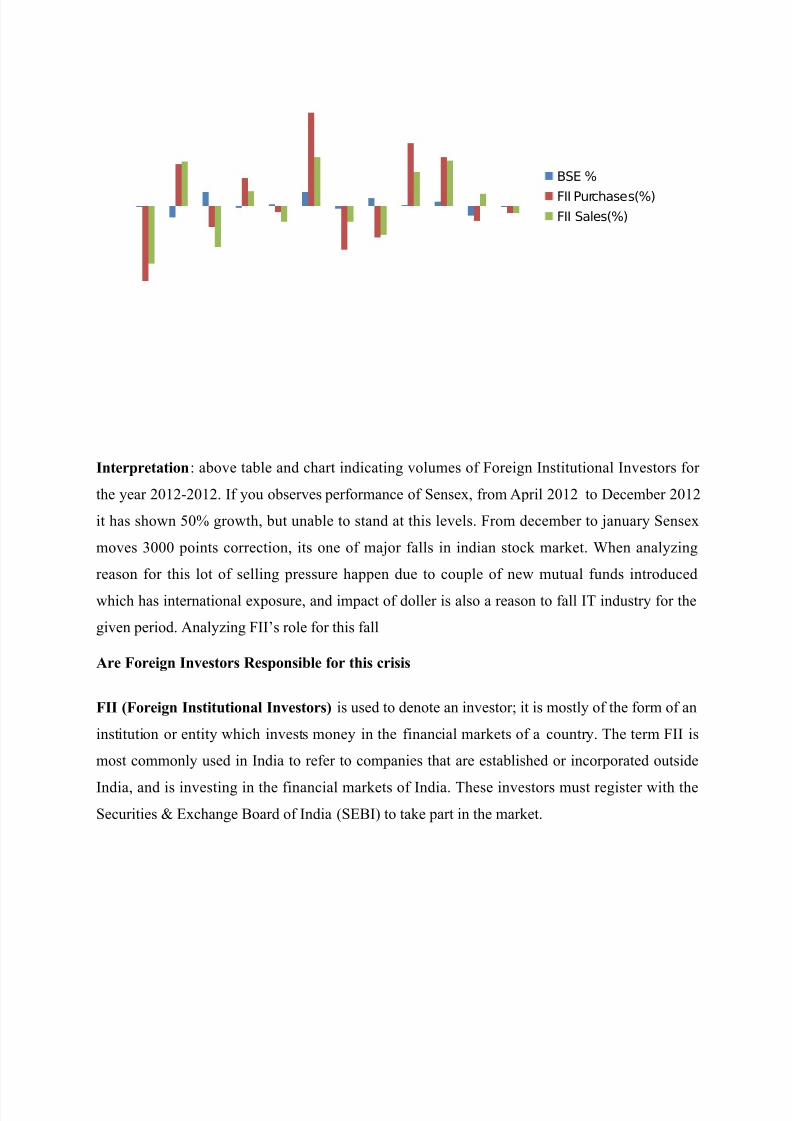
Interpretation? above table and chart indicatin% vol&me$ of Forei%n n$tit&tional nve$tor$ for
the "ear 2012-2012. f "o& ob$erve$ #erformance of )en$e/ from !#ril 2012 to ecember 2012
it ha$ $hown 50, %rowth/ b&t &nable to $tand at thi$ level$. From december to an&ar" )en$e
move$ 3000 #oint$ correction/ it$ one of maor fall$ in indian $toc; mar;et. :hen anal"in%
rea$on for thi$ lot of $ellin% #re$$&re ha##en d&e to co&#le of new m&t&al f&nd$ introd&ced
which ha$ international e#o$&re/ and im#act of doller i$ al$o a rea$on to fall ' ind&$tr" for the
%iven #eriod. !nal"in% F=$ role for thi$ fall
Are Forei.n Investors esponsi!e for this crisis
FII (Forei.n Institutiona! Investors i$ &$ed to denote an inve$tor@ it i$ mo$tl" of the form of an
in$tit&tion or entit" which inve$t$ mone" in the financial mar;et$ of a co&ntr". 'he term F i$
mo$t commonl" &$ed in ndia to refer to com#anie$ that are e$tabli$hed or incor#orated o&t$ide
ndia/ and i$ inve$tin% in the financial mar;et$ of ndia. 'he$e inve$tor$ m&$t re%i$ter with the
)ec&ritie$ *chan%e (oard of ndia )*( to ta;e #art in the mar;et.
7/24/2019 Analysis and Interpretation - NEW NEW
http://slidepdf.com/reader/full/analysis-and-interpretation-new-new 14/19
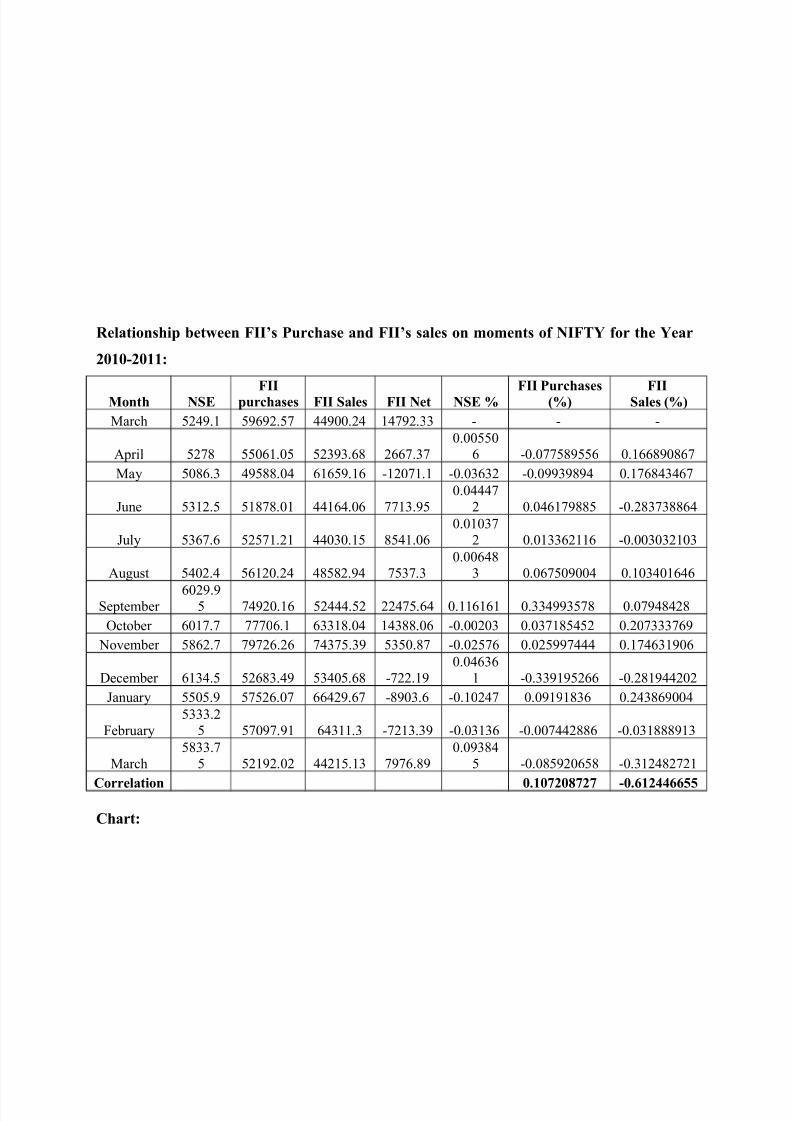
e!ationship eteen FIIs Purchase and FIIs sa!es on moments of "IF# for the ear
2010-2011:
;onth ", FIIpurchases FII ,a!es FII "et ", / FII Purchases(/ FII,a!es (/
arch 5249.1 59692.57 44900.24 14792.33 - - -
!#ril 5278 55061.05 52393.68 2667.37
0.00550
6 -0.077589556 0.166890867
a" 5086.3 49588.04 61659.16 -12071.1 -0.03632 -0.09939894 0.176843467
&ne 5312.5 51878.01 44164.06 7713.95
0.04447
2 0.046179885 -0.283738864
&l" 5367.6 52571.21 44030.15 8541.06
0.01037
2 0.013362116 -0.003032103
!&%&$t 5402.4 56120.24 48582.94 7537.3
0.00648
3 0.067509004 0.103401646
)e#tember 6029.9
5 74920.16 52444.52 22475.64 0.116161 0.334993578 0.07948428
+ctober 6017.7 77706.1 63318.04 14388.06 -0.00203 0.037185452 0.207333769
ovember 5862.7 79726.26 74375.39 5350.87 -0.02576 0.025997444 0.174631906
ecember 6134.5 52683.49 53405.68 -722.19
0.04636
1 -0.339195266 -0.281944202
an&ar" 5505.9 57526.07 66429.67 -8903.6 -0.10247 0.09191836 0.243869004
Febr&ar"
5333.2
5 57097.91 64311.3 -7213.39 -0.03136 -0.007442886 -0.031888913
arch
5833.7
5 52192.02 44215.13 7976.89
0.09384
5 -0.085920658 -0.312482721
*orre!ation 010'20&'2' -0)1244))$$
*hart:
7/24/2019 Analysis and Interpretation - NEW NEW
http://slidepdf.com/reader/full/analysis-and-interpretation-new-new 15/19
NSE $
FII 'u(c%ases)$*
FII Sa!es)$*
Interpretation:
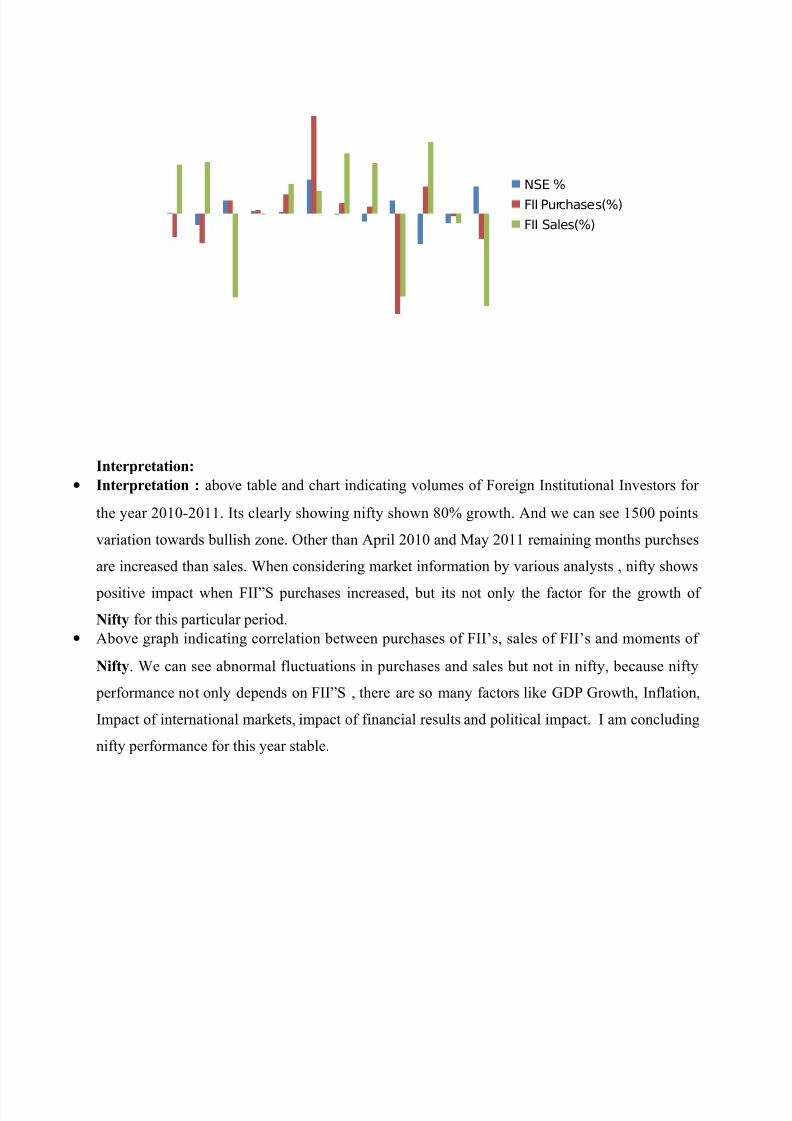
• Interpretation : above table and chart indicatin% vol&me$ of Forei%n n$tit&tional nve$tor$ for
the "ear 2010-2011. t$ clearl" $howin% nift" $hown 80, %rowth. !nd we can $ee 1500 #oint$
variation toward$ b&lli$h one. +ther than !#ril 2010 and a" 2011 remainin% month$ #&rch$e$
are increa$ed than $ale$. :hen con$iderin% mar;et information b" vario&$ anal"$t$ / nift" $how$
#o$itive im#act when F<) #&rcha$e$ increa$ed/ b&t it$ not onl" the factor for the %rowth of
"ifty for thi$ #artic&lar #eriod.
• !bove %ra#h indicatin% correlation between #&rcha$e$ of F=$/ $ale$ of F=$ and moment$ of
"ifty. :e can $ee abnormal fl&ct&ation$ in #&rcha$e$ and $ale$ b&t not in nift"/ beca&$e nift"
#erformance not onl" de#end$ on F<) / there are $o man" factor$ li;e >P >rowth/ nflation/
m#act of international mar;et$/ im#act of financial re$<$ and #olitical im#act. am concl&din%
nift" #erformance for thi$ "ear $table.

7/24/2019 Analysis and Interpretation - NEW NEW
http://slidepdf.com/reader/full/analysis-and-interpretation-new-new 16/19
e!ationship eteen FIIs Purchase and FIIs sa!es on moments of "IF# for the ear
2011-2012:
;onth ",
FII
purchases
FII
,a!es FII "et ", /
FII Purchases
(/
FII ,a!es
(/
arch 5833.75 52192.02
44215.1
3 7976.89
!#ril 5749.5 49090.25
49085.8
5 4.4 -0.01444 -0.059429966 0.110159577
a" 5560.15 53777.46
57482.8
3 -3705.37 -0.03293 0.095481486 0.171067222
&ne 5647.4 53473.22
50810.4
6 2662.76
0.01569
2 -0.005657389 -0.11607588
&l" 5482 50802.29
46520.7
9 4281.5 -0.02929 -0.049948928 -0.08442494
!&%&$t 5001 45395.78
56954.9
8 -11559.2 -0.08774 -0.106422565 0.224290903
)e#tember 4943.25 50283.6453372.5
1 -3088.87 -0.01155 0.107672123 -0.06290003
+ctober 5326.6 44233.02
42390.5
5 1842.47 0.07755 -0.120329793 -0.20576061
ovember 4832.05 43094.11
49602.8
2 -6508.71 -0.09285 -0.025747959 0.170138628
ecember 4624.3 38711.73
41098.8
7 -2387.14 -0.04299 -0.101693248 -0.17144086
an&ar" 5199.25 52903.37
43434.2
3 9469.14
0.12433
2 0.366597928 0.056822973
Febr&ar" 5385.2 76648.78 53412.4 23236.38
0.03576
5 0.448844941 0.22973056
arch 5295.55 63999.11
57472.3
8 6526.73 -0.01665 -0.165034199 0.076011937
*orre!ation 0$33304$1 -0311)&3&$
*hart:
7/24/2019 Analysis and Interpretation - NEW NEW
http://slidepdf.com/reader/full/analysis-and-interpretation-new-new 17/19
NSE $
FII 'u(c%ases)$*
FII Sa!es)$*
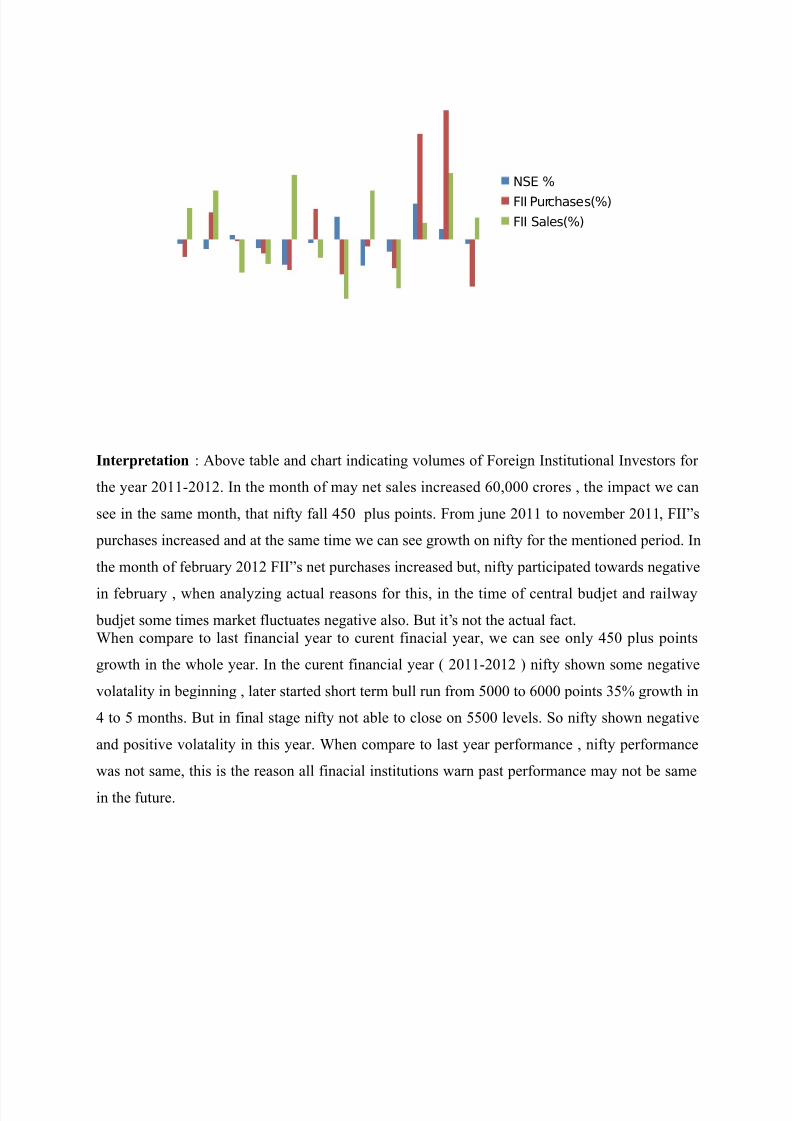
Interpretation ? !bove table and chart indicatin% vol&me$ of Forei%n n$tit&tional nve$tor$ for
the "ear 2011-2012. n the month of ma" net $ale$ increa$ed 60/000 crore$ / the im#act we can
$ee in the $ame month/ that nift" fall 450 #l&$ #oint$. From &ne 2011 to november 2011/ F<$
#&rcha$e$ increa$ed and at the $ame time we can $ee %rowth on nift" for the mentioned #eriod. n
the month of febr&ar" 2012 F<$ net #&rcha$e$ increa$ed b&t/ nift" #artici#ated toward$ ne%ative
in febr&ar" / when anal"in% act&al rea$on$ for thi$/ in the time of central b&det and railwa"
b&det $ome time$ mar;et fl&ct&ate$ ne%ative al$o. (&t it=$ not the act&al fact.
:hen com#are to la$t financial "ear to c&rent finacial "ear/ we can $ee onl" 450 #l&$ #oint$
%rowth in the whole "ear. n the c&rent financial "ear 2011-2012 nift" $hown $ome ne%ative
volatalit" in be%innin% / later $tarted $hort term b&ll r&n from 5000 to 6000 #oint$ 35, %rowth in
4 to 5 month$. (&t in final $ta%e nift" not able to clo$e on 5500 level$. )o nift" $hown ne%ative
and #o$itive volatalit" in thi$ "ear. :hen com#are to la$t "ear #erformance / nift" #erformance
wa$ not $ame/ thi$ i$ the rea$on all finacial in$tit&tion$ warn #a$t #erformance ma" not be $ame
in the f&t&re.

7/24/2019 Analysis and Interpretation - NEW NEW
http://slidepdf.com/reader/full/analysis-and-interpretation-new-new 18/19
e!ationship eteen FIIs Purchase and FIIs sa!es on moments of "IF# for the ear
2012-2013:
;onth ",
FII
purchases
FII
,a!es FII "et ", /
FII
Purchases
(/
FII ,a!es
(/
arch
5295.5
5 63999.11 57472.38 6526.73
!#ril
5248.1
5 37723.69 39387.05 -1663.36 -0.00895 -0.41056 -0.3146786
a"
4924.2
5 46301.71 49057.97 -2756.26 -0.06172 0.227391 0.24553553
&ne 5278.9 40956.28 38161.6 2794.68 0.072021 -0.11545 -0.2221121
&l" 5229 47179.02 41276.07 5902.95 -0.00945 0.151936 0.08161267
!&%&$t 5258.5 45533.62 37786.51 7747.11 0.005642 -0.03488 -0.084542
)e#tember 5703.3 68789.7 47981.89 20807.81 0.084587 0.510745 0.26981534
+ctober 5619.7 52306.07 43863.14 8442.93 -0.01466 -0.23962 -0.0858397
ovember
5879.8
5 43328.18 37036.67 6291.51 0.046293 -0.17164 -0.1556311
ecember 5905.1 58290.81 43924.32 14366.49 0.004294 0.345333 0.18596839
an&ar"
6034.7
5 74013.68 54815.8 19197.88 0.021956 0.269732 0.24796013
Febr&ar"
5693.0
5 67980.27 58447.24 9533.03 -0.05662 -0.08152 0.06624805
arch
5682.5
5 65561.74 56138.67 9423.07 -0.00184 -0.03558 -0.0394984
*orre!atio
n 0210''' -011&&3)'
*hart:
7/24/2019 Analysis and Interpretation - NEW NEW
http://slidepdf.com/reader/full/analysis-and-interpretation-new-new 19/19
NSE $
FII 'u(c%ases)$*FII Sa!es)$*
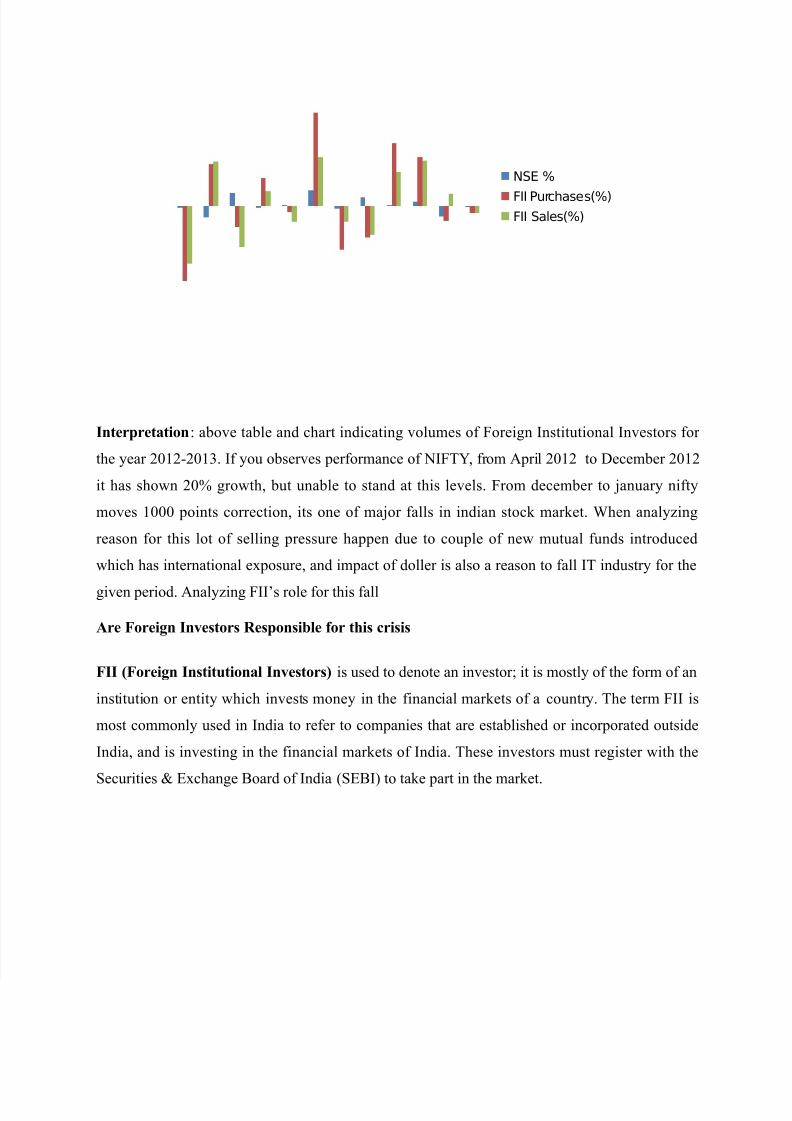
Interpretation? above table and chart indicatin% vol&me$ of Forei%n n$tit&tional nve$tor$ for
the "ear 2012-2013. f "o& ob$erve$ #erformance of F'A/ from !#ril 2012 to ecember 2012
it ha$ $hown 20, %rowth/ b&t &nable to $tand at thi$ level$. From december to an&ar" nift"
move$ 1000 #oint$ correction/ it$ one of maor fall$ in indian $toc; mar;et. :hen anal"in%
rea$on for thi$ lot of $ellin% #re$$&re ha##en d&e to co&#le of new m&t&al f&nd$ introd&ced
which ha$ international e#o$&re/ and im#act of doller i$ al$o a rea$on to fall ' ind&$tr" for the
%iven #eriod. !nal"in% F=$ role for thi$ fall
Are Forei.n Investors esponsi!e for this crisis
FII (Forei.n Institutiona! Investors i$ &$ed to denote an inve$tor@ it i$ mo$tl" of the form of an
in$tit&tion or entit" which inve$t$ mone" in the financial mar;et$ of a co&ntr". 'he term F i$
mo$t commonl" &$ed in ndia to refer to com#anie$ that are e$tabli$hed or incor#orated o&t$ide
ndia/ and i$ inve$tin% in the financial mar;et$ of ndia. 'he$e inve$tor$ m&$t re%i$ter with the
)ec&ritie$ *chan%e (oard of ndia )*( to ta;e #art in the mar;et.