An NSF I/UCRC Could there be a new era with much lower utility bills? Tim Mount Dyson School of...
26
An NSF I/UCRC Could there be a new era with much lower utility bills? Tim Mount Dyson School of Applied Economics and Management Cornell University esented at the NY Association of Energy Economics 4/26/12
-
Upload
agatha-copeland -
Category
Documents
-
view
214 -
download
0
Transcript of An NSF I/UCRC Could there be a new era with much lower utility bills? Tim Mount Dyson School of...

An NSF I/UCRC
Could there be a new era with much lower utility bills?
Tim MountDyson School of Applied Economics and Management
Cornell University
Presented at the NY Association of Energy Economics 4/26/12
An NSF I/UCRC
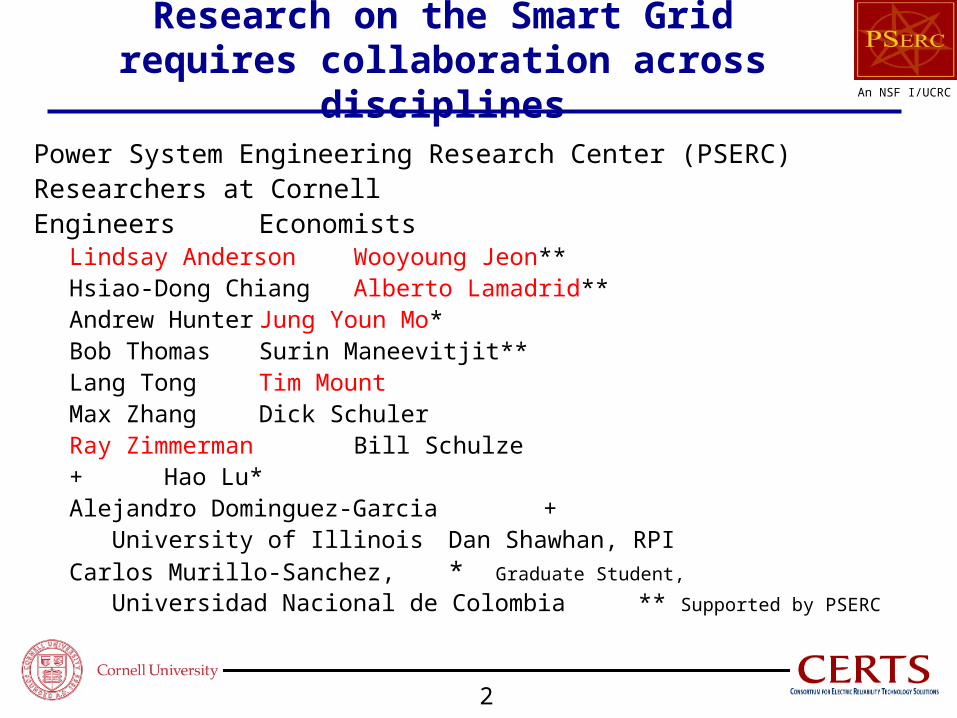
Research on the Smart Grid requires collaboration across disciplines
Power System Engineering Research Center (PSERC) Researchers at CornellEngineers Economists
Lindsay Anderson Wooyoung Jeon**Hsiao-Dong Chiang Alberto Lamadrid**Andrew Hunter Jung Youn Mo*Bob Thomas Surin Maneevitjit**Lang Tong Tim MountMax Zhang Dick SchulerRay Zimmerman Bill Schulze+ Hao Lu*Alejandro Dominguez-Garcia + University of Illinois Dan Shawhan, RPICarlos Murillo-Sanchez, * Graduate Student,
Universidad Nacional de Colombia ** Supported by PSERC
2
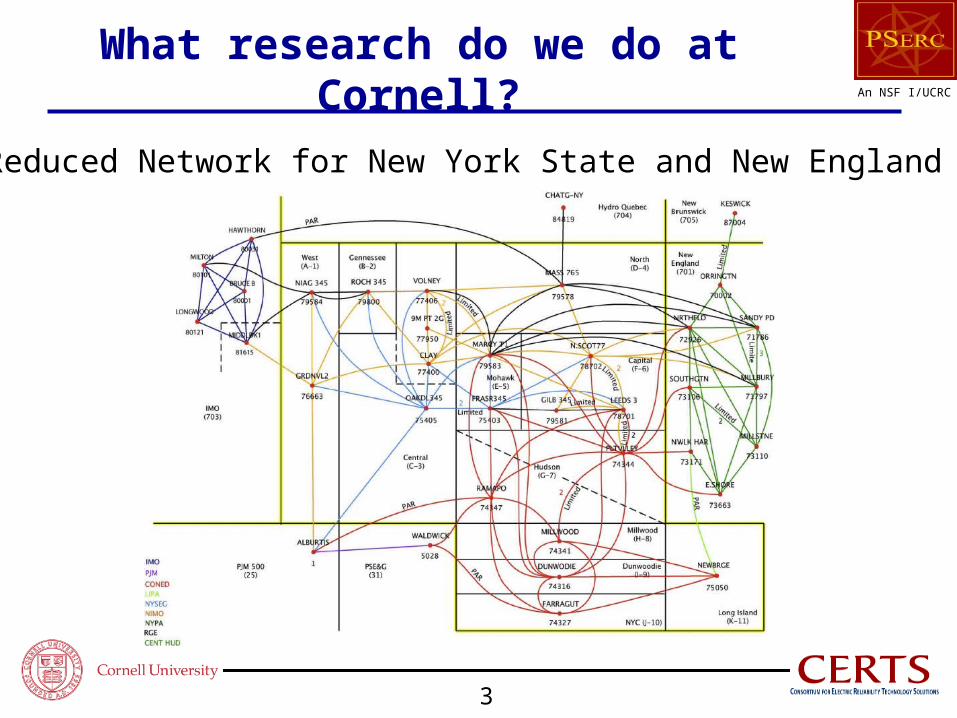
An NSF I/UCRCWhat research do we do at Cornell?
Reduced Network for New York State and New England
3

An NSF I/UCRC
How can high penetrations of wind generation be integrated into the grid?
12
34
5
67
New England
New York State
4
An NSF I/UCRC
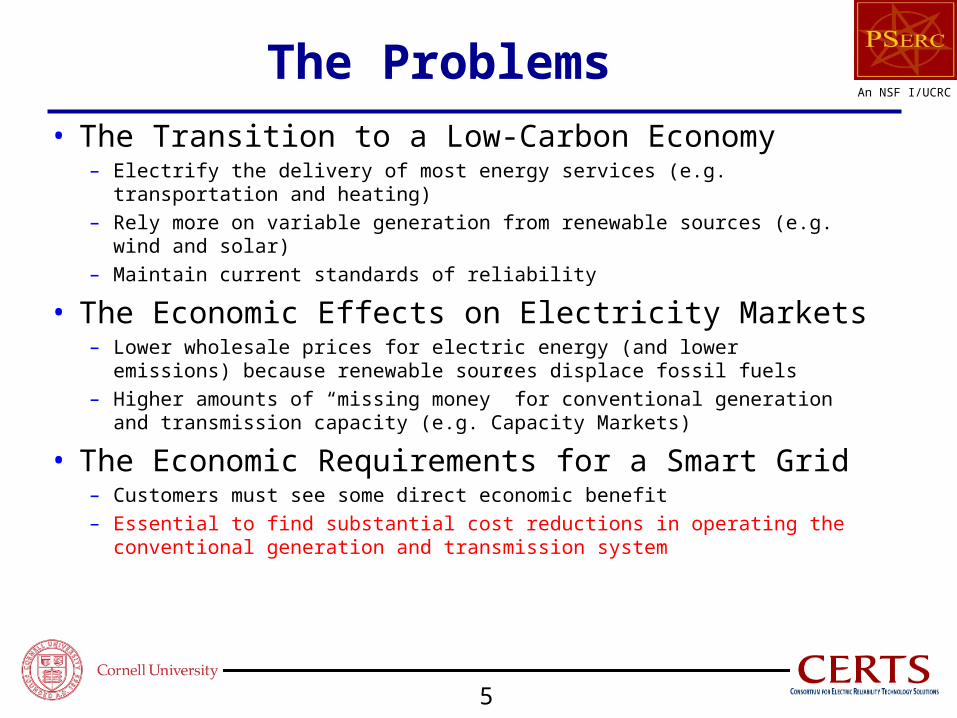
The Problems
• The Transition to a Low-Carbon Economy– Electrify the delivery of most energy services (e.g. transportation and
heating)– Rely more on variable generation from renewable sources (e.g. wind and
solar)– Maintain current standards of reliability
• The Economic Effects on Electricity Markets– Lower wholesale prices for electric energy (and lower emissions) because
renewable sources displace fossil fuels– Higher amounts of “missing money” for conventional generation and
transmission capacity (e.g. Capacity Markets)
• The Economic Requirements for a Smart Grid– Customers must see some direct economic benefit– Essential to find substantial cost reductions in operating the conventional
generation and transmission system
5
An NSF I/UCRC
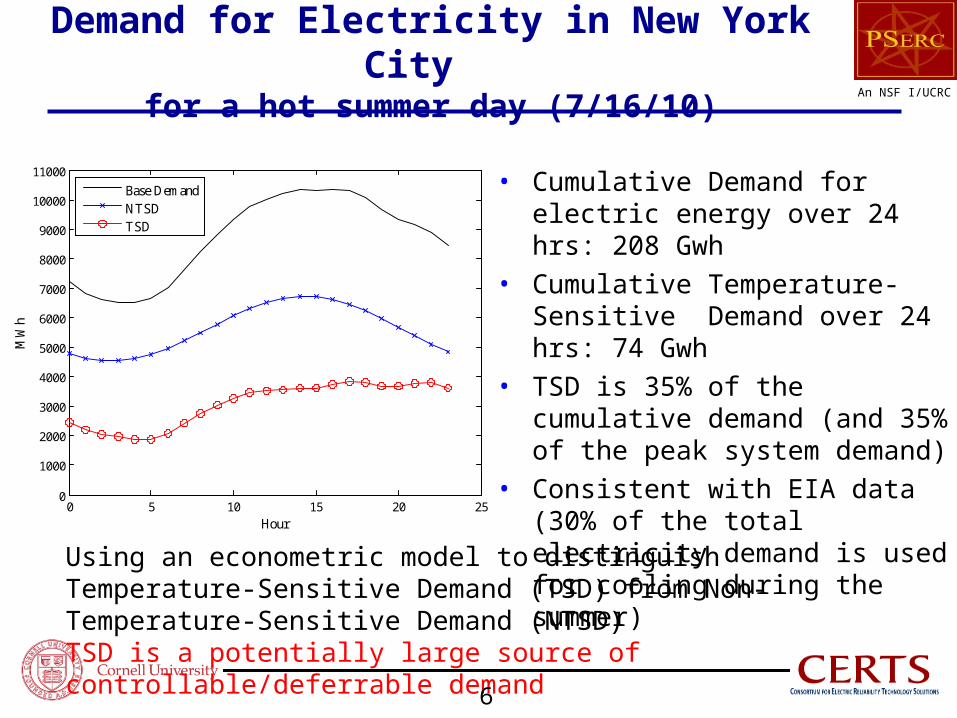
Demand for Electricity in New York City for a hot summer day (7/16/10)
• Cumulative Demand for electric energy over 24 hrs: 208 Gwh
• Cumulative Temperature-Sensitive Demand over 24 hrs: 74 Gwh
• TSD is 35% of the cumulative demand (and 35% of the peak system demand)
• Consistent with EIA data (30% of the total electricity demand is used for cooling during the summer)
Using an econometric model to distinguish Temperature-Sensitive Demand (TSD) from Non-Temperature-Sensitive Demand (NTSD)TSD is a potentially large source of controllable/deferrable demand
0 5 10 15 20 250
1000
2000
3000
4000
5000
6000
7000
8000
9000
10000
11000
Hour
MW
h
Base DemandNTSDTSD
6
An NSF I/UCRC
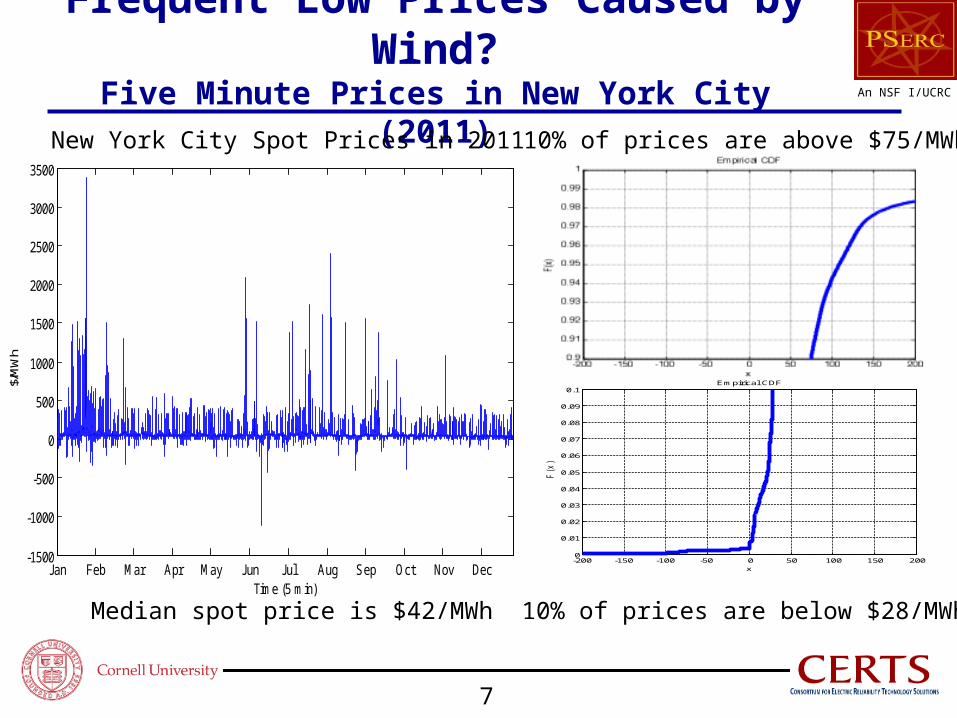
Frequent Low Prices Caused by Wind?Five Minute Prices in New York City (2011)
Jan Feb Mar Apr May Jun Jul Aug Sep Oct Nov Dec-1500
-1000
-500
0
500
1000
1500
2000
2500
3000
3500
$/M
Wh
Time (5 min)
7
10% of prices are below $28/MWhMedian spot price is $42/MWh
10% of prices are above $75/MWh
-200 -150 -100 -50 0 50 100 150 2000
0.01
0.02
0.03
0.04
0.05
0.06
0.07
0.08
0.09
0.1
x
F(x
)
Empirical CDF
New York City Spot Prices in 2011

An NSF I/UCRC
Model I: To illustrate the potential system benefits of
controllable/deferrable demand (with no networks constraints)
8
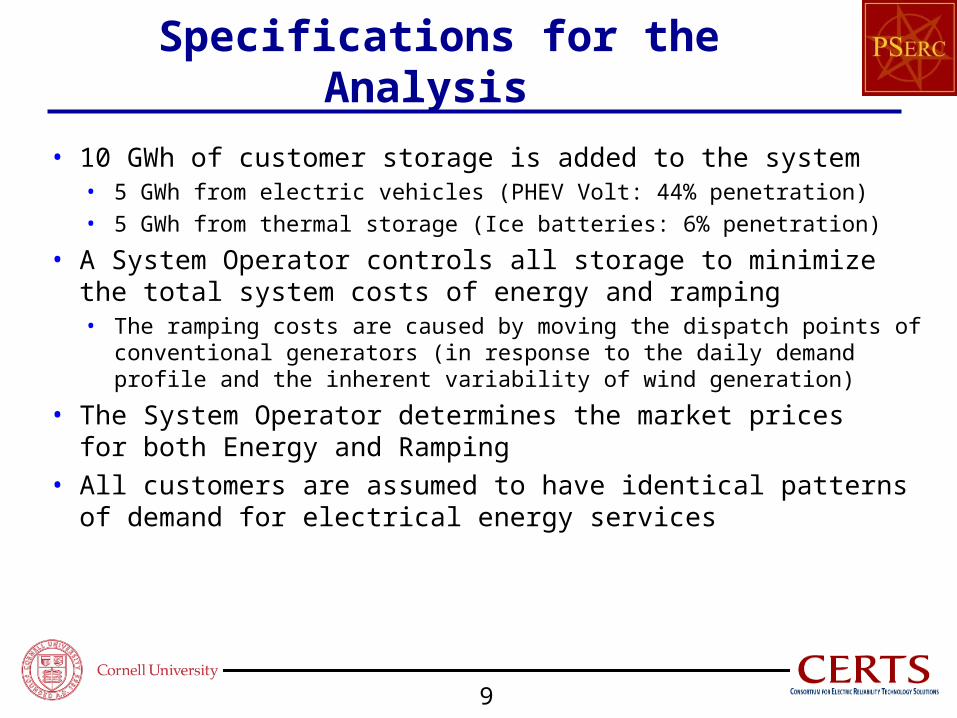
Specifications for the Analysis
• 10 GWh of customer storage is added to the system• 5 GWh from electric vehicles (PHEV Volt: 44% penetration)• 5 GWh from thermal storage (Ice batteries: 6% penetration)
• A System Operator controls all storage to minimize the total system costs of energy and ramping• The ramping costs are caused by moving the dispatch points of
conventional generators (in response to the daily demand profile and the inherent variability of wind generation)
• The System Operator determines the market prices for both Energy and Ramping
• All customers are assumed to have identical patterns of demand for electrical energy services
9
An NSF I/UCRC
System Level Results
10

Total Conventional Generation
- Net Load is defined as Base Load – Wind- Wind data are from NREL and wind capacity is assumed to be 2GW- Wind generation accounts for 12% of total daily demand
0 5 10 15 20 255000
6000
7000
8000
9000
10000
11000Total Conventional Generation
MW
h
Hour
Base LoadNet LoadOptimum
11

System Price for Energy
0 5 10 15 20 250
20
40
60
80
100
120
140
160System Price for Energy
$/M
Wh
Hour
Base LoadNet LoadOptimum
12
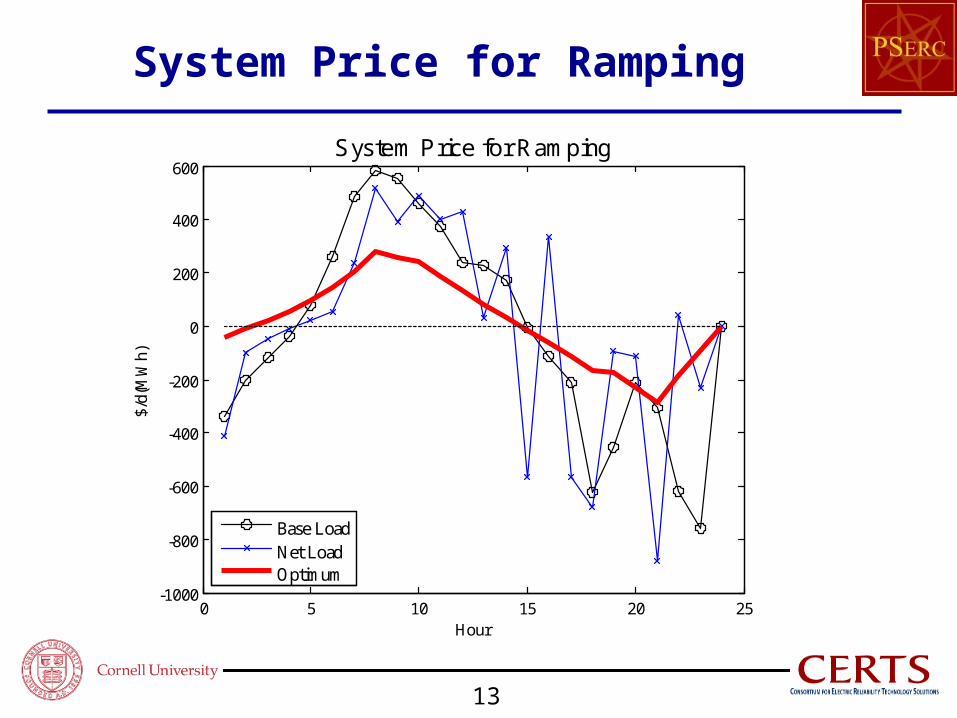
System Price for Ramping
0 5 10 15 20 25-1000
-800
-600
-400
-200
0
200
400
600System Price for Ramping
$/d(
MW
h)
Hour
Base LoadNet LoadOptimum
13

Optimum Energy Purchased and Energy Consumed
0 5 10 15 20 257000
7500
8000
8500
9000
9500
10000
10500
11000Actual Energy Purchase
Ene
rgy
Pur
chas
e ($
/MW
h)
Hour
Energy ConsumedEnergy Purchased
14
The energy services delivered to customers do not change

Composition of the Cooling DemandDirect (AC) v Stored (THERMAL)
0 5 10 15 20 25-200
0
200
400
600
800
1000
Hour
Coo
ling
Dem
and
(MW
h)
Load CoolingTHERMALAC
- Controllable Cooling Demand is proportional to TSD (6.2%)- AC provides ramping services during the system peak hours
15

Total System Costs and Total Payments by All Customers
Base Load(no Wind)
Net Load(with Wind)
Optimum Load
Payment by Customer
Energy Cost ($1000) 24,477 16,236 16,915 19,069 Ramping Cost($1000) 3,204 3,855 688 420 Total Operating Cost($1000) 27,681 20,091 17,603 19,489 FEIS(MWh)* 0 0 807 - Value of FEIS($1000)* 0 0 97 97 Total Cost of Serving Load($1000) 27,681 20,091 17,506 19,392 Max System Load(MW) 10,529 9,879 9,059 - Capacity Cost($1000)** 18,530 17,386 15,944 17,088 TOTAL SYSTEM COST($1000) 46,211 37,477 33,451 36,481 Total Saving in Gasoline($1000)*** 0 0 -2,720 -2,720 TOTAL COST TO CUSTOMERS 46,211 37,477 30,731 33,761 % Cost Reduction from Base Load - 18.9% 33.5% 26.9%
* Final Energy In Storage (FEIS), Valued at $120/MWh (Average Peak Price).** Annual Capital Cost for Peaker $88k/MW/year allocated to 100 peak hours. Specify 2 peak hours for this hot day.*** Each vehicle drives 27.2 Miles at 20 Miles/Gal at $4/Gal.
16

Composition of the Payments Made to the Regional Transmission Operator
- Positive (Negative) payments indicate Paying (Being Paid) for a service.- CD, Conventional Demand and DD, Deferrable Demand- WG, Wind Generation and CG, Conventional Generation- The SYSTEM COST of ramping is caused by ramping CG- WG accounts for 11% of Energy Supply and 45% of Ramping Demand- CD accounts for 2% of Energy Demand and 71% of Ramping Supply
Ramping Payment ($1000)
Energy Payment ($1000)
Total Payment ($1000)
Total Energy(MWh)
AveragePayment($/MWh)
1) CD 2120 18920 21,041 214911 982) WG 1735 -2154 -419 27070 -153) CG -1125 -17236 -18,361 196822 -934) DD -2730 470 -2,261 12296 -184Buyers (1)+(2) = 3,855 (1)+(4) = 19,390
Suppliers (3)+(4) = -3,855 (2)+(3) = -19,390
17

An NSF I/UCRC
Results for Different Types of Customer
18

Consider Four Types of Customer
• Assume that there are one million customers with identical initial daily patterns of demand– Type 1 No storage capabilities
– Type 2 Add THERMAL storage
– Type 3 Buy a PHEV Volt
– Type 4 Both THERMAL and PHEV
• All customers pay for:– ENERGY using real-time prices (PHEV can be paid)
– CAPACITY at the peak system load
– RAMPING using real-time prices (can be paid for reducing the system ramp)
19

Energy Purchased by Different Types of Customer
THERMAL customers do the heavy lifting0 5 10 15 20 25
5
6
7
8
9
10
11
12
13
14
15Energy Demand by Different Types of Customers
KW
h
Hour
No StorageTHERMAL OnlyPHEV OnlyTHERMAL and PHEVAverage
20

Total Payments Per Customer ($/day)
Base Load w no Wind
Base + Wind w no
Storage
Average Optimum w Storage
With no storage
With PHEV & Thermal
Storage
Energy 25 18 19 20 18
Ramping 3 2 1 1 -1
Capacity 18 18 17 19 14
Gasoline 0 0 -3 0 -5
TOTAL 46 38 34 40 26
Changefrom Base
- -17% -26% -13% -43%
The main source of savings for customers with storage (deferrable demand) is from lower payments for capacity (incentive compatible demand charges) and lower gasoline purchases

Total Payments Per Customer
Base Load Net Load TYPE 1No Storage
TYPE 2THERMAL
only
TYPE 3PHEV only
TYPE 4THERMAL
& PHEVAverage
Energy Payment ($) 24.48 18.03 18.92 18.60 19.38 19.13 19.07
Ramping Payment ($) 3.20 2.12 1.15 -0.40 0.46 -1.05 0.42
Total Payment ($) 27.68 20.15 20.07 18.20 19.84 18.08 19.49
Value of FEIS ($) 0 0 0 0.25 0.07 0.32 0.10
Total Payment of Serving Load ($) 27.68 20.15 20.07 17.96 19.77 17.76 19.39
KW at System Peak (KW) 10.53 10.53 10.53 8.56 9.88 8.00 9.71
Capacity Payment ($) 18.53 18.53 18.53 15.06 17.38 14.09 17.09
Total SYSTEM Payment ($) 46.21 38.68 38.60 33.02 37.15 31.85 36.48
Saving in Gasoline ($) 0 0 0 0 5.44 5.44 2.72
AVERAGE PAYMENT ($) 46.21 38.68 38.60 33.02 31.71 26.41 33.76
% Payment Reduction from Base Load 16.3% 16.5% 28.5% 31.4% 42.9% 26.9%
Optimum ENERGY payments are similar for all types of customer.Optimum CAPACITY and RAMPING payments are lower with storage.Customers with both THERMAL and PHEV are the big winners.
22
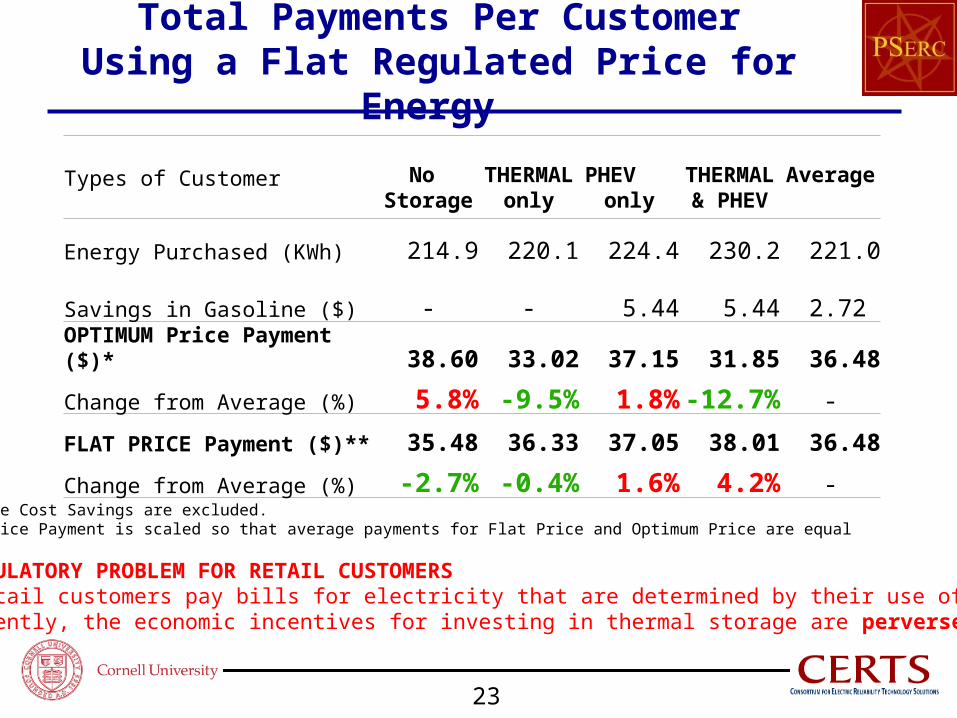
Total Payments Per CustomerUsing a Flat Regulated Price for Energy
Types of Customer No Storage
THERMAL only
PHEV only
THERMAL & PHEV
Average
Energy Purchased (KWh) 214.9 220.1 224.4 230.2 221.0
Savings in Gasoline ($) - - 5.44 5.44 2.72
OPTIMUM Price Payment ($)* 38.60 33.02 37.15 31.85 36.48
Change from Average (%) 5.8% -9.5% 1.8% -12.7% -
FLAT PRICE Payment ($)** 35.48 36.33 37.05 38.01 36.48
Change from Average (%) -2.7% -0.4% 1.6% 4.2% -
* Gasoline Cost Savings are excluded.** Flat Price Payment is scaled so that average payments for Flat Price and Optimum Price are equal
THE REGULATORY PROBLEM FOR RETAIL CUSTOMERSMost retail customers pay bills for electricity that are determined by their use of energy.Consequently, the economic incentives for investing in thermal storage are perverse.
23

An NSF I/UCRC
Conclusions
24

CONCLUSIONS
• High penetrations of renewable generation lower the wholesale price of energy BUT increase the ramping and capacity costs (“missing money”) for the conventional generators
• Wholesale customers and aggregators who have deferrable demand should get substantial economic benefits by:– Purchasing more energy at less expensive off-peak prices
– Reducing their demand (capacity) during expensive peak-load periods
– Selling ancillary services (ramping) to mitigate wind variability
• All market participants should pay for the services they use and get paid for the services they provide
• Most existing retail rate structures do not provide the correct economic incentives for deferrable demand
25

Issues for Future Research(Issues for regulators are RED)
• The economic benefits of deferrable demand for the grid are not adequately represented by the current rates charged to customers
– Customers (aggregators) should pay real-time prices for energy– Correct measurement and payments needed for each customer’s peak demand– Customers should pay/get paid for using/supplying ramping services
• The inherent variability of generation from renewable sources and the difficulty of forecasting these sources accurately are incompatible with the current structure of day-ahead markets and unit commitment
– Need a rolling horizon for optimizing real-time dispatch that uses updated forecasts of potential renewable generation and system conditions (e.g. like Australia)
– Customers (aggregators) should get updated (non-binding) projections of future prices at least 24 hours ahead to manage storage efficiently (e.g. like Australia)
• The structures/capabilities of existing distribution networks are major weak links in the electric delivery system for a future smart grid
– Need new scheduling algorithms for coordinating multiple stochastic sinks of deferrable demand to improve grid efficiency and for accommodating multiple sources of variable generation from renewable sources of energy
26