An investigation of phenolic glycoside and condensed ... · biosynthesis. Based on molecular...
127
Michigan Technological University Digital Commons @ Michigan Tech Dissertations, Master's eses and Master's Reports - Open Dissertations, Master's eses and Master's Reports 2009 An investigation of phenolic glycoside and condensed tannin homeostasis in Populus by salicyl alcohol feeding to cell cultures and by transgenic manipulation of the sucrose transporter, PTSUT4, in planta Raja Sekhar Payyaula Michigan Technological University Copyright 2009 Raja Sekhar Payyaula Follow this and additional works at: hp://digitalcommons.mtu.edu/etds Part of the Forest Sciences Commons Recommended Citation Payyaula, Raja Sekhar, "An investigation of phenolic glycoside and condensed tannin homeostasis in Populus by salicyl alcohol feeding to cell cultures and by transgenic manipulation of the sucrose transporter, PTSUT4, in planta", Dissertation, Michigan Technological University, 2009. hp://digitalcommons.mtu.edu/etds/126
Transcript of An investigation of phenolic glycoside and condensed ... · biosynthesis. Based on molecular...
Michigan Technological UniversityDigital Commons @ Michigan
TechDissertations, Master's Theses and Master's Reports- Open Dissertations, Master's Theses and Master's Reports
2009
An investigation of phenolic glycoside andcondensed tannin homeostasis in Populus by salicylalcohol feeding to cell cultures and by transgenicmanipulation of the sucrose transporter, PTSUT4,in plantaRaja Sekhar PayyaulaMichigan Technological University
Copyright 2009 Raja Sekhar Payyaula
Follow this and additional works at: http://digitalcommons.mtu.edu/etds
Part of the Forest Sciences Commons
Recommended CitationPayyaula, Raja Sekhar, "An investigation of phenolic glycoside and condensed tannin homeostasis in Populus by salicyl alcohol feedingto cell cultures and by transgenic manipulation of the sucrose transporter, PTSUT4, in planta", Dissertation, Michigan TechnologicalUniversity, 2009.http://digitalcommons.mtu.edu/etds/126
AN INVESTIGATION OF PHENOLIC GLYCOSIDE AND CONDENSED TANNIN
HOMEOSTASIS IN POPULUS BY SALICYL ALCOHOL FEEDING TO CELL
CULTURES AND BY TRANSGENIC MANIPULATION OF THE SUCROSE
TRANSPORTER, PTSUT4, IN PLANTA
By
RAJA SEKHAR PAYYAVULA
A DISSERTATION
Submitted in partial fulfillment of the requirements
for the degree of
DOCTOR OF PHILOSOPHY
(Forest Molecular Genetics and Biotechnology)
MICHIGAN TECHNOLOGICAL UNIVERSITY
2009
Copyright © Raja S. Payyavula 2009
This dissertation, “An investigation of phenolic glycoside and condensed tannin
homeostasis in Populus by salicyl alcohol feeding to cell cultures and by transgenic
manipulation of the sucrose transporter, PtSUT4, in planta” is hereby approved in partial
fulfillment of the requirements for the degree of DOCTOR OF PHILOSOPHY in the
field of Forest Molecular Genetics and Biotechnology.
School of Forest Resources and Environmental Science
Dissertation Advisor _________________________________________
Dr. Chung-Jui Tsai
Co-advisor _________________________________________
Dr. Scott Harding
Dean, School of Forest Resources _________________________________________
and Environmental Science Dr. Margaret Gale
Date _________________________________________
2
Acknowledgments
I would like to express heart full appreciation to my advisors, Dr. Chung-Jui Tsai and Dr.
Scott A. Harding for giving me an opportunity for study and research in their lab and for
their support and patience. Their encouragement and frequent advices during the course
of the project helped me better understand the project. Working under their guidance as a
graduate student was a wonderful experience. I have grown both scientifically and
intellectually and will always treasure the opportunity provided for me. I would like to
extend my thanks to the advisory committee: Dr. Chandrashekhar P Joshi and Dr. Dallas
K Bates for accepting to serve as my committee member and for thoughtful comments
and constructive criticisms which improved my presentation and the contents of this
dissertation.
Many thanks to members in Biotech Research Center and my lab mates Han Yi, Edward,
Prashant, Ben, Lindsey, Kate, Chung Fu who are presently at the University of Georgia,
for sharing of knowledge and experience. Special thanks to Han-Wei Lin for his
suggestions in working with cell cultures and HPLC. I would like to thank my friends at
MTU for their friendship and support that made my stay there an unforgettable
experience.
My most heartfelt thanks go to my wife, Rajeshwari, for her love and patience. I’m
indebted to my parents, Rama Subbaiah and Laxmi Devi, sisters Anitha and Sunitha and
brother Krishna for their love and kindness.
Finally, I thank NSF for funding my research.
3
An investigation of phenolic glycoside and condensed tannin homeostasis in Populus
by salicyl alcohol feeding to cell cultures and by transgenic manipulation of the
sucrose transporter, PtSUT4, in planta
ABSTRACT
Secondary metabolites play an important role in plant protection against biotic and
abiotic stress. In Populus, phenolic glycosides (PGs) and condensed tannins (CTs) are
two such groups of compounds derived from the common phenylpropanoid pathway. The
basal levels and the inducibility of PGs and CTs depend on genetic as well as
environmental factors, such as soil nitrogen (N) level. Carbohydrate allocation, transport
and sink strength also affect PG and CT levels. A negative correlation between the levels
of PGs and CTs was observed in several studies. However, the molecular mechanism
underlying such relation is not known. We used a cell culture system to understand
negative correlation of PGs and CTs. Under normal culture conditions, neither salicin nor
higher-order PGs accumulated in cell cultures. Several factors, such as hormones, light,
organelles and precursors were discussed in the context of aspen suspension cells’
inability to synthesize PGs. Salicin and its isomer, isosalicin, were detected in cell
cultures fed with salicyl alcohol, salicylaldehyde and helicin. At higher levels (5 mM) of
salicyl alcohol feeding, accumulation of salicins led to reduced CT production in the
cells. Based on metabolic and gene expression data, the CT reduction in salicin-
accumulating cells is partly a result of regulatory changes at the transcriptional level
affecting carbon partitioning between growth processes, and phenylpropanoid CT
biosynthesis. Based on molecular studies, the glycosyltransferases, GT1-2 and GT1-246,
4
may function in glycosylation of simple phenolics, such as salicyl alcohol in cell cultures.
The uptake of such glycosides into vacuole may be mediated to some extent by tonoplast
localized multidrug-resistance associated protein transporters, PtMRP1 and PtMRP6.
In Populus, sucrose is the common transported carbohydrate and its transport is possibly
regulated by sucrose transporters (SUTs). SUTs are also capable of transporting simple
PGs, such as salicin. Therefore, we characterized the SUT gene family in Populus and
investigated, by transgenic analysis, the possible role of the most abundantly expressed
member, PtSUT4, in PG-CT homeostasis using plants grown under varying nitrogen
regimes. PtSUT4 transgenic plants were phenotypically similar to the wildtype plants
except that the leaf area-to-stem volume ratio was higher for transgenic plants. In SUT4
transgenics, levels of non-structural carbohydrates, such as sucrose and starch, were
altered in mature leaves. The levels of PGs and CTs were lower in green tissues of
transgenic plants under N-replete, but were higher under N-depleted conditions,
compared to the levels in wildtype plants. Based on our results, SUT4 partly regulates N-
level dependent PG-CT homeostasis by differential carbohydrate allocation.
5
TABLE OF CONTENTS
Chapter 1 Literature review ..........................................................................................12
1.1 Phenolic glycosides...........................................................................................13
1.2 Condensed tannins ...........................................................................................16
1.3 Sucrose and Sucrose transporters ..................................................................18
Chapter 2 Metabolic and gene expression changes associated with salicyl alcohol
feeding in aspen cell cultures .......................................................................22
2.1 Introduction......................................................................................................23
2.2 Materials and methods ....................................................................................27
2.2.1 Cell cultures ...............................................................................................27
2.2.2 PG & CT extraction and quantitative estimation.......................................28
2.2.3 RNA extraction and DNase treatment .......................................................29
2.2.4 Microarrays ................................................................................................30
2.2.5 Q-PCR expression analysis........................................................................34
2.3 Results ...............................................................................................................35
2.3.1 Cell culture system characterization ..........................................................35
2.3.2 Feeding of potential salicin precursors ......................................................36
2.3.3 Dose-dependent effects of salicyl alcohol feeding on accumulation of
salicin, isosalicin and CTs..........................................................................38
2.3.4 Effect of culture stage on levels of salicin, isosalicin and CT upon salicyl
alcohol feeding...........................................................................................41
2.3.5 Microarray analysis....................................................................................45
6
2.3.6 Real-time PCR analysis .............................................................................47
2.4 Discussion..........................................................................................................56
2.4.1 Salicin synthesis in cell cultures ....................................................................56
2.4.2 Metabolic competition between salicin and CTs in salicyl alcohol-fed
cultures…........................................................................................................58
Chapter 3 Sucrose transporter (SUT) gene family in Populus and PtSUT4-mediated
regulation of non-structural carbohydrates and phenylpropanoids........63
3.1 Introduction......................................................................................................64
3.2 Materials and Methods....................................................................................69
3.2.1 Plant materials............................................................................................69
3.2.2 Gene and protein sequence analysis ..........................................................69
3.2.3 Quantitative dual target PCR .....................................................................70
3.2.4 RNA extraction ..........................................................................................70
3.2.5 cDNA synthesis and Q-PCR expression analysis......................................71
3.2.6 Yeast complementation..............................................................................71
3.2.7 RNAi construct development and plant transformation ............................72
3.2.8 Hydroponic nitrogen treatment studies......................................................72
3.2.9 Sugar and starch extraction and quantification..........................................73
3.2.10 PG and CT extraction and quantification...................................................74
3.3 Results ...............................................................................................................75
3.3.1 The Populus SUT gene family ...................................................................75
3.3.2 Phylogenetic analysis of SUT proteins ......................................................76
7
3.3.3 Expression of PtSUT genes in Populus .....................................................83
3.3.4 Yeast complementation..............................................................................85
3.3.5 Transgenic manipulation of PtSUT4 by RNAi ..........................................85
3.3.6 Non-structural carbohydrates.....................................................................87
3.3.7 Non-structural phenylpropanoids...............................................................93
3.3.8 Gene expression studies.............................................................................95
3.4 Discussion..........................................................................................................99
3.4.1 Group-1 members are vascular-localized in Populus ................................99
3.4.2 Group-3 PtSUT4 exhibits an unusual expression pattern in Populus ......100
3.4.3 Carbohydrate and phenylpropanoid metabolism are altered in PtSUT4
transgenics................................................................................................102
3.5 References.......................................................................................................106
8
LIST OF FIGURES
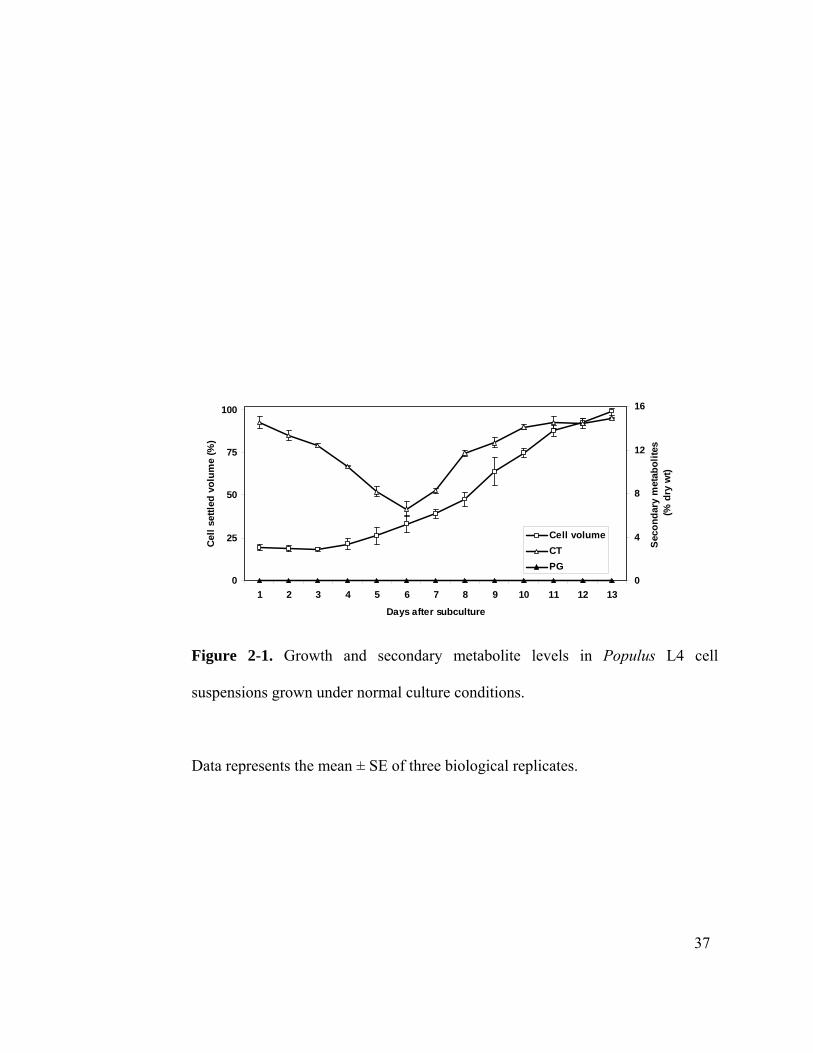
Figure 2-1. Growth and secondary metabolite levels in Populus L4 cell suspensions
grown under normal culture conditions. ........................................................ 37
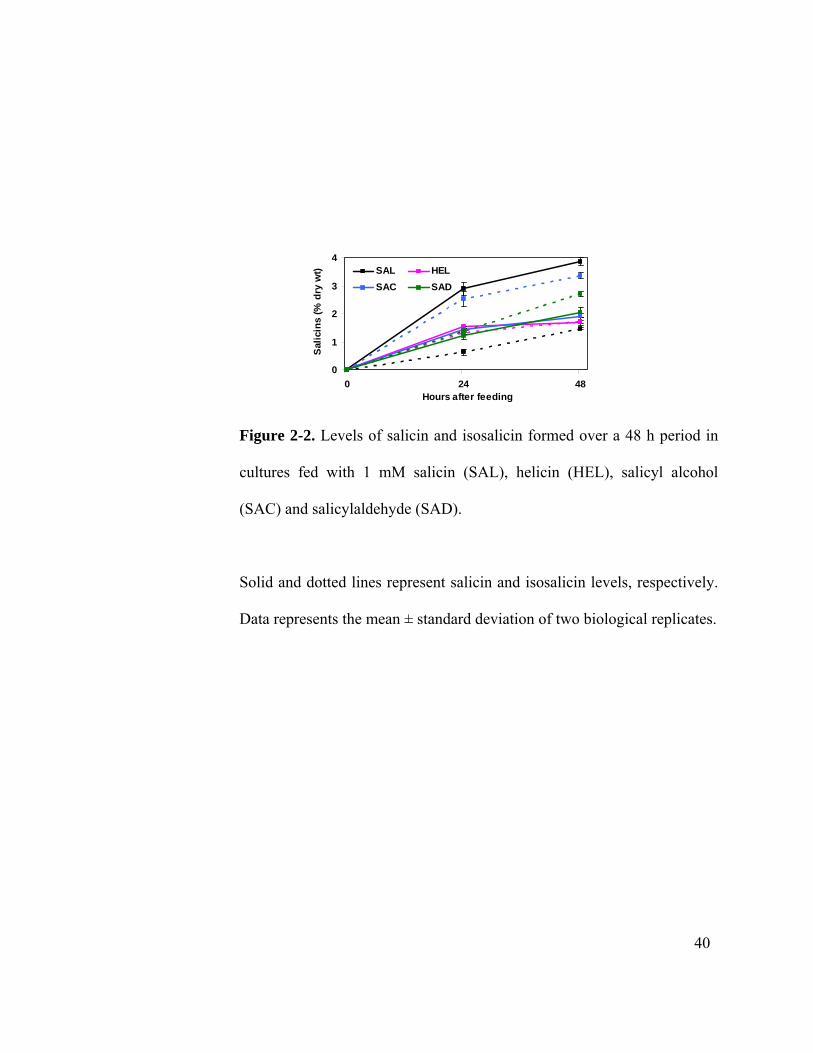
Figure 2-2. Levels of salicin and isosalicin formed over a 48 h period in cultures fed with
1 mM salicin (SAL), helicin (HEL), salicyl alcohol (SAC) and
salicylaldehyde (SAD)................................................................................... 40
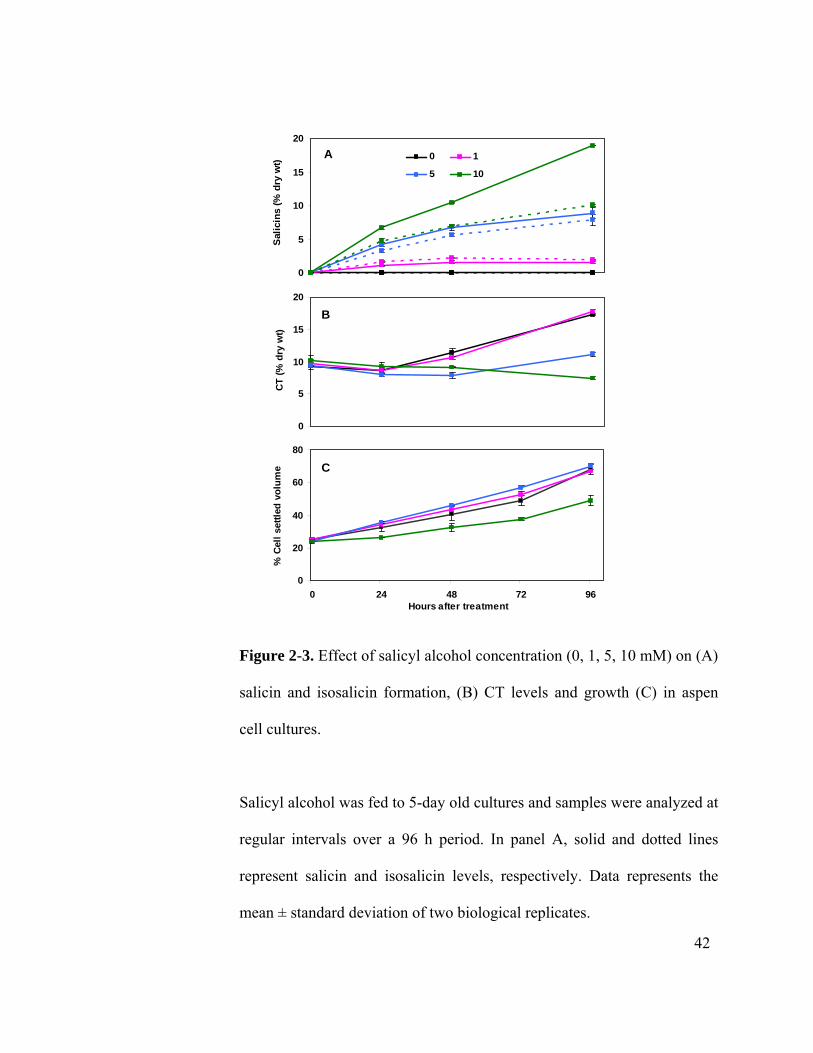
Figure 2-3. Effect of salicyl alcohol concentration (0, 1, 5, 10 mM) on (A) salicin and
isosalicin formation, (B) CT levels and growth (C) in aspen cell cultures.... 42
Figure 2-4. Effects of culture age (2-, 5-, 8-, and 11-day old) on (A) salicin and isosalicin
formation and (B) CT accumulation following 5 mM salicyl alcohol feeding.
....................................................................................................................... 44
Figure 2-5. Q-PCR expression analysis of phenylpropanoid and flavonoid pathway genes
in control (white bars) and salicyl alcohol-fed (gray bars) cultures. ............. 49
Figure 2-6. Q-PCR expression analysis of invertase and sucrose synthase gene family
members in control (white bars) and salicyl alcohol-fed (gray bars) cultures.
....................................................................................................................... 50
Figure 2-7. Q-PCR expression analysis of GT-1 gene family members in control (white
bars) and salicyl alcohol-fed (gray bars) cultures.......................................... 54
Figure 2-8. Q-PCR expression analysis of MRP transporters and SUT genes in control
(white bars) and salicyl alcohol-fed (gray bars) cultures............................... 55
Figure 3-1. Estimation of PtSUT1/2 gene copy number using QD-PCR......................... 78
Figure 3-2. Sequence alignment of the 1-kb fragment of PtSUT1 and PtSUT2 from the P.
9
trichocarpa genome database, and PtSUT1x and PtSUT1y from the clones of
P. tremula × P. alba. ................................................................................... 79
Figure 3-3. Schematic diagram comparing the Populus SUT gene structures. ............... 80
Figure 3-4. Minimum-evolution tree of 58 SUT protein sequences from several plant
species............................................................................................................ 82
Figure 3-5. Tissues expression patterns of Populus SUTs. .............................................. 84
Figure 3-6. Complementation of yeast mutant (SUSY/ura3) with PtSUTs..................... 86
Figure 3-7. Transcript levels of PtSUT4 (A) and PtSUT5 (B) in various tissues of
wildtype (WT) and four transgenic lines (SUT4-B, F, G and H). ................. 88
Figure 3-8. Growth characteristics of SUT4 transgenic and wildtype plants.................. 89
Figure 3-9. Non-structural carbohydrate levels in wildtype and transgenics plants........ 92
Figure 3-10. Non-structural phenylpropanoid levels in wildtype and transgenics plants.94
Figure 3-11. Q-PCR expression analysis of sucrose synthase (SuSy), invertase (INV) and
phenylalanine ammonia-lyase genes (PAL) in various tissues. ..................... 97
Figure 3-12. Heatmaps of SUT, INV, SuSy and PAL gene expression in shoot and root
tissues............................................................................................................. 98
10
LIST OF TABLES
Table 2-1. Feeding precursors (mM) and their corresponding products identified based
on HPLC-UV/MS analysis using retention time and/or m/z ratio. ................ 39
Table 2-2. List of representative non-redundant genes differentially regulated in salicyl
alcohol-fed cultures compared to unfed cultures........................................... 46
Table 3-1. SUT gene models identified from the P. trichocarpa genome (version 1.1).. 77
Table 3-2. Properties of Populus SUT proteins as deduced from the coding sequence. . 81
Table 3-3. Three-way ANOVA for leaf area/stem biomass ratio. ................................... 90
LIST OF APPENDICES
Appendix A. List of primers used in the study. F and R denote forward and reverse
primers, respectively.................................................................................... 121
Appendix B. Foliar carbon (C), hydrogen (H) and nitrogen (N) levels in wildtype and
transgenic leaves.......................................................................................... 124
Appendix C. Sucrose levels on percent dry weight basis in LPI8 of wildtype (WT) and
transgenic (TR) plants.................................................................................. 125
Appendix D. Structural phenylpropanoid (lignin) content in wildtype and transgenic
plants............................................................................................................ 126
11
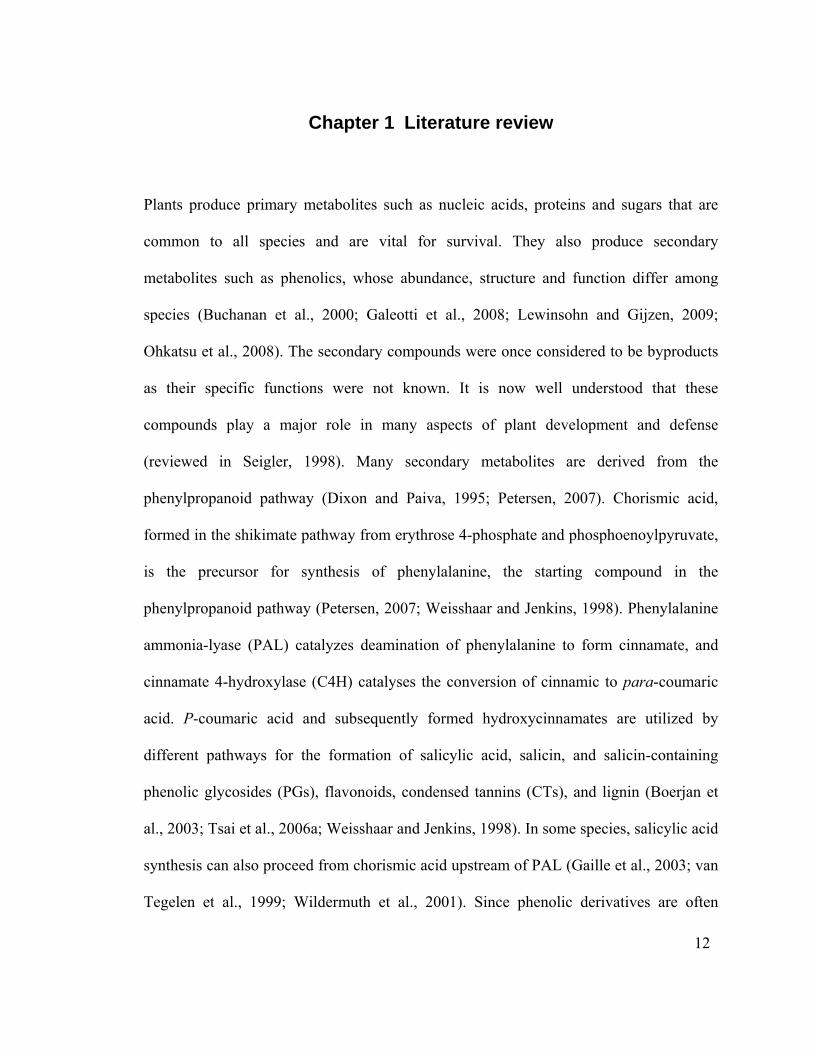
Chapter 1 Literature review
Plants produce primary metabolites such as nucleic acids, proteins and sugars that are
common to all species and are vital for survival. They also produce secondary
metabolites such as phenolics, whose abundance, structure and function differ among
species (Buchanan et al., 2000; Galeotti et al., 2008; Lewinsohn and Gijzen, 2009;
Ohkatsu et al., 2008). The secondary compounds were once considered to be byproducts
as their specific functions were not known. It is now well understood that these
compounds play a major role in many aspects of plant development and defense
(reviewed in Seigler, 1998). Many secondary metabolites are derived from the
phenylpropanoid pathway (Dixon and Paiva, 1995; Petersen, 2007). Chorismic acid,
formed in the shikimate pathway from erythrose 4-phosphate and phosphoenoylpyruvate,
is the precursor for synthesis of phenylalanine, the starting compound in the
phenylpropanoid pathway (Petersen, 2007; Weisshaar and Jenkins, 1998). Phenylalanine
ammonia-lyase (PAL) catalyzes deamination of phenylalanine to form cinnamate, and
cinnamate 4-hydroxylase (C4H) catalyses the conversion of cinnamic to para-coumaric
acid. P-coumaric acid and subsequently formed hydroxycinnamates are utilized by
different pathways for the formation of salicylic acid, salicin, and salicin-containing
phenolic glycosides (PGs), flavonoids, condensed tannins (CTs), and lignin (Boerjan et
al., 2003; Tsai et al., 2006a; Weisshaar and Jenkins, 1998). In some species, salicylic acid
synthesis can also proceed from chorismic acid upstream of PAL (Gaille et al., 2003; van
Tegelen et al., 1999; Wildermuth et al., 2001). Since phenolic derivatives are often
12
bioactive, a majority of these compounds occur as glycosylated conjugates and are stored
in the vacuole (Harborne, 1980). PGs and CTs, the two major phenylpropanoid
derivatives found in Populus, play a major role in defense and adaptation to biotic and
abiotic stress (Bryant et al., 1993; Donaldson and Lindroth, 2007; Galeotti et al., 2008;
Lavola, 1998; Lee et al., 2008).
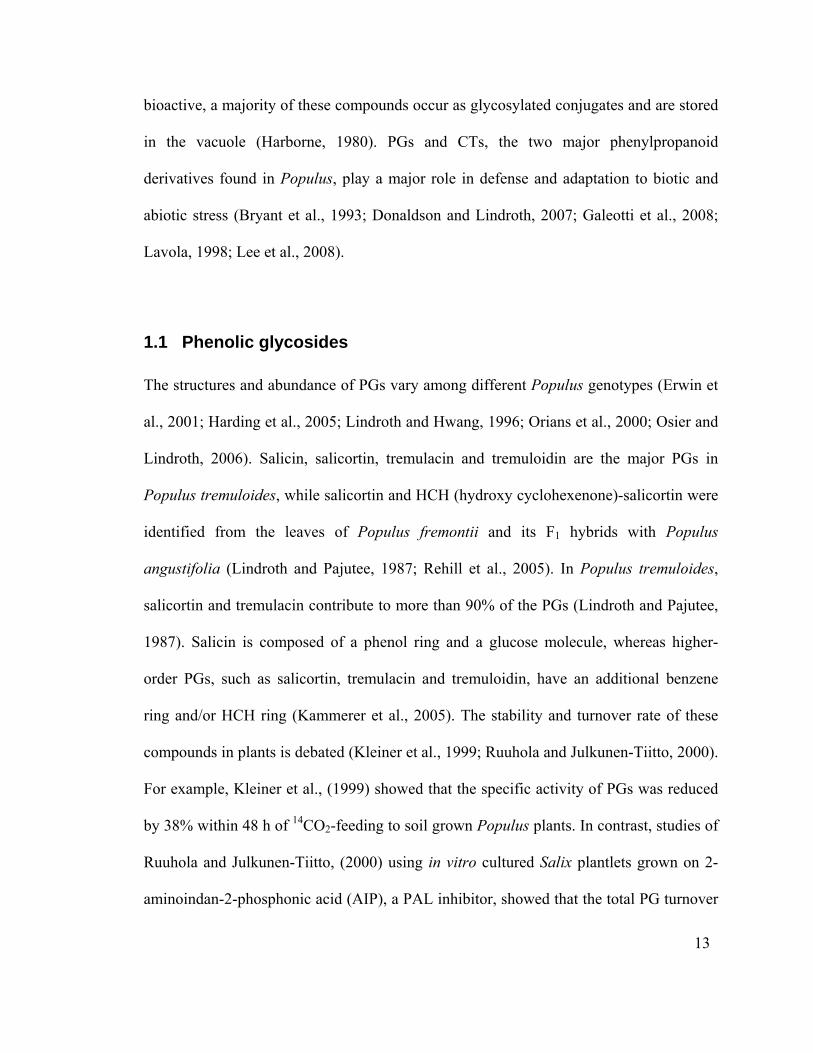
1.1 Phenolic glycosides
The structures and abundance of PGs vary among different Populus genotypes (Erwin et
al., 2001; Harding et al., 2005; Lindroth and Hwang, 1996; Orians et al., 2000; Osier and
Lindroth, 2006). Salicin, salicortin, tremulacin and tremuloidin are the major PGs in
Populus tremuloides, while salicortin and HCH (hydroxy cyclohexenone)-salicortin were
identified from the leaves of Populus fremontii and its F1 hybrids with Populus
angustifolia (Lindroth and Pajutee, 1987; Rehill et al., 2005). In Populus tremuloides,
salicortin and tremulacin contribute to more than 90% of the PGs (Lindroth and Pajutee,
1987). Salicin is composed of a phenol ring and a glucose molecule, whereas higher-
order PGs, such as salicortin, tremulacin and tremuloidin, have an additional benzene
ring and/or HCH ring (Kammerer et al., 2005). The stability and turnover rate of these
compounds in plants is debated (Kleiner et al., 1999; Ruuhola and Julkunen-Tiitto, 2000).
For example, Kleiner et al., (1999) showed that the specific activity of PGs was reduced
by 38% within 48 h of 14CO2-feeding to soil grown Populus plants. In contrast, studies of
Ruuhola and Julkunen-Tiitto, (2000) using in vitro cultured Salix plantlets grown on 2-
aminoindan-2-phosphonic acid (AIP), a PAL inhibitor, showed that the total PG turnover
13
was only 0.6% per day. The experimental methods, genotypes and time points might have
contributed to the observed differences. In leaves, factors such as mechanical damage and
subsequent exposure to foliar enzymes such as esterases and β-glucosidases, contribute to
the stability of these compounds (Ruuhola et al., 2003). The stability of these compounds
at least in in vitro depends on the complexity of the molecule where higher-order PGs are
very labile and degrade to form salicin, catechol and 6-HCH (Lindroth and Pajutee, 1987;
Ruuhola et al., 2003). The levels of these compounds and their inducibility depend more
on the genotype than environmental and nutrient factors (Donaldson and Lindroth, 2007).
Total PG levels generally vary among genotypes and accumulate up to 20% dry wt
(Donaldson and Lindroth, 2007; Harding et al., 2005; Osier and Lindroth, 2006). The
inducibility of these compounds in response to stress was negatively correlated with that
of the constitutive PG levels as observed in defoliation studies using different Populus
genotypes (Stevens and Lindroth, 2005).
The biosynthetic pathway to higher-order PGs has been proposed to start with salicin
and/or salicylic acid, derived from PAL-independent or PAL-dependent pathways (Tsai
et al., 2006a). Substantial proof for the existence of the PAL-dependent pathway comes
from the radiolabel studies of Zenk, (1967) where salicin was formed by leaf feeding of
phenylalanine derivatives such as cinnamic acid and ortho-coumaric acid. Recent
evidence involving transgenic plants harboring the NahG gene encoding a bacterial
salicylic acid hydrolase, along with the earlier label feeding studies argue that salicylic
acid is probably not an intermediate in PG synthesis (Morse et al., 2007; Zenk, 1967). If
it can be assumed that PGs are derived from the phenylpropanoid pathway, it still
14
must be recognized that glucose also comprises a substantial fraction (34 to 42%) of the
carbon in higher-order PGs (Lindroth et al., 1987a; Pearl and Darling, 1971). So far, none
of the genes or enzymes directly responsible for PG biosynthesis or homeostasis has been
identified. In RNAi-mediated suppression lines of p-coumaroyl-CoA 3′-hydroxylase
(C3′H) that catalyzes the 3′-hydroxylation of p-coumaroyl shikimate and p-coumaroyl
quinate, PGs accumulated, but possibly as a secondary effect due to the disruption of
lignin synthesis (Coleman et al., 2008). A similar increase in PGs as a result of altered
lignin polymerization was also observed in laccase down-regulated plants (Ranocha et
al., 2002).
Phenolic glycosides, especially salicortin and tremulacin, are important for poplar
defense against generalist herbivores, such as gypsy moth (Lymantria dispar, Donaldson
and Lindroth, 2007). In contrast, specialist herbivores, such as the cottonwood leaf beetle
(Chrysomela confluens), utilize these compounds as cues for oviposition, and convert
PGs to salicylaldehyde which is toxic to its predators (Pasteels et al., 1983). PGs are also
gaining recognition as chemotaxonomic markers in classification of Salicaceae
(Julkunen-Tiitto, 1985; Rehill et al., 2005). Besides their importance to plants as
defensive compounds, they also have medicinal properties which humans have exploited.
An ancient traditional practice to cure aches and pains is to chew willow bark. It wasn`t
until the last century that the active ingredient in willow bark was found to be salicylic
acid, a breakdown product of salicin that relieves pain. A brief review of the importance
of salicylates in medicine and the discovery of acetyl salicylic acid, which we now use in
the form of aspirin, is discussed elsewhere (Mahdi et al., 2006).
15

1.2 Condensed tannins
Another important branch from the phenylpropanoid pathway leads to the production of
flavonoids and condensed tannins. Populus species, like all higher plants, contain
different classes of flavonoids, such as chalcones, dihydrochalcones, flavanones,
flavones, flavanonols, flavonols, anthocyanins and proanthocyanidin (CT) precursor
flavan-3-ols. These compounds have different functions in plants, contributing to
defense, pigmentation, stress response, signaling, pollen tube growth and root
development (Donaldson and Lindroth, 2004; Feugey et al., 1999; Fischer et al., 2006;
Schweitzer et al., 2004; Winkel-Shirley, 2002; Ylstra et al., 1992). The level of these
foliar secondary compounds, such as CTs, has significant effects on leaf decomposition
and nutrient cycling in the soil, especially as related to C and N mineralization (Gehring
et al., 2006; Northup et al., 1998; Schweitzer et al., 2008). Some evidence exists that the
levels of foliar CTs in Populus correlate with root growth (Fischer et al., 2006). A
conceptual model has been developed that illustrates the complex roles of genes and
environmental factors, such as herbivores and nutrient availability, on the synthesis of
CTs, and the impact on the ecological interactions of above- and below-ground plant
parts (Schweitzer et al., 2008).
The concentrations of flavonoids and CTs vary among clones of Populus and Salix
species (Greenaway et al., 1991; Orians et al., 2000; Stevens and Lindroth, 2005). CT
levels also vary among different vegetative tissues. For example, in the P.tremula × P.
alba clone 717-1B4, CT concentrations are highest in elongating roots (20% dry wt),
much lower in leaves and stems (<1% dry wt) and below detection in xylem (R.S. 16
Payyavula, unpublished). In other species of Populus, leaf CT abundance can be as high
as 20% (Stevens and Lindroth, 2005; Stevens et al., 2007). Of the A, B and C rings of
CTs, the A and C rings (60% C) are derivatives of phenylpropanoid, while the B ring
(40% C) originates from malonyl-CoA, via acetyl-CoA synthesized from pyruvate or via
beta-oxidation of fatty acids (Taiz and Zeiger, 1998). The phylogenetic organization of
many of the phenylpropanoid and flavonoid pathway genes expressed in Populus tissues
has been reported (Tsai et al., 2006b). The regulation of genes in this pathway has also
been discussed in several review papers (Dixon and Paiva, 1995; Lanot et al., 2008;
Lucheta et al., 2007; Weisshaar and Jenkins, 1998).
Substantial evidence exists for reciprocal levels of PGs and CTs. The tissue levels of CTs
in Populus hybrids that accumulate both CT and PG often correlate negatively with the
levels of PGs. PG levels are often higher in leaves collected from young Populus plants
and the levels decrease during ontogenetic changes in growth of the trees over a several-
year period (Donaldson et al., 2006b). In contrast, CT levels were lower in leaves from
the younger plants and increased with plant age. Negative correlations of PGs and CTs
have also been observed in Salix hybrids (Orians and Fritz, 1995; Orians et al., 2000).
Several reports also presented growth tradeoff in relation to accumulation of secondary
metabolites. Populus distributes up to 30% of the fixed C to the secondary metabolites,
such as PGs and CTs that are useful for defense (Donaldson et al., 2006b; Harding et al.,
2005; Kleiner et al., 1999). Besides substantial commitment of Populus for these
compounds, the levels of these defensive compounds also increase in response to biotic
(e.g., insect) and abiotic (e.g., nutrient) stress (Harding et al., 2005; Kleiner et al.,
17
1998; Osier and Lindroth, 2006; Ruuhola et al., 2001). Accumulation of high levels of
these compounds especially under low nutrient conditions has a negative effect on growth
(Donaldson and Lindroth, 2007). Also, a tradeoff between growth and the synthesis of
salicylates was observed in the in vitro micropropagated Salix plantlets (Ruuhola and
Julkunen-Tiitto, 2003). The synthesis of growth-compromising levels of these
compounds may be necessary for defense, although it is an added cost to plant. A better
understanding of the carbon portioning to the secondary metabolite synthesis and of the
PG biosynthetic pathway will be necessary for mechanistic investigation on the possible
tradeoff among growth, PG and CT.
1.3 Sucrose and Sucrose transporters
There is increasing evidence that the PG and CT accumulation depend on sink strength
and the transported sucrose upon hydrolysis (Arnold and Schultz, 2002; Kleiner et al.,
1999). In most plant species, sucrose is the major photosynthetic product transported
from source to sink tissues. The imported sucrose, after hydrolysis by either invertases or
sucrose synthases (SuSy), is channeled into glycolysis and the tricarboxylic acid cycle,
through which primary and secondary metabolites are synthesized (Buchanan et al.,
2000; Kleiner et al., 1999). Several studies revealed that sucrose, besides acting as a
transport molecule, also acts as a signaling molecule in defense and carbohydrate
synthesis and partitioning (Chiou and Bush, 1998; Gomez-Ariza et al., 2007; Rolland et
al., 2002; Zhou et al., 2009). Many sucrose-regulated genes were also shown to be
hexose-regulated, supporting the view that hydrolyzed sucrose delivers hexoses that
18
could act as signal molecules.
In mature leaves, sucrose loading into phloem occurs by either passive symplastic
connections through plasmodesmata, or by energy-mediated apoplastic loading using
sucrose transporters, also referred to as sucrose carriers (SUT/SUC). The first functional
sucrose transporter was reported by Riesmeier et al., (1992) from spinach. In several of
the model plant systems where sucrose transporters have been investigated, multiple
proteins have been characterized (Sauer, 2007). For example, nine SUCs in Arabidopsis
(ArabidopsisGenomeInitiative, 2000), five in rice (Oryza sativa, Yu et al., 2002) and
three in tomato (Lycopersicum esculentum, Barker et al., 2000) have been reported on.
SUT/SUCs from different plant species were classified into three groups based on
phylogenetic analysis (Reinders et al., 2008). Transporters from different groups can also
be distinguished by their kinetic properties, including affinity (Km) for sucrose and
capacity (Vmax) for sucrose transport (reviewed in Kuhn, 2003). While Group-1
transporters are involved in phloem loading of sucrose, the functions of Group-2 and
Group-3 transporters are less well understood. The expression and activity of SUTs can
be regulated by sugars such as glucose and sucrose, and by mechanical stimuli such as
wounding (Chiou and Bush, 1998; Meyer et al., 2004). Besides sucrose, SUTs can also
transport glycosylated phenolic derivatives such as salicin and helicin (Chandran et al.,
2003; Sivitz et al., 2007). In several plant species, insertional mutants and antisense
suppressed lines have been used to study the function of SUTs. Both carbohydrate
transport and the levels of secondary metabolites are altered in Arabidopsis, tomato and
potato (Solanum tuberosum) plants with suppressed Group-1 SUT expression
19
(Gottwald et al., 2000; Hackel et al., 2006; Riesmeier et al., 1994; Srivastava et al.,
2008). These results support the involvement of SUTs in partitioning of the carbohydrate
assimilates.
Populus is an ecologically and economically important tree species found throughout
North America. The availability of the complete genome sequence and the presence of
genotypic variation in growth rate and foliar abundance of PGs and CTs make Populus a
commercially relevant model for studying the trade-off between secondary metabolism
and growth. In this study, two different approaches, whole plant and cell culture, were
used to understand PG-CT metabolism. In the first chapter, SUT gene family members in
Populus were identified and characterized. An RNAi-mediated transgenic approach was
used to investigate the role of the most abundantly expressed SUT, PtSUT4, on sucrose
transport and PG homeostasis in planta. The effects on carbohydrate concentrations
throughout the plant, on the expression of genes known to be important for carbohydrate
utilization, and on PG and CT homeostasis were analyzed. In the second chapter, cell
cultures were used in feeding experiments to investigate metabolic changes associated
with glycosylation of phenolic substrates. The substrates used, salicyl alcohol and
salicylaldehyde, are potential PG precursors in planta. Gene expression changes were
analyzed using microarrays and QPCR. Gene expression and metabolite data was studied
on general effects of feeding as well as on the sensitivity of carbon partitioning between
phenylpropanoid branches to the feeding.
20
Research objectives:
1. Demonstrate the use of Populus-derived suspension cells for investigating effects
of phenylpropanoid glycosylation on carbon partitioning relevant to growth, CT
and PG homeostasis.
2. Characterize the SUT gene family in Populus and investigate SUT4 function in
carbohydrate partitioning and PG-CT homeostasis in planta.
21
Chapter 2 Metabolic and gene expression changes associated
with salicyl alcohol feeding in aspen cell cultures
ABSTRACT
Phenylpropanoid-derived phenolic glycosides (PGs) and condensed tannins (CTs) are the
two major groups of secondary metabolites in Populus. PGs and CTs show reciprocity in
their abundance. Although the biosynthesis of PGs is less well understood than that of
CTs, certain phenolic derivatives, including salicin, are thought to be precursors for the
synthesis of higher-order PGs, such as salicortin, tremulacin and tremuloidin. Salicin and
higher-order PGs are not synthesized in cell cultures grown under standard conditions.
Feeding with salicyl alcohol, salicylaldehyde and helicin, but not benzoic acid, benzyl
alcohol, benzylaldehyde, salicylic acid, cinnamic acid and O-coumaric acid, led to
synthesis of salicin and isosalicin in the cells. The highest levels of salicins were detected
by salicyl alcohol feeding at the early stages of growth. Accompanying formation of
salicins from salicyl alcohol was a decrease in CT levels by up to 30% and an increase in
growth by up to 15%. The expression of genes encoding putative tonoplast localized
sucrose transporter (PtSUT4), and sucrose hydrolytic enzymes, cytosolic sucrose
synthases (PtSuSYs 1, 2 and 3) and vacuolar invertase (PtVIN2) was altered in salicyl
alcohol-fed cultures. This suggests differential compartmentalization of sucrose
hydrolysis and possibly differential utilization of sugars between carbon demanding
pathways. Microarray analysis revealed an up-regulation of genes related to glycolysis
and Kreb cycle pathways which utilize acetyl-CoA, a precursor for fatty acid and
22
malonic acid biosynthesis. As malonic acid contributes 40% of carbon skeleton of CTs,
the amount of carbon allocated for CT synthesis might be reduced. The reduced
expression of most phenylpropanoid and flavonoid pathway genes is consistent with
reduced carbon flux for CT synthesis. Therefore, our data suggest that the reduced CTs in
salicin-accumulating cells might be a result of competition for the carbon resources
between growth, CT and salicin synthesis. In salicyl alcohol-fed cultures, two abundant
glycosyltransferase transcripts, PtGT1-2 and PtGT1-246, were further up-regulated, as
well as genes encoding vacuolar ATP-binding cassette transporter proteins, PtMRP1,
PtMRP6. Their possible roles during salicyl alcohol glycosylation and uptake of salicins
into the vacuole are discussed.
2.1 Introduction
Populus trees and their close relatives in the family Salicaceae are capable of producing
large quantities of phenolic glycosides (PGs) and condensed tannins (CTs) in their
vegetative tissues (Donaldson et al., 2006a; Hwang and Lindroth, 1997; Osier and
Lindroth, 2006; Ruuhola and Julkunen-Tiitto, 2003). PGs and CTs play a major role in
defense and protection against biotic (e.g. insects, Bryant et al., 1993; Donaldson and
Lindroth, 2007) and abiotic (e.g. UV-B radiation, Lavola, 1998) stress. PGs and CTs are
thought to be derived from common phenylpropanoid precursors (Tsai et al., 2006a).
Their abundance varies among species, genotypes or individuals (Harding et al., 2005;
Orians et al., 2000; Ruuhola et al., 2001; Stevens et al., 2007). The biosynthesis of
phenylpropanoid derivatives, such as flavonoids and CTs, is relatively well characterized
23
at the molecular and biochemical levels in herbaceous species, such as Arabidopsis, and
in woody plants, such as Populus (Besseau et al., 2007; Matsui et al., 2004; Tsai et al.,
2006a; Weisshaar and Jenkins, 1998). In contrast, the biosynthetic pathway of PGs is
poorly understood. Salicin (O-hydroxymethyl phenyl β-D-glucoside) from Salix bark was
the first PG-like substance to be isolated from a higher plant. Salicin is considered both a
precursor and a degradation product of high-order PGs, such as salicortin and tremulacin
(Julkunen-Tiitto and Sorsa, 2001; Lindroth and Pajutee, 1987; Pearl and Darling, 1971;
Pierpoint, 1994; Ruuhola and Julkunen-Tiitto, 2003). At the present time however, salicin
synthesis itself is also not well understood.
Multiple biosynthetic pathways for salicin have been proposed (Pierpoint, 1994; Pridham
and Saltmarsh, 1963; Ruuhola and Julkunen-Tiitto, 2003; Zenk, 1967), resulting in a
number of proposed precursors. Radiolabel studies suggested that, in Salix (Salix
purpurea) leaves, salicin synthesis proceeds from the phenylpropanoid pathway, via
intermediates such as O-coumaric acid, benzyl derivatives, salicylaldehyde and helicin
(Zenk, 1967). Salicin was also synthesized from salicyl alcohol that may itself be derived
from O-coumaric acid (Zenk, 1967). In contrast, fed salicyl alcohol accumulated only as
isosalicin (O-hydroxybenzyl-β-D-glucoside) in leaves of sunflower (Helianthus annuus,
Zenk, 1967) and seedling of broad beans (Vicia faba) and maize (Zea mays, Pridham and
Saltmarsh, 1963). In cell cultures, salicyl alcohol was converted into salicin and isosalicin
in Salix, Gardenia (Gardenia jasminoides) and Lithospermum (Lithospermum
erythrorhizon), and into isosalicin in tobacco (Nicotiana tabacum), Datura (Datura
innoxia), Duboisia (Duboisia myoporoides) and several other species (Mizukami et
24
al., 1986; Shimoda et al., 2002; Tabata et al., 1976). Salicylaldehyde accumulated as
salicin and isosalicin in cell cultures of Salix (Dombrowski and Alferman, 1992), but as
isosalicin in Datura (Tabata et al., 1976). These results suggest that salicyl alcohol- and
salicylaldehyde-mediated salicin synthesis is species- and tissue-specific. In cell cultures
of all the above species, neither salicin nor isosalicin has been observed without precursor
feeding.
The synthesis of phenolics and their subsequent glycosylation demand substantial
amounts of C which otherwise can be used for growth. For example, growth was
increased by inhibition of endogenous synthesis of PGs in micropropagated plantlets of
Salix after feeding 2-aminoindan 2-phosphonic acid (AIP), a specific inhibitor of
phenylalanine ammonia-lyase (PAL) involved in phenylpropanoid pathway (Ruuhola and
Julkunen-Tiitto, 2003). A negative correlation was observed in Populus and Salix, where
fast growing plants accumulated lower levels of defensive compounds than did slow
growing plants and vice versa (Hwang and Lindroth, 1997; McDonald et al., 1999;
Nichols-Orians et al., 1993). Besides genetic factors, environmental factors such as soil
nutrient contents also play a role in growth and defense tradeoff. For example,
application of N fertilizer increased growth and reduced secondary metabolite levels and
vice versa (Donaldson et al., 2006a; Hakulinen et al., 1995; Osier and Lindroth, 2006;
Ruohomaki et al., 1996). A negative correlation was also observed in levels of PGs and
CTs. For example, F1 hybrids of Salix that accumulate high levels of PGs accumulate low
levels of CTs (Orians and Fritz, 1995; Orians et al., 2000). Developmental shifts between
CTs and PGs was observed in Populus (Donaldson et al., 2006b). In spite of several
25
correlative results, the molecular mechanisms underlying the metabolic competition
between growth and secondary metabolites and within secondary metabolites are not
known.
In heterotrophic cell cultures, growth and metabolism depends on the sugars, typically
sucrose, supplied in the media. Sucrose imported into the cells is utilized in different
metabolic pathways, but only upon its hydrolysis into hexoses (Koch, 2004; Sturm,
1999). The hexoses are also utilized for glycosylation of the phenolics, which are
potentially toxic to the cells at high levels. Glycosyl transferases (GT) catalyzes the
transfer of sugar molecules to the phenolics (Ross et al., 2001). In plants, the GTs that are
involved in the glycosylation of simple phenolics belong to family 1 (Gachon et al.,
2005). Exogenously fed phenolics are glycosylated in the cytoplasm and are transported
into vacuoles by class- and plant species-specific mechanisms (Dean et al., 2005; Rea,
2007; Walczak and Dean, 2000).
Since genes specific to PG biosynthesis have not yet been identified, a transgenic
approach is not currently feasible. Cell culture provides a convenient, albeit artificial,
means to manipulate PG accumulation by feeding precursors under relatively uniform
conditions. A challenge with woody species is their general recalcitrance to cell
suspension cultures. We have previously identified a single aspen (Populus tremuloides)
line (L4) that is amenable to suspension culture from a screen of over 300 seeds (Tsai,
unpublished data). Salicin does not accumulate to detectable levels in Populus cell
cultures grown under normal culture conditions (preliminary work). Cell cultures
26
were fed with potential salicin precursors in order to address if salicin accumulation and
sequestration interfere with CT homeostasis. Microarrays were used to determine
changes in gene expression across broad categories of metabolic pathways, and to help
understand the metabolic consequences of PG accumulation. Investigation of metabolic
shifts associated with PG homeostasis in simple cell culture systems may shed light on
whole plant level investigation of PG regulation.
2.2 Materials and methods
2.2.1 Cell cultures
Leaves from greenhouse-grown Populus genotype PtL-4 were disinfected by surface-
sterilizing in 20% bleach for 20 min, rinsed with water and cultured on semi-solid woody
plant medium (WPM, Lloyd and McCown, 1980) supplemented with 2.2 mg l-1 of 2,4-
dichlorophenoxy acetic acid (2,4-D) and 3% sucrose for callus induction. Calli (~5 gm)
were used to establish suspension cultures in 30 ml of liquid WPM medium containing
2.2 mg l-1 of 2,4-D with 3% sucrose in a 125 ml flask covered with aluminum foil, and
maintained in an orbital shaker at 120 rpm in the dark at 25 oC. Cells were subcultured at
11-day intervals by inoculating 5 ml culture to 30 ml fresh medium. Cell cultures were
sieved with a 750 µm mesh at 2-month intervals to select uniform sized cells.
Experiments were conducted after 2 subcultures of sieved cells to ensure uniformity. Cell
growth was regularly monitored during the study period by measuring percent settled cell
volume using a Nephlo flask. When needed, the amount of inoculum was adjusted such
that the settled cell volume was near 20% at the time of subculture.
27
Phenolic compounds, including salicin, cinnamic acid, O-coumaric acid, benzoic acid,
benzyl alcohol, benzylaldehyde, salicylic acid, salicyl alcohol and salicylaldehyde, were
used in the feeding studies. The stocks of these compounds prepared in either ddH2O or
dimethyl sulfoxide (DMSO) were filter-sterilized (0.45 µm pore size) and administered to
the cultures in early log phase, typically 5 days after subculture unless otherwise
mentioned. The concentration of the phenolics used in this study varied between 0.2 to 5
mM as specified in the results. Cells were harvested at regular intervals by low vacuum
filtration after three rinses with 25 ml of 50 mM sodium chloride followed by three rinses
with water, snap frozen in liquid nitrogen and stored at -80 oC.
2.2.2 PG & CT extraction and quantitative estimation
Freeze-dried cell samples were analyzed for PG and CT as described by Harding et al
(2005) with slight modifications. Briefly, 5 mg of each sample were extracted in 800 µl
of cold methanol for 20 min in a cold ultrasonic bath and centrifuged at 15,000 g for 5
min. The methanol extract was used to estimate glucose-conjugates (salicin, isosalicin,
cinnamoyl-glucoside, O-coumaroyl-glucoside, salicyloyl-glucoside, benzyl alcohol-
glucoside, and benzoyl-glucoside) by using HPLC-UV/MS (Hewlett-Packard
1100 Series, Agilent Technologies, Palo Alto, CA) equipped with an Eclipse XBD-C18
column (5 μm, 2.1 X 150 mm). Methanolic extracts (5 µl) was injected into the column
and eluted at a flow rate of 0.2 ml/min using solvents A (10 mM formic acid, pH 3.4) and
B (100% Acetonitrile) according to the following gradient: 0 to 15 min, 0% to 70% B, 15
to 17 min, 70% to 100% B, 17 to 19 min, 100% to 0% B and 19 to 30 min 0% B.
28
Compounds were identified by UV-absorbance (274 nm) and mass spectral data.
Concentrations of both salicin and isosalicin were estimated by calibration curves
developed using authentic salicin (Sigma St. Louis, MO).
Soluble and residue-bound CTs were estimated according to Porter et al., (1986). Briefly,
a dried aliquot of the methanol extract (125 µl) was used to estimate methanol-extracted
CTs. Both dried extract aliquot and the pellet were resuspended in 250 µl methanol, 750
µl butanol:HCl (95:5) and 25 µl 2% ferric-ammonium-sulfate in 2 M HCl, and heated for
20 min at 95oC. CTs were quantified using a 96-well plate reader (SpectraMax,
Molecular Devices, Sunnyvale, CA) by comparing their absorbance at 550 nm (Porter et
al., 1986; Tiarks et al., 1992) with that of purified aspen leaf CT.
2.2.3 RNA extraction and DNase treatment
RNA was extracted from frozen cells using the CTAB (cetyltrimethylammonium
bromide) method (Chang et al., 1993). Briefly, in a Oakridge tube containing 15 ml of
CTAB buffer (2M NaCl, 25 mM EDTA, 0.1 M Tris-HCl (pH 9.0), 2% w/v PVP (K-30),
2% w/v CTAB) containing 2% β-mercaptoethanol, the finely ground sample was added,
vortexed for 1 min and incubated for 15 min at 65 ºC with intermittent mixing. To this
tube, 10 ml of chloroform:isoamyl alcohol (24:1) was added, vortexed and centrifuged
for 10 min at 15,000 g to separate the two phases. Chloroform:isoamyl alcohol extraction
was repeated twice before precipitating RNA from the aqueous phase (~12 ml) with 4 ml
of 8M LiCl. The samples were incubated on ice for 4 hours and centrifuged at 4 ºC for 15
29
min at 15,000 g. The sample was resuspended in 500 μl of ddH2O and reprecipitated with
170 μl of 8 M LiCl as above. After the second precipitation, the pellet was dissolved in
300 μl of ddH2O, with 30 μl of 3M sodium acetate (pH 5.0) and 800 μl of 95% ethanol,
incubated at -80 ºC for 30 min and centrifuged at 4 ºC for 15 min at 14,000 g. The pellet
was then washed with 1 ml of 70% ethanol, air dried and dissolved in 50-100 μl of
ddH2O, depending on the pellet size. RNA quantity was assessed by using a NanoDrop
ND-1000 spectrophotometer (NanoDrop Technologies, Wilmington, DE) and integrity
was assessed by running 400 ng RNA on a 1% agarose gel. RNA was treated with Turbo
DNase, according to the manufacturer’s instructions (Ambion INC, Austin, TX) to
remove the contaminating genomic DNA. Briefly, 25 μg of RNA were incubated with 5
μl of DNase buffer (10X) and 1 μl of DNase enzyme (2 U/μl) in a 50 μl reaction for 30
min at 37 oC. The DNase enzyme was then inactivated by adding 5 μl of DNase
inactivation reagent. The mixture was incubated for 2 min at room temperature and
centrifuged at 10,000 g for 1.5 min. The supernatant was collected as DNA-free total
RNA.
2.2.4 Microarrays
2.2.4.1 cDNA synthesis and aminoallyl labeling
For microarray hybridization, cDNA synthesis was carried out with 10 μg of DNA-free
total RNA, 0.5 μl of RNase inhibitor (40 U/μl, Ambion), 0.5 μl of 5× first strand buffer, 2
μl of amine-modified random primers (2 μg/μl, Sigma), 3 μl of mRNA spike mix
(Lucidea Universal ScoreCard, Amersham, Piscataway, NJ), and ddH2O to a final
30
volume of 19 μl. To denature the RNA secondary structure, the reaction mixture was
incubated for 5 min at 65 oC, and cooled on ice. Remaining reagents, which include 5.5
μl of 5× first strand buffer, 2.5 μl of 0.1 M DTT, 0.5 μl RNase inhibitor, 0.6 μl of 50×
nucleotide mix (prepared by mixing 5 μl each of 100 mM dATP, dCTP and dGTP, and 3
μl of dTTP and 2 μl of aminoallyl-labeled dUTP), and 2.0 μl superscript III RT (200
U/μl, Invitrogen, Carlsbad, CA), were added and the tube was incubated for 10 min at
room temperature, followed by 4 hours at 46 oC. Following the reaction, RNA was
hydrolyzed with 10 μl of 1 M NaOH, and 10 μl of 0.5M EDTA and incubating for 15 min
at 65 oC. The reaction was neutralized by adding 12 μl of 1 M HCl and 20 μl of 100 mM
sodium acetate (pH 5.2).
2.2.4.2 cDNA purification
The cDNA was purified using a QIAquick column (Qiagen, Valencia, CA) as per
manufacturer’s protocol. Briefly, cDNA was diluted with 425 μl of Quiagen buffer PB,
and the mixture transferred to a QIAquick column and centrifuged for 1 min at 13,000 g.
The flow through was passed through the same column twice prior to disposal. The
column was washed twice with 600 μl of 80% ethanol wash buffer and spun at 13,000
rpm for 1 min. The flow through was discarded and the column was recentrifuged. cDNA
was then eluted twice, each with 30 μl of 4 mM phosphate buffer with centrifugation at
13,000 g for 1 min. After estimating the quantity of cDNA with a NanoDrop, 2 μg of
cDNA was aliquoted into amber microcentrifuge tubes, vacuum dried and stored at -20oC
until used.
31
2.2.4.3 cDNA-Cy dye coupling and dye labeled target purification
Cy3 or Cy5 dye (Amersham, Piscataway, NJ) was dissolved in 10 µl of 0.1 M sodium
carbonate buffer (pH 9.0), and mixed with 2 µg of dried aminoallyl-labeled cDNA in the
amber microfuge tube. The labeling reaction was dark-incubated at room temperature on
a shaker for 20 min, and the reaction was then quenched by adding 35 µl of 100 mM
sodium acetate (pH 5.2) and 250 µl of the Qiagen PB buffer. The Cy dye-labeled cDNA
was purified using a QIAquick column (Qiagen), washed and eluted twice, each with 30
µl of Qiagen EB elution buffer. The Cy dye-labeled cDNA concentration was estimated
using a NanoDrop and the amount of dye incorporation (pmol) and frequency of
incorporation (FOI) was calculated. Finally, aliquots of 50 pmol Cy dye-labeled cDNA
were vacuum dried, and stored at -20 oC until used.
2.2.4.4 Array hybridization
The experiment consisted of three biological and two technical (dye swap) replicates. The
microarray slides used for this study contained replicate subarrays of 6705 elements
representing 6313 previously characterized aspen expressed sequence tags (ESTs, Ranjan
et al., 2004). The construction of aspen cDNA microarray was described in Harding et
al., (2005). Briefly, the cloned cDNAs were PCR amplified using M13 forward and
reverse primers. The dried, ethanol precipitated PCR products were resuspended in 20 μl
of Corning Pronto! spotting solution (Fisher, Hanover Park, IL) and transferred to 384-
well plates for spotting. cDNAs were spotted onto amino silane glass slides (Corning
UltraGAPS, Fisher) at the Genomics Technology Support Facility of Michigan State
32
University. To monitor target labeling and hybridization efficiency, various positive and
negative controls (Lucidea Universal ScoreCard, Amersham) were also included on the
slide.
The spotted cDNA was immobilized onto the slide by UV cross-linking (150 mJ) and by
snap baking (1 min at 120 oC). Immediately prior to hybridization, the slide was soaked
in a petri dish containing prehybridization solution (5× SSC, 0.1% SDS and 1% BSA) for
15 min on an orbital shaker, rinsed 20 times in a falcon tube containing ddH2O followed
by rinsing in ethanol for a few seconds, and dried under a heavy stream of Hepa-filtered
air using a microarray Air Jet. Equal amounts (50 pmole) of Cy3- and Cy5- labeled
cDNA from control and salicyl alcohol-fed cultures were suspended in 55 μl of
hybridization buffer (50% formamide, 5× SSC, 0.4% SDS and 0.1% BSA). The mixture
was denatured at 42 oC for 5 min, centrifuged briefly, applied to the slide and covered
with a piece of parafilm. Hybridization was carried out for 36 hours in a hybridization
oven (Boekel Scientific, Feasterville, PA) at 38.5 oC with humidity maintained by wet
paper towels soaked in the hybridization buffer. The slides were then rinsed three times
separately in beakers containing 500 ml of 1× SSC and 0.2% SDS (42 oC), followed by
0.1× SSC and 0.2% SDS, and finally in 0.1× SSC before drying the slides using a
microarray Air Jet.
2.2.4.5 GenePix Image acquisition and analysis
The slides were scanned at 532 and 635 nm for Cy3 and Cy5, respectively, with a
Genepix 4000B scanner (Axon Instruments, Union City, CA) and the florescence signal
33
intensity was quantified using the GenePix Pro 5.1 software (Axon Instruments). Spots
with signal intensities in both channels greater than two standard deviations from the
background signal were flagged as present.
LOWLESS (locally weighted linear regression) normalization (Cleveland and Devlin,
1988; Yang et al., 2002) of the data was performed using GeneSpring 6.2 software
(Silicon Genetics, Redwood City, CA). Hybridization signals satisfying the criteria
mentioned below were used for expression analysis. Spots must be present in four of the
six replicates (4,149 spots); coefficient of variation (CV) among samples less than 35%
(3,957 spots); and raw hybridization signal more than 100 in at least four of the six
replicates (1,812 spots). Among these were 938 differentially expressed genes based on
the t-test with a false discovery rate for multiple testing correction at P = 0.05 using the
Benjamini and Hochberg algorithm (Benjamini and Hochberg, 1995). A threshold ratio
cutoff of 1.3 was used to further narrow the list of differentially expressed genes to 540.
2.2.5 Q-PCR expression analysis
34
cDNA was synthesized using total RNA (2 µg), anchored oligo(dT)20 primers and
SuperScript II reverse transcriptase (Invitrogen, Carlsbad, CA). Relative transcript
abundance was analyzed by Q-PCR in a 12.5 µl reaction volume using cDNA (from 2.5
ng of total RNA), gene-specific primers and ABsolute QPCR SYBR Green Mix (Abgene,
Rochester, NY, USA) with ROX as an internal reference. Amplification was carried out
as follows: 15 min at 95 oC followed by 40 cycles of 15 sec at 95 oC, 1 min at 55 oC, and
1 min at 72 oC, using the Mx3000P Real-Time PCR system (Stratagene, La Jolla, CA,
USA). Three biological and two technical replicates were used for each determination. A
zero-template reaction was included as the negative control. Relative expression of the
genes was calculated by the ΔCT method by normalizing the expression levels of target
genes to the expression mean of two housekeeping genes, ubiquitin-conjugating enzyme
E2 and elongation factor 1-β (Tsai et al., 2006a). Specificity of amplification was
assessed by dissociation curve analysis using the MxPro software (Stratagene). The
primer sequences are presented in Appendix A (sucrose transporters, sucrose synthases,
invertases, glucosyl transferases and multi-drug resistance associated proteins) or in Tsai
et al., 2006a (phenylpropanoid and flavonoid pathways genes).
2.3 Results
2.3.1 Cell culture system characterization
The baseline growth pattern of cell cultures established from the aspen L4 genotype is
presented in Figure 2-1. Growth of the cells was monitored by estimating settled cell
volume (%) using a Nephlo flask. After subculturing into fresh medium, cells showed a
characteristic growth curve with a 4-day lag phase, followed by an exponential phase,
before entering into the stationary phase around day 12 (Figure 2-1). An 11-day interval
was therefore chosen for routine subcultures, and the cell volume typically increased by
~400% at the end of the culture cycle. This pattern of cell growth was stable for more
than 40 passages during the experimental period.
35
To establish the basal levels of CT and PG accumulation during the culture cycle, cells
were harvested at regular intervals and analyzed for CTs and PGs. At the start of the
culture, CT concentrations averaged 14.4% dry wt, but decreased gradually through the
lag and early log phases to a low of 6.5%, and then increased rapidly thereafter, reaching
15% at the end of the culture cycle (Figure 2-1.). The initially high CT content
corresponded with the CT level at the end of the culture cycle. As CT turnover is
considered to be slow (Kleiner et al., 1999), the decrease in CT content during the early
growth cycle was most likely from dilution, due to rapid cell proliferation with little or no
new CT synthesis. Under normal culture conditions, the L4 cell line does not accumulate
salicin or higher-order PGs.
2.3.2 Feeding of potential salicin precursors
The absence of detectable levels of PGs in the aspen cell cultures may be attributed to the
absence of possible PG precursors and/or spatiotemporal regulation of metabolic
activities at the intracellular level. To identify possible lesions in the PG biosynthetic
pathway, a collection of putative PG precursors, including salicin, the simplest PG,
salicylic acid, salicyl alcohol, salicylaldehyde, helicin, benzoic acid, benzyl alcohol,
benzylaldehyde, cinnamic acid and O-coumaric acid (Zenk, 1967) were fed to the cell
cultures. Phenolic acids were fed at 0.2 mM, since higher feeding levels led to
discoloration of cells, suggestive of toxicity, in preliminary trials. Alcohols, aldehydes,
and glucosides were fed at 1 mM. Feeding was conducted 5 days after subculturing, and
cells were harvested 24 h and 48 h after feeding for chemical analysis. Higher-order PGs
36
0
25
50
75
100
1 2 3 4 5 6 7 8 9 10 11 12 13
Days after subculture
Cell
settl
ed v
olum
e (%
)
0
4
8
12
16
Seco
ndar
y m
etab
olite
s
(% d
ry w
t)
Cell volumeCTPG
Figure 2-1. Growth and secondary metabolite levels in Populus L4 cell
suspensions grown under normal culture conditions.
Data represents the mean ± SE of three biological replicates.
37
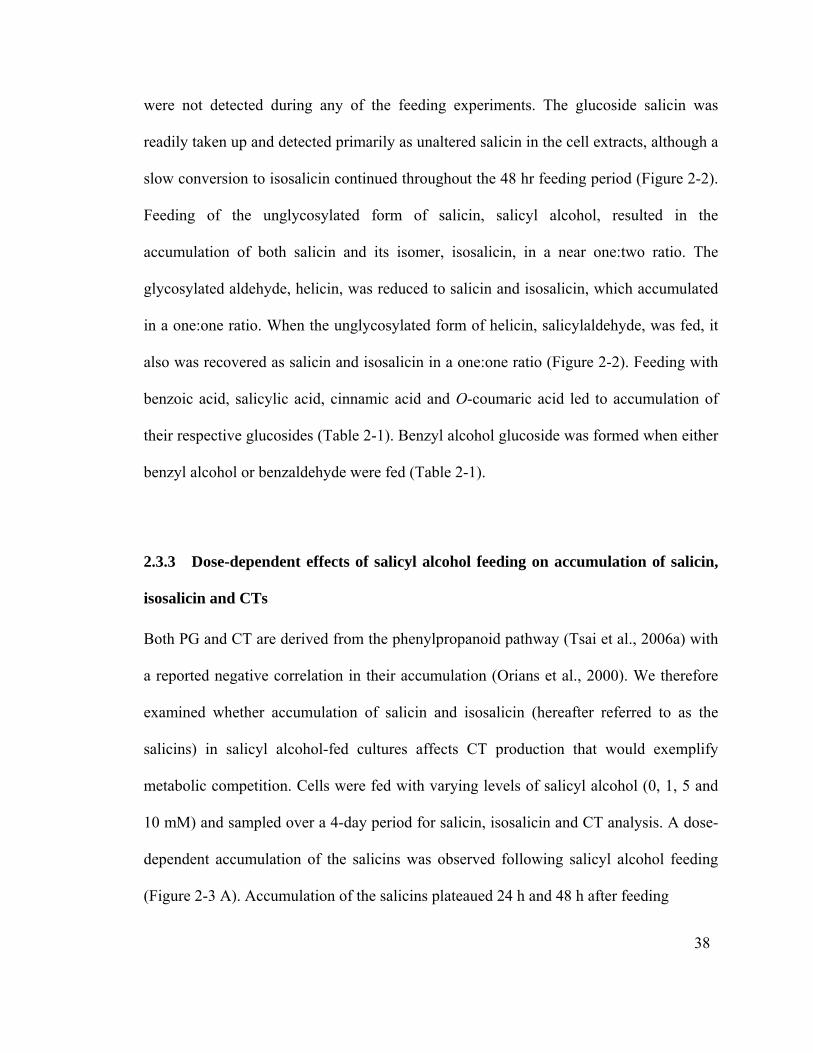
were not detected during any of the feeding experiments. The glucoside salicin was
readily taken up and detected primarily as unaltered salicin in the cell extracts, although a
slow conversion to isosalicin continued throughout the 48 hr feeding period (Figure 2-2).
Feeding of the unglycosylated form of salicin, salicyl alcohol, resulted in the
accumulation of both salicin and its isomer, isosalicin, in a near one:two ratio. The
glycosylated aldehyde, helicin, was reduced to salicin and isosalicin, which accumulated
in a one:one ratio. When the unglycosylated form of helicin, salicylaldehyde, was fed, it
also was recovered as salicin and isosalicin in a one:one ratio (Figure 2-2). Feeding with
benzoic acid, salicylic acid, cinnamic acid and O-coumaric acid led to accumulation of
their respective glucosides (Table 2-1). Benzyl alcohol glucoside was formed when either
benzyl alcohol or benzaldehyde were fed (Table 2-1).
2.3.3 Dose-dependent effects of salicyl alcohol feeding on accumulation of salicin,
isosalicin and CTs
Both PG and CT are derived from the phenylpropanoid pathway (Tsai et al., 2006a) with
a reported negative correlation in their accumulation (Orians et al., 2000). We therefore
examined whether accumulation of salicin and isosalicin (hereafter referred to as the
salicins) in salicyl alcohol-fed cultures affects CT production that would exemplify
metabolic competition. Cells were fed with varying levels of salicyl alcohol (0, 1, 5 and
10 mM) and sampled over a 4-day period for salicin, isosalicin and CT analysis. A dose-
dependent accumulation of the salicins was observed following salicyl alcohol feeding
(Figure 2-3 A). Accumulation of the salicins plateaued 24 h and 48 h after feeding
38
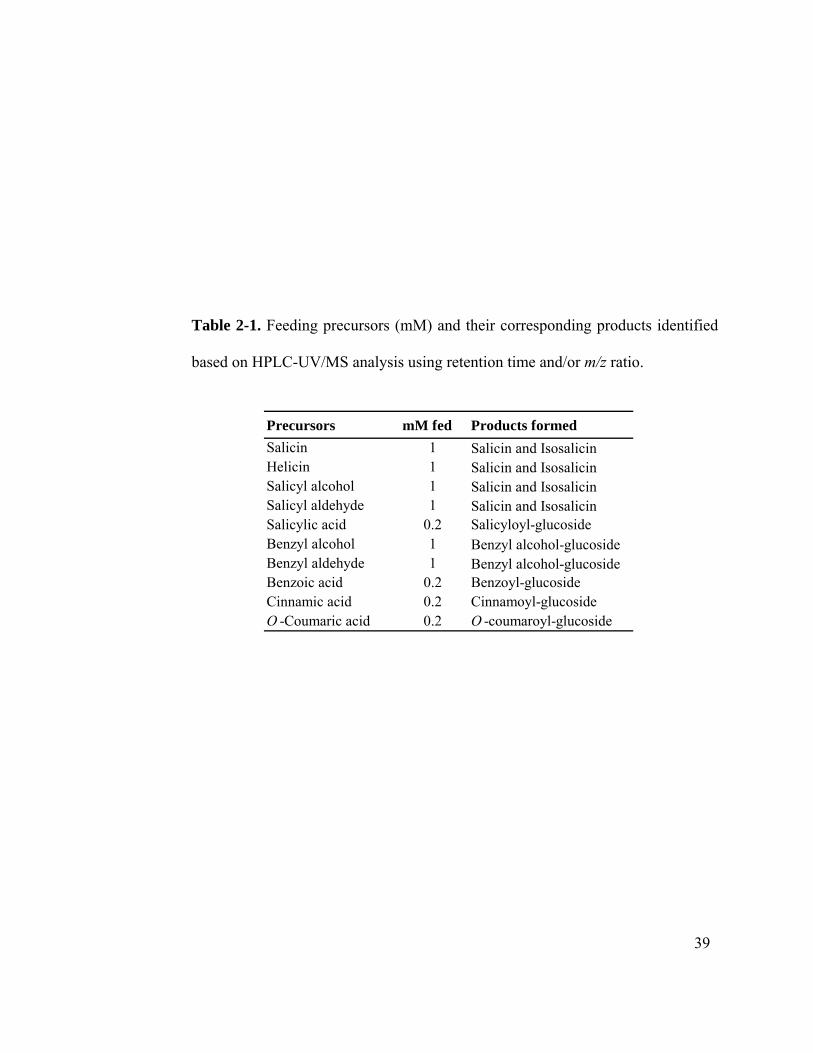
Table 2-1. Feeding precursors (mM) and their corresponding products identified
based on HPLC-UV/MS analysis using retention time and/or m/z ratio.
Precursors mM fed Products formedSalicin 1 Salicin and Isosalicin Helicin 1 Salicin and Isosalicin Salicyl alcohol 1 Salicin and Isosalicin Salicyl aldehyde 1 Salicin and Isosalicin Salicylic acid 0.2 Salicyloyl-glucoside Benzyl alcohol 1 Benzyl alcohol-glucosideBenzyl aldehyde 1 Benzyl alcohol-glucosideBenzoic acid 0.2 Benzoyl-glucosideCinnamic acid 0.2 Cinnamoyl-glucosideO -Coumaric acid 0.2 O -coumaroyl-glucoside
39
0
1
2
3
4
0 24Hours after feeding
Sal
icin
s (%
dry
wt)
48
SAL HELSAC SAD
Figure 2-2. Levels of salicin and isosalicin formed over a 48 h period in
cultures fed with 1 mM salicin (SAL), helicin (HEL), salicyl alcohol
(SAC) and salicylaldehyde (SAD).
Solid and dotted lines represent salicin and isosalicin levels, respectively.
Data represents the mean ± standard deviation of two biological replicates.
40
with 1 mM and 5 mM salicyl alcohol, respectively, but continued to increase with 10 mM
feeding over the 4-day period. The total salicins detected at the end of the experimental
period were 3, 17 and 29% in cells fed with 1, 5, and 10 mM salicyl alcohol, respectively.
The growth of the cell cultures was stimulated by 6-7% with 1mM and 9-15% with 5
mM, but reduced by 20-28% with 10 mM salicyl alcohol feeding (Figure 2-3 C). At 5
mM feeding, the efficiency of salicyl alcohol conversion at the end of the 4-day period
was at least 60%, as 175 μmoles equivalent of 5 mM salicyl alcohol was converted to 100
μmoles of salicins.
CT levels showed a dose-dependent negative response to salicyl alcohol feeding. At 1
mM, no difference was observed in CT levels as compared to unfed cultures (Figure 2-3
B), with the CT levels deceasing at 24 h (corresponding to 6 days after subculture, Figure
2-1), followed by a steady increase through the end of the 96 h period. In cultures fed
with 5 mM salicyl alcohol, CT levels did not increase until after 48 h (or 7 days after
subculture). At 10 mM, cells were no longer able to maintain the basal CT level observed
at the time of feeding. The reduction in CT levels in the cells accumulating salicins
supports a metabolic competition of salicins and CTs.
2.3.4 Effect of culture stage on levels of salicin, isosalicin and CT upon salicyl
alcohol feeding
As shown in Figure 2-1, active CT synthesis in the aspen cell suspensions typically
resumed by the mid-exponential phase, i.e. 6 days after subculturing. To examine
41
42
0
20
40
60
80
0 24 48 72 9Hours after treatment
% C
ell s
ettle
d vo
lum
e
6
0
5
10
15
20
CT (%
dry
wt)
0
5
10
15
20
Sal
icin
s (%
dry
wt) 0 1
5 10
A
B
C
0
20
40
60
80
0 24 48 72 9Hours after treatment
% C
ell s
ettle
d vo
lum
e
6
0
5
10
15
20
CT (%
dry
wt)
0
5
10
15
20
Sal
icin
s (%
dry
wt) 0 1
5 10
A
B
C
Figure 2-3. Effect of salicyl alcohol concentration (0, 1, 5, 10 mM) on (A)
salicin and isosalicin formation, (B) CT levels and growth (C) in aspen
cell cultures.
Salicyl alcohol was fed to 5-day old cultures and samples were analyzed at
regular intervals over a 96 h period. In panel A, solid and dotted lines
represent salicin and isosalicin levels, respectively. Data represents the
mean ± standard deviation of two biological replicates.
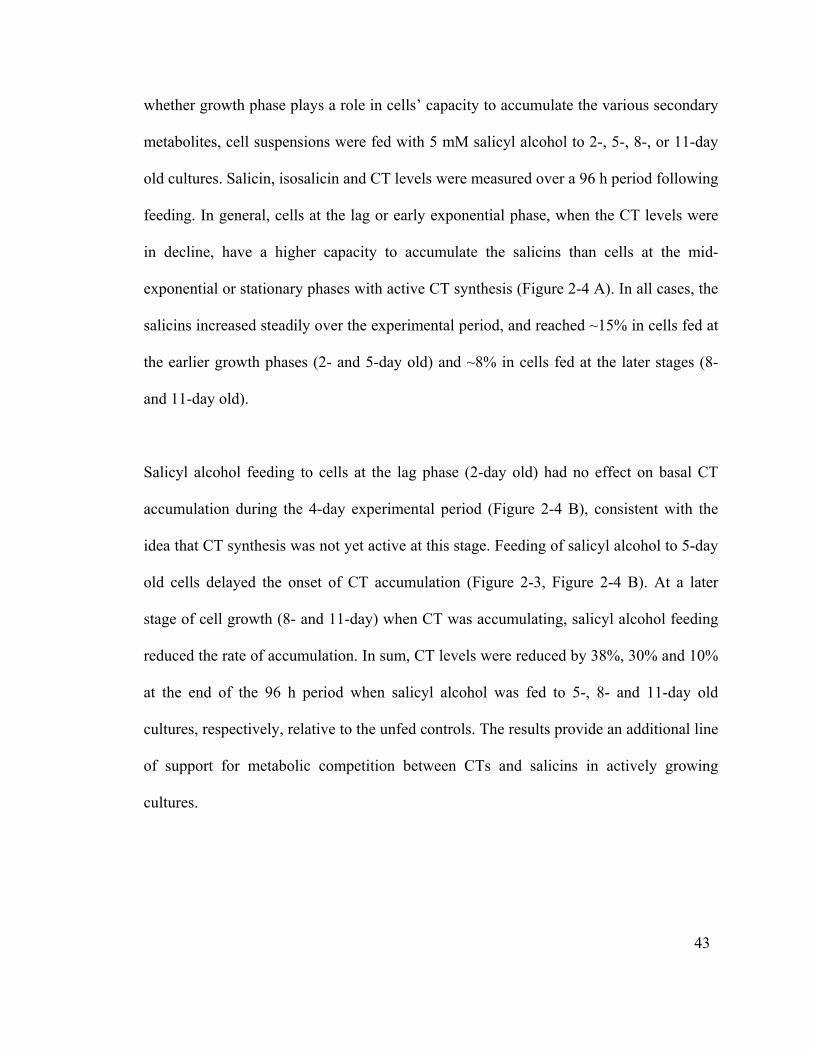
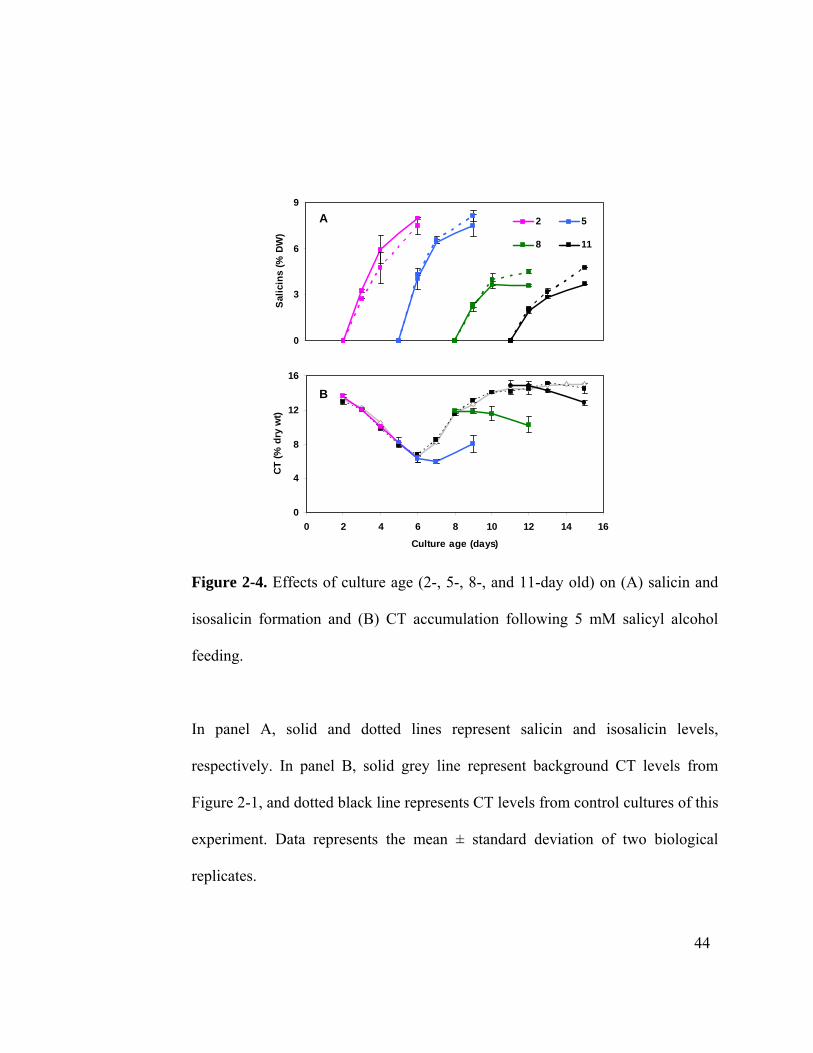
whether growth phase plays a role in cells’ capacity to accumulate the various secondary
metabolites, cell suspensions were fed with 5 mM salicyl alcohol to 2-, 5-, 8-, or 11-day
old cultures. Salicin, isosalicin and CT levels were measured over a 96 h period following
feeding. In general, cells at the lag or early exponential phase, when the CT levels were
in decline, have a higher capacity to accumulate the salicins than cells at the mid-
exponential or stationary phases with active CT synthesis (Figure 2-4 A). In all cases, the
salicins increased steadily over the experimental period, and reached ~15% in cells fed at
the earlier growth phases (2- and 5-day old) and ~8% in cells fed at the later stages (8-
and 11-day old).
Salicyl alcohol feeding to cells at the lag phase (2-day old) had no effect on basal CT
accumulation during the 4-day experimental period (Figure 2-4 B), consistent with the
idea that CT synthesis was not yet active at this stage. Feeding of salicyl alcohol to 5-day
old cells delayed the onset of CT accumulation (Figure 2-3, Figure 2-4 B). At a later
stage of cell growth (8- and 11-day) when CT was accumulating, salicyl alcohol feeding
reduced the rate of accumulation. In sum, CT levels were reduced by 38%, 30% and 10%
at the end of the 96 h period when salicyl alcohol was fed to 5-, 8- and 11-day old
cultures, respectively, relative to the unfed controls. The results provide an additional line
of support for metabolic competition between CTs and salicins in actively growing
cultures.
43
0
3
6
9
Salic
ins
(% D
W)
2 5
8 11
A
0
4
8
12
16
0 2 4 6 8 10 12 14 16
Culture age (days)
CT
(% d
ry w
t)
B
0
3
6
9
Salic
ins
(% D
W)
2 5
8 11
A
0
3
6
9
Salic
ins
(% D
W)
2 5
8 11
A
0
4
8
12
16
0 2 4 6 8 10 12 14 16
Culture age (days)
CT
(% d
ry w
t)
B
0
4
8
12
16
0 2 4 6 8 10 12 14 16
Culture age (days)
CT
(% d
ry w
t)
B
Figure 2-4. Effects of culture age (2-, 5-, 8-, and 11-day old) on (A) salicin and
isosalicin formation and (B) CT accumulation following 5 mM salicyl alcohol
feeding.
In panel A, solid and dotted lines represent salicin and isosalicin levels,
respectively. In panel B, solid grey line represent background CT levels from
Figure 2-1, and dotted black line represents CT levels from control cultures of this
experiment. Data represents the mean ± standard deviation of two biological
replicates.
44
2.3.5 Microarray analysis
The observed reciprocal regulation of salicin and CT accumulation in cell cultures
suggested that salicyl alcohol feeding affected both carbohydrate utilization and carbon
flux through the phenylpropanoid pathway. To assess the breadth of the metabolic
response, global gene expression using the 7K aspen EST array was analyzed in 5-day
old cultures, after 48 h of feeding salicyl alcohol and where growth and CT synthesis are
more active. Of the 1,812 ESTs that passed a series of quality control measures,
expression of 938 ESTs representing 884 non-redundant genes was found to be
significantly altered (with a false discovery rate p <0.05) in salicyl alcohol-fed cells
relative to the control. However, only 300 and 240 ESTs were up- and down-regulated,
respectively, by more than 1.3-fold. Stress-related transcripts, such as glutathione S
transferase (GST), peroxidase, dehydrin, thaumatin-like protein, and germin-like protein,
were among the most up-regulated genes in the salicyl alcohol-fed cells (Table 2-2). The
most highly up-regulated EST (MTU6CR.P6.H02) corresponds to a peroxidase. From our
other analyses, this gene was poorly expressed in vegetative tissues, except cell cultures,
and was greatly induced in methyl jasmonate-treated cells as well as in gypsy moth-fed
aspen leaves (Tsai et al., unpublished data). Many of the down-regulated genes were
associated with phenylpropanoid and flavonoid biosynthesis, including phenylalanine
ammonia-lyases (PAL1 and PAL2), 4-coumurate:CoA ligase, caffeoyl-CoA O-
methyltransferase, S- adenosylmethionine synthase, cinnamoyl-CoA reductase, and
chalcone isomerase. These results are in line with the reduced CT accumulation in salicyl
alcohol-treated cells.
45
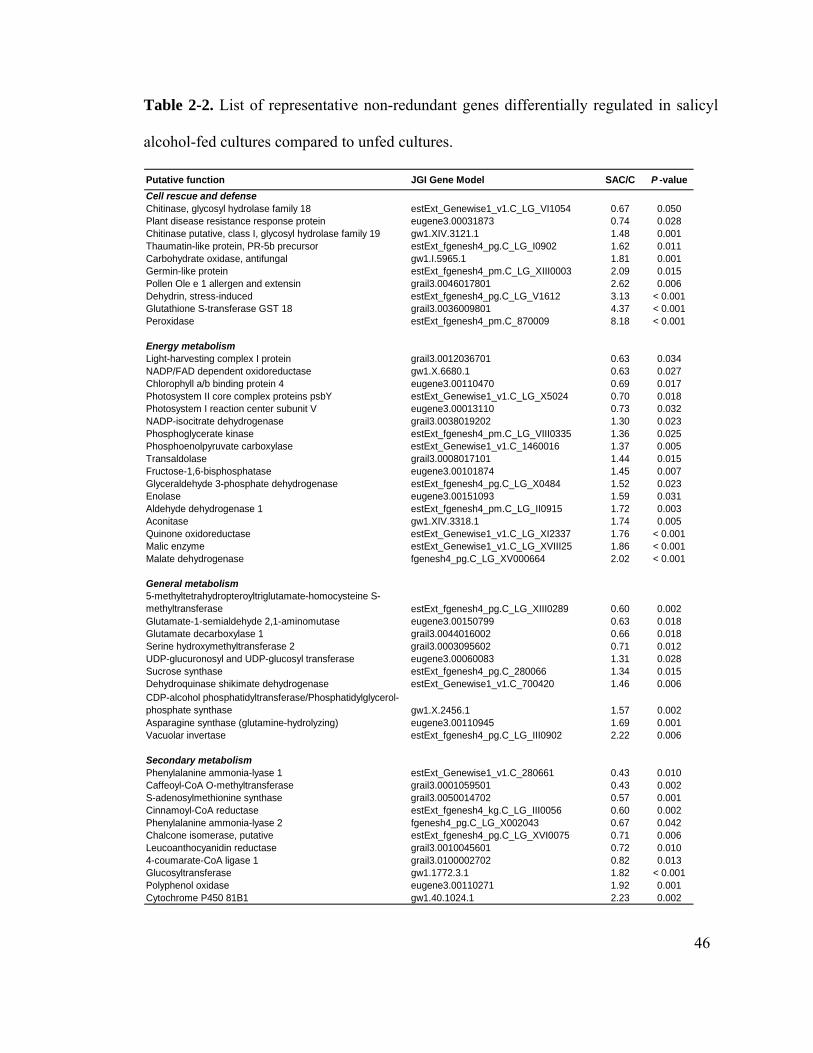
Table 2-2. List of representative non-redundant genes differentially regulated in salicyl
alcohol-fed cultures compared to unfed cultures.
Putative function JGI Gene Model SAC/C P -valueCell rescue and defenseChitinase, glycosyl hydrolase family 18 estExt_Genewise1_v1.C_LG_VI1054 0.67 0.050Plant disease resistance response protein eugene3.00031873 0.74 0.028Chitinase putative, class I, glycosyl hydrolase family 19 gw1.XIV.3121.1 1.48 0.001Thaumatin-like protein, PR-5b precursor estExt_fgenesh4_pg.C_LG_I0902 1.62 0.011Carbohydrate oxidase, antifungal gw1.I.5965.1 1.81 0.001Germin-like protein estExt_fgenesh4_pm.C_LG_XIII0003 2.09 0.015Pollen Ole e 1 allergen and extensin grail3.0046017801 2.62 0.006Dehydrin, stress-induced estExt_fgenesh4_pg.C_LG_V1612 3.13 < 0.001Glutathione S-transferase GST 18 grail3.0036009801 4.37 < 0.001Peroxidase estExt_fgenesh4_pm.C_870009 8.18 < 0.001
Energy metabolismLight-harvesting complex I protein grail3.0012036701 0.63 0.034NADP/FAD dependent oxidoreductase gw1.X.6680.1 0.63 0.027Chlorophyll a/b binding protein 4 eugene3.00110470 0.69 0.017Photosystem II core complex proteins psbY estExt_Genewise1_v1.C_LG_X5024 0.70 0.018Photosystem I reaction center subunit V eugene3.00013110 0.73 0.032NADP-isocitrate dehydrogenase grail3.0038019202 1.30 0.023Phosphoglycerate kinase estExt_fgenesh4_pm.C_LG_VIII0335 1.36 0.025Phosphoenolpyruvate carboxylase estExt_Genewise1_v1.C_1460016 1.37 0.005Transaldolase grail3.0008017101 1.44 0.015Fructose-1,6-bisphosphatase eugene3.00101874 1.45 0.007Glyceraldehyde 3-phosphate dehydrogenase estExt_fgenesh4_pg.C_LG_X0484 1.52 0.023Enolase eugene3.00151093 1.59 0.031Aldehyde dehydrogenase 1 estExt_fgenesh4_pm.C_LG_II0915 1.72 0.003Aconitase gw1.XIV.3318.1 1.74 0.005Quinone oxidoreductase estExt_Genewise1_v1.C_LG_XI2337 1.76 < 0.001Malic enzyme estExt_Genewise1_v1.C_LG_XVIII25 1.86 < 0.001Malate dehydrogenase fgenesh4_pg.C_LG_XV000664 2.02 < 0.001
General metabolism5-methyltetrahydropteroyltriglutamate-homocysteine S-methyltransferase estExt_fgenesh4_pg.C_LG_XIII0289 0.60 0.002Glutamate-1-semialdehyde 2,1-aminomutase eugene3.00150799 0.63 0.018Glutamate decarboxylase 1 grail3.0044016002 0.66 0.018Serine hydroxymethyltransferase 2 grail3.0003095602 0.71 0.012UDP-glucuronosyl and UDP-glucosyl transferase eugene3.00060083 1.31 0.028Sucrose synthase estExt_fgenesh4_pg.C_280066 1.34 0.015Dehydroquinase shikimate dehydrogenase estExt_Genewise1_v1.C_700420 1.46 0.006CDP-alcohol phosphatidyltransferase/Phosphatidylglycerol-phosphate synthase gw1.X.2456.1 1.57 0.002Asparagine synthase (glutamine-hydrolyzing) eugene3.00110945 1.69 0.001Vacuolar invertase estExt_fgenesh4_pg.C_LG_III0902 2.22 0.006
Secondary metabolismPhenylalanine ammonia-lyase 1 estExt_Genewise1_v1.C_280661 0.43 0.010Caffeoyl-CoA O-methyltransferase grail3.0001059501 0.43 0.002S-adenosylmethionine synthase grail3.0050014702 0.57 0.001Cinnamoyl-CoA reductase estExt_fgenesh4_kg.C_LG_III0056 0.60 0.002Phenylalanine ammonia-lyase 2 fgenesh4_pg.C_LG_X002043 0.67 0.042Chalcone isomerase, putative estExt_fgenesh4_pg.C_LG_XVI0075 0.71 0.006Leucoanthocyanidin reductase grail3.0010045601 0.72 0.0104-coumarate-CoA ligase 1 grail3.0100002702 0.82 0.013Glucosyltransferase gw1.1772.3.1 1.82 < 0.001Polyphenol oxidase eugene3.00110271 1.92 0.001Cytochrome P450 81B1 gw1.40.1024.1 2.23 0.002
46
General metabolism comprised the predominant functional category of the differentially
expressed genes. The expression of sucrose hydrolyzing genes such as SuSy and a
vacuolar invertase was up-regulated in salicyl alcohol-fed cultures (Table 2-2). Energy
metabolism comprised 6% of the differentially expressed genes. Several genes related to
photosynthesis that could have an unknown function in dark grown cells were down-
regulated. The expression of glycolysis pathway genes, including glyceraldehyde 3-
phosphate dehydrogenase and phosphoglycerate kinase, and of tricarboxylic acid (TCA)
cycle genes, including malate dehydrogenase, aconitase and NADP-isocitrate
dehydrogenase, were up-regulated (Table 2-2).
2.3.6 Real-time PCR analysis
QPCR was used to enable higher resolution analysis of the gene expression changes
observed in microarrays. Because of the limited coverage of the EST array, we expanded
the analysis to include many more of the genes associated with the flavonoid biosynthetic
pathway (Tsai et al., 2006a). We also included gene families associated with sucrose
transport and hydrolysis (sucrose transporters, invertase and sucrose synthase), and the
glycosylation (glycosyl transferases) and transport (multidrug-resistance associated
proteins) of simple phenolics (Bowles et al., 2005; Gachon et al., 2005; Koch, 2004; Lu
et al., 1998; Reinders et al., 2008). Data for genes with extremely low transcript levels
were not shown.
47
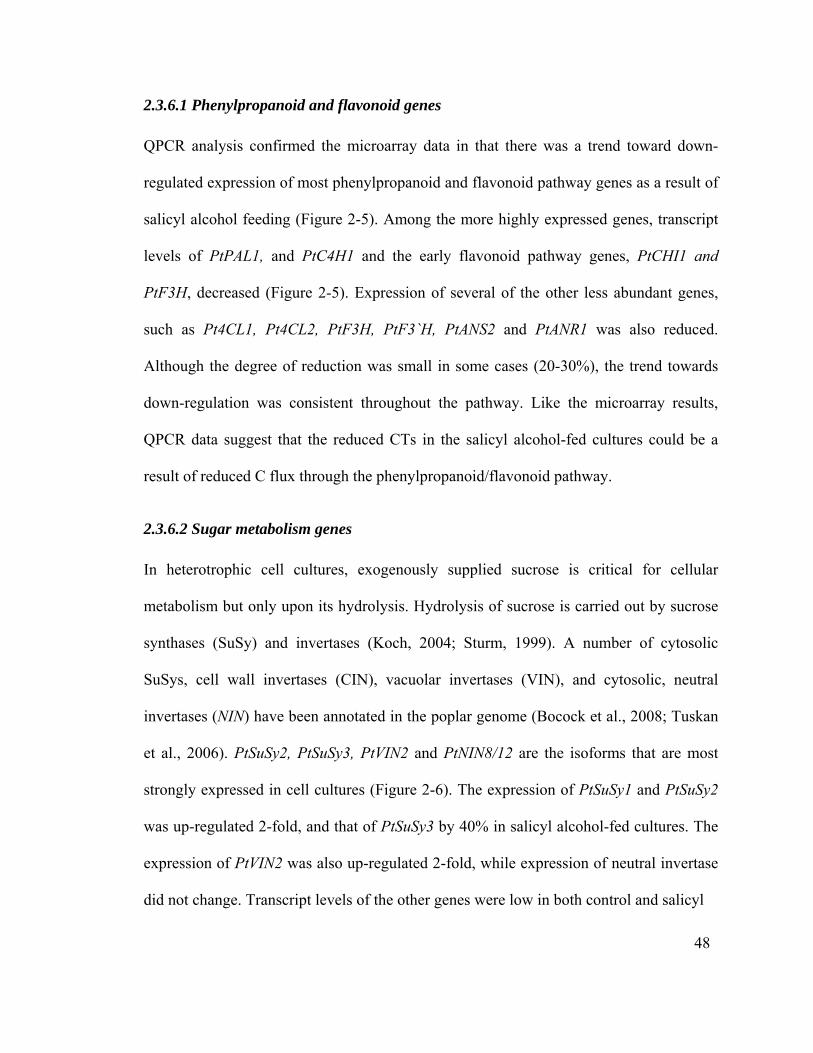
2.3.6.1 Phenylpropanoid and flavonoid genes
QPCR analysis confirmed the microarray data in that there was a trend toward down-
regulated expression of most phenylpropanoid and flavonoid pathway genes as a result of
salicyl alcohol feeding (Figure 2-5). Among the more highly expressed genes, transcript
levels of PtPAL1, and PtC4H1 and the early flavonoid pathway genes, PtCHI1 and
PtF3H, decreased (Figure 2-5). Expression of several of the other less abundant genes,
such as Pt4CL1, Pt4CL2, PtF3H, PtF3`H, PtANS2 and PtANR1 was also reduced.
Although the degree of reduction was small in some cases (20-30%), the trend towards
down-regulation was consistent throughout the pathway. Like the microarray results,
QPCR data suggest that the reduced CTs in the salicyl alcohol-fed cultures could be a
result of reduced C flux through the phenylpropanoid/flavonoid pathway.
2.3.6.2 Sugar metabolism genes
In heterotrophic cell cultures, exogenously supplied sucrose is critical for cellular
metabolism but only upon its hydrolysis. Hydrolysis of sucrose is carried out by sucrose
synthases (SuSy) and invertases (Koch, 2004; Sturm, 1999). A number of cytosolic
SuSys, cell wall invertases (CIN), vacuolar invertases (VIN), and cytosolic, neutral
invertases (NIN) have been annotated in the poplar genome (Bocock et al., 2008; Tuskan
et al., 2006). PtSuSy2, PtSuSy3, PtVIN2 and PtNIN8/12 are the isoforms that are most
strongly expressed in cell cultures (Figure 2-6). The expression of PtSuSy1 and PtSuSy2
was up-regulated 2-fold, and that of PtSuSy3 by 40% in salicyl alcohol-fed cultures. The
expression of PtVIN2 was also up-regulated 2-fold, while expression of neutral invertase
did not change. Transcript levels of the other genes were low in both control and salicyl
48
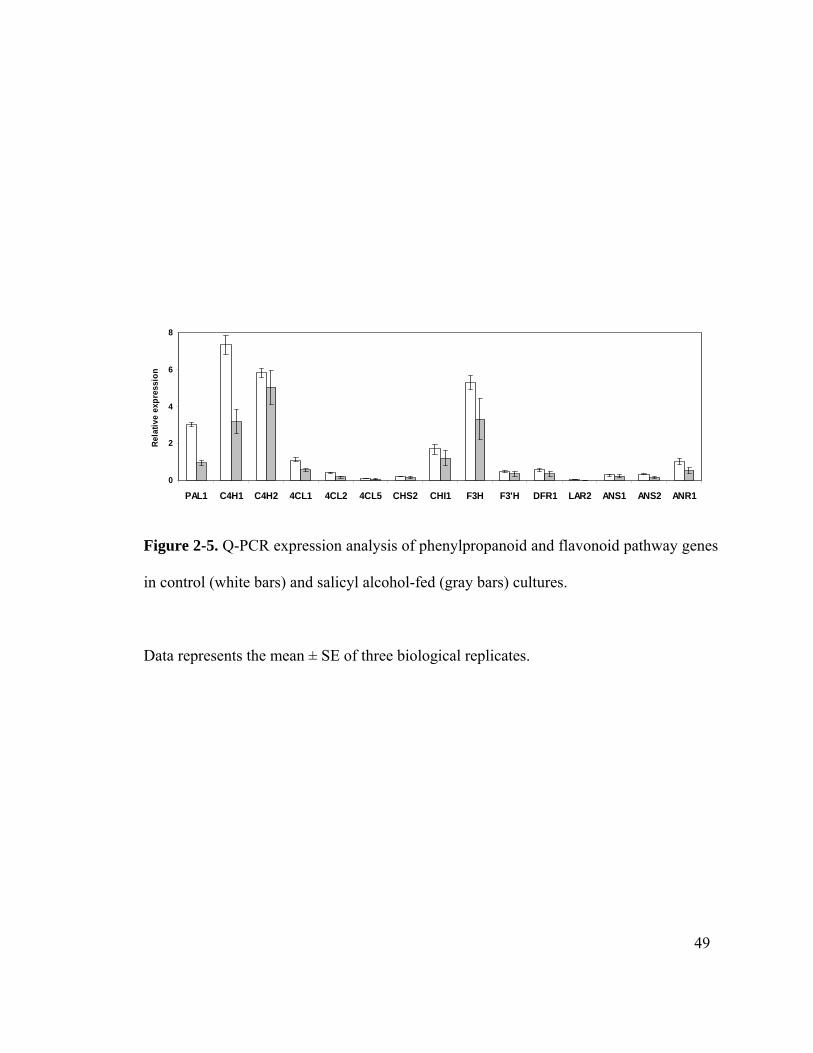
0
2
4
6
8
PAL1 C4H1 C4H2 4CL1 4CL2 4CL5 CHS2 CHI1 F3H F3'H DFR1 LAR2 ANS1 ANS2 ANR1
Rela
tive
expr
essi
on
Figure 2-5. Q-PCR expression analysis of phenylpropanoid and flavonoid pathway genes
in control (white bars) and salicyl alcohol-fed (gray bars) cultures.
Data represents the mean ± SE of three biological replicates.
49
0
2
4
6
SuSy1 SuSy2 SuSy3 VIN2 VIN3 NIN2/5 NN3/4 NIN8/12 NIN9/11 CIN4 CIN5
Rela
tive
expr
essi
on
Figure 2-6. Q-PCR expression analysis of invertase and sucrose synthase gene family
members in control (white bars) and salicyl alcohol-fed (gray bars) cultures.
Data represents the mean ± SE of three biological replicates.
50
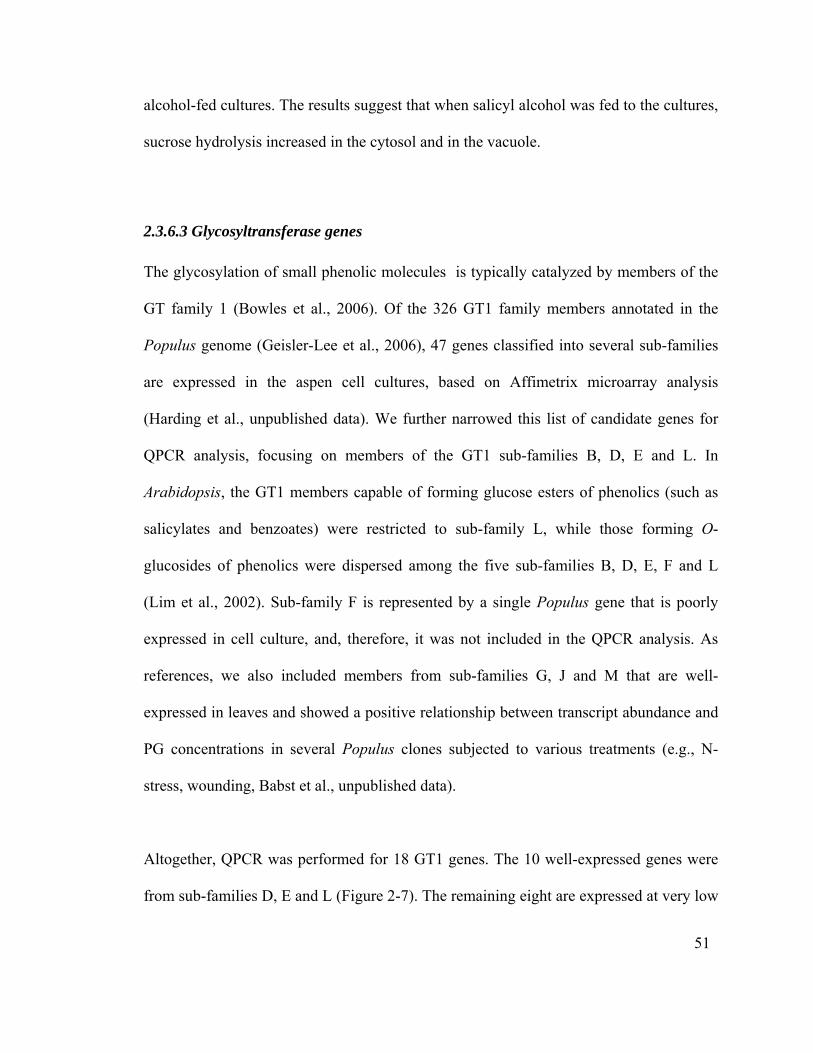
alcohol-fed cultures. The results suggest that when salicyl alcohol was fed to the cultures,
sucrose hydrolysis increased in the cytosol and in the vacuole.
2.3.6.3 Glycosyltransferase genes
The glycosylation of small phenolic molecules is typically catalyzed by members of the
GT family 1 (Bowles et al., 2006). Of the 326 GT1 family members annotated in the
Populus genome (Geisler-Lee et al., 2006), 47 genes classified into several sub-families
are expressed in the aspen cell cultures, based on Affimetrix microarray analysis
(Harding et al., unpublished data). We further narrowed this list of candidate genes for
QPCR analysis, focusing on members of the GT1 sub-families B, D, E and L. In
Arabidopsis, the GT1 members capable of forming glucose esters of phenolics (such as
salicylates and benzoates) were restricted to sub-family L, while those forming O-
glucosides of phenolics were dispersed among the five sub-families B, D, E, F and L
(Lim et al., 2002). Sub-family F is represented by a single Populus gene that is poorly
expressed in cell culture, and, therefore, it was not included in the QPCR analysis. As
references, we also included members from sub-families G, J and M that are well-
expressed in leaves and showed a positive relationship between transcript abundance and
PG concentrations in several Populus clones subjected to various treatments (e.g., N-
stress, wounding, Babst et al., unpublished data).
Altogether, QPCR was performed for 18 GT1 genes. The 10 well-expressed genes were
from sub-families D, E and L (Figure 2-7). The remaining eight are expressed at very low
51
levels. The expression of the two most abundant GTs, GT1-2 and GT1-246 from sub-
families L and E respectively, was up-regulated 2-3 fold by salicyl alcohol feeding. The
expression of eight other moderately expressed GTs increased during the feeding, with
GTs from sub-families D and E up-regulated more than 2-fold. The strong expression of
sub-family L and E members, GT1-2 and GT1-246, respectively in unfed cultures and
their inducibility by salicyl alcohol-feeding suggest their involvement in the synthesis of
salicins.
2.3.6.4 Possible phenolic transporters
Phenolics and other xenobiotics glycosylated in cytoplasm are commonly transported into
the vacuole. This is thought to be mediated by ATP-binding cassette (ABC) transporters
or H+ antiporters, depending on the compound being compartmentalized and the plant
species (Dean et al., 2005; Dean et al., 2003; Rea, 2007). Microarray expression results
showed a slight up-regulation of a Mg-ATP-dependent glutathione conjugate pump,
known as MRP transporter, in salicyl alcohol-fed cultures (supplemental data). Therefore,
we expanded our studies to the four putative tonoplast-localized and two plasma
membrane-localized MRP transporters in Populus, based on the orthologs from
Arabidopsis and maize (Kolukisaoglu et al., 2002; Rea, 2007). PtMRP1 was the most
abundant transcript and was up-regulated by 70% in salicyl alcohol-fed cultures (Figure
2-8). The expression of PtMRP4 and PtMRP6 was lower in unfed cultures, but was also
up-regulated by 2.6 and 1.8 fold, respectively. PtMRP2 and PtMRP5 are poorly
expressed and showed little change compared to control.
52
SUTs from several plant species are also capable of transporting a wide range of α- and
β-phenolic glucosides, besides sucrose, across biological membranes (Chandran et al.,
2003; Reinders et al., 2008; Sivitz et al., 2007). LeSUT4, a tonoplast-localized
transporter, has been suggested to be involved in the export of sucrose and possibly of
phenolic glucosides from vacuole into cytoplasm (Reinders et al., 2008). Additional
scenarios for how various SUTs function have been posited in review papers (Lalonde et
al., 1999; Williams et al., 2000). Therefore, we examined the expression of the six
Populus SUT gene family members in control and salicyl alcohol-fed cultures. PtSUT4
was the most abundant transcript and its expression was up-regulated ~1.5-fold in
cultures fed with salicyl alcohol (Figure 2-8). Expression of PtSUT5 was very low while
that of the remaining four SUTs was not observed in control or salicyl alcohol-fed cells.
Together, these results suggest the possible involvement of PtMRP1, PtMRP6 and
PtSUT4 in the transport of glycosides into and out of vacuole.
53
0
25
50
75
GT1
-2
GT1
-246
GT1
-262
GT1
-289
GT1
-221
GT1
-200
GT1
-292
GT1
-109
GTI
-253
GT1
-324
GT1
-258
GT1
-27
0/27
4
GT1
-225
GT1
-293
GT1
-186
GT1
-315
GT1
-188
GT1
-298
L E E E L D D J G G E G B M L L G D
Rela
tive
expr
essi
on
0
3
6
9
0
25
50
75
GT1
-2
GT1
-246
GT1
-262
GT1
-289
GT1
-221
GT1
-200
GT1
-292
GT1
-109
GTI
-253
GT1
-324
GT1
-258
GT1
-27
0/27
4
GT1
-225
GT1
-293
GT1
-186
GT1
-315
GT1
-188
GT1
-298
L E E E L D D J G G E G B M L L G D
Rela
tive
expr
essi
on
0
3
6
9
Figure 2-7. Q-PCR expression analysis of GT-1 gene family members in control
(white bars) and salicyl alcohol-fed (gray bars) cultures.
The arrow at the bottom points to the subgroup of the GTs. Data represents the
mean ± SE of three biological replicates. Refer to the right-hand side axis for
dotted bars.
54
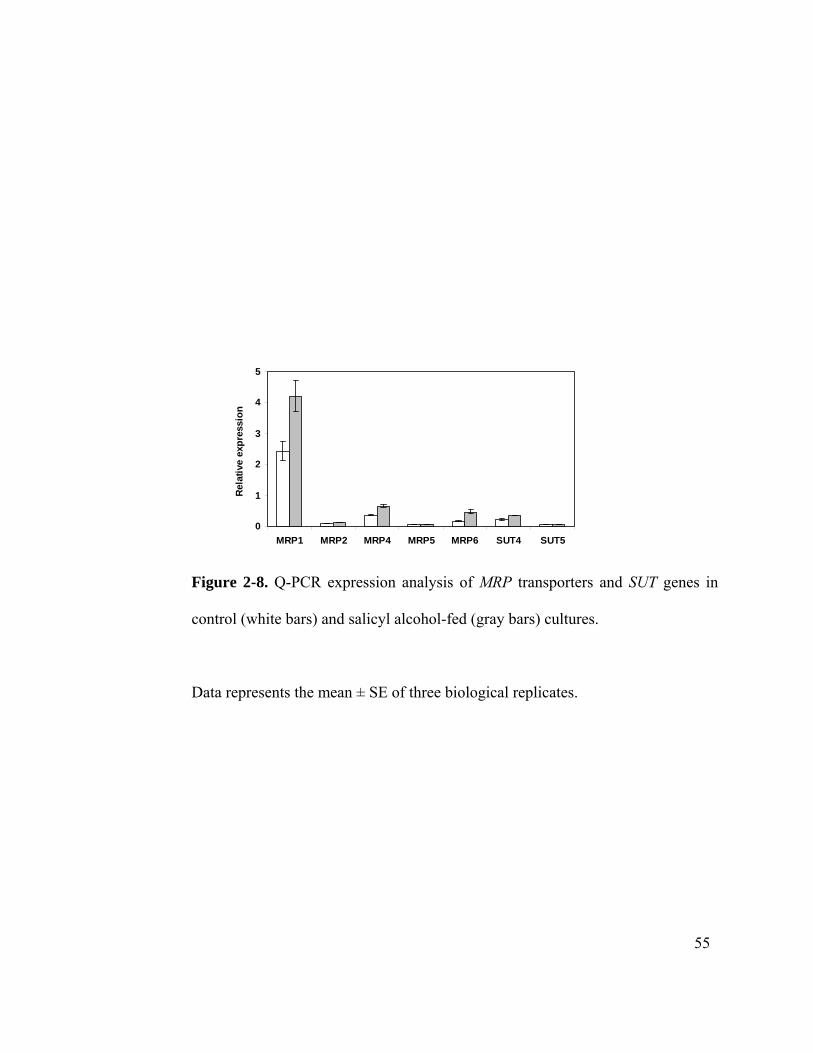
0
1
2
3
4
5
MRP1 MRP2 MRP4 MRP5 MRP6 SUT4 SUT5
Rela
tive
expr
essi
on
Figure 2-8. Q-PCR expression analysis of MRP transporters and SUT genes in
control (white bars) and salicyl alcohol-fed (gray bars) cultures.
Data represents the mean ± SE of three biological replicates.
55
2.4 Discussion
2.4.1 Salicin synthesis in cell cultures
PGs and CTs are the two major phenylpropanoid derivatives detected in abundant
quantities in Populus plants (Donaldson and Lindroth, 2007; Harding et al., 2005). Here,
we report that CTs were also abundant in cell cultures, but that salicin and higher-order
PGs were not detected (Figure 2-1). Since both CT and PG originate from different
branches of the phenylpropanoid pathway, we conducted a series of experiments in
search of a lesion in the PG biosynthetic branch. In general, phenolic precursors were all
glycosylated upon suspension cell feeding. During the feeding experiments, it was
evident that PG (salicin) precursor feeding interfered with CT biosynthesis. Several
experiments were then conducted to investigate the relationship between PG precursor
feeding, CT accrual and cell growth.
Several factors can be considered in analyzing the inability of the aspen suspension cells
to synthesize PG. In cultured suspension cells of Vanilla, PAL activity and synthesis of
phenylpropanoid derivatives were severely inhibited when grown in media supplemented
with 2,4-D, but not with naphthalene acetic acid (NAA, Funk and Brodelius, 1990). In
our study, the aspen cell cultures were also maintained in 2,4-D-containing media.
However, high levels of PAL expression (Figure 2-5) and CT accumulation (Figure 2-1)
were detected, making it unlikely that 2,4-D inhibited the phenylpropanoid pathway. It is
possible that specific branches of the phenylpropanoid pathway are differentially
regulated by 2,4-D. In Populus cell cultures, secondary metabolites such as anthocyanins
56
can be induced by feeding auxins (NAA and IAA), vitamins (riboflavin) or high levels of
sucrose (5%, Matsumoto et al., 1973; Verma et al., 2000). However, in none of these
experiments were anthocyanins induced without light, suggesting light as a key factor in
synthesis of certain secondary metabolites (Matsumoto et al., 1973; Verma et al., 2000).
In the present study, salicin or higher-order PGs were not detected in light-grown calli or
heterotrophic cell cultures, but were present in the leaves of the aspen L4 line from which
the cell cultures were initiated. It is possible that other factors needed for PG synthesis
were not optimal under the callus and cell culture conditions used. Several secondary
metabolites, such as quinolisidine alkaloid in Lupinus (Wink and Hartmann, 1980) and
trigonelline (N methyl nicotinc acid) in tobacco (Ikemeyer and Barz, 1989) are
synthesized only in phototrophic cells but not in heterotrophic cells. The shikimate
pathway upstream of phenylpropanoid metabolism is localized in the chloroplast
(Herrmann and Weaver, 1999). We reasoned that lack of plastids may hinder PG
synthesis in dark-grown cells. Efforts to establish photoautotrophic cells, however, did
not produce vigorous callus or cell suspension cultures.
Interestingly, salicin and isosalicin were detected in salicyl alcohol-, salicylaldehyde- and
helicin-fed cultures. In contrast, the feeding of benzoates or phenylpropanoid precursors
thought to be important for PG synthesis did not result in PG accumulation. Isotope
feeding of leaf tissues with PG precursors such as cinnamic acid and benzoates resulted
in salicortin labeling, and competition studies suggested that benzoic acid is an
intermediate in salicin synthesis in poplar leaves (B. babst, unpublished, Zenk, 1967).
Feeding of benzoic acid also induced accumulation of higher-order PGs in different
57
tissues of Salix (Ruuhola and Julkunen-Tiitto, 2003), confirming their importance in PG
synthesis. It is possible that downstream product formation was not observed in the aspen
cell cultures we used because the substrates fed to the cells were rapidly glycosylated and
sequestered. The compartmentalization differs between cultured cells and intact tissue
could be one of several possible contributing factors to failure of cells to make PGs, thus
making this system not convenient for higher-order PG biosynthetic pathway elucidation.
2.4.2 Metabolic competition between salicin and CTs in salicyl alcohol-fed cultures
In cell cultures, feeding of 5 mM salicyl alcohol, especially during the exponential and
stationary growth phases, led to accumulation of salicins with concomitant reduction of
CTs by up to 35% at 96 h. The fact that salicins could not accumulate to the maximum
levels following salicyl alcohol feeding to actively growing and CT-synthesizing cells,
and that these cells were no longer able to maintain the normal trajectory of CT increases,
further supports a dynamic mode of competition dictated by cell growth and metabolic
status. The reduction in CTs is unlikely because of competition for intermediates, as
salicins and CTs do not share common intermediates in cell cultures. A metabolic
competition may exist in 5 mM salicyl alcohol-fed cultures for the sugar resources
required for glycosylation of salicyl alcohol, growth and CT synthesis. The common
sugar utilized by most GTs for glycosylation is UDP-glucose (Hostel, 1981; Jones and
Vogt, 2001). In heterotrophic cells, UDP-glucose is derived from sucrose via SuSy-
mediated hydrolysis or via phosphorylation of glucose released from invertase-
hydrolyzed sucrose (Doehlert, 1990; Karnil and Aloni, 2002; Koch, 2004). Up-regulation
58
of PtVIN2 and several PtSuSy genes indicates participation of multiple sub-cellular
compartments during salicyl alcohol glycosylation. Gene expression for the Group 3
sucrose transporter PtSUT4 (see Chapter 2) was also up-regulated. Based on the proposed
model for SUT4 function (Chapter 2), orthologs of SUT4 mediate the efflux of sucrose
and other phenolic glycosides from the vacuole into the cytosol (Reinders et al., 2008).
Therefore, increased expression of PtSUT4 supports the increased efflux of sucrose from
the vacuole for SuSy-mediated hydrolysis in the cytosol. However, it is not clear that this
is the major route for the provisioning of UDP-glucose in our experiments because
PtVIN2 expression also was sharply up-regulated (Figure 2-6, Table 2-2). In salicyl
alcohol-fed cultures, several key genes involved in glycolysis and Kreb cycle pathway
are up-regulated. However, these genes may have other functions in the cells besides
involving in Kreb cycle. The hexoses not utilized for salicyl alcohol glycosylation can be
utilized as intermediates in glycolysis. The conversion of pyruvate, the end product of
glycolysis into acetyl-CoA, is the starting for Kreb cycle (Fernie et al., 2004). The
increased Kreb cycle demands increased acetyl-CoA. Acetyl-CoA is also an intermediate
in the synthesis of fatty acids and malonic acid pathway (Gueguen et al., 2000). Forty
percents of the C skeleton of CTs is derived from malonic acid (Taiz and Zeiger, 1998). It
may be possible that the C that otherwise can be used for CT synthesis is driven into
Kreb cycle, thus possibly resulting in reduced CT in salicyl alcohol-fed cultures.
The differential compartmentalization of the sugar hydrolysis might affect sugar
utilization for different pathways. The partitioning of sugars to growth is likely higher in
salicyl alcohol-fed cultures because of the observed stimulated growth at 24 h and 48
59
h after feeding 1 and 5 mM salicyl alcohol. In addition, because the fed salicyl alcohol is
toxic, substantial amount of C has to be diverted for its glycosylation. Thus, reduction in
sugars could be a possibility of reduced CTs in salicyl alcohol-fed cultures. The observed
reduced expression of phenylpropanoid and flavonoid pathway genes (Figure 2-5, Table
2-2) is also consistent with the reduced CT levels in salicyl alcohol-fed cultures. Thus,
simple resource competition could have reduced C for CT synthesis supporting the
observation that PGs and CTs show metabolic reciprocity in their abundance. Here we
show that such reciprocity is also true in cell cultures. Alternatively, in these cultures,
substantial amount of C could be diverted for the synthesis of proteins that are required
for the sequestration of salicin into vacuole as reported in Medicago cells accumulating
triterpenes after elicitation (Broeckling et al., 2005).
Normally, glycosylation is associated with sequestration or inactivation of toxins,
reaction intermediates, or hormones etc (Gachon et al., 2005; Kim et al., 2009; Kita et al.,
2000). Several of the characterized GTs show broad substrate specificity, while single
substrate specific GTs were also reported (Hostel, 1981; Lim et al., 2005; Lim et al.,
2002; Meßner et al., 2003). In this study, two conversions were observed in the feeding
experiments; glycosylation and isomerization. Glycosylation to yield multiple glucoside
isomers may be mediated by regio-specific glucosyltransferases as reported (Sato and
Hasegawa, 1971; Sato and Hasegawa, 1972). In general, the findings from the various
cell culture systems examined are consistent with our observation that isosalicin
increased in relation to salicin during the feeding period, and that the process may be
mediated by glycosyltransferases. As shown in Figure 2-7, most of the well-expressed
60
GTs were up-regulated in salicyl alcohol-fed cultures. The two most abundantly
expressed genes, GT1-246 and GT1-2, are members of sub-families E and L,
respectively. Substrate specificity differs within and among sub-family members, as two
of three sub-family E GTs of Arabidopsis glycosylate sinapyl and coniferyl alcohols
preferentially, while the third one glycosylates sinapyl and coniferyl aldehydes only (Lim
et al., 2005). In general, GTs that form esters from aglycones are restricted to sub-family
L, while those that form O-glucosides are distributed among different families, including
L and E (Lim et al., 2002). The L-family protein FaGT2 from strawberry (Fragaria X
ananassa) glycosylates phenol-carboxylic acid aglycones to form glucose esters, but not
O-glucosides (Lunkenbein et al., 2006). The two abundant and salicyl alcohol-induced
GTs, GT1-2 and GT1-246 are most likely candidates for salicin and isosalicin formation
from salicyl alcohol, although we cannot exclude the possible involvement of other
weakly expressed GTs.
After glycosylation, the glycosides are transported into the vacuole for storage (Dean et
al., 2005; Dean et al., 2003; Rea, 2007). It has been recently reported that these
glycosides can be exported from the vacuole in response to defense signals (Farag et al.,
2008; Naoumkina et al., 2007; Rea, 2007). An ABC transporter in cell cultures of
soybean, and a H+ antiporter in tobacco are involved in the uptake of salicylate
glucosides (Dean et al., 2005; Dean et al., 2003). A sub-group of tonoplast-localized
ABC transporters in Arabidopsis, AtMRP1 and AtMRP2 (multidrug resistance proteins),
are also capable of transporting xenobiotics, herbicides and anthocyanins into the vacuole
(Lu et al., 1998; Lu et al., 1997). As mentioned earlier, orthologs of PtSUT4 are also
61
capable of transporting salicin (Reinders et al., 2008). The up-regulation of putative
tonoplast localized MRP transporters, PtMRP1 and PtMRP6 suggests their involvement
in the uptake of salicins from cytoplasm into vacuole. Salicin uptake was also shown to
be mediated by SUTs (Reinders et al., 2008). The up-regulation of PtSUT4 in salicyl
alcohol-fed cultures supported its involvement in the transport of salicins from vacuole
into cytoplasm, as an alternative function, presumably for transglucosylation i.e.
conversion of salicin to isosalicin which occur in cytoplasm. However, involvement of
unidentified H+ transporters cannot be ruled out.
Our cell culture studies provided additional information related to PG-CT metabolic
reciprocity. Additional work such as gene silencing is needed to confirm the involvement
of our predicted genes in salicin and isosalicin synthesis and transport. Our gene
expression studies were limited only to one salicyl alcohol feeding condition. A better
understanding of the class or classes of GTs involved in salicin formation and of the
transporters involved in uptake of salicins may be achieved by using different levels of
salicyl alcohol, alternative time points or other aglycones such as salicylaldehyde.
62
Chapter 3 Sucrose transporter (SUT) gene family in Populus
and PtSUT4-mediated regulation of non-structural
carbohydrates and phenylpropanoids
ABSTRACT
Sucrose is the most abundant sugar found in the transport stream of Populus. In this and
several closely related temperate tree taxa, the mechanism of sucrose loading into the
phloem is thought to be passive symplastic, and to be facilitated by sucrose transporters
(SUT). In addition to their function in sucrose transport, certain SUT proteins transport
phenylpropanoid-glycosides, at least one of which comprises an important carbon sink in
Populus. The objective of this study was to characterize the Populus SUT gene family
and to investigate the effect of SUT suppression on carbohydrate and secondary
metabolite homeostasis in transgenic Populus. Six SUTs are found in the Populus
genome and they can be classified into three groups based on phylogenetic analysis. The
expression of Group-1 members PtSUT1/2 and PtSUT3 is restricted to vascular tissues in
leaves and stems. PtSUT4 (Group-3) and PtSUT5 (Group-2) are the most abundantly
expressed isoforms, and their transcripts were found in all tissues examined. PtSUT3,
PtSUT4 and PtSUT5 encode functional transporters based on yeast complementation
experiments. To investigate SUT function in planta, transgenic poplar plants with
suppressed SUT4 expression were produced and grown under two regimes of N nutrition.
SUT4 was chosen because of its abundant expression in all the tissues and because of its
correlation with PGs under N stress in the preliminary studies. Transgenic plants
exhibited higher ratios of leaf area-to-plant height and leaf area-to-stem mass than
63
wildtype plants whether grown under N-replete or low N nutrient conditions. Sucrose and
glucose levels were higher in source leaves of SUT4 transgenics, regardless of N
treatment. Foliar starch accrual was not affected by SUT4 suppression during N-replete
growth. However, the foliar starch increase caused by N-deficiency in wildtype plants did
not occur in SUT4 transgenics. Phenolic glycoside (PG) levels were reduced in leaves and
primary stems of SUT4 plants. Under N deficiency, PGs decreased in wildtype, but not in
SUT4 plants. Sucrose synthase (SuSy) gene expression was reduced in source leaves of
SUT4 transformants. Plant-wide, the expression of SuSy and invertase genes was slightly
elevated in stems and roots, but slightly suppressed in leaves of SUT4 transgenics. The
plant-wide distribution of phenylalanine ammonia-lyase gene transcripts was also
affected by SUT4 down-regulation. In Populus it appeared that PtSUT4 at least partly
regulates N-dependent C partitioning between sugars and phenylpropanoids.
3.1 Introduction
Sucrose is the predominant transport form of photoassimilate in many herbaceous annual,
including Arabidopsis (Arabidopsis thaliana) and tobacco (Nicotiana tobaccum), and
woody perennial (e.g., Populus) species (Haritatos et al., 2000; Konishi et al., 2004).
Sucrose synthesized in the cytoplasm from Calvin cycle triose phosphates is stored in the
vacuole or is exported to sink organs via the phloem (Buchanan et al., 2000). Transport
sucrose is actively loaded into the phloem apoplastically as in Arabidopsis (Gottwald et
al., 2000), or moves there symplastically via plasmodesmata (Lalonde et al., 1999;
Turgeon, 2000). In the close Populus relative, Salix, and many other temperate tree taxa,
64
symplastic transfer to phloem is not thought to involve polymer trapping as in the
cucurbits (Turgeon, 2006; Turgeon and Medville, 1998). In passive symplastic
transporters, the mechanism regulating sucrose movement into the phloem is not well
understood but may partly be regulated by the distribution of sucrose between vacuole
and mesophyll (Turgeon and Medville, 1998). Plasmolytic studies indicated that an
apoplastic component may contribute to sucrose transport in Populus (Russin and Evert,
1985), but in Salix at least, there is no evidence for apoplastic phloem loading (Turgeon
and Medville, 1998).
Sucrose transporter proteins (SUT/SUCs) that facilitate phloem-loading, long-distance
transport and intracellular compartmentalization have been characterized from a number
of model plant systems, including Arabidopsis (Sivitz et al., 2007; Srivastava et al.,
2008), rice (Oryza sativa, Aoki et al., 2003) and tomato (Lycopersicum esculentum,
Hackel et al., 2006). Multiple SUT/SUC genes encoding functional proteins with distinct
properties are generally expressed in each species (ArabidopsisGenomeInitiative, 2000;
Turgeon, 2006; Yu et al., 2002). Based on sequence phylogeny, the known SUT/SUCs
fall into three groups (Kuhn, 2003; Reinders et al., 2008; Sivitz et al., 2007). In general,
the transporters in Group-1 (e.g., AtSUC1, AtSUC2, AtSUC9) exhibit a high affinity
(low Km) for sucrose (Chandran et al., 2003; Sivitz et al., 2007). Several Group-1
proteins (AtSUC2, LeSUT1, NtSUT1, StSUT1) have been localized at the plasma
membrane of phloem companion cells in leaves and stems (Schmitt et al., 2008; Stadler
and Sauer, 1996). Group-2 transporters (e.g., AtSUC3, PmSUC3 and HvSUT1) generally
exhibit a moderate affinity for sucrose (Barth et al., 2003; Schulze et al., 2000; Sivitz
65
et al., 2005). Several Group-2 transporters have been localized at the plasma membrane
of phloem sieve elements. The Group-3 transporters, e.g., LjSUT4, StSUT4 and AtSUC4,
also exhibit low affinity for sucrose (Reinders et al., 2008; Weise et al., 2000). Members
of this group are localized at the tonoplast (AtSUC4, HvSUT2 and LjSUT4) of leaf
mesophyll cells and roots (Endler et al., 2006; Reinders et al., 2008) or at the plasma
membrane (StSUT4, Chincinska et al., 2008). An exception to the general patterns of
sucrose affinity described above was observed in grape (Vitis vinefera), where Group-1
transporters exhibited a lower affinity (Km 8.0-10.5 mM) for sucrose than Group-2 and
Group-3 transporters (Km 0.9-1.4 mM, Manning et al., 2001; Zhang et al., 2008). SUTs
from all three groups exhibit in vitro transport activity for maltose, various α- and β-
phenyl glucosides, salicin and helicin at rates similar to that of sucrose (Reinders et al.,
2008; Sivitz et al., 2007; Sivitz et al., 2005).
Gene silencing has been used to understand the function of various SUT/SUCs. On the
basis of high sugar/starch accumulation in source leaves of mutant or SUT-suppressed
lines, Group-1 transporters (AtSUC2, NtSUT1, LeSUT1 and StSUT1) are confirmed to
play a central role in active phloem loading of sucrose (Burkle et al., 1998; Gottwald et
al., 2000; Hackel et al., 2006; Riesmeier et al., 1994; Srivastava et al., 2008). So far, gene
silencing has been tested on only one Group-3 transporter, a plasma membrane-localized
StSUT4 in potato (Solanum tuberosum). The diurnal pattern of sugar accumulation and
export was altered in source leaves of the silenced plants. Those plants also displayed
early flowering, increased tuber yield, and reduced expression of gibberellic acid and
66
ethylene biosynthetic genes (Chincinska et al., 2008). To date, no mutant or transgenic
manipulation studies have been reported for the tonoplast-localized SUTs.
In addition to direct effects on sugar metabolism, altered SUT expression has been
reported to affect phenylpropanoid metabolism. Secondary metabolites such as
anthocyanins accumulate abnormally in source leaves of AtSUC2 mutants and StSUT1
antisense lines (Gottwald et al., 2000; Riesmeier et al., 1994; Srivastava et al., 2008).
Microarray analysis of the AtSUC2 mutants revealed a several-fold up-regulation of
phenylpropanoid and flavonoid pathway genes, consistent with the increased anthocyanin
levels (Lloyd and Zakhleniuk, 2004; Riesmeier et al., 1994). Anthocyanins accumulate in
hypocotyls and cotyledons to higher levels when Arabidopsis is fed sucrose and maltose
than when the sucrose analog turanose is fed (Solfanelli et al., 2006; Teng et al., 2005).
Anthocyanins do not accumulate when the sucrose analog palatinose is fed (Solfanelli et
al., 2006; Teng et al., 2005). In accordance with a role for SUT in the response, SUT
proteins do not transport palatinose (Chandran et al., 2003; Sivitz et al., 2007).
Anthocyanins also do not accumulate when AtSUC1 mutants are grown on sucrose media
which again supports the involvement of SUT for anthocyanin accumulation (Reinders et
al., 2008). Either sucrose or maltose feeding can induce the expression of defense related
genes such as hydroxyproline-rich glycoprotein (HRGP) in soybean, and the induction is
suppressed when p-chloromercuribenzene sulfonate (PCMBS) is used to inhibit transport
(Ahn and Lee, 2003).
67
SUT/SUC may affect secondary metabolism directly via their affinity for glycosylated
secondary metabolites such as salicin (Chandran et al., 2003; Reinders et al., 2008), or
indirectly via participation in sugar transport (Sauer, 2007). Whereas high levels of
secondary metabolites can be induced in herbaceous model species, they are
constitutively abundant in leaves of Populus, Salix and other woody perennials (Lindroth
et al., 1987a; Orians et al., 2000; Ruuhola et al., 2001). The phenolic glycosides (PGs)
characteristic of these taxa are thought to be derived from salicin, a putative SUT
substrate (Chandran et al., 2003; Pierpoint, 1994; Reinders et al., 2008; Ruuhola and
Julkunen-Tiitto, 2003). PG concentrations exceeding 25% leaf dry weight are not
uncommon in aspen and cottonwood (Donaldson and Lindroth, 2007; Harding et al.,
2005; Lindroth and Hwang, 1996). Based on 14CO2 tracer studies in Populus, 30% of
photoassimilate are rapidly partitioned into non-structural phenylpropanoids, including
PGs and anthocyanidin-derived condensed tannins (CTs, Kleiner et al., 1999).
Concentrations of these non-structural phenylpropanoids are also known to vary
substantially during the growing season and in response to soil nutrient availability and
atmospheric CO2 (Hakulinen et al., 1995; Kleiner et al., 1998; Lindroth et al., 1987b;
McDonald et al., 1999; Stevens et al., 2007). Here we characterize the PtSUT gene family
and investigate its importance to the interface between carbohydrate and secondary
metabolism in Populus.
68
3.2 Materials and Methods
3.2.1 Plant materials
Populus tremula × Populus alba clone 717-1B4 was used in this study unless otherwise
mentioned. In vitro micropropagated plants were hardened in a mist chamber and
transferred to either soil or hydroponics tubs. Pot fertilization and hydroponic nutrient
composition were as reported previously (Harding et al., 2005). The first fully unfurled
leaf 2 cm in length was considered leaf plastocron index 0 (LPI-0, Larson and Isebrands,
1971). The following tissues were analyzed: shoot tip (ST, apical to LPI-0); young leaf
(YL, LPI-2); mature leaf (ML, LPI5); primary stem (PS, stem internodes 0-3); secondary
stem (SS, stem internodes 7-9); root (RT, the distal-most 6-8 cm of rapidly elongating
primary roots excluding the 1-cm tip/cap); developing phloem (PH) and xylem (XY)
were collected from stem internodes 10-15. Male and female catkins and pollen were
collected from field grown flowering P. tremuloides trees. Tissues were snap-frozen in
liquid nitrogen and stored at -80oC until use.
3.2.2 Gene and protein sequence analysis
SUT gene models were identified from the sequenced Populus trichocarpa genome
(Tuskan et al., 2006) by BlastP with published SUT proteins. Best predicted models were
chosen by manually examining all available computational gene model predictions at
each locus in the JGI Populus trichocarpa genome portal v1.1. The primary structure
analysis of SUT proteins was carried out using the Expasy proteomic server
(http://us.expasy.org/). Multiple sequence alignment and similarity calculation were 69
performed using the GCG (Genetics Computer Group, Madison, WI) software.
Phylogenetic analysis of protein sequences was performed with MEGA package v3.1
(Kumar et al., 2004) using the minimum-evolution algorithm. Rooted trees were
generated from the bootstrap test with 1,000 replicates, using the Poisson correction
(homogenous patterns) and the complete deletion option for handling alignment gaps.
3.2.3 Quantitative dual target PCR
PtSUT1/2 gene copy number was estimated using QD-PCR (Kihara et al., 2006) in a 10
µl reaction containing the following: 20 ng of genomic DNA, 0.35 U of RedTaq
polymerase (Sigma), 100 µM dNTPs, and 0.5 µM primers. The primers used in this study
were designed using the PrimerQuest online primer design tool (http://www.idtdna.com)
and are listed in Appendix A. Known single-copy genes in the Populus geneome,
PtSUT3, PtC4HL1, were chosen as the reference genes. Primers of reference and target
genes were designed such that the GC content (50%) and Tm (60 oC) values are similar.
To minimize effects of amplicon size on band intensity estimation, two target gene
(PtSUT1/2) and reference gene (PtSUT3, PtC4HL) primer sets were used. The target gene
primers were designed to amplify ~500 bp and the reference gene primers, PtSUT3, 420
bp, and PtC4HL1, 680 bp.
3.2.4 RNA extraction
RNA was extracted from frozen tissues using the CTAB (cetyltrimethylammonium
bromide) method (Chang et al., 1993). To the finely ground sample, 1 ml of CTAB
70
buffer containing 2% β-mercaptoethanol was added, vortexed for 1 min and incubated for
15 min at 65 ºC with intermittent mixing. To this tube, 900 μl of chloroform:isoamyl
alcohol (24:1) were added, vortexed and centrifuged for 10 min at 10,000 g to separate
the two phases. RNA in the aqueous phase was precipitated using 330 μl of 8M LiCl. The
samples were incubated on ice for 2 hours and centrifuged at 4 ºC for 15 min at 14,000 g.
The remaining steps for RNA extraction were performed as described in Chapter 2.
3.2.5 cDNA synthesis and Q-PCR expression analysis
cDNA synthesis and Q-PCR were performed as described in Chapter 2.
3.2.6 Yeast complementation
Functional analysis of the Populus SUTs was carried out by yeast complementation
experiments using the SUSY7/ura3 mutant strain (Riesmeier et al., 1992; Weise et al.,
2000). Full-length coding sequences of PtSUT3, PtSUT4 and PtSUT5 was cloned into the
yeast shuttle vector PDR196 (Rentsch et al., 1995), between the plasma membrane H+-
ATPase (PMA1) promoter and the alcohol dehydrogenase (ADH) terminator. The
resultant plasmids were transformed into the SUSY7/ura3 strain using the lithium acetate
method (Gietz and Woods, 2002). Transformants were selected on uracil-deficient
medium and screened by PCR using a combination of gene-specific and vector primers.
The transformed and untransformed mutants were cultured on yeast media (1.7 gm l-1
yeast nitrogen base without amino acids and 500 mg l-1 ammonium sulfate) supplemented
with either 2% glucose or 2% sucrose as the sole carbon source for 3 days.
71
3.2.7 RNAi construct development and plant transformation
A 200 bp SUT4 fragment amplified from the 3`- region of the Populus cDNA was ligated
to an Xcm1 digested pGFPm-T vector (Luo et al., 2008) and transformed into TOP10
competent Escherichia coli cells. Subcloning of the SUT4 fragment and development of
an inverted repeat in the pGSA1285 (www.chromdb.org) binary vector backbone was
performed as described previously (Luo et al., 2008). The binary vector was transformed
into Agrobacterium strain C58-pMP90 using the freeze and thaw method (Holsters et al.,
1978). Transformed colonies were selected on LB media supplemented with
chloramphenicol (170 mg l-1), and were PCR confirmed. Positive Agrobacterium strain
was used to transform Populus leaf pieces by co-cultivation as previously described (Ma
et al., 2004). Transformed plants were selected from kanamycin (100 mg l-1) media and
confirmed by PCR using a combination of gene-specific and pGSA1285 vector primers.
Fully rooted wildtype and SUT4 transgenic plants were moved from culture boxes to the
mist chamber in a greenhouse for acclimation.
3.2.8 Hydroponic nitrogen treatment studies
Hydroponically-grown, untransformed and SUT4 transformed plants (~15 cm in height)
were distributed into small, 10-L hydroponics tubs 8 days before nutrient treatments
began. After the 8-day acclimation period, the plants were maintained either with full-
strength (2.5 mM N, referred to as N-replete) or with 5% of full strength N (0.125 mM N,
referred to as low-N or stressed). For each treatment, 7-10 individual plants were used.
Nutrient treatments were continued for 2 weeks before the plants were harvested.
72
Nutrients were changed every 2 days to maintain the N treatment levels.
3.2.9 Sugar and starch extraction and quantification
Sucrose, glucose and fructose were estimated as described (Sherma and Zulick, 1996).
Briefly, 20 mg of freeze-dried tissue sample was extracted three times in 800 µl of 80%
methanol at 95oC. The supernatants were combined for fructose, glucose and sucrose
estimation and the pellet was saved for starch analysis. The three sugars were resolved by
HPTLC with a Linomat5 applicator (Camag, Muttenz, Switzerland). Methanol extract (2
µl) was loaded onto HPTLC Merck silica gel 60 F254 plates (Fisher, Hanover Park, IL)
impregnated with 0.10 M sodium bisulfate and 10 mM citrate buffer (pH 4.8). The plates
were developed three times with the mobile phase acetonitrile:H2O (85:15) in a
horizontal TLC plate developing chamber equilibrated for 10 min. After the third
development, plates were sprayed with 1-naphthol-sulfuric acid reagent (180 mM 1-
napthol dissolved in 75% ethanol containing 10% sulfuric acid) and heated for 10 min at
100-110°C. The sugars were quantified by scanning the plate at 515 nm using a
CAMAG™ TLC scanner. Peak areas were integrated using WINCATS™ software
(Camag) and sucrose, glucose and fructose were quantified using authentic standards.
Starch was estimated by an enzymatic method (Chow and Landhausser, 2004; Fox et al.,
2001). The pellet was dispersed into 720 µl of 0.1 N NaOH and incubated at 50°C for 30
min with intermittent mixing. The suspension was neutralized with 800 µl of 0.1 N acetic
acid, and starch was digested by adding 1 U each of α-amylase (from Aspergillus oryzae,
73
Sigma chemicals, St Louis, MO) and amyloglucosidase (from Aspergillus niger, Sigma)
in 180 µl of 0.05 M sodium acetate buffer (pH 5.1) and incubated for 24 h at 50°C. Equal
volumes of enzyme digest and 33 mM p-hydroxy benzoic acid hydrazite solution in
alkaline dilutent (0.5 M trisodium citrate, 0.1 M calcium chloride and 0.5 M sodium
hydroxide) were combined, boiled for 4 min, cooled on ice for 4 min and absorbance
measured at 415 nm. Starch was then estimated based on the standard curve developed
using glucose.
3.2.10 PG and CT extraction and quantification
Freeze-dried samples were analyzed for PG and CT as described (Harding et al., 2005)
with slight modifications. Briefly, 5 mg of freeze dried tissue was extracted in 500 µl of
cold methanol (4oC-10oC) for 20 min in an ultrasonic bath and centrifuged at 15,000 g for
5 min. For PG quantification, 2 µl of the methanol extract was loaded onto Merck silica
gel 60 F254 silica plates (Fisher) and developed in ethyl acetate:methanol:water
(77:13:10, v/v, Meier et al., 1987). The plates were scanned at a wavelength of 270 nm
using a CAMAG™ TLC scanner (Camag). Peak areas were integrated using
WINCATS™ software (Camag) and PGs quantified using authentic salicin, salicortin and
tremulacin standards (provided by Rick Lindroth, Univ. of Wisconsin, Madison). Soluble
and insoluble CTs were extracted and quantified as described in Chapter 2. Total CT
levels were based on estimates of soluble and insoluble CTs.
74
3.3 Results
3.3.1 The Populus SUT gene family
Six PtSUT gene sequences were identified in the P. trichocarpa genome (Tuskan et al.,
2006). While PtSUT3, PtSUT4, PtSUT5 and PtSUT6 are located on linkage groups (LG)
19, 2, 8 and 10, respectively, PtSUT1 and PtSUT2 are located on scaffolds that have not
been assembled to any chromosome (Table 3-1). There is a large gap in the P.
trichocarpa SUT2 sequence upstream of the stop codon, but the rest of the coding region
sequence is nearly identical to that of PtSUT1 (99% identity at the nucleotide and amino
acid levels). We estimated the copy number of PtSUT1/2 in the Populus genome by
quantitative dual-target PCR (Kihara et al., 2006). As shown in Figure 3-1, the amplified
band of the target gene(s), PtSUT1/2, was more intense than those of the single-copy
reference genes, PtSUT3 and cinnamate 4-hydroxylase-like (PtC4HL, Tsai et al., 2006a).
To determine whether distinct PtSUT1 and PtSUT2 genes exist, a 1kb genome fragment
near the 3` region of PtSUT1 and PtSUT2 sequence was amplified from P.tremula × P.
alba using a primer pair designed to amplify both PtSUT1 and PtSUT2, and the products
were cloned and sequenced. Figure 3-2 shows sequence alignment of the 1kb-fragments
for PtSUT1 and PtSUT2 from P. trichocarpa and PtSUT1x and PtSUT1y from P. tremula
× P. alba. Of the 18 clones sequenced, PtSUT1x was represented in 14 and PtSUT1y in 4
clones. Because of the observed sequence differences between PtSUT1x and PtSUTy, the
presence of two highly identical genes, PtSUT1 and PtSUT2 in the Populus genome is
supported.
75
Sequence and gene structure analyses revealed that the six PtSUT genes belong to three
distinct groups. PtSUT1/2 and PtSUT3 are highly similar to each other, exhibiting 90%
identity at the nucleotide level and 92% similarity at the amino acid level (Table 3-2).
They also share a conserved gene structure, with 3 exons and 4 introns each (Figure 3-3).
PtSUT4, shares 55-63% similarity with the other SUT isoforms at the coding sequence
and amino acid levels, and contains 5 exons. PtSUT5 and PtSUT6 are highly similar to
each other (91% nucleotide identity and 93% amino acid similarity, Table 3-2). They
each contain 14 exons, and their predicted polypeptides are relatively large, ~65 KDa
versus 55-57 KDa for the other SUT proteins. In sharp contrast to the other PtSUT
isoforms which have theoretical pI’s >9.0, PtSUT5 and PtSUT6 have acidic theoretical
pI’s of 6.0-6.2. The 12 transmembrane domains characteristic of SUT/SUCs (Sauer,
2007) are predicted for all six PtSUTs.
3.3.2 Phylogenetic analysis of SUT proteins
Phylogenetic analysis of SUT proteins from several plant species was carried out using
SpSUT from Schizosaccharomyces pombe (Reinders and Ward, 2001) as the outgroup.
As shown in Figure 3-4, plant SUTs formed three distinct groups. Group-1 consisted of
SUTs exclusively from dicots, and included three Populus (PtSUT1-PtSUT3) and seven
Arabidopsis isoforms. Within Group-1, a sub-clade included SUTs predominantly from
perennial species, such as Populus, castor bean (Ricinus communis), rubber (Hevea
brasiliensis), grape (Vitis vinefera) and walnut (Juglans regia). Group-2 and Group-3
included SUTs from both monocots and dicots. Within Group-2, SUTs from monocots
76
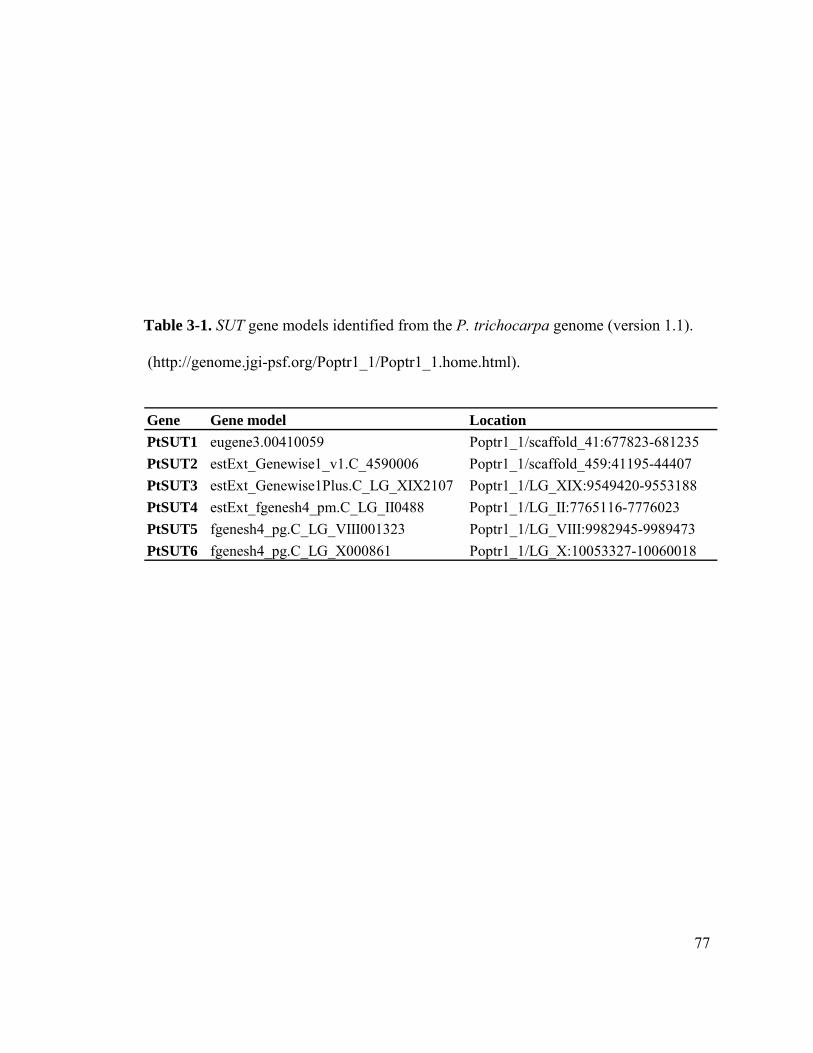
Table 3-1. SUT gene models identified from the P. trichocarpa genome (version 1.1).
(http://genome.jgi-psf.org/Poptr1_1/Poptr1_1.home.html).
Gene Gene model LocationPtSUT1 eugene3.00410059 Poptr1_1/scaffold_41:677823-681235PtSUT2 estExt_Genewise1_v1.C_4590006 Poptr1_1/scaffold_459:41195-44407PtSUT3 estExt_Genewise1Plus.C_LG_XIX2107 Poptr1_1/LG_XIX:9549420-9553188PtSUT4 estExt_fgenesh4_pm.C_LG_II0488 Poptr1_1/LG_II:7765116-7776023PtSUT5 fgenesh4_pg.C_LG_VIII001323 Poptr1_1/LG_VIII:9982945-9989473PtSUT6 fgenesh4_pg.C_LG_X000861 Poptr1_1/LG_X:10053327-10060018
77
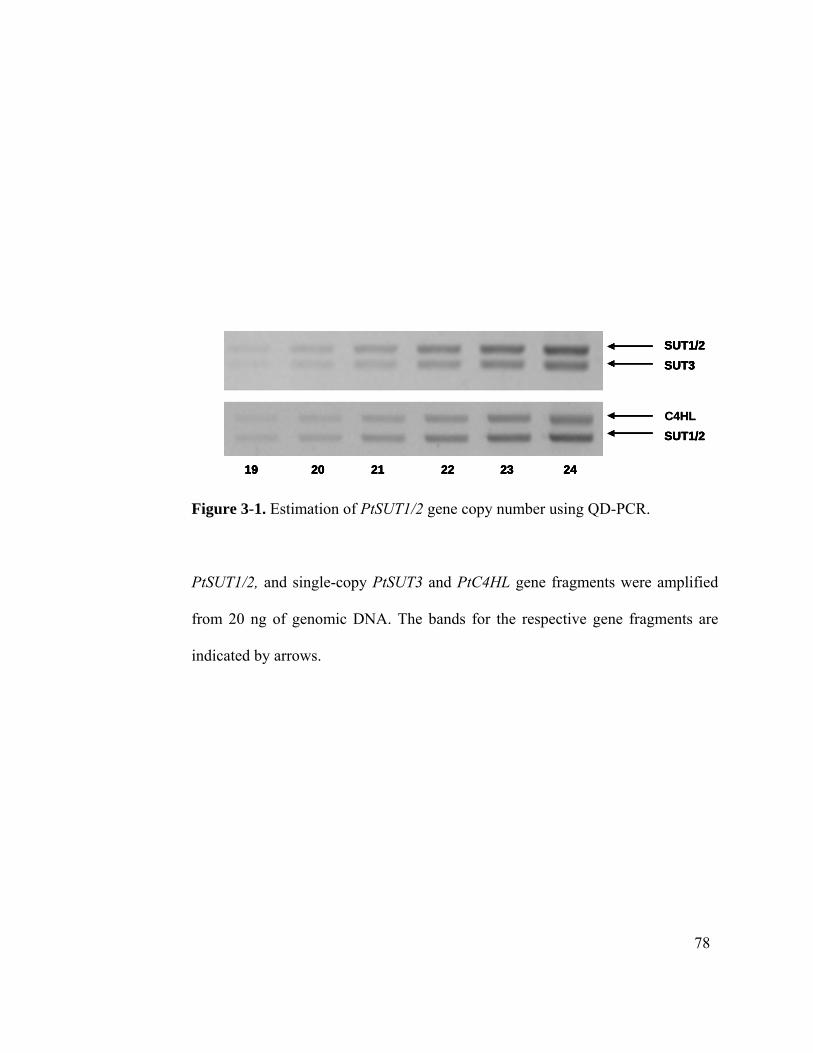
SUT3SUT1/2
C4HLSUT1/2
19 20 21 22 23 24
SUT3SUT1/2
SUT1/2
19 20 21 22 23 24
SUT3SUT1/2
C4HLSUT1/2
19 20 21 22 23 24
SUT3SUT1/2
SUT1/2
19 20 21 22 23 24
Figure 3-1. Estimation of PtSUT1/2 gene copy number using QD-PCR.
PtSUT1/2, and single-copy PtSUT3 and PtC4HL gene fragments were amplified
from 20 ng of genomic DNA. The bands for the respective gene fragments are
indicated by arrows.
78
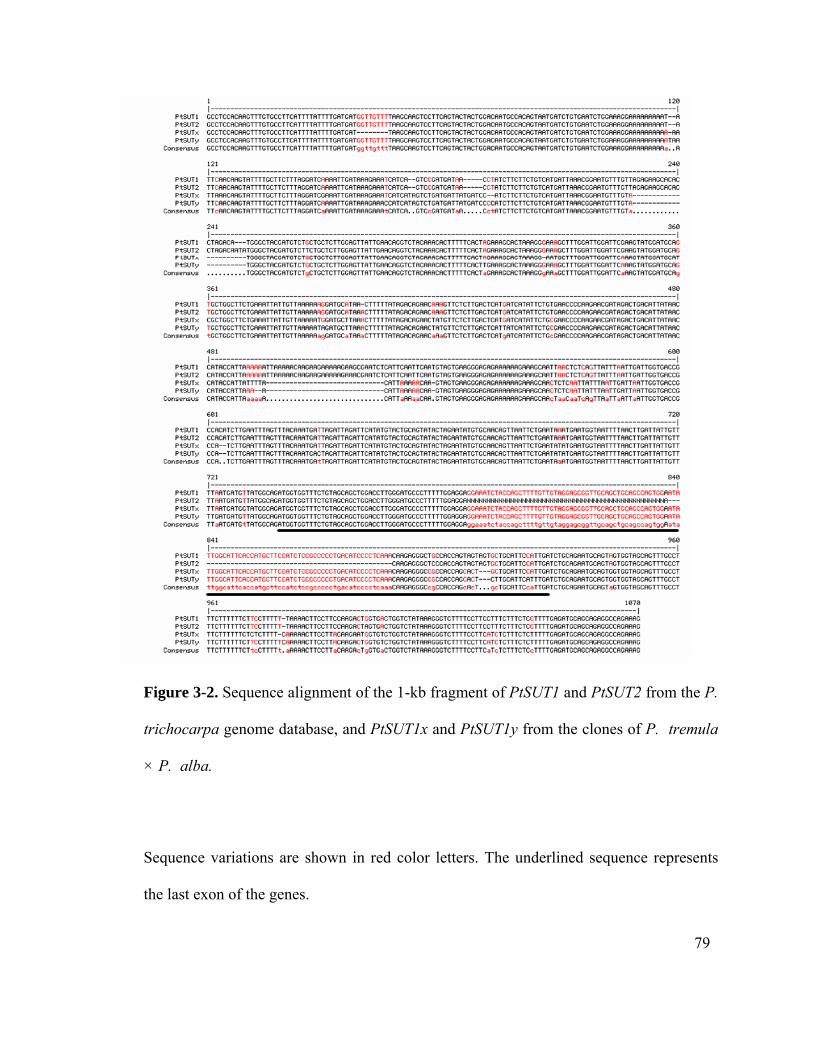
Figure 3-2. Sequence alignment of the 1-kb fragment of PtSUT1 and PtSUT2 from the P.
trichocarpa genome database, and PtSUT1x and PtSUT1y from the clones of P. tremula
× P. alba.
Sequence variations are shown in red color letters. The underlined sequence represents
the last exon of the genes.
79
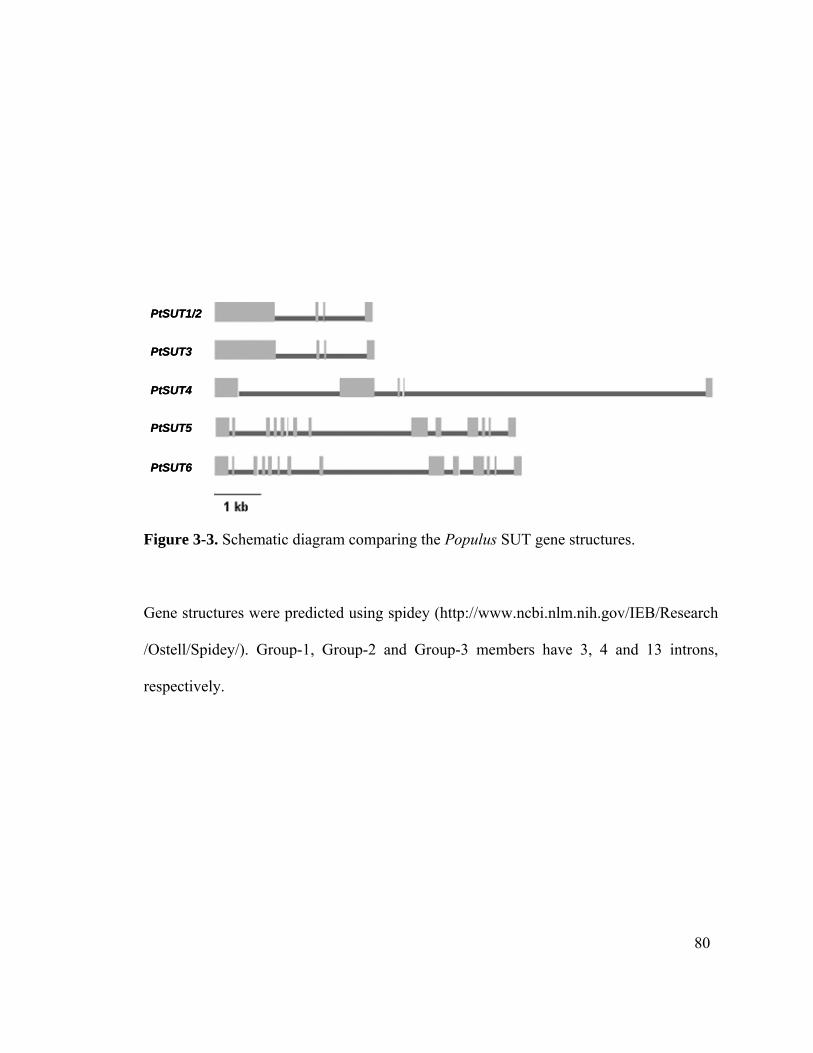
80
PtSUT1/2
PtSUT3
PtSUT4
PtSUT5
PtSUT6
PtSUT1/2
PtSUT3
PtSUT4
PtSUT5
PtSUT6
Figure 3-3. Schematic diagram comparing the Populus SUT gene structures.
Gene structures were predicted using spidey (http://www.ncbi.nlm.nih.gov/IEB/Research
/Ostell/Spidey/). Group-1, Group-2 and Group-3 members have 3, 4 and 13 introns,
respectively.
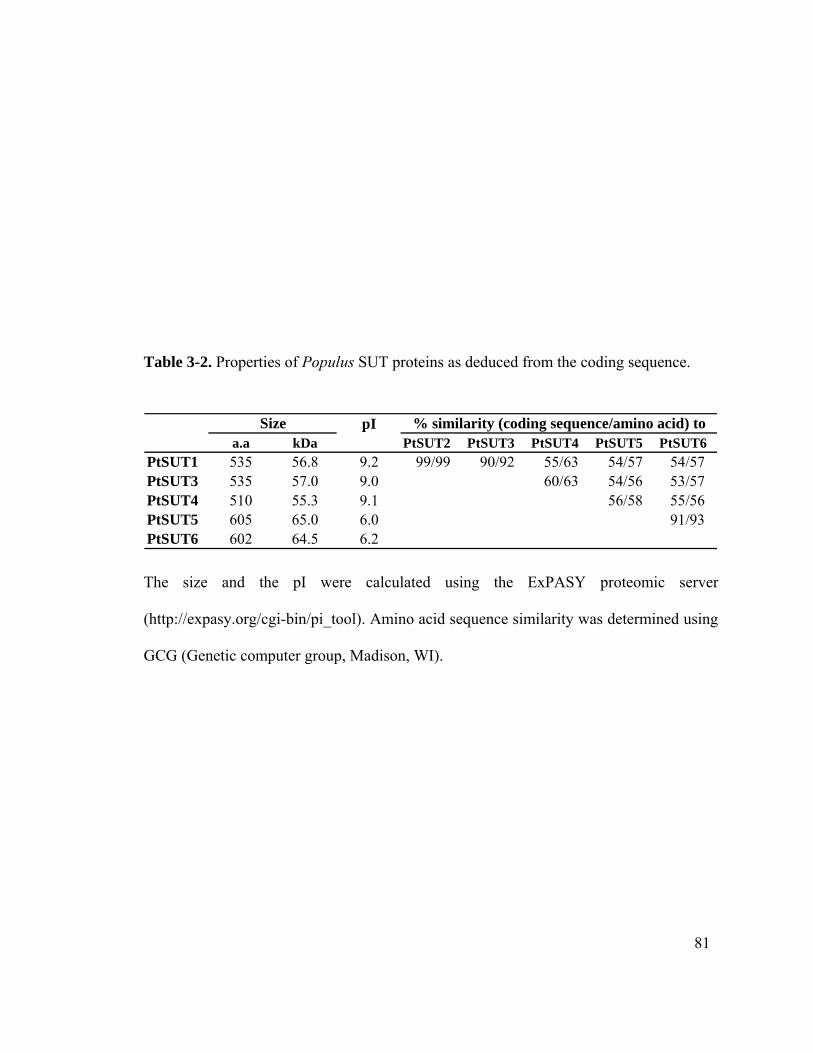
Table 3-2. Properties of Populus SUT proteins as deduced from the coding sequence.
pIa.a kDa PtSUT2 PtSUT3 PtSUT4 PtSUT5 PtSUT6
PtSUT1 535 56.8 9.2 99/99 90/92 55/63 54/57 54/57PtSUT3 535 57.0 9.0 60/63 54/56 53/57PtSUT4 510 55.3 9.1 56/58 55/56PtSUT5 605 65.0 6.0 91/93PtSUT6 602 64.5 6.2
Size % similarity (coding sequence/amino acid) to
The size and the pI were calculated using the ExPASY proteomic server
(http://expasy.org/cgi-bin/pi_tool). Amino acid sequence similarity was determined using
GCG (Genetic computer group, Madison, WI).
81
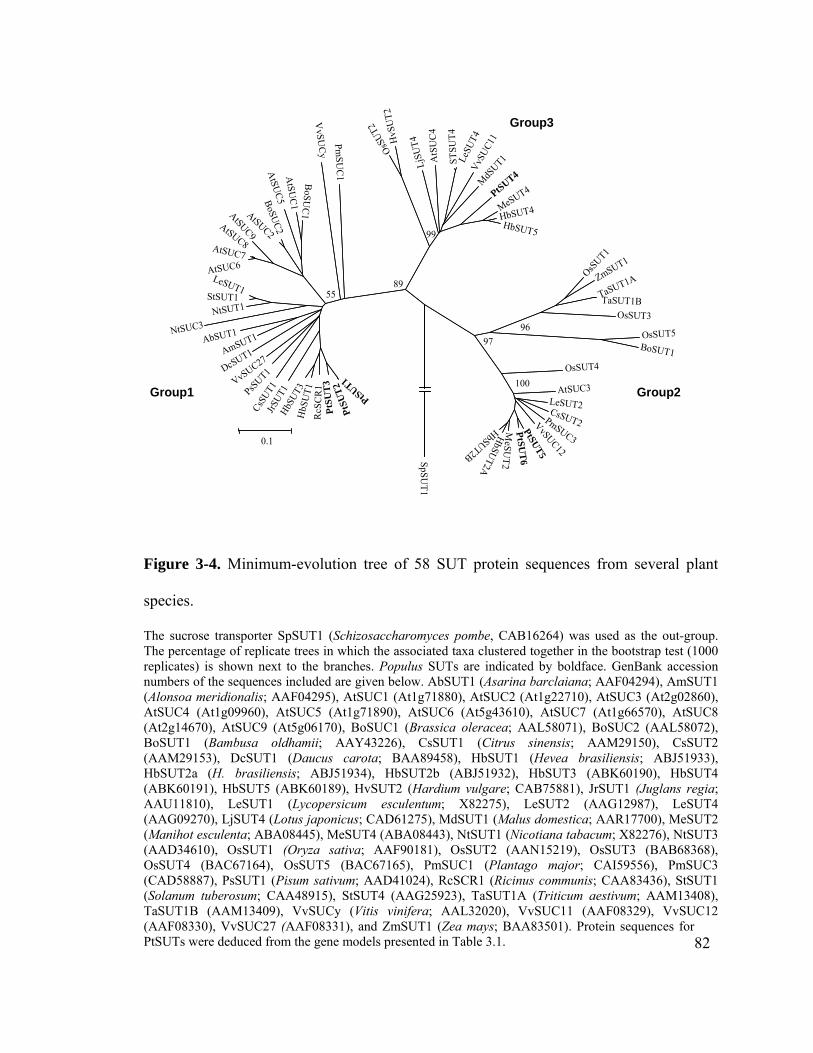
PtSUT1
PtSU
T2Pt
SUT
3R
cSC
R1
HbS
UT1
HbSUT3
JrSUT1
CsSUT1PsS
UT1
VvSUC27DcSUT1AmSUT1AbSUT1NtSUC3
NtSUT1StSUT1
LeSUT1
AtSUC6
AtSUC7
AtSUC8
AtSUC9
AtSUC2
BoSUC2
AtSU
C5A
tSUC1
BoSU
C1
VvSU
Cy
PmSU
C1
OsSUT2
HvS
UT2
LjSU
T4
AtS
UC
4
STSU
T4Le
SUT4
VvSUC1
1MdS
UT1
PtSUT4
MeSUT4
HbSUT4HbSUT5
OsSUT1
ZmSUT1
TaSUT1A
TaSUT1BOsSUT3
OsSUT5BoSUT1
OsSUT4
AtSUC3LeSUT2CsSUT2PmSUC3
VvSUC12
PtSUT5
PtSUT
6M
eSUT2
HbSUT2A
HbSUT2B
SpSUT1
0.1
Group1
Group3
Group2
8955
97
99
100
96
Figure 3-4. Minimum-evolution tree of 58 SUT protein sequences from several plant
species.
82
The sucrose transporter SpSUT1 (Schizosaccharomyces pombe, CAB16264) was used as the out-group. The percentage of replicate trees in which the associated taxa clustered together in the bootstrap test (1000 replicates) is shown next to the branches. Populus SUTs are indicated by boldface. GenBank accession numbers of the sequences included are given below. AbSUT1 (Asarina barclaiana; AAF04294), AmSUT1 (Alonsoa meridionalis; AAF04295), AtSUC1 (At1g71880), AtSUC2 (At1g22710), AtSUC3 (At2g02860), AtSUC4 (At1g09960), AtSUC5 (At1g71890), AtSUC6 (At5g43610), AtSUC7 (At1g66570), AtSUC8 (At2g14670), AtSUC9 (At5g06170), BoSUC1 (Brassica oleracea; AAL58071), BoSUC2 (AAL58072), BoSUT1 (Bambusa oldhamii; AAY43226), CsSUT1 (Citrus sinensis; AAM29150), CsSUT2 (AAM29153), DcSUT1 (Daucus carota; BAA89458), HbSUT1 (Hevea brasiliensis; ABJ51933), HbSUT2a (H. brasiliensis; ABJ51934), HbSUT2b (ABJ51932), HbSUT3 (ABK60190), HbSUT4 (ABK60191), HbSUT5 (ABK60189), HvSUT2 (Hardium vulgare; CAB75881), JrSUT1 (Juglans regia; AAU11810), LeSUT1 (Lycopersicum esculentum; X82275), LeSUT2 (AAG12987), LeSUT4 (AAG09270), LjSUT4 (Lotus japonicus; CAD61275), MdSUT1 (Malus domestica; AAR17700), MeSUT2 (Manihot esculenta; ABA08445), MeSUT4 (ABA08443), NtSUT1 (Nicotiana tabacum; X82276), NtSUT3 (AAD34610), OsSUT1 (Oryza sativa; AAF90181), OsSUT2 (AAN15219), OsSUT3 (BAB68368), OsSUT4 (BAC67164), OsSUT5 (BAC67165), PmSUC1 (Plantago major; CAI59556), PmSUC3 (CAD58887), PsSUT1 (Pisum sativum; AAD41024), RcSCR1 (Ricinus communis; CAA83436), StSUT1 (Solanum tuberosum; CAA48915), StSUT4 (AAG25923), TaSUT1A (Triticum aestivum; AAM13408), TaSUT1B (AAM13409), VvSUCy (Vitis vinifera; AAL32020), VvSUC11 (AAF08329), VvSUC12 (AAF08330), VvSUC27 (AAF08331), and ZmSUT1 (Zea mays; BAA83501). Protein sequences for PtSUTs were deduced from the gene models presented in Table 3.1.
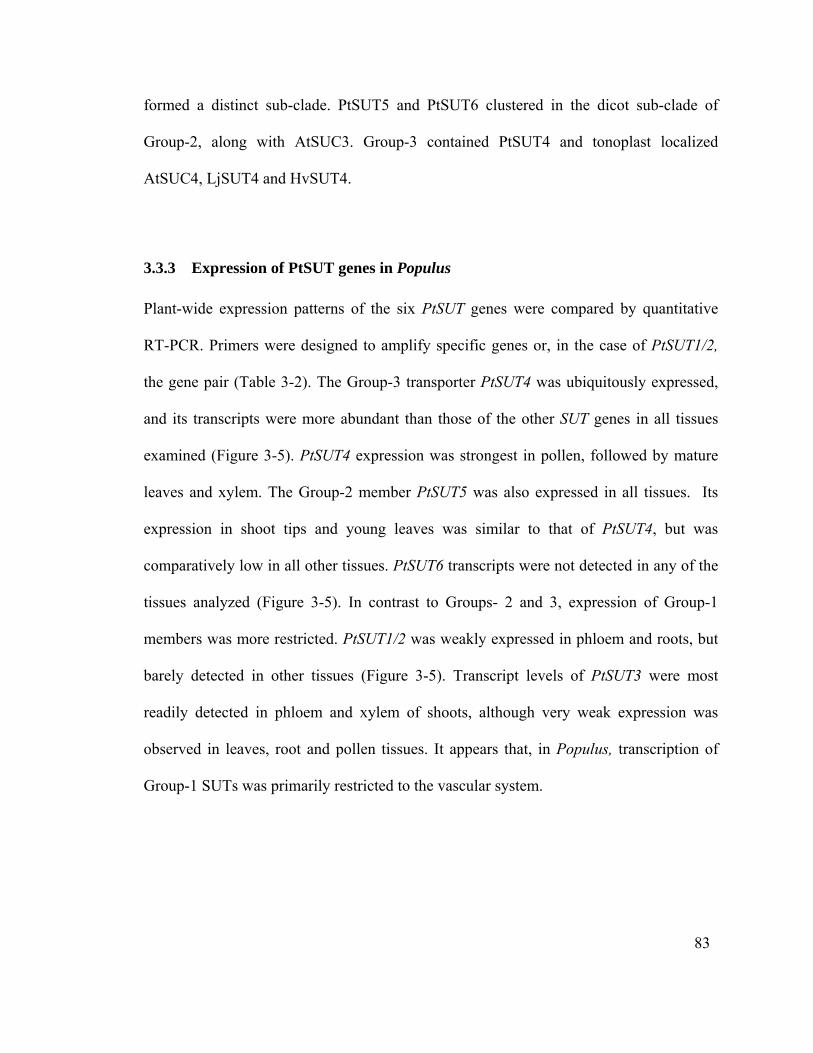
formed a distinct sub-clade. PtSUT5 and PtSUT6 clustered in the dicot sub-clade of
Group-2, along with AtSUC3. Group-3 contained PtSUT4 and tonoplast localized
AtSUC4, LjSUT4 and HvSUT4.
3.3.3 Expression of PtSUT genes in Populus
Plant-wide expression patterns of the six PtSUT genes were compared by quantitative
RT-PCR. Primers were designed to amplify specific genes or, in the case of PtSUT1/2,
the gene pair (Table 3-2). The Group-3 transporter PtSUT4 was ubiquitously expressed,
and its transcripts were more abundant than those of the other SUT genes in all tissues
examined (Figure 3-5). PtSUT4 expression was strongest in pollen, followed by mature
leaves and xylem. The Group-2 member PtSUT5 was also expressed in all tissues. Its
expression in shoot tips and young leaves was similar to that of PtSUT4, but was
comparatively low in all other tissues. PtSUT6 transcripts were not detected in any of the
tissues analyzed (Figure 3-5). In contrast to Groups- 2 and 3, expression of Group-1
members was more restricted. PtSUT1/2 was weakly expressed in phloem and roots, but
barely detected in other tissues (Figure 3-5). Transcript levels of PtSUT3 were most
readily detected in phloem and xylem of shoots, although very weak expression was
observed in leaves, root and pollen tissues. It appears that, in Populus, transcription of
Group-1 SUTs was primarily restricted to the vascular system.
83
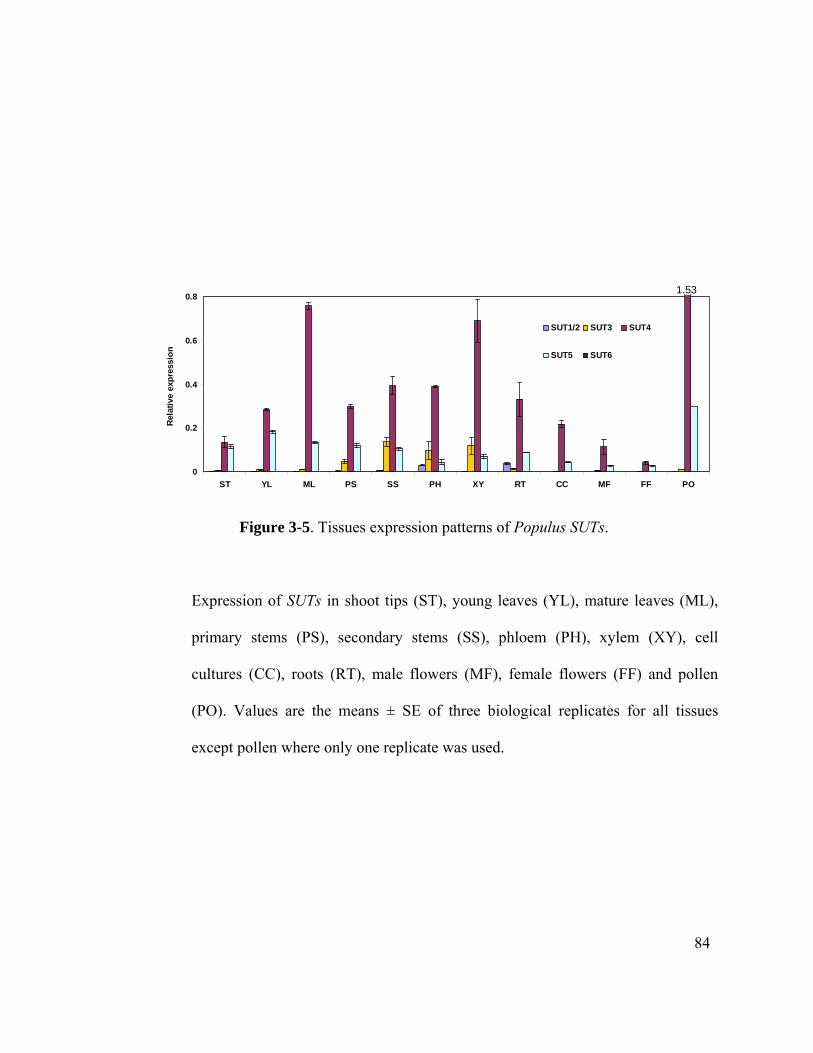
0
0.2
0.4
0.6
0.8
ST YL ML PS SS PH XY RT CC MF FF PO
Rela
tive
expr
essi
on
SUT1/2 SUT3 SUT4
SUT5 SUT6
1.53
0
0.2
0.4
0.6
0.8
ST YL ML PS SS PH XY RT CC MF FF PO
Rela
tive
expr
essi
on
SUT1/2 SUT3 SUT4
SUT5 SUT6
1.53
Figure 3-5. Tissues expression patterns of Populus SUTs.
Expression of SUTs in shoot tips (ST), young leaves (YL), mature leaves (ML),
primary stems (PS), secondary stems (SS), phloem (PH), xylem (XY), cell
cultures (CC), roots (RT), male flowers (MF), female flowers (FF) and pollen
(PO). Values are the means ± SE of three biological replicates for all tissues
except pollen where only one replicate was used.
84
3.3.4 Yeast complementation
For functional analysis of the Populus SUTs, yeast complementation experiments were
conducted using the Saccharomyces cerevisiae SUSY7/ura3 mutant strain (Riesmeier et
al., 1992; Weise et al., 2000). This mutant lacks the ability to transport and hydrolyze
exogenously supplied sucrose and does not grow on media supplemented with sucrose as
the sole carbon source. Transformation of the SUSY7/ura3 yeast mutant strain with a
functional SUT enables it to grow on sucrose media (Riesmeier et al., 1992). The coding
sequences of the three most abundantly expressed isoforms, PtSUT3, PtSUT4 and
PtSUT5, representing Group-1, Group-3 and Group-2, respectively, were tested. Both
untransformed and SUT-transformed mutants grew on glucose media (Figure 3-6, left),
but only SUT transformed mutants grew on sucrose media (Figure 3-6, right). These
results indicate that PtSUT3, PtSUT4 and PtSUT5 encode functional transporters.
3.3.5 Transgenic manipulation of PtSUT4 by RNAi
The strong expression of PtSUT4 in all tissues analyzed suggests that it plays a major role
in carbohydrate transport and/or compartmentalization in Populus. To investigate the
function of PtSUT4 in planta, RNAi-mediated gene silencing was performed. PtSUT4
expression was suppressed by 50-90% in different tissues of four independent transgenic
poplar lines (Figure 3-7A). Transcript levels of PtSUT5, also ubiquitously expressed,
were found to differ little between transgenic and wildtype plants, confirming specificity
of PtSUT4 targeting by the RNAi construct (Figure 3-7B). Based on these results,
transgenic line G exhibiting the highest level of PtSUT4 suppression overall was
85
Figure 3-6. Complementation of yeast mutant (SUSY/ura3) with PtSUTs.
Transformed yeast was cultured on minimal media supplemented with either
glucose (left) or sucrose (right). PtSUT3-, PtSUT4- or PtSUT5-transformed and
untransformed mutants are arranged clockwise from top-right.
86
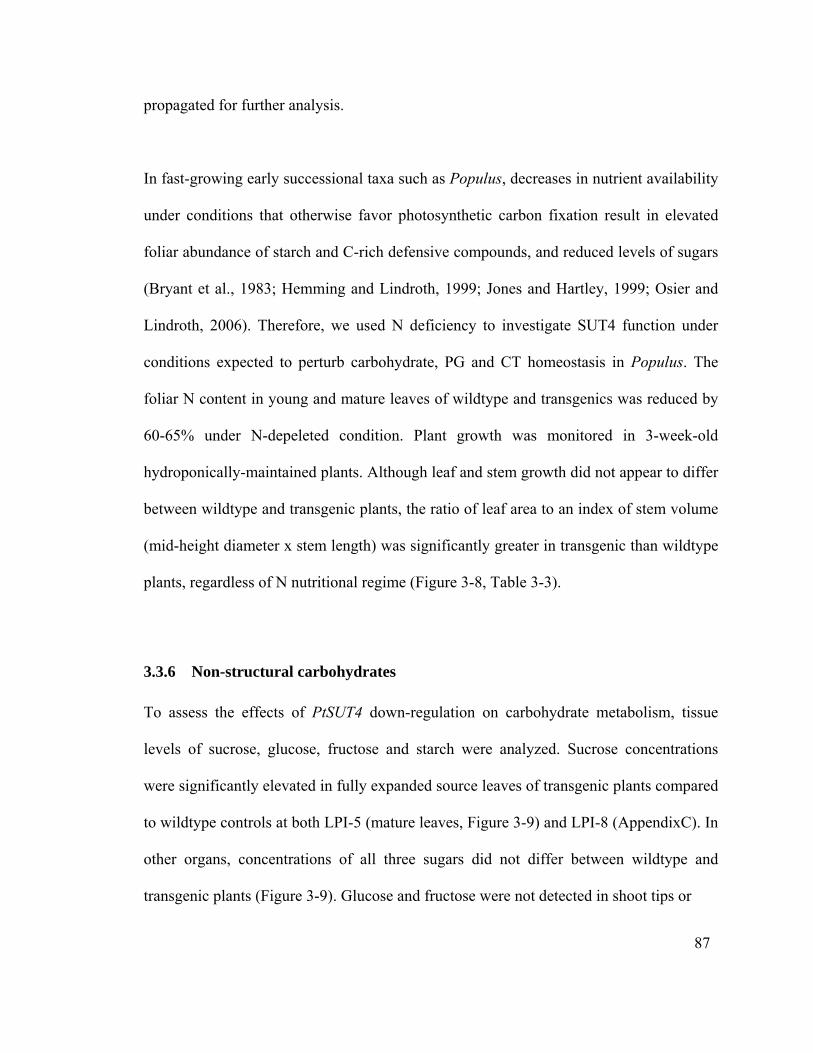
propagated for further analysis.
In fast-growing early successional taxa such as Populus, decreases in nutrient availability
under conditions that otherwise favor photosynthetic carbon fixation result in elevated
foliar abundance of starch and C-rich defensive compounds, and reduced levels of sugars
(Bryant et al., 1983; Hemming and Lindroth, 1999; Jones and Hartley, 1999; Osier and
Lindroth, 2006). Therefore, we used N deficiency to investigate SUT4 function under
conditions expected to perturb carbohydrate, PG and CT homeostasis in Populus. The
foliar N content in young and mature leaves of wildtype and transgenics was reduced by
60-65% under N-depeleted condition. Plant growth was monitored in 3-week-old
hydroponically-maintained plants. Although leaf and stem growth did not appear to differ
between wildtype and transgenic plants, the ratio of leaf area to an index of stem volume
(mid-height diameter x stem length) was significantly greater in transgenic than wildtype
plants, regardless of N nutritional regime (Figure 3-8, Table 3-3).
3.3.6 Non-structural carbohydrates
To assess the effects of PtSUT4 down-regulation on carbohydrate metabolism, tissue
levels of sucrose, glucose, fructose and starch were analyzed. Sucrose concentrations
were significantly elevated in fully expanded source leaves of transgenic plants compared
to wildtype controls at both LPI-5 (mature leaves, Figure 3-9) and LPI-8 (AppendixC). In
other organs, concentrations of all three sugars did not differ between wildtype and
transgenic plants (Figure 3-9). Glucose and fructose were not detected in shoot tips or
87
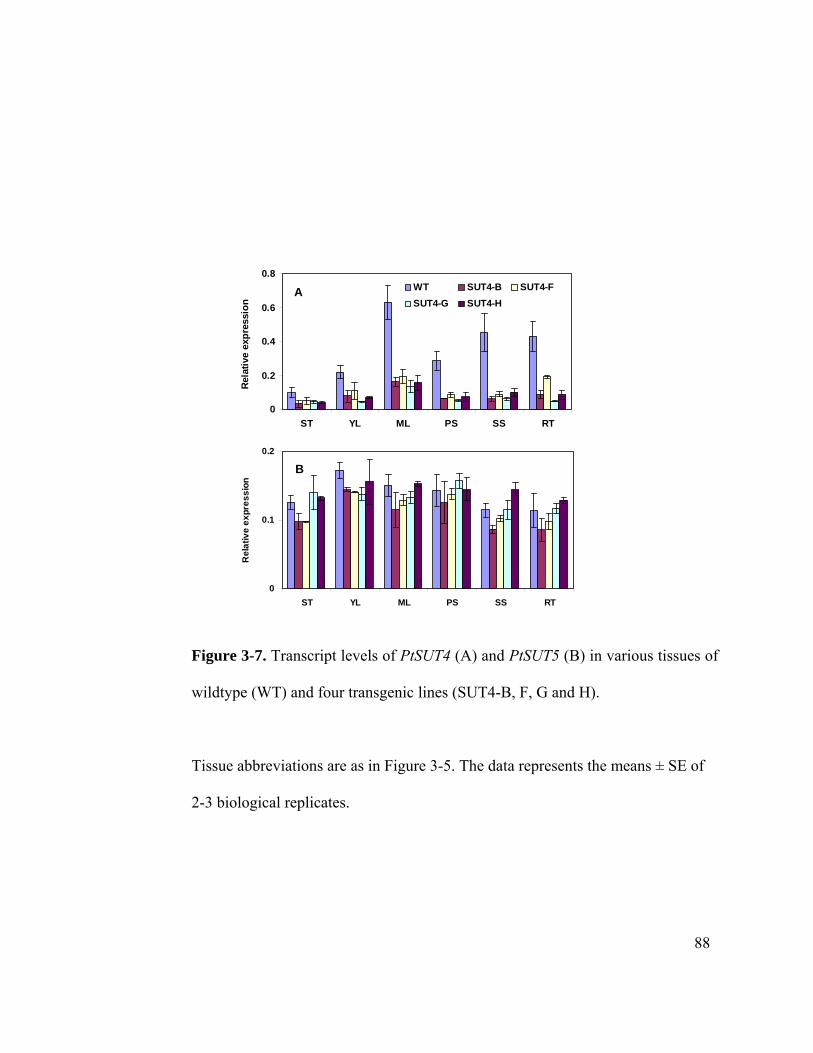
0
0.2
0.4
0.6
0.8
ST YL ML PS SS RT
Rela
tive
expr
essi
on
WT SUT4-B SUT4-FSUT4-G SUT4-H
A
0
0.1
0.2
ST YL ML PS SS RT
Rel
ativ
e ex
pres
sion
B
0
0.2
0.4
0.6
0.8
ST YL ML PS SS RT
Rela
tive
expr
essi
on
WT SUT4-B SUT4-FSUT4-G SUT4-H
A
0
0.2
0.4
0.6
0.8
ST YL ML PS SS RT
Rela
tive
expr
essi
on
WT SUT4-B SUT4-FSUT4-G SUT4-H
A
0
0.1
0.2
ST YL ML PS SS RT
Rel
ativ
e ex
pres
sion
B
0
0.1
0.2
ST YL ML PS SS RT
Rel
ativ
e ex
pres
sion
B
Figure 3-7. Transcript levels of PtSUT4 (A) and PtSUT5 (B) in various tissues of
wildtype (WT) and four transgenic lines (SUT4-B, F, G and H).
Tissue abbreviations are as in Figure 3-5. The data represents the means ± SE of
2-3 biological replicates.
88
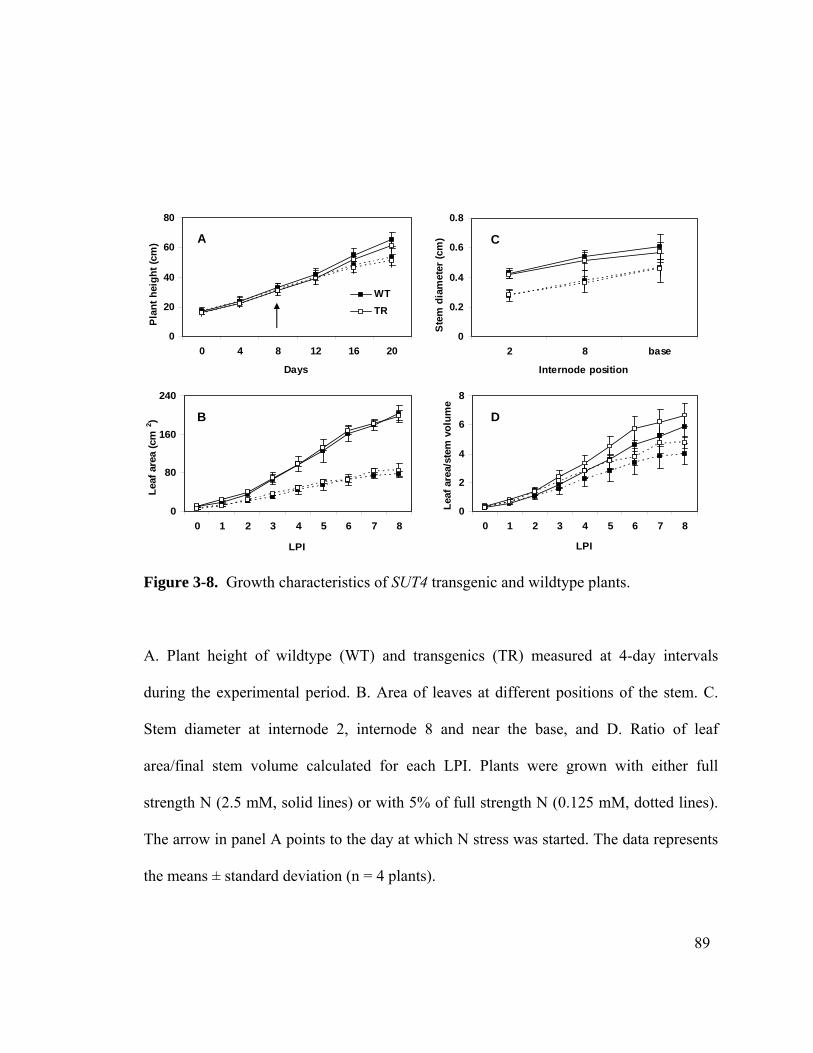
0
80
160
240
0 1 2 3 4 5 6 7 8
LPI
Leaf
are
a (c
m2 ) B
0
0.2
0.4
0.6
0.8
2 8 base
Internode position
Ste
m d
iam
eter
(cm
) C
0
2
4
6
8
0 1 2 3 4 5 6 7 8
LPI
Leaf
are
a/st
em v
olum
e
D
0
20
40
60
80
0 4 8 12 16 20
Days
Plan
t hei
ght (
cm)
WTTR
A
0
80
160
240
0 1 2 3 4 5 6 7 8
LPI
Leaf
are
a (c
m2 ) B
0
80
160
240
0 1 2 3 4 5 6 7 8
LPI
Leaf
are
a (c
m2 ) B
0
0.2
0.4
0.6
0.8
2 8 base
Internode position
Ste
m d
iam
eter
(cm
) C
0
0.2
0.4
0.6
0.8
2 8 base
Internode position
Ste
m d
iam
eter
(cm
) C
0
2
4
6
8
0 1 2 3 4 5 6 7 8
LPI
Leaf
are
a/st
em v
olum
e
D
0
2
4
6
8
0 1 2 3 4 5 6 7 8
LPI
Leaf
are
a/st
em v
olum
e
D
0
20
40
60
80
0 4 8 12 16 20
Days
Plan
t hei
ght (
cm)
WTTR
A
0
20
40
60
80
0 4 8 12 16 20
Days
Plan
t hei
ght (
cm)
WTTR
A
Figure 3-8. Growth characteristics of SUT4 transgenic and wildtype plants.
A. Plant height of wildtype (WT) and transgenics (TR) measured at 4-day intervals
during the experimental period. B. Area of leaves at different positions of the stem. C.
Stem diameter at internode 2, internode 8 and near the base, and D. Ratio of leaf
area/final stem volume calculated for each LPI. Plants were grown with either full
strength N (2.5 mM, solid lines) or with 5% of full strength N (0.125 mM, dotted lines).
The arrow in panel A points to the day at which N stress was started. The data represents
the means ± standard deviation (n = 4 plants).
89
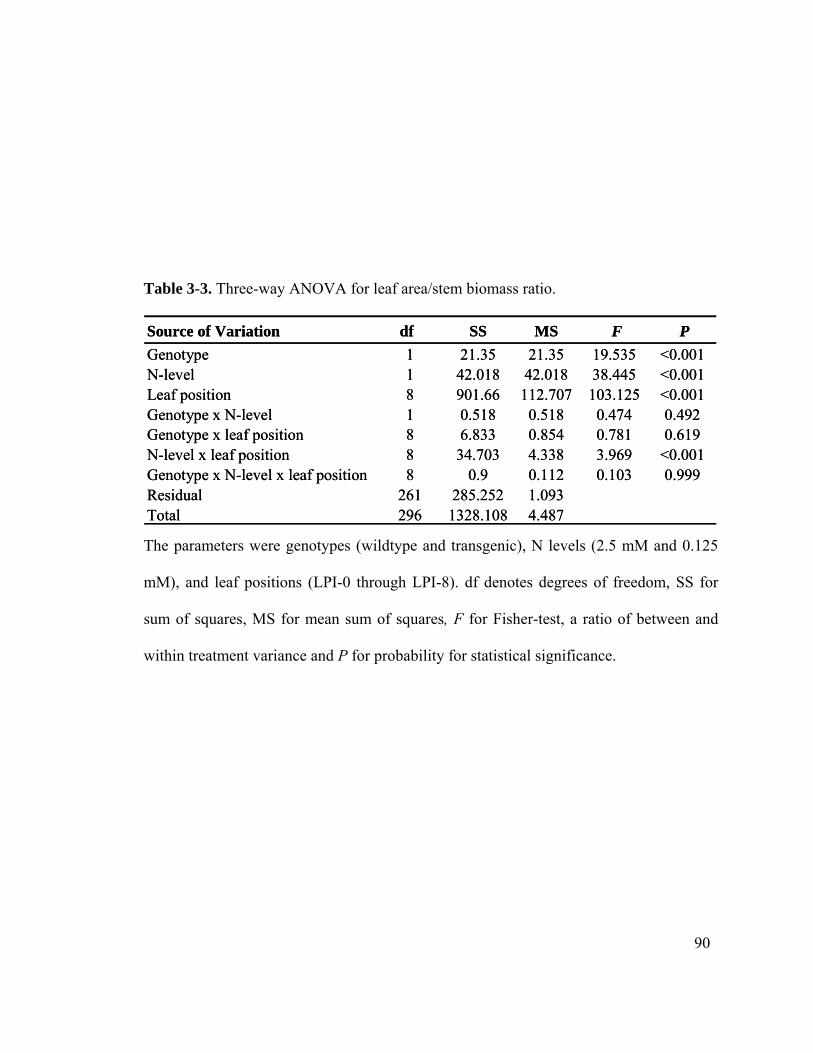
Table 3-3. Three-way ANOVA for leaf area/stem biomass ratio.
So
90
urce of Variation df SS MS F PGenotype 1 21.35 21.35 19.535 <0.001N-level 1 42.018 42.018 38.445 <0.001Leaf position 8 901.66 112.707 103.125 <0.001Genotype x N-level 1 0.518 0.518 0.474 0.492Genotype x leaf position 8 6.833 0.854 0.781 0.619N-level x leaf position 8 34.703 4.338 3.969 <0.001Genotype x N-level x leaf position 8 0.9 0.112 0.103 0.999Residual 261 285.252 1.093Total 296 1328.108 4.487
Source of Variation df SS MS F PGenotype 1 21.35 21.35 19.535 <0.001N-level 1 42.018 42.018 38.445 <0.001Leaf position 8 901.66 112.707 103.125 <0.001Genotype x N-level 1 0.518 0.518 0.474 0.492Genotype x leaf position 8 6.833 0.854 0.781 0.619N-level x leaf position 8 34.703 4.338 3.969 <0.001Genotype x N-level x leaf position 8 0.9 0.112 0.103 0.999Residual 261 285.252 1.093Total 296 1328.108 4.487
The parameters were genotypes (wildtype and transgenic), N levels (2.5 mM and 0.125
mM), and leaf positions (LPI-0 through LPI-8). df denotes degrees of freedom, SS for
sum of squares, MS for mean sum of squares, F for Fisher-test, a ratio of between and
within treatment variance and P for probability for statistical significance.
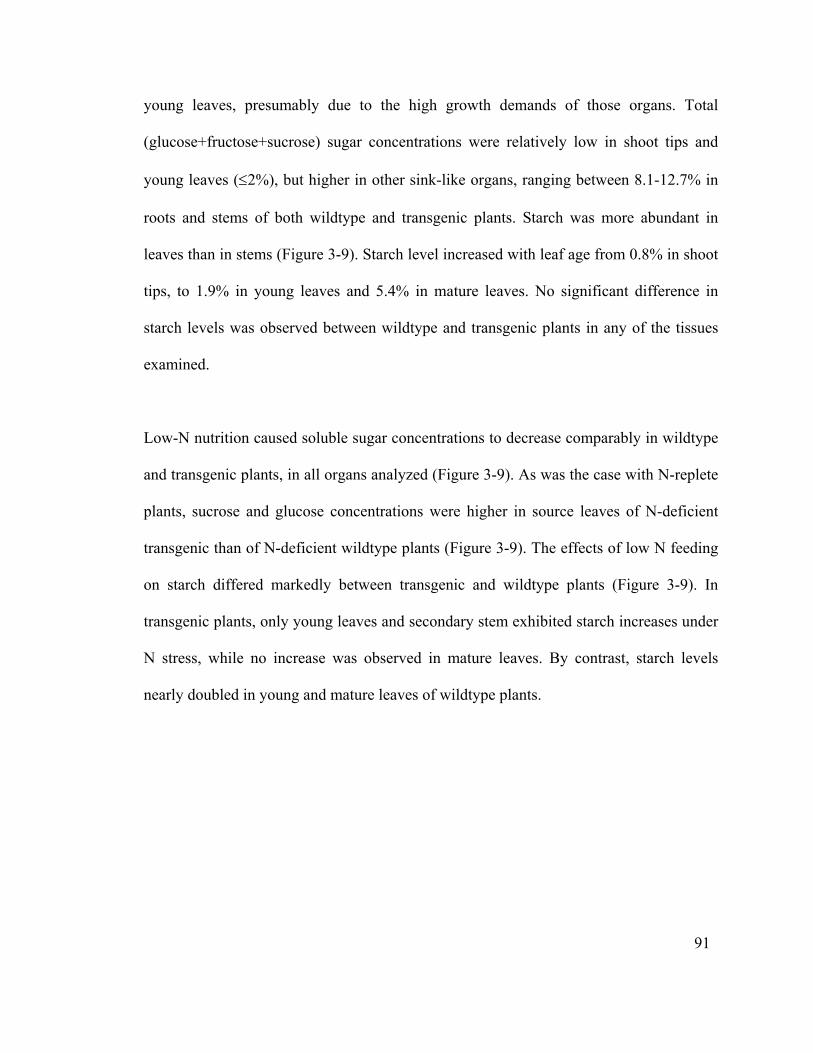
young leaves, presumably due to the high growth demands of those organs. Total
(glucose+fructose+sucrose) sugar concentrations were relatively low in shoot tips and
young leaves (≤2%), but higher in other sink-like organs, ranging between 8.1-12.7% in
roots and stems of both wildtype and transgenic plants. Starch was more abundant in
leaves than in stems (Figure 3-9). Starch level increased with leaf age from 0.8% in shoot
tips, to 1.9% in young leaves and 5.4% in mature leaves. No significant difference in
starch levels was observed between wildtype and transgenic plants in any of the tissues
examined.
Low-N nutrition caused soluble sugar concentrations to decrease comparably in wildtype
and transgenic plants, in all organs analyzed (Figure 3-9). As was the case with N-replete
plants, sucrose and glucose concentrations were higher in source leaves of N-deficient
transgenic than of N-deficient wildtype plants (Figure 3-9). The effects of low N feeding
on starch differed markedly between transgenic and wildtype plants (Figure 3-9). In
transgenic plants, only young leaves and secondary stem exhibited starch increases under
N stress, while no increase was observed in mature leaves. By contrast, starch levels
nearly doubled in young and mature leaves of wildtype plants.
91
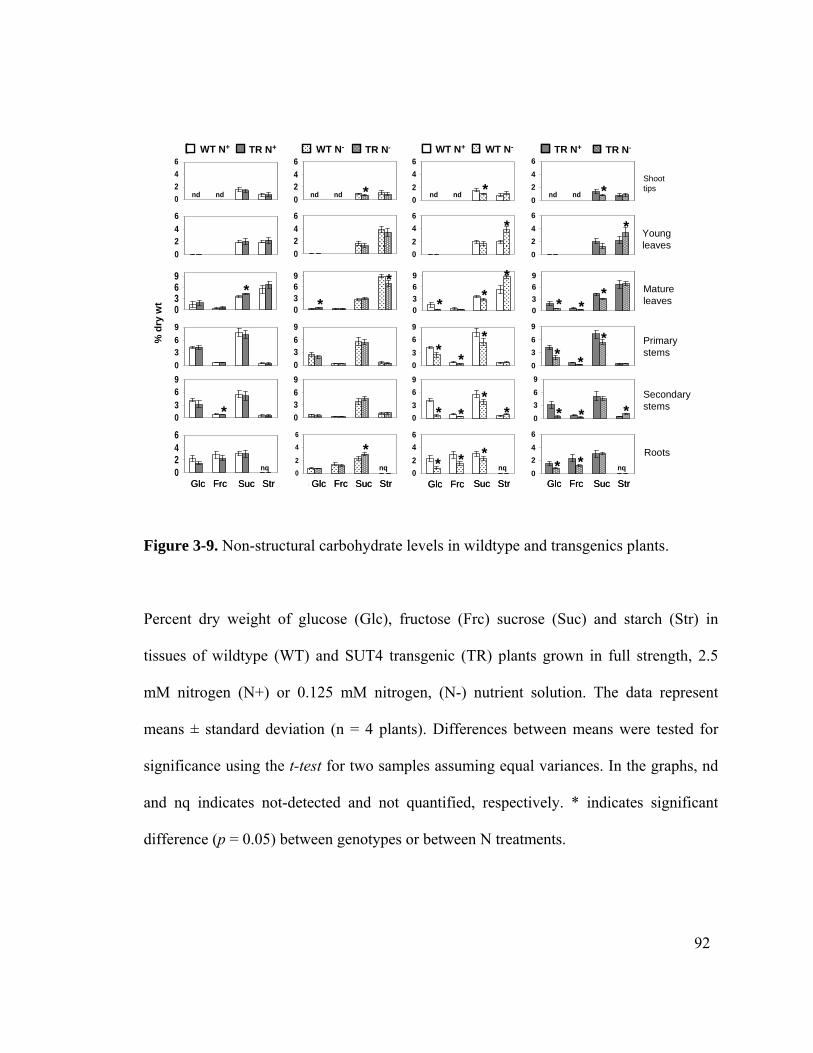
0246
0246
0246
0246
0246
0246
0246
0246
0369
0369
0369
0369
0369
0369
0369
0369
0369
0369
0369
0369
0246
02
46
0246
0246
Gl Fr Su St Gl Fr Su St Gl Fr Su St Gl Fr Su St
CN- TN- TN-CN-CN+ TN+ TN+CN+%
dry
wt
Apices
YL
ML
PS
SS
Roots
nd nd nd nd nd nd nd nd
nq nq nq nq
0246
0246
0246
0246
0246
0246
0246
0246
0369
0369
0369
0369
0369
0369
0369
0369
0369
0369
0369
0369
0246
02
46
0246
0246
Gl Fr Su StGl Fr Su St Gl Fr Su StGl Fr Su St Gl Fr Su StGl Fr Su St Gl Fr Su StGl Fr Su St
CN-CN- TN-TN- TN-TN-CN-CN-CN+CN+ TN+TN+ TN+TN+CN+CN+%
dry
wt
Apices
YL
ML
PS
SS
Roots
nd nd nd nd nd nd nd nd
nq nq nq nq
*
*
**
*
*
* *
* * **
* **
*
* **
* **
* *
* * ** *
*
*
*
*
*
WT N+ TR N+ WT N- TR N- WT N+ WT N- TR N+ TR N-
Shoot tips
Roots
Mature leaves
Young leaves
Primary stems
Secondary stems
Glu Fru Suc Str Glu Fru Suc Str Glu Fru Suc Str Glu Fru Suc Str
% d
ry w
t
0246
0246
0246
0246
0246
0246
0246
0246
0369
0369
0369
0369
0369
0369
0369
0369
0369
0369
0369
0369
0246
02
46
0246
0246
Gl Fr Su St Gl Fr Su St Gl Fr Su St Gl Fr Su St
CN- TN- TN-CN-CN+ TN+ TN+CN+%
dry
wt
Apices
YL
ML
PS
SS
Roots
nd nd nd nd nd nd nd nd
nq nq nq nq
0246
0246
0246
0246
0246
0246
0246
0246
0369
0369
0369
0369
0369
0369
0369
0369
0369
0369
0369
0369
0246
02
46
0246
0246
Gl Fr Su StGl Fr Su St Gl Fr Su StGl Fr Su St Gl Fr Su StGl Fr Su St Gl Fr Su StGl Fr Su St
CN-CN- TN-TN- TN-TN-CN-CN-CN+CN+ TN+TN+ TN+TN+CN+CN+%
dry
wt
Apices
YL
ML
PS
SS
Roots
nd nd nd nd nd nd nd nd
nq nq nq nq
*
*
**
*
*
* *
* * **
* **
*
* **
* **
* *
* * ** *
*
*
*
*
*
WT N+ TR N+WT N+ TR N+ WT N- TR N-WT N- TR N- WT N+ WT N-WT N+WT N+ WT N-WT N- TR N+ TR N-TR N+TR N+ TR N-TR N-
Shoot tips
Roots
Mature leaves
Young leaves
Primary stems
Secondary stems
Glu Fru Suc Str Glu Fru Suc Str Glu Fru Suc Str Glu Fru Suc Str
% d
ry w
t
Glc Frc Glc Frc Glc Frc Glc FrcSuc Str Suc Str Suc Str Suc Str
0246
0246
0246
0246
0246
0246
0246
0246
0369
0369
0369
0369
0369
0369
0369
0369
0369
0369
0369
0369
0246
02
46
0246
0246
Gl Fr Su St Gl Fr Su St Gl Fr Su St Gl Fr Su St
CN- TN- TN-CN-CN+ TN+ TN+CN+%
dry
wt
Apices
YL
ML
PS
SS
Roots
nd nd nd nd nd nd nd nd
nq nq nq nq
0246
0246
0246
0246
0246
0246
0246
0246
0369
0369
0369
0369
0369
0369
0369
0369
0369
0369
0369
0369
0246
02
46
0246
0246
Gl Fr Su StGl Fr Su St Gl Fr Su StGl Fr Su St Gl Fr Su StGl Fr Su St Gl Fr Su StGl Fr Su St
CN-CN- TN-TN- TN-TN-CN-CN-CN+CN+ TN+TN+ TN+TN+CN+CN+%
dry
wt
Apices
YL
ML
PS
SS
Roots
nd nd nd nd nd nd nd nd
nq nq nq nq
*
*
**
*
*
* *
* * **
* **
*
* **
* **
* *
* * ** *
*
*
*
*
*
WT N+ TR N+ WT N- TR N- WT N+ WT N- TR N+ TR N-
Shoot tips
Roots
Mature leaves
Young leaves
Primary stems
Secondary stems
Glu Fru Suc Str Glu Fru Suc Str Glu Fru Suc Str Glu Fru Suc Str
% d
ry w
t
0246
0246
0246
0246
0246
0246
0246
0246
0369
0369
0369
0369
0369
0369
0369
0369
0369
0369
0369
0369
0246
02
46
0246
0246
Gl Fr Su St Gl Fr Su St Gl Fr Su St Gl Fr Su St
CN- TN- TN-CN-CN+ TN+ TN+CN+%
dry
wt
Apices
YL
ML
PS
SS
Roots
nd nd nd nd nd nd nd nd
nq nq nq nq
0246
0246
0246
0246
0246
0246
0246
0246
0369
0369
0369
0369
0369
0369
0369
0369
0369
0369
0369
0369
0246
02
46
0246
0246
Gl Fr Su StGl Fr Su St Gl Fr Su StGl Fr Su St Gl Fr Su StGl Fr Su St Gl Fr Su StGl Fr Su St
CN-CN- TN-TN- TN-TN-CN-CN-CN+CN+ TN+TN+ TN+TN+CN+CN+%
dry
wt
Apices
YL
ML
PS
SS
Roots
nd nd nd nd nd nd nd nd
nq nq nq nq
*
*
**
*
*
* *
* * **
* **
*
* **
* **
* *
* * ** *
*
*
*
*
*
WT N+ TR N+WT N+ TR N+ WT N- TR N-WT N- TR N- WT N+ WT N-WT N+WT N+ WT N-WT N- TR N+ TR N-TR N+TR N+ TR N-TR N-
Shoot tips
Roots
Mature leaves
Young leaves
Primary stems
Secondary stems
Glu Fru Suc Str Glu Fru Suc Str Glu Fru Suc Str Glu Fru Suc Str
% d
ry w
t
Glc FrcGlc Frc Glc FrcGlc Frc Glc FrcGlc Frc Glc FrcGlc FrcSuc StrSuc Str Suc StrSuc Str Suc StrSuc Str Suc StrSuc Str
Figure 3-9. Non-structural carbohydrate levels in wildtype and transgenics plants.
Percent dry weight of glucose (Glc), fructose (Frc) sucrose (Suc) and starch (Str) in
tissues of wildtype (WT) and SUT4 transgenic (TR) plants grown in full strength, 2.5
mM nitrogen (N+) or 0.125 mM nitrogen, (N-) nutrient solution. The data represent
means ± standard deviation (n = 4 plants). Differences between means were tested for
significance using the t-test for two samples assuming equal variances. In the graphs, nd
and nq indicates not-detected and not quantified, respectively. * indicates significant
difference (p = 0.05) between genotypes or between N treatments.
92
3.3.7 Non-structural phenylpropanoids
There is evidence that accrual of both PG and CT demands substantial amounts of
carbohydrates (Arnold et al., 2004; Arnold and Schultz, 2002; Kleiner et al., 1999).
Therefore, the effect of PtSUT4 down-regulation on the levels of PGs and CTs was
investigated. The two higher-order PGs salicortin and tremulacin predominated in all
tissues analyzed (Figure 3-10). Salicortin concentrations increased with leaf maturation,
and tremulacin concentrations remained constant with leaf maturation in both genotypes.
Down regulation of SUT4 resulted in the decreased abundance of both salicortin and
tremulacin in young shoot organs, including shoot tips, young leaves, mature leaves and
primary stems (Figure 3-10). PG level was typically lower in secondary stem and root
tissues, and their abundance did not change in the transgenic plants. In general, CT
abundance was not affected in the transgenics, although small decreases were noted in the
shoot tips and roots, organs where CTs normally accumulate (Figure 3-10).
Low N feeding resulted in salicortin increases in shoot tips and primary stems of
transgenic plants and decreases in those organs in wildtype plants (Figure 3-10).
Salicortin increased in mature leaves of both genotypes, but the increase was larger in the
transgenics. Tremulacin decreased in nearly all shoot organs of the wildtype plants, but
was sustained at N-replete levels of leaves and stems in the transgenics. Overall, there
was a clear trend towards enhanced partitioning into the PG pool in transgenic compared
to wildtype plants during low N growth. As a result of low N feeding, CT levels
increased significantly in all shoot tissues in both wildtype and transgenic plants (Figure
3-10).
93
0
4
812
0
4
812
048
12
0
4
8
12
04
8
12
04
8
12
048
12
0
4
8
12
0
4
812
0
4
812
048
12
0
4
8
12
0
2
46
0246
0246
0
2
4
6
0246
0246
0246
0
2
4
6
0246
0102030
0
2
46
0
10
2030
0
2
46
0
10
2030
0246
0102030
Sa Sc Tr CTSa Sc Tr CT Sa Sc Tr CTSa Sc Tr CT Sa Sc Tr CTSa Sc Tr CT Sa Sc Tr CTSa Sc Tr CT
CN-CN- TN-TN- TN-TN-CN-CN-CN+CN+ TN+TN+ TN+TN+CN+CN+
% d
ry w
t
Apices
YL
ML
PS
SS
Rootsnd nd nd nd
*
*
*
*
*
**
*
*
*
**
*
*
*
*
*
**
*
*
*
*
*
*
*
*
*
*
Shoot tips
Roots
Mature leaves
WT N+ TR N+ WT N- TR N- WT N+ WT N- TR N+ TR N-
Young leaves
Primary stems
Secondary stems
0
4
812
0
4
812
048
12
0
4
8
12
04
8
12
04
8
12
048
12
0
4
8
12
0
4
812
0
4
812
048
12
0
4
8
12
0
2
46
0246
0246
0
2
4
6
0246
0246
0246
0
2
4
6
0246
0102030
0
2
46
0
10
2030
0
2
46
0
10
2030
0246
0102030
Sa Sc Tr CTSa Sc Tr CT Sa Sc Tr CTSa Sc Tr CT Sa Sc Tr CTSa Sc Tr CT Sa Sc Tr CTSa Sc Tr CT
CN-CN- TN-TN- TN-TN-CN-CN-CN+CN+ TN+TN+ TN+TN+CN+CN+
% d
ry w
t
Apices
YL
ML
PS
SS
Rootsnd nd nd nd
0
4
812
0
4
812
048
12
0
4
8
12
04
8
12
04
8
12
048
12
0
4
8
12
0
4
812
0
4
812
048
12
0
4
8
12
0
2
46
0246
0246
0
2
4
6
0246
0246
0246
0
2
4
6
0246
0102030
0
2
46
0
10
2030
0
2
46
0
10
2030
0246
0102030
Sa Sc Tr CTSa Sc Tr CT Sa Sc Tr CTSa Sc Tr CT Sa Sc Tr CTSa Sc Tr CT Sa Sc Tr CTSa Sc Tr CT
CN-CN- TN-TN- TN-TN-CN-CN-CN+CN+ TN+TN+ TN+TN+CN+CN+
% d
ry w
t
Apices
YL
ML
PS
SS
Rootsnd nd nd nd
*
*
*
*
*
**
*
*
*
**
*
*
*
*
*
**
*
*
*
*
*
*
*
*
*
*
Shoot tips
Roots
Mature leaves
WT N+ TR N+ WT N- TR N- WT N+ WT N- TR N+ TR N-WT N+ TR N+WT N+ TR N+ WT N- TR N-WT N- TR N- WT N+ WT N-WT N+WT N+ WT N-WT N- TR N+ TR N-TR N+TR N+ TR N-TR N-
Young leaves
Primary stems
Secondary stems
Figure 3-10. Non-structural phenylpropanoid levels in wildtype and transgenics plants.
Levels (% dry weight) of salicin (Sa), salicortin (Sc) tremulacin (Tr) and condensed
tannins (CT) in tissues of wildtype (WT) and SUT4 transgenic (TR) plants grown in full
strength, 2.5 mM nitrogen (N+) or 0.125 mM nitrogen, (N-) nutrient solution. The data
represent means ± standard deviation (n = 4 plants). Differences between means were
tested for significance using the t-test for two samples assuming equal variances. In the
graphs, nd indicates not-detected. Note the use of 2nd y-axis for root CT levels. *
indicates significant difference (p = 0.05) between genotypes or between N treatments.
94
3.3.8 Gene expression studies
2.3.8.1 Sucrose synthases and invertases
The expression of the entire suite of six sucrose synthases and 16 invertases annotated in
the Populus genome (Bocock et al., 2008; Tuskan et al., 2006) and associated with
sucrose hydrolysis was analyzed. As shown in Figure 3-11, expression could be
quantified for 4 paralogous pairs of neutral invertases (NIN), two vacuolar invertases
(VIN), one cytosolic invertase (CIN), and three sucrose synthases (SuSy). SuSy1 and
SuSy2, the predominantly expressed SuSy genes in mature leaves, were significantly
down-regulated there in transgenic plants (Figure 3-11 B, Figure 3-12 A). There was a
consistent tendency towards down regulation of the other sucrose hydrolysis-related
genes in leaves and shoot tips of transgenic compared to wildtype plants. In contrast, a
consistent tendency toward up regulation of those genes was observed in primary stems.
That tendency persisted for SuSy and several of the neutral invertase genes in secondary
stem and roots of the transgenics.
In response to N limitation, PtSUT4 exhibited an upward trend in young and mature
leaves and primary stems of wildtype plants (Figure 3-12 C), but such response was
either low (young leaves) or the reverse was true (mature leaves) in the SUT4 transgenic
plants (Figure 3-12 D). N-limitation resulted in substantially greater up-regulation of
SuSy in mature leaves of transgenics than of wildtype plants (Figure 3-12 C and D). In
transgenic plants, in contrast to the trend observed under N-replete where SuSy transcripts
were lower, SuSy transcript levels were higher under low N condition (Figure 3-12 A and
95
B). In addition, several weakly mature leaf-expressed invertases (NIN2/5 and NIN3/4)
and SUT3 exhibited a tendency toward up-regulation during N stress in transgenic mature
leaves (Figure 3-12 B). In most organs, expression of the relatively strongly expressed
PtVIN3 was reduced in wildtype but was up-regulated in transgenic plants in response to
N stress. In shoot tips, most of the SuSy and invertase genes exhibited a trend towards
down-regulation in N-limited wildtype plants and towards up-regulation in N-limited
transgenic plants.
2.3.8.2 Phenylalanine ammonia-lyases
The effects of PtSUT4 down-regulation on PG and CT accumulation were further
investigated by analyzing expression of phenylalanine ammonia-lyase (PAL). The PAL
protein regulates the entry of phenylalanine into the phenylpropanoid pathway for
synthesis of a variety of products, including PG and CT (Dixon and Paiva, 1995; Tsai et
al., 2006a). PtPAL1 and PtPAL3 were well expressed in all tissues, but expression was
clearly strongest in mature leaves (Figure 3-11 C). Both PtPAL1 and PtPAL3 were less
well expressed in shoot organs of transgenic than of wildtype plants (Figure 3-12 A).
This pattern changed during N-limitation. In general, PAL expression either increased
more or decreased less in shoot organs of transgenic than of wildtype plants (Figure 3-12
B). The result, during N-stress, was that PAL expression was much higher in transgenic
than wildtype plants in mature leaves and in major shoot sink organs like shoot tips and
secondary stems. At the same time, expression of PAL in roots became lower in
transgenic than wildtype plants. Generally speaking, the contrasting PAL expression
96
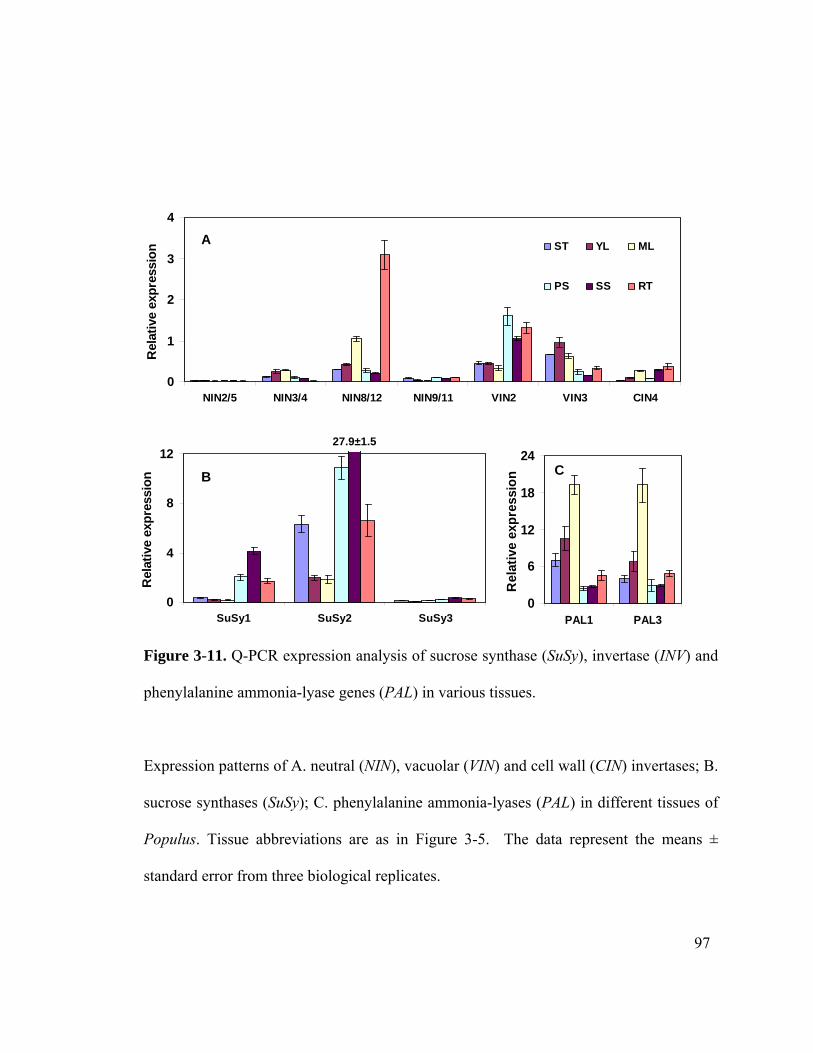
0
1
2
3
4
NIN2/5 NIN3/4 NIN8/12 NIN9/11 VIN2 VIN3 CIN4
Rel
ativ
e ex
pres
sion
ST YL ML
PS SS RT
A
0
6
12
18
24
PAL1 PAL3
Rel
ativ
e ex
pres
sion
C
0
4
8
12
SuSy1 SuSy2 SuSy3
Rel
ativ
e ex
pres
sion B
27.9±1.5
0
1
2
3
4
NIN2/5 NIN3/4 NIN8/12 NIN9/11 VIN2 VIN3 CIN4
Rel
ativ
e ex
pres
sion
ST YL ML
PS SS RT
A
0
1
2
3
4
NIN2/5 NIN3/4 NIN8/12 NIN9/11 VIN2 VIN3 CIN4
Rel
ativ
e ex
pres
sion
ST YL ML
PS SS RT
A
0
6
12
18
24
PAL1 PAL3
Rel
ativ
e ex
pres
sion
C
0
6
12
18
24
PAL1 PAL3
Rel
ativ
e ex
pres
sion
C
0
4
8
12
SuSy1 SuSy2 SuSy3
Rel
ativ
e ex
pres
sion B
27.9±1.5
0
4
8
12
SuSy1 SuSy2 SuSy3
Rel
ativ
e ex
pres
sion B
27.9±1.5
Figure 3-11. Q-PCR expression analysis of sucrose synthase (SuSy), invertase (INV) and
phenylalanine ammonia-lyase genes (PAL) in various tissues.
Expression patterns of A. neutral (NIN), vacuolar (VIN) and cell wall (CIN) invertases; B.
sucrose synthases (SuSy); C. phenylalanine ammonia-lyases (PAL) in different tissues of
Populus. Tissue abbreviations are as in Figure 3-5. The data represent the means ±
standard error from three biological replicates.
97
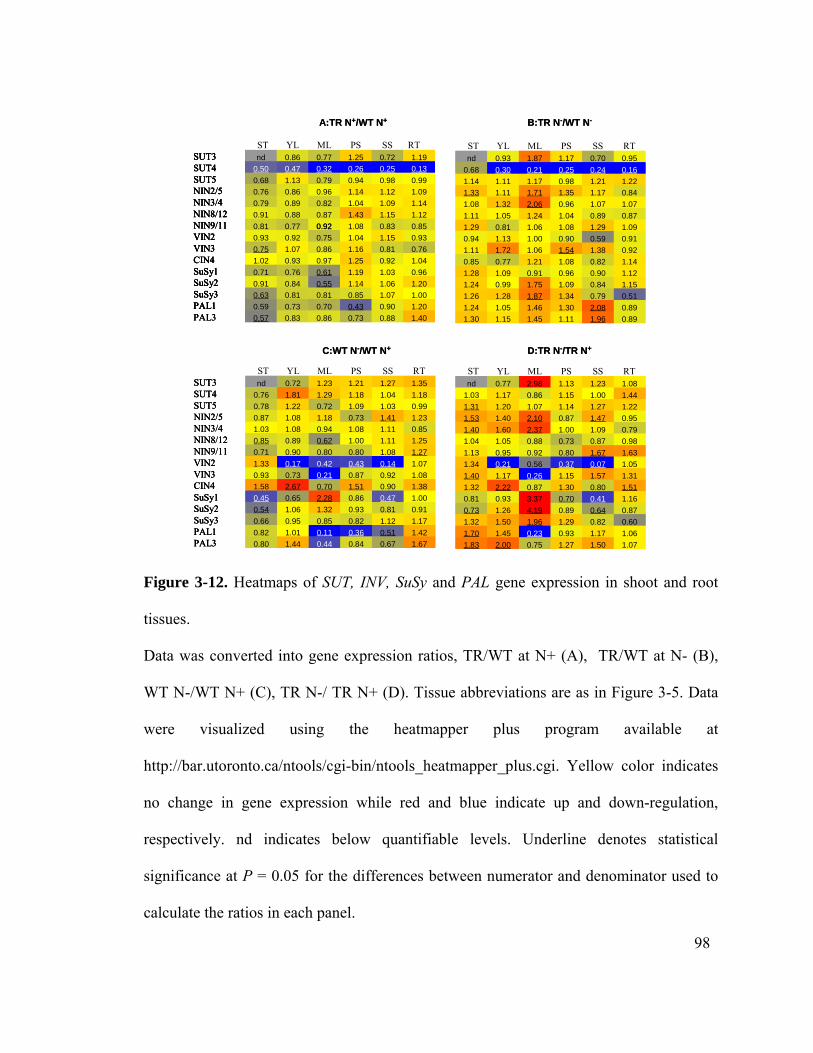
ST YL ML PS SS RTSUT3 nd 0.86 0.77 1.25 0.72 1.19SUT4 0.50 0.47 0.32 0.26 0.25 0.13SUT5 0.68 1.13 0.79 0.94 0.98 0.99NIN2/5 0.76 0.86 0.96 1.14 1.12 1.09NIN3/4 0.79 0.89 0.82 1.04 1.09 1.14NIN8/12 0.91 0.88 0.87 1.43 1.15 1.12NIN9/11 0.81 0.77 0.92 1.08 0.83 0.85VIN2 0.93 0.92 0.75 1.04 1.15 0.93VIN3 0.75 1.07 0.86 1.16 0.81 0.76CIN4 1.02 0.93 0.97 1.25 0.92 1.04SuSy1 0.71 0.76 0.61 1.19 1.03 0.96SuSy2 0.91 0.84 0.55 1.14 1.06 1.20SuSy3 0.63 0.81 0.81 0.85 1.07 1.00PAL1 0.59 0.73 0.70 0.43 0.90 1.20PAL3 0.57 0.83 0.86 0.73 0.88 1.40
A:TR N+/WT N+ B:TR N-/WT N-
ST YL ML PS SS RTSUT3 nd 0.72 1.23 1.21 1.27 1.35SUT4 0.76 1.81 1.29 1.18 1.04 1.18SUT5 0.78 1.22 0.72 1.09 1.03 0.99NIN2/5 0.87 1.08 1.18 0.73 1.41 1.23NIN3/4 1.03 1.08 0.94 1.08 1.11 0.85NIN8/12 0.85 0.89 0.62 1.00 1.11 1.25NIN9/11 0.71 0.90 0.80 0.80 1.08 1.27VIN2 1.33 0.17 0.42 0.43 0.14 1.07VIN3 0.93 0.73 0.21 0.87 0.92 1.08CIN4 1.58 2.67 0.70 1.51 0.90 1.38SuSy1 0.45 0.65 2.28 0.86 0.47 1.00SuSy2 0.54 1.06 1.32 0.93 0.81 0.91SuSy3 0.66 0.95 0.85 0.82 1.12 1.17PAL1 0.82 1.01 0.11 0.36 0.51 1.42PAL3 0.80 1.44 0.44 0.84 0.67 1.67
ST YL ML PS SS RTnd 0.77 2.98 1.13 1.23 1.08
1.03 1.17 0.86 1.15 1.00 1.441.31 1.20 1.07 1.14 1.27 1.221.53 1.40 2.10 0.87 1.47 0.951.40 1.60 2.37 1.00 1.09 0.791.04 1.05 0.88 0.73 0.87 0.981.13 0.95 0.92 0.80 1.67 1.631.34 0.21 0.56 0.37 0.07 1.051.40 1.17 0.26 1.15 1.57 1.311.32 2.22 0.87 1.30 0.80 1.510.81 0.93 3.37 0.70 0.41 1.160.73 1.26 4.19 0.89 0.64 0.871.32 1.50 1.96 1.29 0.82 0.601.70 1.45 0.23 0.93 1.17 1.061.83 2.00 0.75 1.27 1.50 1.07
ST YL ML PS SS RTnd 0.93 1.87 1.17 0.70 0.95
0.68 0.30 0.21 0.25 0.24 0.161.14 1.11 1.17 0.98 1.21 1.221.33 1.11 1.71 1.35 1.17 0.841.08 1.32 2.06 0.96 1.07 1.071.11 1.05 1.24 1.04 0.89 0.871.29 0.81 1.06 1.08 1.29 1.090.94 1.13 1.00 0.90 0.59 0.911.11 1.72 1.06 1.54 1.38 0.920.85 0.77 1.21 1.08 0.82 1.141.28 1.09 0.91 0.96 0.90 1.121.24 0.99 1.75 1.09 0.84 1.151.26 1.28 1.87 1.34 0.79 0.511.24 1.05 1.46 1.30 2.08 0.891.30 1.15 1.45 1.11 1.96 0.89
C:WT N-/WT N+ D:TR N-/TR N+
ST YL ML PS SS RTSUT3 nd 0.86 0.77 1.25 0.72 1.19SUT4 0.50 0.47 0.32 0.26 0.25 0.13SUT5 0.68 1.13 0.79 0.94 0.98 0.99NIN2/5 0.76 0.86 0.96 1.14 1.12 1.09NIN3/4 0.79 0.89 0.82 1.04 1.09 1.14NIN8/12 0.91 0.88 0.87 1.43 1.15 1.12NIN9/11 0.81 0.77 0.92 1.08 0.83 0.85VIN2 0.93 0.92 0.75 1.04 1.15 0.93VIN3 0.75 1.07 0.86 1.16 0.81 0.76CIN4 1.02 0.93 0.97 1.25 0.92 1.04SuSy1 0.71 0.76 0.61 1.19 1.03 0.96SuSy2 0.91 0.84 0.55 1.14 1.06 1.20SuSy3 0.63 0.81 0.81 0.85 1.07 1.00PAL1 0.59 0.73 0.70 0.43 0.90 1.20PAL3 0.57 0.83 0.86 0.73 0.88 1.40
ST YL ML PS SS RTSUT3 nd 0.86 0.77 1.25 0.72 1.19SUT4 0.50 0.47 0.32 0.26 0.25 0.13SUT5 0.68 1.13 0.79 0.94 0.98 0.99NIN2/5 0.76 0.86 0.96 1.14 1.12 1.09NIN3/4 0.79 0.89 0.82 1.04 1.09 1.14NIN8/12 0.91 0.88 0.87 1.43 1.15 1.12NIN9/11 0.81 0.77
ST YL ML PS SS RTSUT3 nd 0.86 0.77 1.25 0.72 1.19SUT4 0.50 0.47 0.32 0.26 0.25 0.13SUT5 0.68 1.13 0.79 0.94 0.98 0.99NIN2/5 0.76 0.86 0.96 1.14 1.12 1.09NIN3/4 0.79 0.89 0.82 1.04 1.09 1.14NIN8/12 0.91 0.88 0.87 1.43 1.15 1.12NIN9/11 0.81 0.77 0.92 1.08 0.83 0.85VIN2 0.93 0.92 0.75 1.04 1.15 0.93VIN3 0.75 1.07 0.86 1.16 0.81 0.76CIN4 1.02 0.93 0.97 1.25 0.92 1.04SuSy1 0.71 0.76 0.61 1.19 1.03 0.96SuSy2 0.91 0.84 0.55 1.14 1.06 1.20SuSy3 0.63 0.81 0.81 0.85 1.07 1.00PAL1 0.59 0.73 0.70 0.43 0.90
0.92 1.08 0.83 0.85VIN2 0.93 0.92 0.75 1.04 1.15 0.93VIN3 0.75 1.07 0.86 1.16 0.81 0.76CIN4 1.02 0.93 0.97 1.25 0.92 1.04SuSy1 0.71 0.76 0.61 1.19 1.03 0.96SuSy2 0.91 0.84 0.55 1.14 1.06 1.20SuSy3 0.63 0.81 0.81 0.85 1.07 1.00PAL1 0.59 0.73 0.70 0.43 0.90 1.20PAL3 0.57 0.83 0.86 0.73 0.88 1.40
A:TR N+/WT N+ B:TR N-/WT N-
ST YL ML PS SS RTSUT3 nd 0.72 1.23 1.21 1.27 1.35SUT4 0.76 1.81 1.29 1.18 1.04 1.18SUT5 0.78 1.22 0.72 1.09 1.03 0.99NIN2/5 0.87 1.08 1.18 0.73 1.41 1.23NIN3/4 1.03 1.08 0.94 1.08 1.11 0.85NIN8/12 0.85 0.89 0.62 1.00 1.11 1.25NIN9/11 0.71 0.90 0.80 0.80 1.08 1.27VIN2 1.33 0.17 0.42 0.43 0.14 1.07VIN3 0.93 0.73 0.21 0.87 0.92 1.08CIN4 1.58 2.67 0.70 1.51 0.90 1.38SuSy1 0.45 0.65 2.28 0.86 0.47 1.00SuSy2 0.54 1.06 1.32 0.93 0.81 0.91SuSy3 0.66 0.95 0.85 0.82 1.12 1.17PAL1 0.82 1.01 0.11 0.36 0.51 1.42PAL3 0.80 1.44 0.44 0.84 0.67 1.67
ST YL ML PS SS RTSUT3 nd 0.72 1.23 1.21 1.27 1.35SUT4 0.76 1.81 1.29 1.18 1.04 1.18SUT5 0.78 1.22 0.72 1.09 1.03 0.99NIN2/5 0.87 1.08 1.18 0.73 1.41 1.23NIN3/4 1.03 1.08 0.94 1.08 1.11 0.85NIN8/12 0.85 0.89 0.62 1.00 1.11 1.25NIN9/11 0.71 0.90 0.80 0.80 1.08 1.27VIN2 1.33 0.17 0.42 0.43 0.14 1.07VIN3 0.93 0.73 0.21 0.87 0.92 1.08CIN4 1.58 2.67 0.70 1.51 0.90 1.38SuSy1 0.45 0.65 2.28 0.86 0.47 1.00SuSy2 0.54 1.06 1.32 0.93 0.81 0.91SuSy3 0.66 0.95 0.85 0.82 1.12 1.17PAL1 0.82 1.01 0.11 0.36 0.51 1.42PAL3 0.80 1.44 0.44 0.84 0.67 1.67
ST YL ML PS SS RTnd 0.77 2.98 1.13 1.23 1.08
1.03 1.17 0.86 1.15 1.00 1.441.31 1.20 1.07 1.14 1.27 1.221.53 1.40 2.10 0.87 1.47 0.951.40 1.60 2.37 1.00 1.09 0.791.04 1.05 0.88 0.73 0.87 0.981.13 0.95 0.92 0.80 1.67 1.631.34 0.21 0.56 0.37 0.07 1.051.40 1.17 0.26 1.15 1.57 1.311.32 2.22 0.87 1.30 0.80 1.510.81 0.93 3.37 0.70 0.41 1.160.73 1.26 4.19 0.89 0.64 0.871.32 1.50 1.96 1.29 0.82 0.601.70 1.45 0.23 0.93 1.17 1.061.83 2.00 0.75 1.27 1.50 1.07
ST YL ML PS SS RTnd 0.93 1.87 1.17 0.70 0.95
0.68 0.30 0.21 0.25 0.24 0.161.14 1.11 1.17 0.98 1.21 1.221.33 1.11 1.71 1.35 1.17 0.841.08 1.32 2.06 0.96 1.07 1.071.11 1.05 1.24 1.04 0.89 0.871.29 0.81 1.06 1.08 1.29 1.090.94 1.13 1.00 0.90 0.59 0.911.11 1.72 1.06 1.54 1.38 0.920.85 0.77 1.21 1.08 0.82 1.141.28 1.09 0.91 0.96 0.90 1.121.24 0.99 1.75 1.09 0.84 1.151.26 1.28 1.87 1.34 0.79 0.511.24 1.05 1.46 1.30 2.08 0.891.30 1.15 1.45 1.11 1.96 0.89
C:WT N-/WT N+ D:TR N-/TR N+
Figure 3-12. Heatmaps of SUT, INV, SuSy and PAL gene expression in shoot and root
tissues.
Data was converted into gene expression ratios, TR/WT at N+ (A), TR/WT at N- (B),
WT N-/WT N+ (C), TR N-/ TR N+ (D). Tissue abbreviations are as in Figure 3-5. Data
were visualized using the heatmapper plus program available at
http://bar.utoronto.ca/ntools/cgi-bin/ntools_heatmapper_plus.cgi. Yellow color indicates
no change in gene expression while red and blue indicate up and down-regulation,
respectively. nd indicates below quantifiable levels. Underline denotes statistical
significance at P = 0.05 for the differences between numerator and denominator used to
calculate the ratios in each panel.
98
responses by the two genotypes to N-stress correlated with the observed trends in PG
abundance (Figure 3-10, Figure 3-12).
3.4 Discussion
The Populus SUTs were found to cluster into the three phylogenetic groups established
for higher plant SUT genes. Within Group-1, SUTs from woody perennials, such as
Populus, cassava (Manihot esculenta), rubber tree, walnut, grape and castor bean form a
distinct subclade. The most ubiquitous and abundantly expressed SUT gene in Populus
encodes the Group-3 transporter PtSUT4 (Figure 3-4). Several Group-3 transporters such
as AtSUC4, HvSUT2 and LjSUT4 are tonoplast localized (Endler et al., 2006; Reinders
et al., 2008) and, like PtSUT4, are capable of sucrose transport across the plasma
membrane in yeast complementation experiments (Reinders et al., 2008; Weise et al.,
2000). No conserved peptide signal has been reported for any of the vacuolar targeting
proteins.
3.4.1 Group-1 members are vascular-localized in Populus
Group-1 PtSUT1/2 and PtSUT3 exhibited a pattern of stem vascular tissue expression that
differs from that of other Group-1 members. These include SUTs from apoplastic
(AtSUC2, LeSUT1, StSUT1, NtSUT1, PsSUT1) or both symplastic and apoplastic
(AmSUT1) loading herbaceous species (Barker et al., 2000; Knop et al., 2001; Riesmeier
et al., 1993; Riesmeier et al., 1994; Stadler et al., 1999; Tegeder et al., 1999). In all
99
these species, the Group-1 SUTs are well expressed in source leaves, where phloem
loading occurs. Similarly, Group-1 transporters of fruit-bearing woody perennials,
including VvSUC27 from grape (Davies et al., 1999) and CsSUT1 from citrus (Citrus
sinensis) are well expressed in both leaf and stem tissues (Li et al., 2003). However, the
Group-1 VvSUC27 protein has a lower affinity for sucrose than other Group-1 SUTs, and
is better expressed in expanding than in mature source leaves (Davies et al., 1999). The
plant-wide distribution of Group-1 PtSUT gene transcripts was similar to that of Group-1
SUT genes in castor bean and walnut (Bick et al., 1998; Decourteix et al., 2006). The
walnut Group-1 SUT, JrSUT1 is exclusively stem localized and thought to have a role in
the distribution of sucrose between xylem vessels and parenchyma cells for osmotic
pressure regulation during seasonal freeze-thaw cycles (Alves et al., 2004; Decourteix et
al., 2006). Sucrose enters the xylem sap during freeze-thaw cycles in Populus and Salix
as well (Sauter, 1983; Sauter, 1988). Therefore, preferential vascular expression of the
Group-1 PtSUTs, like that of the walnut Group-1 SUT, may be consistent with a
specialized function during seasonal freeze-thaw cycles.
3.4.2 Group-3 PtSUT4 exhibits an unusual expression pattern in Populus
So far, a small number of Group-3 SUT/SUC proteins, AtSUC4, StSUT4, LjSUT4,
LeSUT4, and VvSUC11, have been characterized, with only StSUT4 being subjected to
transgenic manipulation (Chincinska et al., 2008; Davies et al., 1999; Manning et al.,
2001; Reinders et al., 2008; Weise et al., 2000). While herbaceous Group-3 SUT proteins
(AtSUC4, LeSUT4 and LjSUT4) exhibit a low affinity for sucrose, VvSUC11 from the
100
woody perennial (grape) exhibits an affinity as high as that of Group-1 transporters from
the other species (Manning et al., 2001). However, VvSUC11 is not expressed in stems.
From the limited number of studies, it is unusual for Group-3 transporters that are well
expressed in leaf tissues to also be well expressed in stem tissues, as appears to be the
case for PtSUT4. Whereas the Group-3 grape SUT is not expressed in stems, the low-
sucrose-affinity Group-1 SUT, VvSUC27, is very strongly expressed there (Davies et al.,
1999). In Populus, PtSUT4 is far more strongly expressed in stems than is the Group-1
PtSUT cluster (Figure 3-5). With the exceptions of grape, and now Populus, Group-3
SUT transcript levels are higher in sink leaves, where sucrose unloading is likely to
predominate, than in source tissues, where loading occurs (Chincinska et al., 2008; Weise
et al., 2000). In short, the expression pattern of PtSUT4 overlays those of the high-affinity
Group-1 and Group-3 transporters of herbaceous species and grape, respectively (Barker
et al., 2000; Burkle et al., 1998; Davies et al., 1999; Riesmeier et al., 1993; Truernit and
Sauer, 1995).
Although mutation or down-regulation of abundantly expressed Group-1 SUTs in other
species (i.e., AtSUC2, StSUC1, NtSUC1) can result in severe alterations to plant growth
and carbohydrate utilization (Gottwald et al., 2000; Hackel et al., 2006; Riesmeier et al.,
1994; Srivastava et al., 2008), down-regulation of PtSUT4 in Populus resulted in modest
growth changes and increased accumulation of sugars and starch in mature leaves, but by
no more than 25% over the levels in wildtype plants (Figure 3-9). The expression of
SUT4 was reduced by 68% in mature leaves, whereas similar transcript level reductions
of StSUT1, NtSUT1 and LeSUT1 in antisense lines severely altered plant growth
101
(Burkle et al., 1998; Hackel et al., 2006; Riesmeier et al., 1994). Thus, the effects of
PtSUT4 manipulation were comparatively mild. The reduction in PtSUT4 transcripts was
not compensated by increased expression of other PtSUTs (Figure 3-12 A). In addition,
the only other SUT gene to exhibit significant transcript levels in mature leaves is
PtSUT5, which encodes a SUT protein that is highly distinct from PtSUT4 (Figure 3-5,
Table 3-2). These results, along with the other reports of severe repercussions from SUT
gene down-regulation, are consistent with the interpretation that PtSUT4 and PtSUT5
proteins somehow have complementary roles in sucrose export from source leaves.
3.4.3 Carbohydrate and phenylpropanoid metabolism are altered in PtSUT4
transgenics
The increased level of sucrose, glucose and starch in source leaves may be attributed to a
number of factors, including increased photosynthetic rates and carbohydrate synthesis,
inefficient utilization or inefficient export of the photosynthates. There is not strong
support for the idea that photosynthesis increased in the transgenics, as photosynthesis
was reduced in NtSUT1 and StSUT1 down-regulated plants (Burkle et al., 1998;
Riesmeier et al., 1994). The increased accumulation of sugars in mature leaves coupled
with the decrease in sink tissues, such as shoot tips and roots, suggests that sucrose export
from source leaves was less efficient in transgenic than wildtype plants. The increased
leaf:stem growth ratios in transgenic plants lends support to the idea that sucrose export
was indeed reduced, and that there were negative consequences to stem growth. An
alternative point is that the plants may be exporting at higher rates during the dark cycle
102
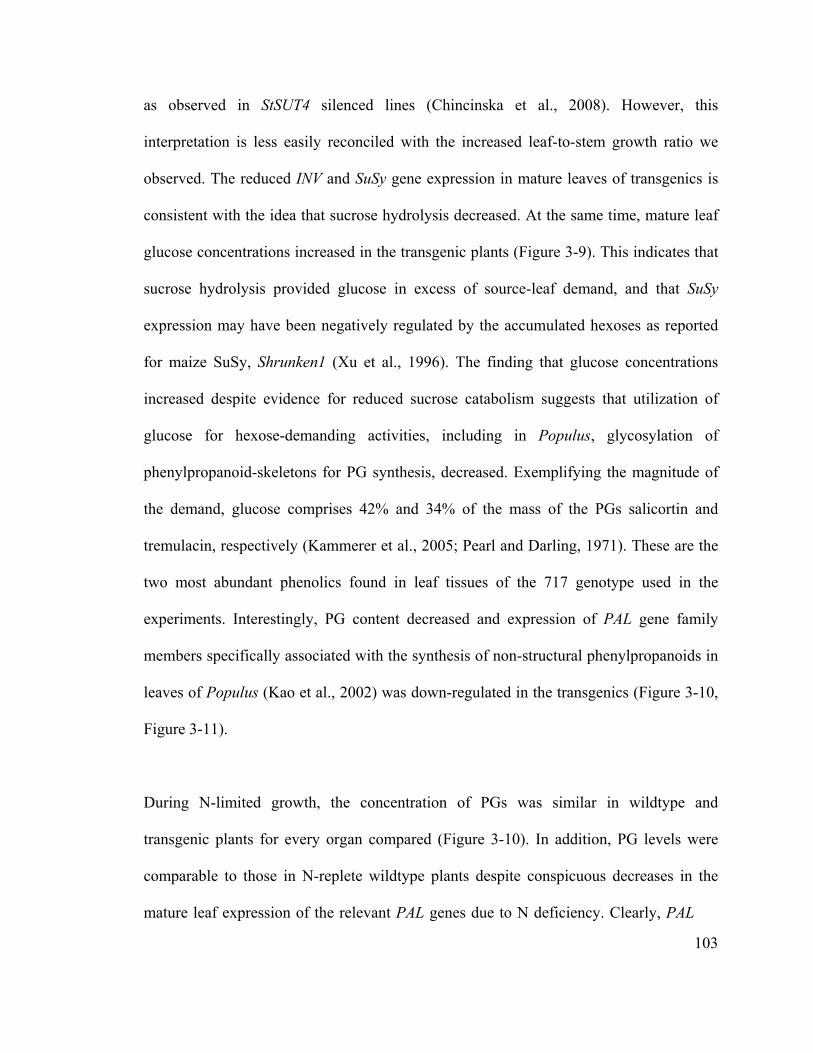
as observed in StSUT4 silenced lines (Chincinska et al., 2008). However, this
interpretation is less easily reconciled with the increased leaf-to-stem growth ratio we
observed. The reduced INV and SuSy gene expression in mature leaves of transgenics is
consistent with the idea that sucrose hydrolysis decreased. At the same time, mature leaf
glucose concentrations increased in the transgenic plants (Figure 3-9). This indicates that
sucrose hydrolysis provided glucose in excess of source-leaf demand, and that SuSy
expression may have been negatively regulated by the accumulated hexoses as reported
for maize SuSy, Shrunken1 (Xu et al., 1996). The finding that glucose concentrations
increased despite evidence for reduced sucrose catabolism suggests that utilization of
glucose for hexose-demanding activities, including in Populus, glycosylation of
phenylpropanoid-skeletons for PG synthesis, decreased. Exemplifying the magnitude of
the demand, glucose comprises 42% and 34% of the mass of the PGs salicortin and
tremulacin, respectively (Kammerer et al., 2005; Pearl and Darling, 1971). These are the
two most abundant phenolics found in leaf tissues of the 717 genotype used in the
experiments. Interestingly, PG content decreased and expression of PAL gene family
members specifically associated with the synthesis of non-structural phenylpropanoids in
leaves of Populus (Kao et al., 2002) was down-regulated in the transgenics (Figure 3-10,
Figure 3-11).
During N-limited growth, the concentration of PGs was similar in wildtype and
transgenic plants for every organ compared (Figure 3-10). In addition, PG levels were
comparable to those in N-replete wildtype plants despite conspicuous decreases in the
mature leaf expression of the relevant PAL genes due to N deficiency. Clearly, PAL
103
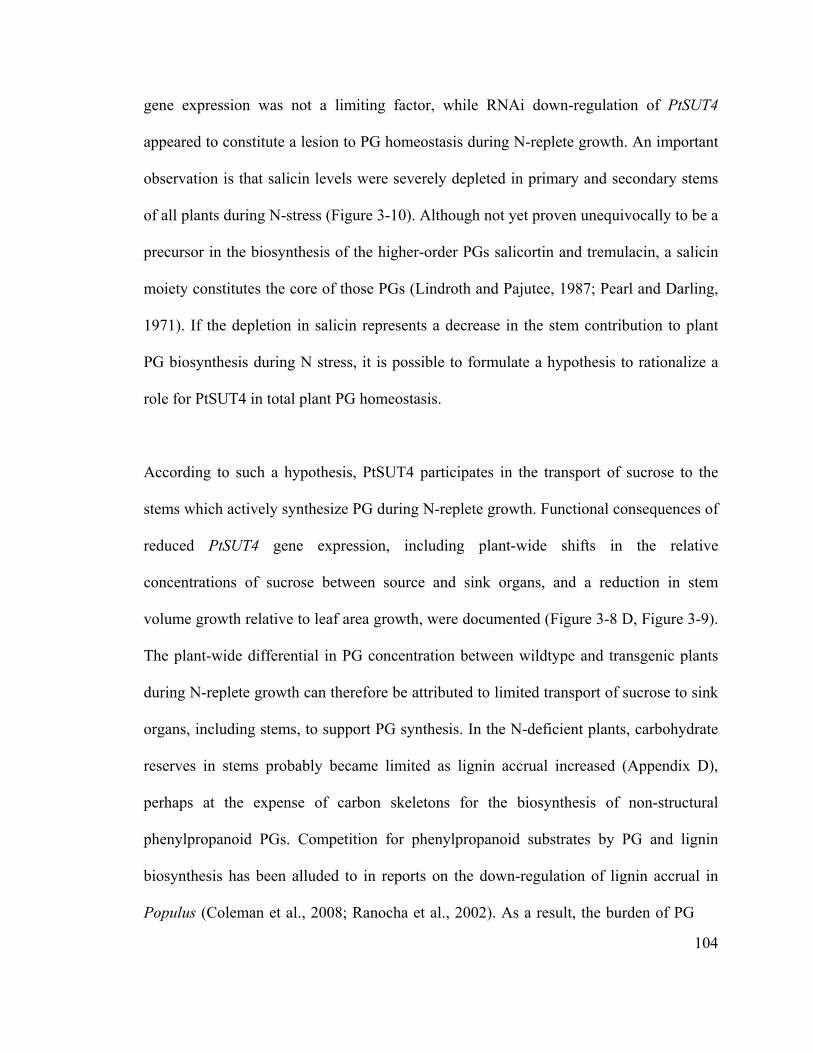
gene expression was not a limiting factor, while RNAi down-regulation of PtSUT4
appeared to constitute a lesion to PG homeostasis during N-replete growth. An important
observation is that salicin levels were severely depleted in primary and secondary stems
of all plants during N-stress (Figure 3-10). Although not yet proven unequivocally to be a
precursor in the biosynthesis of the higher-order PGs salicortin and tremulacin, a salicin
moiety constitutes the core of those PGs (Lindroth and Pajutee, 1987; Pearl and Darling,
1971). If the depletion in salicin represents a decrease in the stem contribution to plant
PG biosynthesis during N stress, it is possible to formulate a hypothesis to rationalize a
role for PtSUT4 in total plant PG homeostasis.
According to such a hypothesis, PtSUT4 participates in the transport of sucrose to the
stems which actively synthesize PG during N-replete growth. Functional consequences of
reduced PtSUT4 gene expression, including plant-wide shifts in the relative
concentrations of sucrose between source and sink organs, and a reduction in stem
volume growth relative to leaf area growth, were documented (Figure 3-8 D, Figure 3-9).
The plant-wide differential in PG concentration between wildtype and transgenic plants
during N-replete growth can therefore be attributed to limited transport of sucrose to sink
organs, including stems, to support PG synthesis. In the N-deficient plants, carbohydrate
reserves in stems probably became limited as lignin accrual increased (Appendix D),
perhaps at the expense of carbon skeletons for the biosynthesis of non-structural
phenylpropanoid PGs. Competition for phenylpropanoid substrates by PG and lignin
biosynthesis has been alluded to in reports on the down-regulation of lignin accrual in
Populus (Coleman et al., 2008; Ranocha et al., 2002). As a result, the burden of PG
104
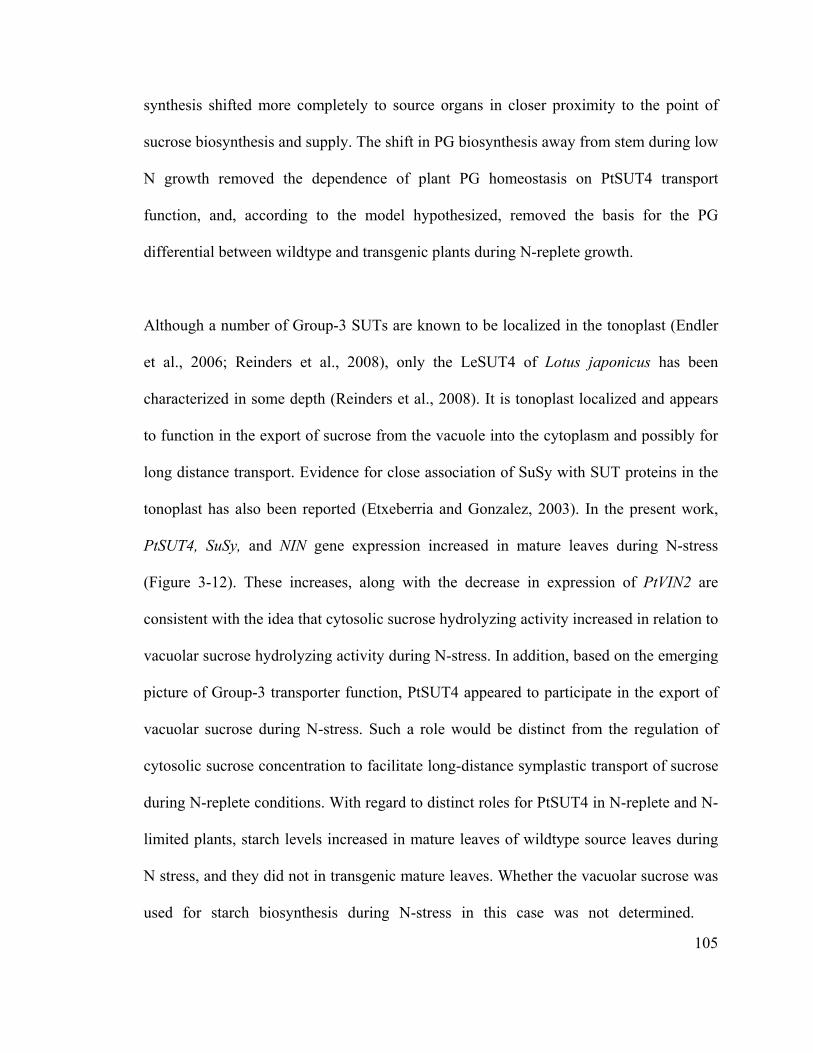
synthesis shifted more completely to source organs in closer proximity to the point of
sucrose biosynthesis and supply. The shift in PG biosynthesis away from stem during low
N growth removed the dependence of plant PG homeostasis on PtSUT4 transport
function, and, according to the model hypothesized, removed the basis for the PG
differential between wildtype and transgenic plants during N-replete growth.
Although a number of Group-3 SUTs are known to be localized in the tonoplast (Endler
et al., 2006; Reinders et al., 2008), only the LeSUT4 of Lotus japonicus has been
characterized in some depth (Reinders et al., 2008). It is tonoplast localized and appears
to function in the export of sucrose from the vacuole into the cytoplasm and possibly for
long distance transport. Evidence for close association of SuSy with SUT proteins in the
tonoplast has also been reported (Etxeberria and Gonzalez, 2003). In the present work,
PtSUT4, SuSy, and NIN gene expression increased in mature leaves during N-stress
(Figure 3-12). These increases, along with the decrease in expression of PtVIN2 are
consistent with the idea that cytosolic sucrose hydrolyzing activity increased in relation to
vacuolar sucrose hydrolyzing activity during N-stress. In addition, based on the emerging
picture of Group-3 transporter function, PtSUT4 appeared to participate in the export of
vacuolar sucrose during N-stress. Such a role would be distinct from the regulation of
cytosolic sucrose concentration to facilitate long-distance symplastic transport of sucrose
during N-replete conditions. With regard to distinct roles for PtSUT4 in N-replete and N-
limited plants, starch levels increased in mature leaves of wildtype source leaves during
N stress, and they did not in transgenic mature leaves. Whether the vacuolar sucrose was
used for starch biosynthesis during N-stress in this case was not determined.
105
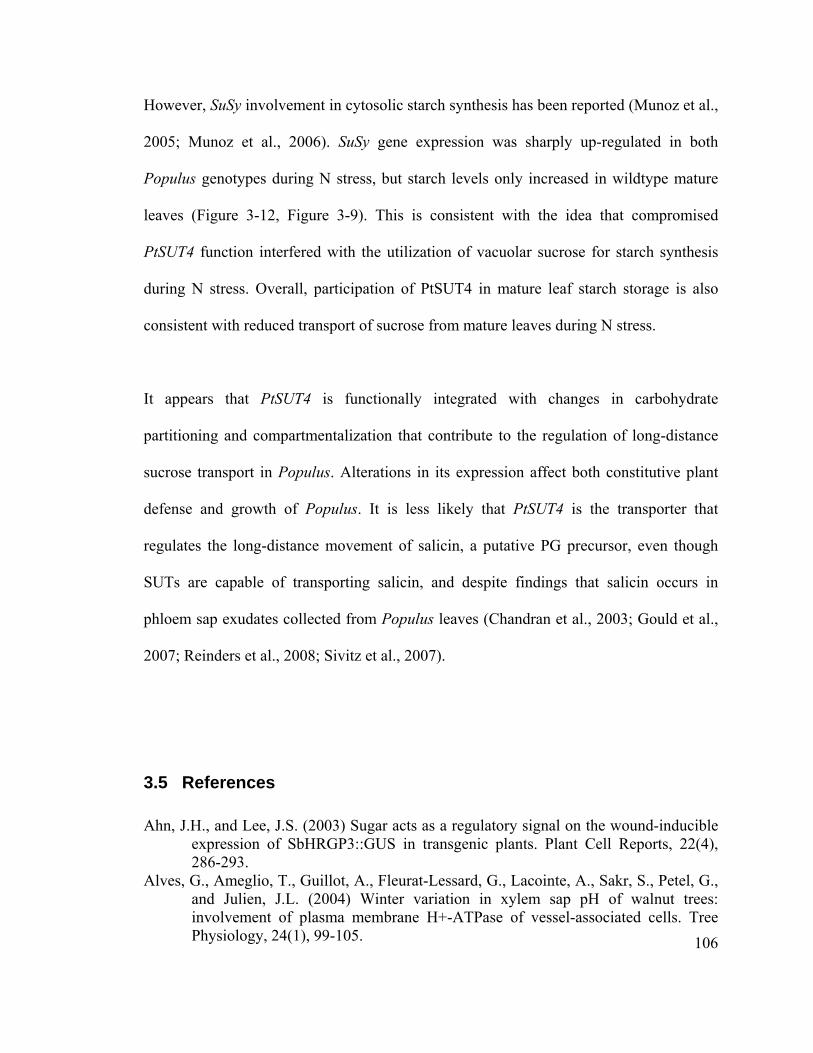
However, SuSy involvement in cytosolic starch synthesis has been reported (Munoz et al.,
2005; Munoz et al., 2006). SuSy gene expression was sharply up-regulated in both
Populus genotypes during N stress, but starch levels only increased in wildtype mature
leaves (Figure 3-12, Figure 3-9). This is consistent with the idea that compromised
PtSUT4 function interfered with the utilization of vacuolar sucrose for starch synthesis
during N stress. Overall, participation of PtSUT4 in mature leaf starch storage is also
consistent with reduced transport of sucrose from mature leaves during N stress.
It appears that PtSUT4 is functionally integrated with changes in carbohydrate
partitioning and compartmentalization that contribute to the regulation of long-distance
sucrose transport in Populus. Alterations in its expression affect both constitutive plant
defense and growth of Populus. It is less likely that PtSUT4 is the transporter that
regulates the long-distance movement of salicin, a putative PG precursor, even though
SUTs are capable of transporting salicin, and despite findings that salicin occurs in
phloem sap exudates collected from Populus leaves (Chandran et al., 2003; Gould et al.,
2007; Reinders et al., 2008; Sivitz et al., 2007).
3.5 References
Ahn, J.H., and Lee, J.S. (2003) Sugar acts as a regulatory signal on the wound-inducible expression of SbHRGP3::GUS in transgenic plants. Plant Cell Reports, 22(4), 286-293.
106
Alves, G., Ameglio, T., Guillot, A., Fleurat-Lessard, G., Lacointe, A., Sakr, S., Petel, G., and Julien, J.L. (2004) Winter variation in xylem sap pH of walnut trees: involvement of plasma membrane H+-ATPase of vessel-associated cells. Tree Physiology, 24(1), 99-105.
Aoki, N., Hirose, T., Scofield, G.N., Whitfeld, P.R., and Furbank, R.T. (2003) The sucrose transporter gene family in rice. Plant and Cell Physiology, 44(3), 223-232.
ArabidopsisGenomeInitiative. (2000) Analysis of the genome sequence of the flowering plant Arabidopsis thaliana. Nature, 408(6814), 796-815.
Arnold, T., Appel, H., Patel, V., Stocum, E., Kavalier, A., and Schultz, J. (2004) Carbohydrate translocation determines the phenolic content of Populus foliage: a test of the sink-source model of plant defense. New Phytologist, 164, 157-164.
Arnold, T.M., and Schultz, J.C. (2002) Induced sink strength as a prerequisite for induced tannin biosynthesis in developing leaves of Populus. Oecologia, 130, 585-593.
Barker, L., Kuhn, C., Weise, A., Schulz, A., Gebhardt, C., Hirner, B., Hellmann, H., Schulze, W., Ward, J.M., and Frommer, W.B. (2000) SUT2, a putative sucrose sensor in sieve elements. Plant Cell, 12(7), 1153-1164.
Barth, I., Meyer, S., and Sauer, N. (2003) PmSUC3: Characterization of a SUT2/SUC3-type sucrose transporter from Plantago major. Plant Cell, 15(6), 1375-1385.
Benjamini, Y., and Hochberg, Y. (1995) Controlling the false discovery rate: A practical and powerful approach to multiple testing. Journal of the Royal Statistical Society Series B, 57(1), 289-300.
Besseau, S., Hoffmann, L., Geoffroy, P., Lapierre, C., Pollet, B., and Legrand, M. (2007) Flavonoid accumulation in Arabidopsis repressed in lignin synthesis affects auxin transport and plant growth. Plant Cell, 19(1), 148-162.
Bick, J.A., Neelam, A., Smith, E., Nelson, S.J., Hall, J.L., and Williams, L.E. (1998) Expression analysis of a sucrose carrier in the germinating seedling of Ricinus communis. Plant Molecular Biology, 38(3), 425-435.
Bocock, P.N., Morse, A.M., Dervinis, C., and Davis, J.M. (2008) Evolution and diversity of invertase genes in Populus trichocarpa. Planta, 227(3), 565-576.
Boerjan, W., Ralph, J., and Baucher, M. (2003) Lignin biosynthesis. Annual Review of Plant Biology, 54, 519-546.
Bowles, D., Isayenkova, J., Lim, E.K., and Poppenberger, B. (2005) Glycosyltransferases: managers of small molecules. Current Opinion in Plant Biology, 8(3), 254-263.
Bowles, D.J., Lim, E.-K., Poppenberger, B., and Vaistij, F.E. (2006) Glycosyltransferases of lipophilic small molecules. Annual Review of Plant Biology, 57, 567-597.
Broeckling, C.D., Huhman, D.V., Farag, M.A., Smith, J.T., May, G.D., Mendes, P., Dixon, R.A., and Sumner, L.W. (2005) Metabolic profiling of Medicago truncatula cell cultures reveals the effects of biotic and abiotic elicitors on metabolism. Journal of Experimental Botany, 56(410), 323-336.
Bryant, J.P., Chapin III, F.S., and Klein, D.R. (1983) Carbon/nutrient balance of boreal plants in relation to vertebrate herbivory. Oikos, 40, 357-368.
Bryant, J.P., Reichardt, P.B., Clausen, T.P., and Werner, R.A. (1993) Effects of mineral nutrition on delayed inducible resistance in Alaska paper birch. Ecology, 74(7), 2072-2084.
Buchanan, B.B., Gruissem, W., and Jones, R.L. (2000) Biochemistry and molecular biology of plants, Rockville, MD, USA: American Society of Plant Physiologists, pp 1367.
107
Burkle, L., Hibberd, J.M., Quick, W.P., Kuhn, C., Hirner, B., and Frommer, W.B. (1998) The H+-sucrose cotransporter NtSUT1 is essential for sugar export from tobacco leaves. Plant Physiology, 118(1), 59-68.
Chandran, D., Reinders, A., and Ward, J.M. (2003) Substrate specificity of the Arabidopsis thaliana sucrose transporter AtSUC2. Journal of Biological Chemistry, 278(45), 44320-44325.
Chang, S.J., Puryear, J., and Cairney, J. (1993) A simple and efficient method for isolating RNA from pine trees. Plant Molecular Biology Reporter, 11, 113-116.
Chincinska, I.A., Liesche, J., Krugel, U., Michalska, J., Geigenberger, P., Grimm, B., and Kuhn, C. (2008) Sucrose transporter StSUT4 from potato affects flowering, tuberization, and shade avoidance response. Plant Physiology, 146(2), 515-528.
Chiou, T.J., and Bush, D.R. (1998) Sucrose is a signal molecule in assimilate partitioning. Proceedings of the National Academy of Sciences, USA, 95(23), 13997-13997.
Chow, P.S., and Landhausser, S.M. (2004) A method for routine measurements of total sugar and starch content in woody plant tissues. Tree Physiology, 24(10), 1129-1136.
Cleveland, W.S., and Devlin, S.J. (1988) Locally-weighted regression: an approach to regression analysis by local fitting. Journal of the American Statistical Association, 83(403), 596-610.
Coleman, H.D., Park, J.Y., Nair, R., Chapple, C., and Mansfield, S.D. (2008) RNAi-mediated suppression of p-coumaroyl-CoA 3'-hydroxylase in hybrid poplar impacts lignin deposition and soluble secondary metabolism. Proceedings of the National Academy of Sciences, USA, 105(11), 4501-4506.
Davies, C., Wolf, T., and Robinson, S.P. (1999) Three putative sucrose transporters are differentially expressed in grapevine tissues. Plant Science, 147(2), 93-100.
Dean, J.V., Mohammed, L.A., and Fitzpatrick, T. (2005) The formation, vacuolar localization, and tonoplast transport of salicylic acid glucose conjugates in tobacco cell suspension cultures. Planta, 221(2), 287-296.
Dean, J.V., Shah, R.P., and Mohammed, L.A. (2003) Formation and vacuolar localization of salicylic acid glucose conjugates in soybean cell suspension cultures. Physiologia Plantarum, 118, 328-336.
Decourteix, M., Alves, G., Brunel, N., Ameglio, T., Guilliot, A., Lemoine, R., Petel, G., and Sakr, S. (2006) JrSUT1, a putative xylem sucrose transporter, could mediate sucrose influx into xylem parenchyma cells and be up-regulated by freeze-thaw cycles over the autumn-winter period in walnut tree (Juglans regia L.). Plant Cell and Environment, 29(1), 36-47.
Dixon, R.A., and Paiva, N.L. (1995) Stress-induced phenylpropanoid metabolism. Plant Cell, 7(7), 1085-1097.
Doehlert, D.C. (1990) Fructokinases from developing maize kernels differ in their specificity for nucleoside triphosphates. Plant Physiology, 93(1), 353-355.
Dombrowski, K., and Alferman, A. (1992) Biotransformation of salicylic acid derivatives by plant cell suspension cultures. Planta Medica, 58, A576.
108
Donaldson, J.R., Kruger, E.L., and Lindroth, R.L. (2006a) Competition- and resource-mediated tradeoffs between growth and defensive chemistry in trembling aspen (Populus tremuloides). New Phytologist, 169(3), 561-570.
Donaldson, J.R., and Lindroth, R.L. (2004) Cottonwood leaf beetle (Coleoptera: Chrysomelidae) performance in relation to variable phytochemistry in juvenile aspen (Populus tremuloides Michx.). Environmental Entomology, 33(5), 1505-1511.
Donaldson, J.R., and Lindroth, R.L. (2007) Genetics, environment, and their interaction determine efficacy of chemical defense in trembling aspen. Ecology, 88(3), 729-739.
Donaldson, J.R., Stevens, M.T., Barnhill, H.R., and Lindroth, R.L. (2006b) Age-related shifts in leaf chemistry of clonal aspen (Populus tremuloides). Journal of Chemical Ecology, 32(7), 1415-1429.
Endler, A., Meyer, S., Schelbert, S., Schneider, T., Weschke, W., Peters, S.W., Keller, F., Baginsky, S., Martinoia, E., and Schmidt, U.G. (2006) Identification of a vacuolar sucrose transporter in barley and Arabidopsis mesophyll cells by a tonoplast proteomic approach. Plant Physiology, 141(1), 196-207.
Erwin, E.A., Turner, M.G., Lindroth, R.L., and Romme, W.H. (2001) Secondary plant compounds in seedling and mature aspen (Populus tremuloides) in Yellowstone National Park, Wyoming. American Midland Naturalist, 145(2), 299-308.
Etxeberria, E., and Gonzalez, P. (2003) Evidence for a tonoplast-associated form of sucrose synthase and its potential involvement in sucrose mobilization from the vacuole. Journal of Experimental Botany, 54(386), 1407-1414.
Farag, M.A., Huhman, D.V., Dixon, R.A., and Sumner, L.W. (2008) Metabolomics reveals novel pathways and differential mechanistic and elicitor-specific responses in phenylpropanoid and isoflavonoid biosynthesis in Medicago truncatula cell cultures. Plant Physiology, 146(2), 387-402.
Fernie, A.R., Carrari, F., and Sweetlove, L.J. (2004) Respiratory metabolism: glycolysis, the TCA cycle and mitochondrial electron transport. Current Opinion in Plant Biology, 7(3), 254-261.
Feugey, L., Strullu, D.-G., Poupard, P., and Simoneau, P. (1999) Induced defense responses limit Hartig net formation in ectomycorrhizal birch roots. New Phytologist, 144, 541-547.
Fischer, D.G., Hart, S.C., Rehill, B.J., Lindroth, R.L., Keim, P., and Whitham, T.G. (2006) Do high-tannin leaves require more roots? Oecologia, 149(4), 668-675.
Fox, G., Logue, S., Harasymow, S., Taylor, H., Ratcliffe, M., Roumeliotis, S., Onley, K., Tansing, P., Ferguson, R., Glennie-Holmes, M., Inkerman, A., Tarr, A., Evans, B., Panozzo, J., Osman, A., and Smith, A. (2001) Standardization of diastatic power method for barley breeding programs. Proceedings of the 10th Australian Barley Technical Symposium.
Funk, C., and Brodelius, P. (1990) Influence of growth regulators and an elicitor on phenylpropanoid metabolism in suspension cultures of Vanilla planifolia. Phytochemistry, 29(3), 845-848.
Gachon, C.M.M., Langlois-Meurinne, M., and Saindrenan, P. (2005) Plant secondary metabolism glycosyltransferases: the emerging functional analysis. Trends in Plant Science, 10(11), 542-549.
109
Gaille, C., Reimmann, C., and Haas, D. (2003) Isochorismate synthase (PchA), the first and rate-limiting enzyme in salicylate biosynthesis of Pseudomonas aeruginosa. Journal of Biological Chemistry, 278(19), 16893-16898.
Galeotti, F., Barile, E., Curir, P., Dolci, M., and Lanzotti, V. (2008) Flavonoids from carnation (Dianthus caryophyllus) and their antifungal activity. Phytochemistry Letters, 1(1), 44-48.
Gehring, C.A., Mueller, R.C., and Whitham, T.G. (2006) Environmental and genetic effects on the formation of ectomycorrhizal and arbuscular mycorrhizal associations in cottonwoods. Oecologia, 149(1), 158-164.
Geisler-Lee, J., Geisler, M., Coutinho, P.M., Segerman, B., Nishikubo, N., Takahashi, J., Aspeborg, H., Djerbi, S., Master, E., Andersson-Gunnerås, S., Sundberg, B., Karpinski, S., Teeri, T.T., Kleczkowski, L.A., Henrissat, B., and Mellerowicz, E.J. (2006) Poplar carbohydrate-active enzymes. Gene identification and expression analyses. Plant Physiology, 140(3), 946-962.
Gietz, R.D., and Woods, R.A. (2002) Transformation of yeast by lithium acetate/single-stranded carrier DNA/polyethylene glycol method. Guide to Yeast Genetics and Molecular and Cell Biology, Pt B, 350, 87-96.
Gomez-Ariza, J., Campo, S., Rufat, M., Estopa, M., Messeguer, J., San Segundo, B., and Coca, M. (2007) Sucrose-mediated priming of plant defense responses and broad-spectrum disease resistance by overexpression of the maize pathogenesis-related PRms protein in rice plants. Molecular Plant-Microbe Interactions, 20(7), 832-842.
Gottwald, J.R., Krysan, P.J., Young, J.C., Evert, R.F., and Sussman, M.R. (2000) Genetic evidence for the in planta role of phloem-specific plasma membrane sucrose transporters. Proceedings of the National Academy of Sciences, USA, 97, 13979-13984.
Gould, G.G., Jones, C.G., Rifleman, P., Perez, A., and Coleman, J.S. (2007) Variation in eastern cottonwood (Populus deltoides Bartr.) phloem sap content caused by leaf development may affect feeding site selection behavior of the aphid, Chaitophorous populicola Thomas (Homoptera:Aphididae). Environmental Entomology, 36, 1212-1225.
Greenaway, W., English, S., Whatley, F.R., and Rood, S.B. (1991) Interrelationships of poplars in a hybrid swarms as studied by gas chromatography-mass spectrometry. Canadian Journal of Botany, 69(1), 203-208.
Gueguen, V., Macherel, D., Jaquinod, M., Douce, R., and Bourguignon, J. (2000) Fatty acid and lipoic acid biosynthesis in higher plant mitochondria. Journal of Biological Chemistry, 275(7), 5016-5025.
Hackel, A., Schauer, N., Carrari, F., Fernie, A.R., Grimm, B., and Kuhn, C. (2006) Sucrose transporter LeSUT1 and LeSUT2 inhibition affects tomato fruit development in different ways. Plant Journal, 45(2), 180-192.
Hakulinen, J., Julkunentiitto, R., and Tahvanainen, J. (1995) Does nitrogen fertilization have an impact of the trade-off between willow growth and defensive secondary metabolism. Trees, 9(4), 235-240.
Harborne, J.B. (1980) Plant phenolics. In: Bell EA, Charlwood BV (eds) Encyclopedia of Plant Physiology, vol 8. Secondary plant products, Springer-Verlag, Berlin Heidelberg New York. pp:329-395.
110
Harding, S.A., Jiang, H., Jeong, M.L., Casado, F.L., Lin, H.-W., and Tsai, C.-J. (2005) Functional genomics analysis of foliar condensed tannin and phenolic glycoside regulation in natural cottonwood hybrids. Tree Physiology, 25, 1475-1486.
Haritatos, E., Medville, R., and Turgeon, R. (2000) Minor vein structure and sugar transport in Arabidopsis thaliana. Planta, 211(1), 105-111.
Hemming, J.D.C., and Lindroth, R.L. (1999) Effects of light and nutrient availability on aspen: Growth, phytochemistry, and insect performance. Journal of Chemical Ecology, 25(7), 1687-1714.
Herrmann, K.M., and Weaver, L.M. (1999) The shikimate pathway. Annual Review of Plant Physiology and Plant Molecular Biology, 50, 473-503.
Holsters, M., Dewaele, D., Depicker, A., Messens, E., Vanmontagu, M., and Schell, J. (1978) Transfection and transformation of Agrobacterium tumefaciens. Molecular & General Genetics, 163(2), 181-187.
Hostel, W. (1981) The biochemistry of plants. Academic press, Inc., New York, Vol. 7, pp. 725-753.
Hwang, S.Y., and Lindroth, R.L. (1997) Clonal variation in foliar chemistry of aspen: Effects on gypsy moth and forest tent caterpillar. Oecologia, 111, 99-108.
Ikemeyer, D., and Barz, W. (1989) Comparison of secondary product accumulation in photoautotrophic, photomixotrophic and heterotrophic Nicotiana tabacum cell suspension cultures. Plant Cell Reports, 8(8), 479-482.
Jones, C.G., and Hartley, S.E. (1999) A protein competition model of phenolic allocation. Oikos, 86(1), 27-44.
Jones, P., and Vogt, T. (2001) Glycosyltransferases in secondary plant metabolism: tranquilizers and stimulant controllers. Planta, 213(2), 164-174.
Julkunen-Tiitto, R. (1985) Chemotaxonomical screening of phenolic glycosides in northern willow twigs by capillary gas chromatography. Journal of Chromatography A, 324, 129-139.
Julkunen-Tiitto, R., and Sorsa, S. (2001) Testing the effects of drying methods on willow flavonoids, tannins, and salicylates. Journal of Chemical Ecology, 27(4), 779-789.
Kammerer, B., Kahlich, R., Biegert, C., Gleiter, C.H., and Heide, L. (2005) HPLC-MS/MS analysis of willow bark extracts contained in pharmaceutical preparations. Phytochemical Analysis, 16, 470-478.
Kao, Y.Y., Harding, S.A., and Tsai, C.J. (2002) Differential expression of two distinct phenylalanine ammonia-lyase genes in condensed tannin-accumulating and lignifying cells of quaking aspen. Plant Physiology, 130(2), 796-807.
Karnil, L., and Aloni, B. (2002) Fructokinase and hexokinase from pollen grains of bell pepper (Capsicum annuum L.): Possible role in pollen germination under conditions of high temperature and CO2 enrichment. Annals of Botany, 90(5), 607-612.
Kihara, T., Zhao, C.R., Kobayashi, Y., Takita, E., Kawazu, T., and Koyama, H. (2006) Simple identification of transgenic Arabidopsis plants carrying a single copy of the integrated gene. Bioscience Biotechnology and Biochemistry, 70(7), 1780-1783.
Kim, B.G., Kim, N.Y., Kim, J.H., Akimitsu, K., Chong, Y.H., and Ahn, J.H. (2009) Flavonoid O-diglucosyltransferase from rice: Molecular cloning and characterization. Journal of Plant Biology, 52(1), 41-48.
Kita, M., Hirata, Y., Moriguchi, T., Endo-Inagaki, T., Matsumoto, R., Hasegawa, S., Suhayda, C.G., and Omura, M. (2000) Molecular cloning and characterization of
111
a novel gene encoding limonoid UDP-glucosyltransferase in Citrus. FEBS Letters, 469(2-3), 173-178.
Kleiner, K.W., Raffa, K.F., and Dickson, R.E. (1999) Partitioning of 14C-labeled photosynthate to allelochemicals and primary metabolites in source and sink leaves of aspen: evidence for secondary metabolite turnover. Oecologia, 119(3), 408-418.
Kleiner, K.W., Raffa, K.F., Ellis, D.D., and McCown, B.H. (1998) Effect of nitrogen availability on the growth and phytochemistry of hybrid poplar and the efficacy of the Bacillus thuringiensis cry1A(a) d-endotoxin on gypsy moth. Canadian Journal of Forest Research, 28(7), 1055-1067.
Knop, C., Voitsekhovskaja, O., and Lohaus, G. (2001) Sucrose transporters in two members of the Scrophulariaceae with different types of transport sugar. Planta, 213(1), 80-91.
Koch, K. (2004) Sucrose metabolism: regulatory mechanisms and pivotal roles in sugar sensing and plant development. Current Opinion in Plant Biology, 7(3), 235-246.
Kolukisaoglu, H.U., Bovet, L., Klein, M., Eggmann, T., Geisler, M., Wanke, D., Martinoia, E., and Schulz, B. (2002) Family business: the multidrug-resistance related protein (MRP) ABC transporter genes in Arabidopsis thaliana. Planta, 216(1), 107-119.
Konishi, T., Ohmiya, Y., and Hayashi, T. (2004) Evidence that sucrose loaded into the phloem of a poplar leaf is used directly by sucrose synthase associated with various beta-glucan synthases in the stem. Plant Physiology, 134(3), 1146-1152.
Kuhn, C. (2003) A comparison of the sucrose transporter systems of different plant species. Plant Biology, 5(3), 215-232.
Kumar, S., Tamura, K., and Nei, M. (2004) MEGA3: Integrated software for molecular evolutionary genetics analysis and sequence alignment. Briefings in Bioinformatics, 5(2), 150-163.
Lalonde, S., Boles, E., Hellmann, H., Barker, L., Patrick, J.W., Frommer, W.B., and Ward, J.M. (1999) The dual function of sugar carriers: transport and sugar sensing. Plant Cell, 11, 707-726.
Lanot, A., Hodge, D., Lim, E.K., Vaistij, F.E., and Bowles, D.J. (2008) Redirection of flux through the phenylpropanoid pathway by increased glucosylation of soluble intermediates. Planta, 228(4), 609-616.
Larson, P.R., and Isebrands, J.G. (1971) The plastochron index as applied to developmental studies of cottonwood. Canadian Journal of Forest Research, 1, 1-11.
Lavola, A. (1998) Accumulation of flavonoids and related compounds in birch induced by UV-B irradiance. Tree Physiology, 18, 53-58.
Lee, X.Z., Liang, Y.R., Chen, H., Lu, J.L., Liang, H.L., Huang, F.P., and Mamati, E.G. (2008) Alleviation of UV-B stress in Arabidopsis using tea catechins. African Journal of Biotechnology, 7(22), 4111-4115.
Lewinsohn, E., and Gijzen, M. (2009) Phytochemical diversity: The sounds of silent metabolism. Plant Science, 176(2), 161-169.
112
Li, C.Y., Shi, J.X., Weiss, D., and Goldschmidt, E.E. (2003) Sugars regulate sucrose transporter gene expression in citrus. Biochemical and Biophysical Research Communications, 306(2), 402-407.
Lim, E.-K., Jackson, R.G., and Bowles, D.J. (2005) Identification and characterization of Arabidopsis glycosyltransferases capable of glucosylating coniferyl aldehyde and sinapyl aldehyde. FEBS Letters, 579(13), 2802-2806.
Lim, E.K., Doucet, C.J., Li, Y., Elias, L., Worrall, D., Spencer, S.P., Ross, J., and Bowles, D.J. (2002) The activity of Arabidopsis glycosyltransferases toward salicylic acid, 4-hydroxybenzoic acid, and other benzoates. Journal of Biological Chemistry, 277(1), 586-592.
Lindroth, R.L., Hsia, M.T.S., and Scriber, J.M. (1987a) Characterization of phenolic glycosides from quaking aspen. Biochemical Systematics and Ecology, 15(6), 677-680.
Lindroth, R.L., Hsia, M.T.S., and Scriber, J.M. (1987b) Seasonal patterns in the phytochemistry of 3 Populus species. Biochemical Systematics and Ecology, 15(6), 681-686.
Lindroth, R.L., and Hwang, S.Y. (1996) Clonal variation of foliar chemistry of quaking aspen (Populus tremuloides Michx.). Biochemical Systematics and Ecology, 24(5), 357-364.
Lindroth, R.L., and Pajutee, M.S. (1987) Chemical analysis of phenolic glycosides: art, facts, and artifacts. Oecologia, 74(1), 144-148.
Lloyd, G., and McCown, B. (1980) Commercially feasible micropropagation of mountain laurel Kalmia latifolia, by use of shoot-tip culture. International Plant Propagators Society Combined Proceedings, 30, 421-427.
Lloyd, J.C., and Zakhleniuk, O.V. (2004) Responses of primary and secondary metabolism to sugar accumulation revealed by microarray expression analysis of the Arabidopsis mutant, pho3. Journal of Experimental Botany, 55(400), 1221-1230.
Lu, Y.P., Li, Z.S., Drozdowicz, Y.M., Hortensteiner, S., Martinoia, E., and Rea, P.A. (1998) AtMRP2, an Arabidopsis ATP binding cassette transporter able to transport glutathione S-conjugates and chlorophyll catabolites: Functional comparisons with AtMRP1. Plant Cell, 10(2), 267-282.
Lu, Y.P., Li, Z.S., and Rea, P.A. (1997) AtMRP1 gene of Arabidopsis encodes a glutathione S-conjugate pump: Isolation and functional definition of a plant ATP-binding cassette transporter gene. Proceedings of the National Academy of Sciences, USA, 94(15), 8243-8248.
Lucheta, A.R., Silva-Pinhati, A.C.O., Basilio-Palmieri, A.C., Berger, I.J., Freitas-Astua, J., and Cristofani, M. (2007) An in silico analysis of the key genes involved in flavonoid biosynthesis in Citrus sinensis. Genetics and Molecular Biology, 30(3), 819-831.
Lunkenbein, S., Bellido, M., Aharoni, A., Salentijn, E.M.J., Kaldenhoff, R., Coiner, H.A., Muñoz-Blanco, J., and Schwab, W. (2006) Cinnamate metabolism in ripening fruit. Characterization of a UDP-glucose:cinnamate glucosyltransferase from strawberry. Plant Physiology, 140(3), 1047-1058.
Luo, K.M., Harding, S.A., and Tsai, C.J. (2008) A modified T-vector for simplified assembly of hairpin RNAi constructs. Biotechnology Letters, 30(7), 1271-1274.
113
Ma, C., Strauss, S., and Meilan, R. (2004) Agrobacterium-mediated transformation of the genome-sequenced poplar clone, 'Nisqually-1' (Populus trichocarpa). Plant Molecular Biology Reporter, 22, 311-312.
Mahdi, J.G., Mahdi, A.J., and Bowen, I.D. (2006) The historical analysis of aspirin discovery, its relation to the willow tree and antiproliferative and anticancer potential. Cell Proliferation, 39(2), 147-155.
Manning, K., Davies, C., Bowen, H.C., and White, P.J. (2001) Functional characterization of two ripening-related sucrose transporters from grape berries. Annals of Botany, 87(1), 125-129.
Matsui, K., Tanaka, H., and Ohme-Takagi, M. (2004) Suppression of the biosynthesis of proanthocyanidin in Arabidopsis by a chimeric PAP1 repressor. Plant Biotechnology Journal, 2(6), 487-493.
Matsumoto, T., Nishida, K., Noguchi, M., and Tamaki, E. (1973) Some factors affecting the anthocyanin formation by Populus cells in suspension culture. Agricultural and Biological Chemistry, 37, 561-567.
McDonald, E.P., Agrell, J., and Lindroth, R.L. (1999) CO2 and light effects on deciduous trees: growth, foliar chemistry, and insect performance. Oecologia, 119(3), 389-399.
Meier, B., Lehmann, D., Sticher, O., and Bettschart, A. (1987) Salicylate in Arzneipflanzen: screening methoden (HPLC, DC) zum nachweis. Deutsche Apotheker Zeitung, 127, 2401-2407.
Meßner, B., Thulke, O., and Schäffner, A.R. (2003) Arabidopsis glucosyltransferases with activities toward both endogenous and xenobiotic substrates. Planta, 217, 138-146.
Meyer, S., Lauterbach, C., Niedermeier, M., Barth, I., Sjolund, R.D., and Sauer, N. (2004) Wounding enhances expression of AtSUC3, a sucrose transporter from Arabidopsis sieve elements and sink tissues. Plant Physiology, 134, 684-693.
Mizukami, H., Terao, T., Amano, A., and Ohashi, H. (1986) Glucosylation of salicyl alcohol by Gardenia jasminoides cell cultures. Plant and Cell Physiology, 27(4), 645-650.
Morse, A.M., Tschaplinski, T.J., Dervinis, C., Pijut, P.M., Schmelz, E.A., Day, W., and Davis, J.M. (2007) Salicylate and catechol levels are maintained in nahG transgenic poplar. Phytochemistry, 68(15), 2043-2052.
Munoz, F.J., Baroja-Fernandez, E., Moran-Zorzano, M.T., Viale, A.M., Etxeberria, E., Alonso-Casajus, N., and Pozueta-Romero, J. (2005) Sucrose synthase controls both intracellular ADP glucose levels and transitory starch biosynthesis in source leaves. Plant and Cell Physiology, 46(8), 1366-1376.
Munoz, F.J., Zorzano, M.T.M., Alonso-Casajus, N., Baroja-Fernandez, E., Etxeberria, E., and Pozueta-Romero, J. (2006) New enzymes, new pathways and an alternative view on starch biosynthesis in both photosynthetic and heterotrophic tissues of plants. Biocatalysis and Biotransformation, 24(1-2), 63-76.
Naoumkina, M., Farag, M.A., Sumner, L.W., Tang, Y.H., Liu, C.J., and Dixon, R.A. (2007) Different mechanisms for phytoalexin induction by pathogen and wound signals in Medicago truncatula. Proceedings of the National Academy of Sciences, USA, 104(46), 17909-17915.
114
Nichols-Orians, C.M., Fritz, R.S., and Clausen, T.P. (1993) The genetic basis for variation in the concentration of phenolic glycosides in Salix sericea: Clonal variation and sex-based differences. Biochemical Systematics and Ecology, 21(5), 535-542.
Northup, R.R., Dahlgren, R.A., and McColl, J.G. (1998) Polyphenols as regulators of plant-litter-soil interactions in northern California's pygmy forest: A positive feedback? Biogeochemistry, 42(1-2), 189-220.
Ohkatsu, Y., Kubota, S., and Sato, T. (2008) Antioxidant and photo-antioxidant activities of phenylpropanoids. Journal of the Japan Petroleum Institute, 51(6), 348-355.
Orians, C.M., and Fritz, R.S. (1995) The effect of hybridization between two Salix species on foliar chemistry. Journal of Chemical Ecology, 21(9), 1245-1253.
Orians, C.M., Griffiths, M.E., Roche, B.M., and Fritz, R.S. (2000) Phenolic glycosides and condensed tannins in Salix sericea, S. eriocephala and their F1 hybrids: not all hybrids are created equal. Biochemical Systematics and Ecology, 28(7), 619-632.
Osier, T.L., and Lindroth, R.L. (2006) Genotype and environment determine allocation to and costs of resistance in quaking aspen. Oecologia, 148(2), 293-303.
Pasteels, J.M., Rowell-Rahier, M., Braekman, J.C., and Dupont, A. (1983) Salicin from host plant as precursor of salicylaldehyde in defensive secretion of chrysomeline larvae. Physiological Entomology, 8, 307-314.
Pearl, I.A., and Darling, S.F. (1971) The structures of salicortin and tremulacin. Phytochemistry, 10, 3161-3166.
Petersen, M. (2007) Current status of metabolic phytochemistry. Phytochemistry, 68(22-24), 2847-2860.
Pierpoint, W.S. (1994) Salicylic acid and its derivatives in plants: Medicines, metabolites and messenger molecules. Advances in Botanical Research, 20, 163-235.
Porter, L.J., Hrstich, L.N., and Chan, B.G. (1986) The conversion of procyanidins and prodelphinidins to cyanidin and delphinidin. Phytochemistry, 25(1), 223-230.
Pridham, J.B., and Saltmarsh, M.J. (1963) The biosynthesis of phenolic glucosides in plants. Biochemical Journal, 87(1), 218-224.
Ranjan, P., Kao, Y.Y., Jiang, H.Y., Joshi, C.P., Harding, S.A., and Tsai, C.J. (2004) Suppression subtractive hybridization-mediated transcriptome analysis from multiple tissues of aspen (Populus tremuloides) altered in phenylpropanoid metabolism. Planta, 219(4), 694-704.
Ranocha, P., Chabannes, M., Chamayou, S., Danoun, S., Jauneau, A., Boudet, A.-M., and Goffner, D. (2002) Laccase down-regulation causes alterations in phenolic metabolism and cell wall structure in poplar. Plant Physiology, 129(1), 145-155.
Rea, P.A. (2007) Plant ATP-Binding cassette transporters. Annual Review of Plant Biology, 58, 347-375.
Rehill, B., Clauss, A., Wieczorek, L., Whitham, T., and Lindroth, R. (2005) Foliar phenolic glycosides from Populus fremontii, Populus angustifolia, and their hybrids. Biochemical Systematics and Ecology, 33(2), 125-131.
Reinders, A., Sivitz, A.B., Starker, C.G., Gantt, J.S., and Ward, J.M. (2008) Functional analysis of LjSUT4, a vacuolar sucrose transporter from Lotus japonicus. Plant Molecular Biology, 68(3), 289-299.
Reinders, A., and Ward, J.M. (2001) Functional characterization of the alpha-glucoside transporter Sut1p from Schizosaccharomyces pombe, the first fungal homologue of plant sucrose transporters. Molecular Microbiology, 39(2), 445-454.
115
Rentsch, D., Laloi, M., Rouhara, I., Schmelzer, E., Delrot, S., and Frommer, W.B. (1995) NTR1 encodes a high-affinity oligopeptide transporter in Arabidopsis. FEBS Letters, 370(3), 264-268.
Riesmeier, J.W., Hirner, B., and Frommer, W.B. (1993) Potato sucrose transporter expression in minor veins indicates a role in phloem loading. Plant Cell, 5(11), 1591-1598.
Riesmeier, J.W., Willmitzer, L., and Frommer, W.B. (1992) Isolation and characterization of a sucrose carrier cDNA from spinach by functional expression in yeast. EMBO Journal, 11(13), 4705-4713.
Riesmeier, J.W., Willmitzer, L., and Frommer, W.B. (1994) Evidence for an essential role of the sucrose transporter in phloem loading and assimilate portioning. EMBO Journal, 13(1), 1-7.
Rolland, F., Moore, B., and Sheen, J. (2002) Sugar sensing and signaling in plants. Plant Cell, 14, S185-S205.
Ross, J., Li, Y., Lim, E.-K., and Bowles D.J. (2001) Higher plant glycosyltransferases. Genome Biology, 2(2), 3004.3006.
Ruohomaki, K., Chapin, F.S., Haukioja, E., Neuvonen, S., and Suomela, J. (1996) Delayed inducible resistance in mountain birch in response to fertilization and shade. Ecology, 77(8), 2302-2311.
Russin, W.A., and Evert, R.F. (1985) Studies on the leaf of Populus deltoides (Salicaceae): Ultrastructure, plasmodesmatal frequency, and solute concentrations. American Journal of Botany, 72(8), 1232-1247.
Ruuhola, T., and Julkunen-Tiitto, R. (2003) Trade-off between synthesis of salicylates and growth of micropropagated Salix pentandra. Journal of Chemical Ecology, 29(7), 1565-1588.
Ruuhola, T., Julkunen-Tiitto, R., and Vainiotalo, P. (2003) In vitro degradation of willow salicylates. Journal of Chemical Ecology, 29(5), 1083-1097.
Ruuhola, T., Sipura, M., Nousiainen, O., and Tahvanainen, J. (2001) Systemic induction of salicylates in Salix myrsinifolia (Salisb.). Annals of Botany, 88(3), 483-497.
Ruuhola, T.M., and Julkunen-Tiitto, M.-R.K. (2000) Salicylates of intact Salix myrsinifolia plantlets do not undergo rapid metabolic turnover. Plant Physiology, 122, 895-905.
Sato, M., and Hasegawa, M. (1971) Metabolism of coumarins in Daphne odora. 2. Transglucosylase in Daphne odora converting daphnin to daphnetin 8-glucoside. Phytochemistry, 10(10), 2367-&.
Sato, M., and Hasegawa, M. (1972) Metabolism of coumarins in Daphne odora.3. Biosynthesis of dihydroxycoumarins in Daphne odora and Cichorium intybus. Phytochemistry, 11(2), 657-&.
Sauer, N. (2007) Molecular physiology of higher plant sucrose transporters. FEBS Letters, 581(12), 2309-2317.
Sauter, J.J. (1983) Efflux and reabsorption of sugars in the xylem. 2. Seasonal changes in sucrose uptake in Salix. Zeitschrift Fur Pflanzenphysiologie, 111(5), 429-440.
Sauter, J.J. (1988) Temparature-induced changes in starch and sugars in the stems of Populus × canademis “robusta”. Journal of Plant Physiology, 132(5), 608-612.
Schmitt, B., Stadler, R., and Sauer, N. (2008) Immunolocalization of solanaceous SUT1 proteins in companion cells and xylem parenchyma: New perspectives for phloem loading and transport. Plant Physiology, 148(1), 187-199.
Schulze, W., Weise, A., Frommer, W.B., and Ward, J.M. (2000) Function of the cytosolic
116
N-terminus of sucrose transporter AtSUT2 in substrate affinity. FEBS Letters, 485(2-3), 189-194.
Schweitzer, J.A., Bailey, J.K., Rehill, B.J., Martinsen, G.D., Hart, S.C., Lindroth, R.L., Keim, P., and Whitham, T.G. (2004) Genetically based trait in a dominant tree affects ecosystem processes. Ecology Letters, 7(2), 127-134.
Schweitzer, J.A., Madritch, M.D., Bailey, J.K., LeRoy, C.J., Fischer, D.G., Rehill, B.J., Lindroth, R.L., Hagerman, A.E., Wooley, S.C., Hart, S.C., and Whitham, T.G. (2008) From genes to ecosystems: The genetic basis of condensed tannins and their role in nutrient regulation in a Populus model system. Ecosystems, 11(6), 1005-1020.
Seigler, D. (1998) Plant Secondary Metabolism. Kluwer, Boston, MA, U.S.A. Sherma, J., and Zulick, D. (1996) Determination of fructose, glucose, and sucrose in
beverages by high-performance thin-layer chromatography. Acta Chromatographica, 6, 7-13.
Shimoda, K., Yamane, S., Hirakawa, H., Ohta, S., and Hirata, T. (2002) Biotransformation of phenolic compounds by the cultured cells of Catharanthus roseus. Journal of Molecular Catalysis B-Enzymatic, 16(5-6), 275-281.
Sivitz, A.B., Reinders, A., Johnson, M.E., Krentz, A.D., Grof, C.P.L., Perroux, J.M., and Ward, J.M. (2007) Arabidopsis sucrose transporter AtSUC9. High-affinity transport activity, intragenic control of expression, and early flowering mutant phenotype. Plant Physiology, 143(1), 188-198.
Sivitz, A.B., Reinders, A., and Ward, J.M. (2005) Analysis of the transport activity of barley sucrose transporter HvSUT1. Plant and Cell Physiology, 46(10), 1666-1673.
Solfanelli, C., Poggi, A., Loreti, E., Alpi, A., and Perata, P. (2006) Sucrose-specific induction of the anthocyanin biosynthetic pathway in Arabidopsis. Plant Physiology, 140, 637-646.
Srivastava, A.C., Ganesan, S., Ismail, I.O., and Ayre, B.G. (2008) Functional characterization of the Arabidopsis AtSUC2 sucrose/H+ symporter by tissue-specific complementation reveals an essential role in phloem loading but not in long-distance transport. Plant Physiology, 148(1), 200-211.
Stadler, R., and Sauer, N. (1996) The Arabidopsis thaliana AtSUC2 gene is specifically expressed in companion cells. Botanica Acta, 109, 299-306.
Stadler, R., Truernit, E., Gahrtz, M., and Sauer, N. (1999) The AtSUC1 sucrose carrier may represent the osmotic driving force for anther dehiscence and pollen tube growth in Arabidopsis. Plant Journal, 19(3), 269-278.
Stevens, M.T., and Lindroth, R.L. (2005) Induced resistance in the indeterminate growth of aspen (Populus tremuloides). Oecologia, 145, 298-306.
Stevens, M.T., Waller, D.M., and Lindroth, R.L. (2007) Resistance and tolerance in Populus tremuloides: genetic variation, costs, and environmental dependency. Evolutionary Ecology, 21, 829-847.
Sturm, A. (1999) Invertases, primary structures, functions, and roles in plant development and sucrose partitioning. Plant Physiology, 121, 1-7.
117
Tabata, M., Ikeda, F., Hiraoka, N., and Konoshima, M. (1976) Glucosylation of phenolic compounds by Datura innoxia suspension cultures. Phytochemistry, 15, 1225-1229.
Taiz, L., and Zeiger, E. (1998) Plant Physiology. Second Edition, Sinauer Associates, Sunderland, Massachusetts, pp 792.
Tegeder, M., Wang, X.D., Frommer, W.B., Offler, C.E., and Patrick, J.W. (1999) Sucrose transport into developing seeds of Pisum sativum L. Plant Journal, 18(2), 151-161.
Teng, S., Keurentjes, J., Bentsink, L., Koornneef, M., and Smeekens, S. (2005) Sucrose-specific induction of anthocyanin biosynthesis in Arabidopsis requires the MYB75/PAP1 gene. Plant Physiology, 139, 1840-1852.
Tiarks, A., Meier, C., Flagler, R., and Steynberg, E. (1992) Sequential extraction of condensed tannins from pine litter at different stages of decomposition. In Plant Polyphenols. Eds. R.E. Hemingway and P.E. Laks. Plenum Press, New York, pp 597-608.
Truernit, E., and Sauer, N. (1995) The promoter of the Arabidopsis thaliana SUC2 sucrose-H+ symporter gene directs expression of beta-glucuronidase to the phloem: evidence for phloem loading and unloading by SUC2. Planta, 196(3), 564-570.
Tsai, C.-J., Harding, S.A., Tschaplinski, T.J., Lindroth, R.L., and Yuan, Y. (2006a) Genome-wide analysis of the structural genes regulating defense phenylpropanoid metabolism in Populus. New Phytologist, 172(1), 47-62.
Tsai, C.-J., Kayal, W.E., and Harding, S.A. (2006b) Populus, the new model system for investigating phenylpropanoid complexity. International Journal of Applied Science and Engineering, 4(3), 221-233.
Turgeon, R. (2000) Plasmodesmata and solute exchange in the phloem. Australian Journal of Plant Physiology, 27(6), 521-529.
Turgeon, R. (2006) Phloem loading: How leaves gain their independence. Bioscience, 56(1), 15-24.
Turgeon, R., and Medville, R. (1998) The absence of phloem loading in willow leaves. Proceedings of the National Academy of Sciences, USA, 95(20), 12055-12060.
118
Tuskan, G.A., DiFazio, S., Jansson, S., Bohlmann, J., Grigoriev, I., Hellsten, U., Putnam, N., Ralph, S., Rombauts, S., Salamov, A., Schein, J., Sterck, L., Aerts, A., Bhalerao, R.R., Bhalerao, R.P., Blaudez, D., Boerjan, W., Brun, A., Brunner, A., Busov, V., Campbell, M., Carlson, J., Chalot, M., Chapman, J., Chen, G.L., Cooper, D., Coutinho, P.M., Couturier, J., Covert, S., Cronk, Q., Cunningham, R., Davis, J., Degroeve, S., Dejardin, A., Depamphilis, C., Detter, J., Dirks, B., Dubchak, I., Duplessis, S., Ehlting, J., Ellis, B., Gendler, K., Goodstein, D., Gribskov, M., Grimwood, J., Groover, A., Gunter, L., Hamberger, B., Heinze, B., Helariutta, Y., Henrissat, B., Holligan, D., Holt, R., Huang, W., Islam-Faridi, N., Jones, S., Jones-Rhoades, M., Jorgensen, R., Joshi, C., Kangasjarvi, J., Karlsson, J., Kelleher, C., Kirkpatrick, R., Kirst, M., Kohler, A., Kalluri, U., Larimer, F., Leebens-Mack, J., Leple, J.C., Locascio, P., Lou, Y., Lucas, S., Martin, F., Montanini, B., Napoli, C., Nelson, D.R., Nelson, C., Nieminen, K., Nilsson, O., Pereda, V., Peter, G., Philippe, R., Pilate, G., Poliakov, A., Razumovskaya, J., Richardson, P., Rinaldi, C., Ritland, K., Rouze, P., Ryaboy, D., Schmutz, J., Schrader, J., Segerman, B., Shin, H., Siddiqui, A., Sterky, F., Terry, A., Tsai, C.J., Uberbacher, E., Unneberg, P., et al. (2006) The genome of black cottonwood, Populus trichocarpa (Torr. & Gray). Science, 313(5793), 1596-1604.
van Tegelen, L.J.P., Moreno, P.R.H., Croes, A.F., Verpoorte, R., and Wullems, G.J. (1999) Purification and cDNA cloning of isochorismate synthase from elicited cell cultures of Catharanthus roseus. Plant Physiology, 119(2), 705-712.
Verma, A., Chaudhary, U., Rakesh, K., Pant, A., Gaur, A., and Lakhchaura, B. (2000) Anthocyanin, bisabolol and phenylammonialyase activity in cell cultures of Populus deltoides. Indian Journal of Experimental Biology, 38, 1050-1053.
Walczak, H.A., and Dean, J.V. (2000) Vacuolar transport of the glutathione conjugate of trans-cinnamic acid. Phytochemistry, 53(4), 441-446.
Weise, A., Barker, L., Kuhn, C., Lalonde, S., Buschmann, H., Frommer, W.B., and Ward, J.M. (2000) A new subfamily of sucrose transporters, SUT4, with low affinity/high capacity localized in enucleate sieve elements of plants. Plant Cell, 12(8), 1345-1355.
Weisshaar, B., and Jenkins, G.I. (1998) Phenylpropanoid biosynthesis and its regulation. Current Opinion in Plant Biology, 1(3), 251-257.
Wildermuth, M.C., Dewdney, J., Wu, G., and Ausubel, F.M. (2001) Isochorismate synthase is required to synthesize salicylic acid for plant defense. Nature, 414(6863), 562-565.
Williams, L.E., Lemoine, R., and Sauer, N. (2000) Sugar transporters in higher plants - a diversity of roles and complex regulation. Trends in Plant Science, 5(7), 283-290.
Wink, M., and Hartmann, T. (1980) Production of quinolizidiine alkaloids by photomixotrophic cell suspension cultures - Biochemical and biogenetic aspects. Planta Medica, 40(2), 149-155.
Winkel-Shirley, B. (2002) Biosynthesis of flavonoids and effects of stress. Current Opinion in Plant Biology, 5(3), 218-223.
Xu, J., Avigne, W.T., McCarty, D.R., and Koch, K.E. (1996) A similar dichotomy of sugar modulation and developmental expression affects both paths of sucrose metabolism: Evidence from a maize invertase gene family. Plant Cell, 8(7), 1209-1220.
Yang, Y.H., Dudoit, S., Luu, P., Lin, D.M., Peng, V., Ngai, J., and Speed, T.P. (2002) Normalization for cDNA microarray data: a robust composite method addressing single and multiple slide systematic variation. Nucleic Acids Research, 30(4).
119
Yu, J., Hu, S.N., Wang, J., Wong, G.K.S., Li, S.G., Liu, B., Deng, Y.J., Dai, L., Zhou, Y., Zhang, X.Q., Cao, M.L., Liu, J., Sun, J.D., Tang, J.B., Chen, Y.J., Huang, X.B., Lin, W., Ye, C., Tong, W., Cong, L.J., Geng, J.N., Han, Y.J., Li, L., Li, W., Hu, G.Q., Huang, X.G., Li, W.J., Li, J., Liu, Z.W., Liu, J.P., Qi, Q.H., Liu, J.S., Li, T., Wang, X.G., Lu, H., Wu, T.T., Zhu, M., Ni, P.X., Han, H., Dong, W., Ren, X.Y., Feng, X.L., Cui, P., Li, X.R., Wang, H., Xu, X., Zhai, W.X., Xu, Z., Zhang, J.S., He, S.J., Zhang, J.G., Xu, J.C., Zhang, K.L., Zheng, X.W., Dong, J.H., Zeng, W.Y., Tao, L., Ye, J., Tan, J., Ren, X.D., Chen, X.W., He, J., Liu, D.F., Tian, W., Tian, C.G., Xia, H.G., Bao, Q.Y., Li, G., Gao, H., Cao, T., Zhao, W.M., Li, P., Chen, W., Wang, X.D., Zhang, Y., Hu, J.F., Liu, S., Yang, J., Zhang, G.Y., Xiong, Y.Q., Li, Z.J., Mao, L., Zhou, C.S., Zhu, Z., Chen, R.S., Hao, B.L., Zheng, W.M., Chen, S.Y., Guo, W., Li, G.J., Liu, S.Q., Tao, M., Zhu, L.H., Yuan,
Ylstra, B., Touraev, A., Moreno, R.M.B., Stoger, E., Vantunen, A.J., Vicente, O., Mol, J.N.M., and Heberlebors, E. (1992) Flavonols stimulate development, germination and tube growth of tobacco pollen. Plant Physiology, 100(2), 902-907.
L.P., and Yang, H.M. (2002) A draft sequence of the rice genome (Oryza sativa L. ssp indica). Science, 296(5565), 79-92.
Zenk, M.H. (1967) Pathways of salicyl alcohol and salicin formation in Salix purpurea L. Phytochemistry, 6, 245-252.
Zhang, Y.L., Meng, Q.Y., Zhu, H.L., Guo, Y., Gao, H.Y., Luo, Y.B., and Lu, J.A. (2008) Functional characterization of a LAHC sucrose transporter isolated from grape berries in yeast. Plant Growth Regulation, 54, 71-79.
Zhou, Y.C., Chan, K., Wang, T.L., Hedley, C.L., Offler, C.E., and Patrick, J.W. (2009) Intracellular sucrose communicates metabolic demand to sucrose transporters in developing pea cotyledons. Journal of Experimental Botany, 60(1), 71-85.
120
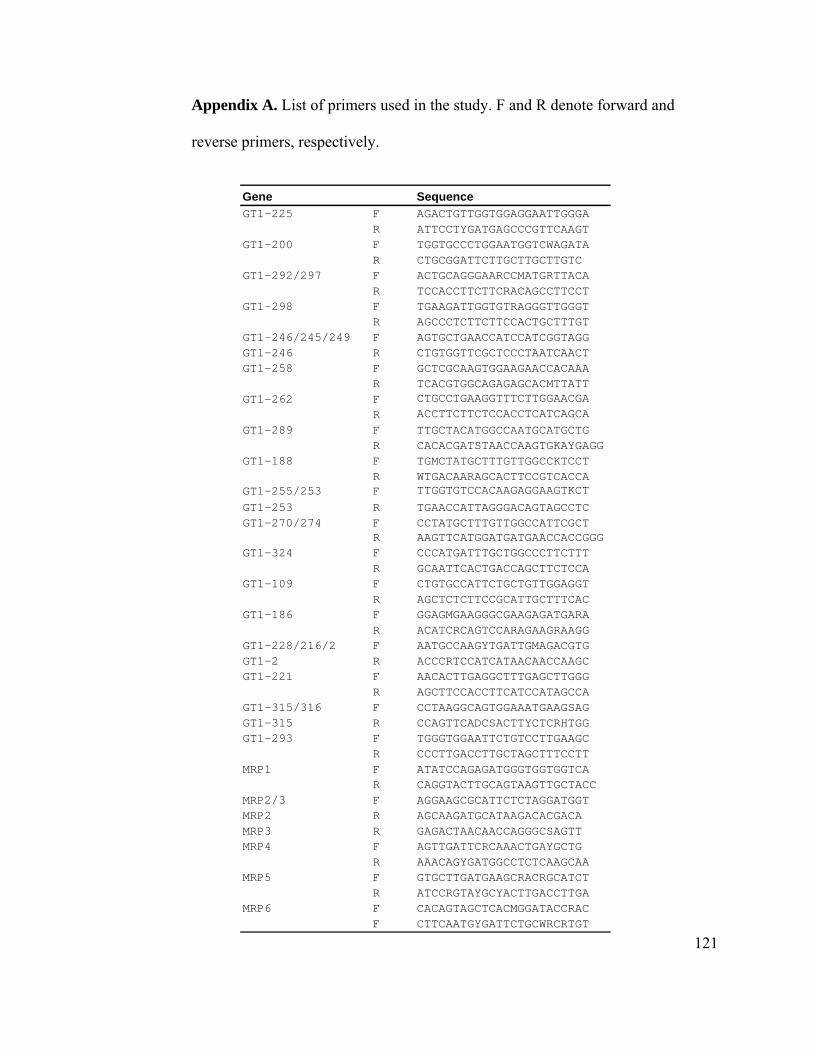
Appendix A. List of primers used in the study. F and R denote forward and
reverse primers, respectively.
Gene SequenceGT1-225 F AGACTGTTGGTGGAGGAATTGGGA
R ATTCCTYGATGAGCCCGTTCAAGTGT1-200 F TGGTGCCCTGGAATGGTCWAGATA
R CTGCGGATTCTTGCTTGCTTGTCGT1-292/297 F ACTGCAGGGAARCCMATGRTTACA
R TCCACCTTCTTCRACAGCCTTCCTGT1-298 F TGAAGATTGGTGTRAGGGTTGGGT
R AGCCCTCTTCTTCCACTGCTTTGTGT1-246/245/249 F AGTGCTGAACCATCCATCGGTAGGGT1-246 R CTGTGGTTCGCTCCCTAATCAACTGT1-258 F GCTCGCAAGTGGAAGAACCACAAA
R TCACGTGGCAGAGAGCACMTTATTGT1-262 F CTGCCTGAAGGTTTCTTGGAACGA
R ACCTTCTTCTCCACCTCATCAGCAGT1-289 F TTGCTACATGGCCAATGCATGCTG
R CACACGATSTAACCAAGTGKAYGAGGGT1-188 F TGMCTATGCTTTGTTGGCCKTCCT
R WTGACAARAGCACTTCCGTCACCAGT1-255/253 F TTGGTGTCCACAAGAGGAAGTKCT GT1-253 R TGAACCATTAGGGACAGTAGCCTCGT1-270/274 F CCTATGCTTTGTTGGCCATTCGCT
R AAGTTCATGGATGATGAACCACCGGGGT1-324 F CCCATGATTTGCTGGCCCTTCTTT
R GCAATTCACTGACCAGCTTCTCCAGT1-109 F CTGTGCCATTCTGCTGTTGGAGGT
R AGCTCTCTTCCGCATTGCTTTCACGT1-186 F GGAGMGAAGGGCGAAGAGATGARA
R ACATCRCAGTCCARAGAAGRAAGGGT1-228/216/2 F AATGCCAAGYTGATTGMAGACGTGGT1-2 R ACCCRTCCATCATAACAACCAAGCGT1-221 F AACACTTGAGGCTTTGAGCTTGGG
R AGCTTCCACCTTCATCCATAGCCAGT1-315/316 F CCTAAGGCAGTGGAAATGAAGSAGGT1-315 R CCAGTTCADCSACTTYCTCRHTGGGT1-293 F TGGGTGGAATTCTGTCCTTGAAGC
R CCCTTGACCTTGCTAGCTTTCCTTMRP1 F ATATCCAGAGATGGGTGGTGGTCA
R CAGGTACTTGCAGTAAGTTGCTACCMRP2/3 F AGGAAGCGCATTCTCTAGGATGGTMRP2 R AGCAAGATGCATAAGACACGACAMRP3 R GAGACTAACAACCAGGGCSAGTTMRP4 F AGTTGATTCRCAAACTGAYGCTG
R AAACAGYGATGGCCTCTCAAGCAAMRP5 F GTGCTTGATGAAGCRACRGCATCT
R ATCCRGTAYGCYACTTGACCTTGAMRP6 F CACAGTAGCTCACMGGATACCRAC
F CTTCAATGYGATTCTGCWRCRTGT
121
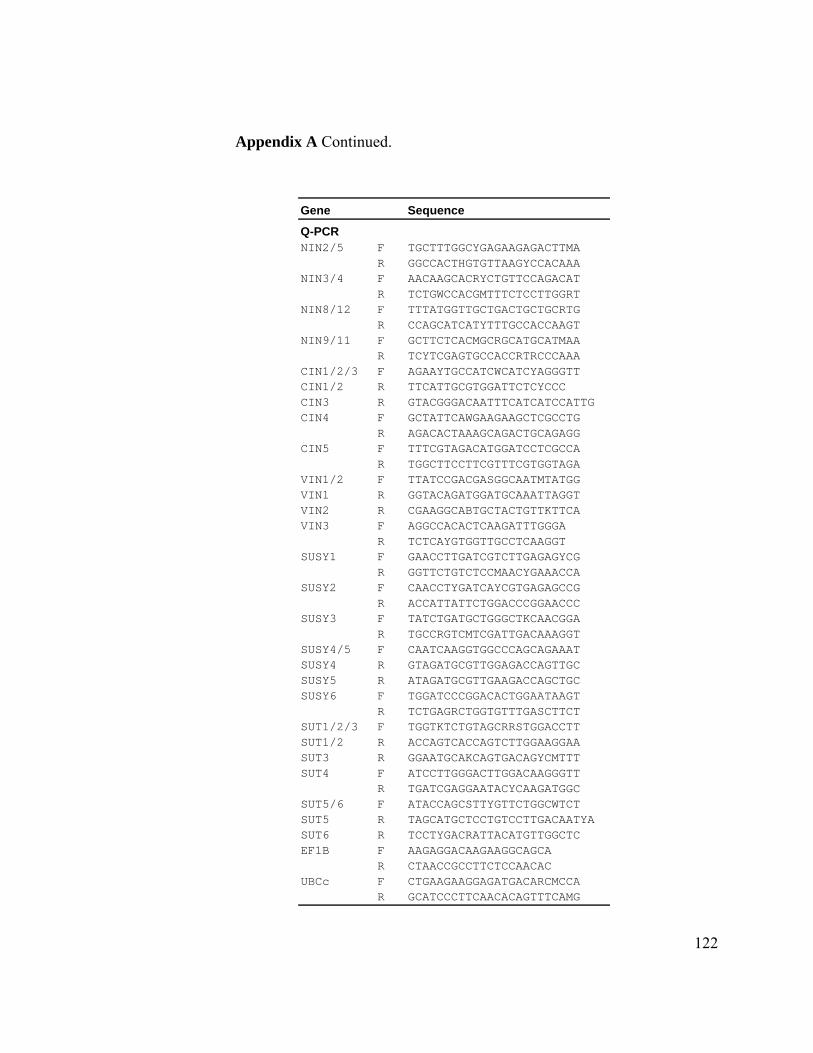
Appendix A Continued.
Gene Sequence
Q-PCRNIN2/5 F TGCTTTGGCYGAGAAGAGACTTMA
R GGCCACTHGTGTTAAGYCCACAAANIN3/4 F AACAAGCACRYCTGTTCCAGACAT
R TCTGWCCACGMTTTCTCCTTGGRTNIN8/12 F TTTATGGTTGCTGACTGCTGCRTG
R CCAGCATCATYTTTGCCACCAAGTNIN9/11 F GCTTCTCACMGCRGCATGCATMAA
R TCYTCGAGTGCCACCRTRCCCAAACIN1/2/3 F AGAAYTGCCATCWCATCYAGGGTTCIN1/2 R TTCATTGCGTGGATTCTCYCCCCIN3 R GTACGGGACAATTTCATCATCCATTGCIN4 F GCTATTCAWGAAGAAGCTCGCCTG
R AGACACTAAAGCAGACTGCAGAGGCIN5 F TTTCGTAGACATGGATCCTCGCCA
R TGGCTTCCTTCGTTTCGTGGTAGAVIN1/2 F TTATCCGACGASGGCAATMTATGGVIN1 R GGTACAGATGGATGCAAATTAGGTVIN2 R CGAAGGCABTGCTACTGTTKTTCAVIN3 F AGGCCACACTCAAGATTTGGGA
R TCTCAYGTGGTTGCCTCAAGGTSUSY1 F GAACCTTGATCGTCTTGAGAGYCG
R GGTTCTGTCTCCMAACYGAAACCASUSY2 F CAACCTYGATCAYCGTGAGAGCCG
R ACCATTATTCTGGACCCGGAACCCSUSY3 F TATCTGATGCTGGGCTKCAACGGA
R TGCCRGTCMTCGATTGACAAAGGTSUSY4/5 F CAATCAAGGTGGCCCAGCAGAAATSUSY4 R GTAGATGCGTTGGAGACCAGTTGCSUSY5 R ATAGATGCGTTGAAGACCAGCTGCSUSY6 F TGGATCCCGGACACTGGAATAAGT
R TCTGAGRCTGGTGTTTGASCTTCTSUT1/2/3 F TGGTKTCTGTAGCRRSTGGACCTTSUT1/2 R ACCAGTCACCAGTCTTGGAAGGAA SUT3 R GGAATGCAKCAGTGACAGYCMTTTSUT4 F ATCCTTGGGACTTGGACAAGGGTT
R TGATCGAGGAATACYCAAGATGGCSUT5/6 F ATACCAGCSTTYGTTCTGGCWTCTSUT5 R TAGCATGCTCCTGTCCTTGACAATYASUT6 R TCCTYGACRATTACATGTTGGCTCEF1B F AAGAGGACAAGAAGGCAGCA
R CTAACCGCCTTCTCCAACACUBCc F CTGAAGAAGGAGATGACARCMCCA
R GCATCCCTTCAACACAGTTTCAMG
122
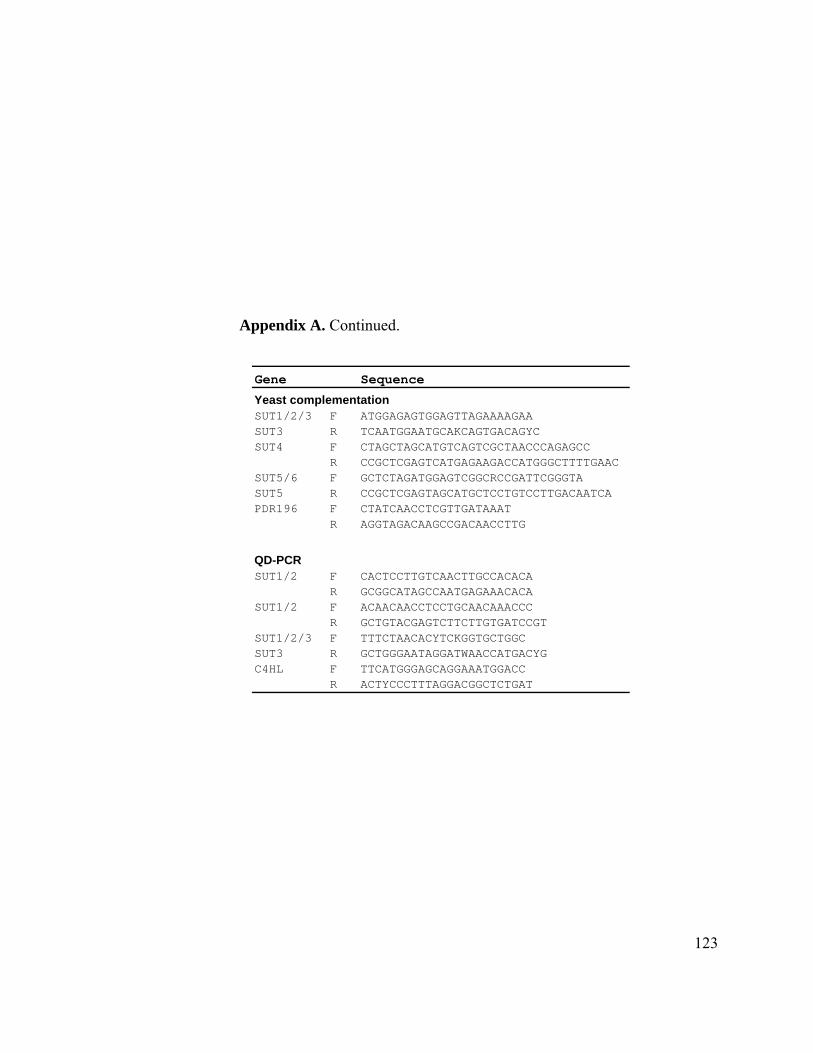
Appendix A. Continued.
Gene Sequence
Yeast complementationSUT1/2/3 F ATGGAGAGTGGAGTTAGAAAAGAASUT3 R TCAATGGAATGCAKCAGTGACAGYCSUT4 F CTAGCTAGCATGTCAGTCGCTAACCCAGAGCC
R CCGCTCGAGTCATGAGAAGACCATGGGCTTTTGAACSUT5/6 F GCTCTAGATGGAGTCGGCRCCGATTCGGGTASUT5 R CCGCTCGAGTAGCATGCTCCTGTCCTTGACAATCAPDR196 F CTATCAACCTCGTTGATAAAT
R AGGTAGACAAGCCGACAACCTTG
QD-PCRSUT1/2 F CACTCCTTGTCAACTTGCCACACA
R GCGGCATAGCCAATGAGAAACACASUT1/2 F ACAACAACCTCCTGCAACAAACCC
R GCTGTACGAGTCTTCTTGTGATCCGT SUT1/2/3 F TTTCTAACACYTCKGGTGCTGGCSUT3 R GCTGGGAATAGGATWAACCATGACYGC4HL F TTCATGGGAGCAGGAAATGGACC
R ACTYCCCTTTAGGACGGCTCTGAT
123
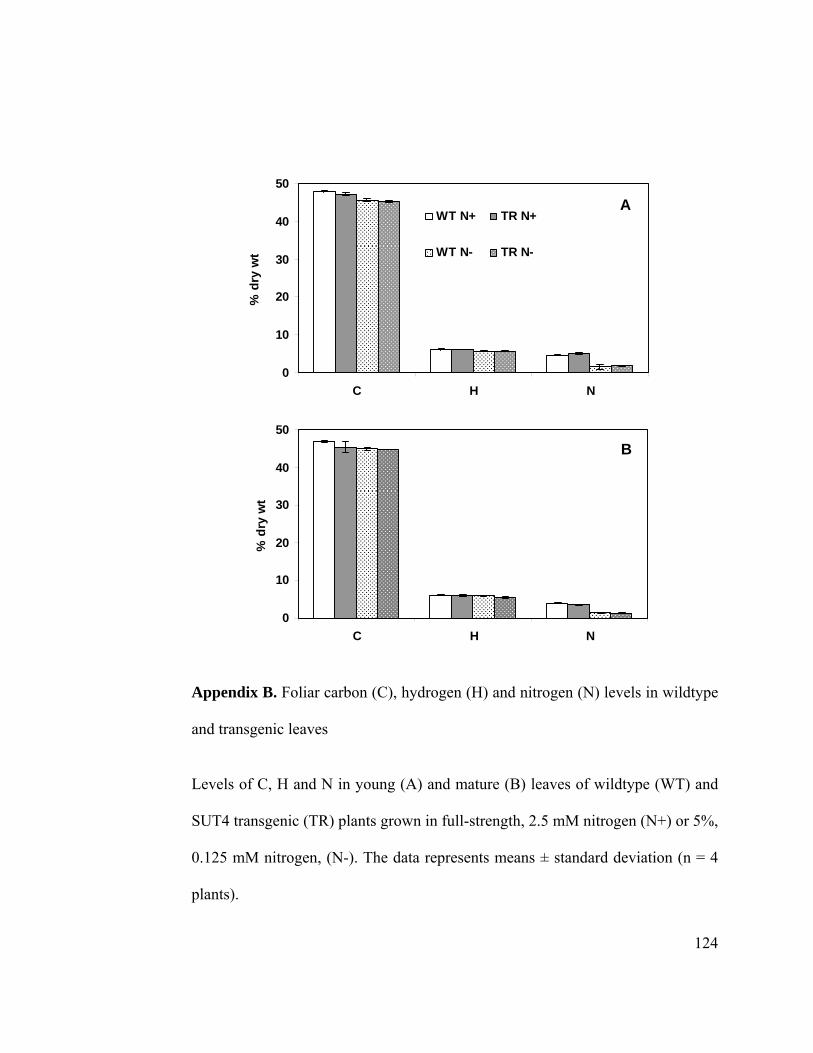
0
10
20
30
40
50
C H N
% d
ry w
t
WT N+ TR N+
WT N- TR N-
0
10
20
30
40
50
C H N
% d
ry w
t
A
B
0
10
20
30
40
50
C H N
% d
ry w
t
WT N+ TR N+
WT N- TR N-
0
10
20
30
40
50
C H N
% d
ry w
t
0
10
20
30
40
50
C H N
% d
ry w
t
WT N+ TR N+
WT N- TR N-
0
10
20
30
40
50
C H N
% d
ry w
t
A
B
Appendix B. Foliar carbon (C), hydrogen (H) and nitrogen (N) levels in wildtype
and transgenic leaves
Levels of C, H and N in young (A) and mature (B) leaves of wildtype (WT) and
SUT4 transgenic (TR) plants grown in full-strength, 2.5 mM nitrogen (N+) or 5%,
0.125 mM nitrogen, (N-). The data represents means ± standard deviation (n = 4
plants).
124
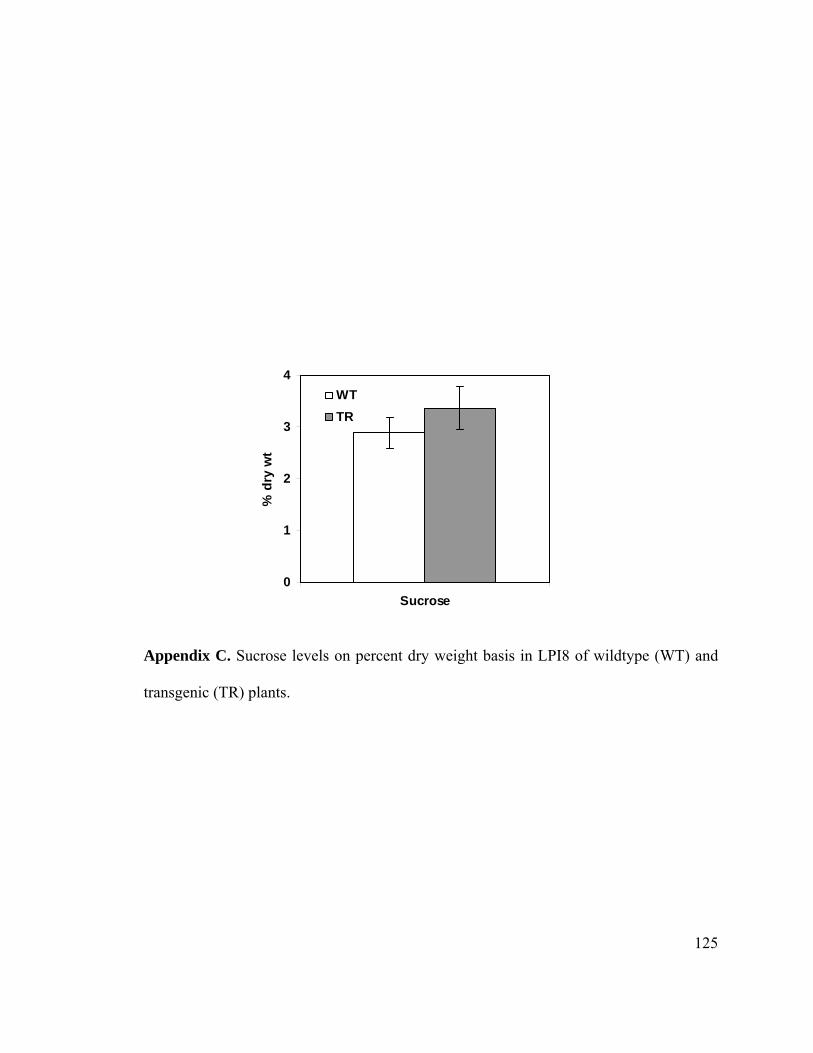
0
1
2
3
4
Sucrose
% d
ry w
t
WTTR
Appendix C. Sucrose levels on percent dry weight basis in LPI8 of wildtype (WT) and
transgenic (TR) plants.
125
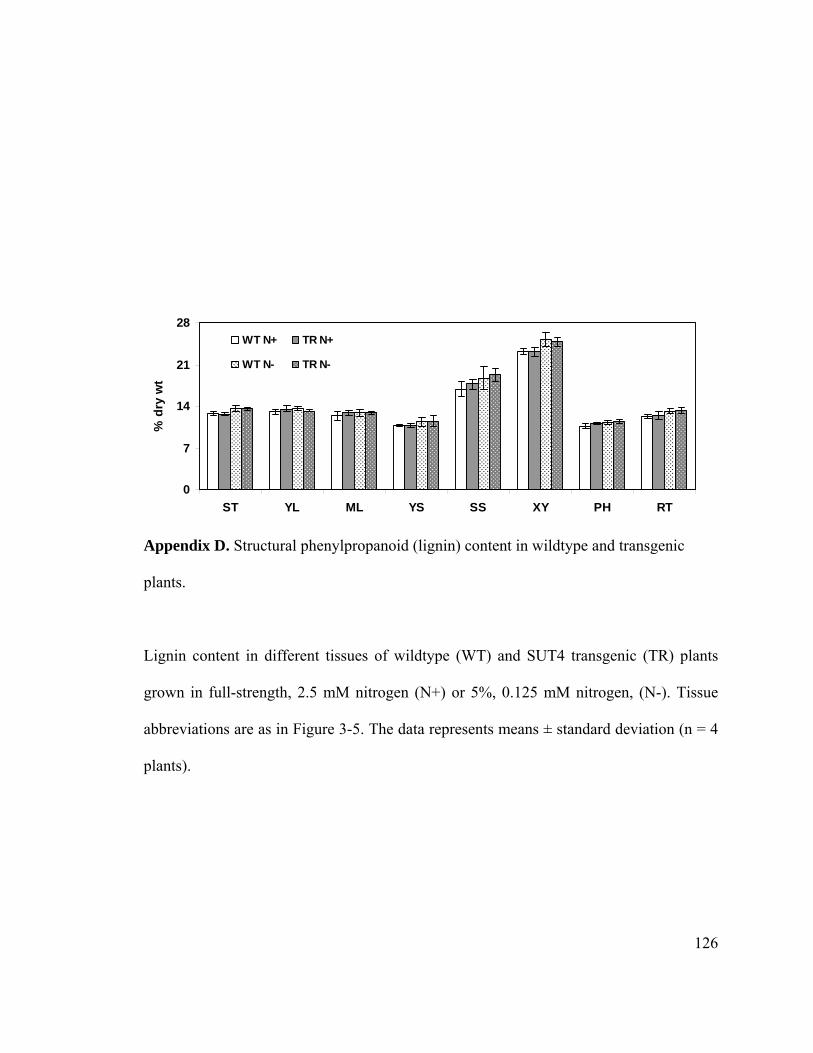
0
7
14
21
28
ST YL ML YS SS XY PH RT
% d
ry w
t
WT N+ TR N+
WT N- TR N-
Appendix D. Structural phenylpropanoid (lignin) content in wildtype and transgenic
plants.
Lignin content in different tissues of wildtype (WT) and SUT4 transgenic (TR) plants
grown in full-strength, 2.5 mM nitrogen (N+) or 5%, 0.125 mM nitrogen, (N-). Tissue
abbreviations are as in Figure 3-5. The data represents means ± standard deviation (n = 4
plants).
126


![Putative Glycosyltransferases and Other Plant Golgi ... · Putative Glycosyltransferases and Other Plant Golgi Apparatus Proteins Are Revealed by LOPIT Proteomics1[W] Nino Nikolovski,](https://static.fdocuments.us/doc/165x107/5beabde209d3f2ff498bfa69/putative-glycosyltransferases-and-other-plant-golgi-putative-glycosyltransferases.jpg)