
AN INTEGRATED ENERGY EQUIPMENT & SERVICES HUB · KS ENERGY SERVICES LIMITED Annual Report 2009 AN...
141
AN INTEGRATED ENERGY EQUIPMENT & SERVICES HUB annual report 2009
Transcript of AN INTEGRATED ENERGY EQUIPMENT & SERVICES HUB · KS ENERGY SERVICES LIMITED Annual Report 2009 AN...
KS
EN
ER
GY
SE
RV
ICE
S L
IMIT
ED
Annual R
epo
rt 2009
AN INTEGRATED ENERGY EQUIPMENT & SERVICES HUB
Design 5
AN INTEGRATED ENERGY EQUIPMENT & SERVICES HUBAN INTEGRATED ENERGY EQUIPMENT & SERVICES HUB
annual report
2009

Contents
About KS Energy Services Limited 1
Chairman’s Message to Shareholders 2
Operation & Financial Review 6
Financial Highlights 12
Corporate Data 14
Board of Directors 16
Board of Advisors 18
Management Board 19
Regional Directors 21
Group Structure 22
ABout Ks eneRgY seRVices liMiteD
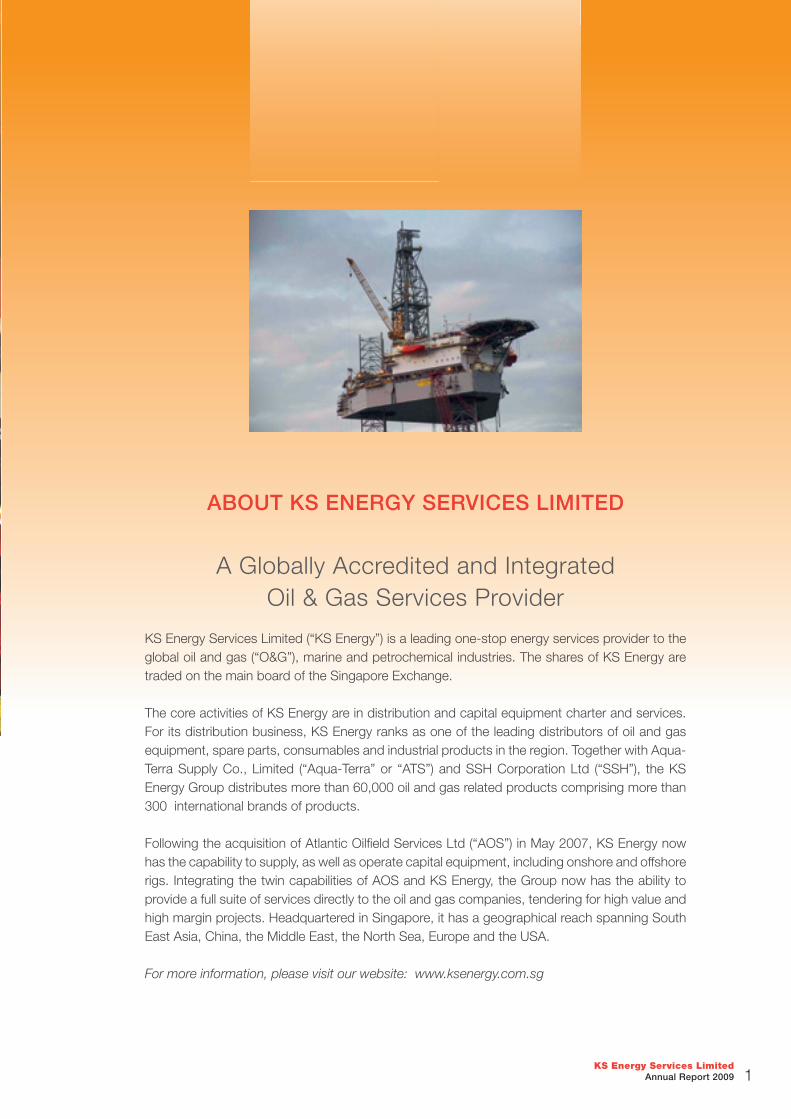
A Globally Accredited and Integrated Oil & Gas Services Provider
KS Energy Services Limited (“KS Energy”) is a leading one-stop energy services provider to the global oil and gas (“O&G”), marine and petrochemical industries. The shares of KS Energy are traded on the main board of the Singapore Exchange.
The core activities of KS Energy are in distribution and capital equipment charter and services. For its distribution business, KS Energy ranks as one of the leading distributors of oil and gas equipment, spare parts, consumables and industrial products in the region. Together with Aqua-Terra Supply Co., Limited (“Aqua-Terra” or “ATS”) and SSH Corporation Ltd (“SSH”), the KS Energy Group distributes more than 60,000 oil and gas related products comprising more than 300 international brands of products.
Following the acquisition of Atlantic Oilfi eld Services Ltd (“AOS”) in May 2007, KS Energy now has the capability to supply, as well as operate capital equipment, including onshore and offshore rigs. Integrating the twin capabilities of AOS and KS Energy, the Group now has the ability to provide a full suite of services directly to the oil and gas companies, tendering for high value and high margin projects. Headquartered in Singapore, it has a geographical reach spanning South East Asia, China, the Middle East, the North Sea, Europe and the USA.
For more information, please visit our website: www.ksenergy.com.sg
KS Energy Services Limited Annual Report 2009 1

cHAiRMAn’s MessAge to sHAReHolDeRs
“We will be looking to expand our operations in Indonesia, Australia, India and Africa. In China, where we currently have more than 16 offi ces, we will be looking to consolidate and strengthen our operations and participate in more infrastructure and energy projects.”
KS Energy Services Limited Annual Report 20092

“Our total borrowings were lower this year and our gearing improved from 0.76 times to 0.58 times at the close of FY2009.”
Dear Shareholders,
The global uncertainties in 2009 continue to challenge the oil and gas industry. Lower energy demand coupled with reduced manufacturing activities led to lower oil prices. This in turn affected the businesses in the entire oil and gas supply chain.
However, this gave rise to many opportunities as businesses look for partnerships, strategic alliances and capital assets divestments. At KS Energy, our team put in extra efforts on both the operational and fi nancing fronts. The year saw our entry into clean energy with the deployment of our Titan 2 lift boat for the installation of windmills in Europe. While the tenure of the project was shortened by the inclement weather, it gave us invaluable experience and insight into the rapidly growing clean energy industry.
The performance of our drilling and distribution businesses was affected by the economic uncertainties over the last two years. Nonetheless, the situation has allowed us to improve our operations although compared to the previous fi nancial year, FY2009 ended with lower revenue and net profi t after tax.
The top view of one of KS Energy’s rig
Anchor chains one of the products distributed by the Group
KS Energy Services Limited Annual Report 2009 3
In anticipation of the financial challenges, we have successfully completed our first warrants issue which brought net proceeds of $16.4 million into the Group. The money had been used to fund our working capital needs. Our total borrowings were lower this year and our gearing improved from 0.76 times to 0.58 times at the close of FY2009.
Another highlight of the year was our proposal to consolidate our distribution business with that of our subsidiary – Aqua-Terra Supply Co Limited (“ATS”) and our associate company – SSH Corporation Ltd (“SSH”), subject to approvals from our shareholders and the relevant authorities. Once completed, our distribution businesses will be consolidated under our new subsidiary KS Distribution Pte Ltd (“KS Distribution”). This is a joint-venture company with Actis, a leading private equity investor in emerging markets. This new entity will start off with more than 60,000 line items representing 300 globally accredited brands and a reach across nine countries, a base from which it will continue to grow and expand.
For the year 2010, we expect the world economy to stabilise and demand for energy to increase. We will continue to consolidate our oil and gas operations and look for strategic alliances and acquisitions that can complement and add value to our businesses. Concurrently, we will invest in our people and strengthen our competitive capabilities to further grow our distribution business. We will be looking to expand our operations in Indonesia, Australia, India and Africa. In China, where we currently have more than 16 offices, we will be looking to consolidate and strengthen our operations and participate in more infrastructure and energy projects.
On behalf of all my fellow directors and colleagues, I thank you for the trust and confidence that you had given to us as we face the challenges of 2009. We appreciate your continuing support for the year 2010 and will do our best to grow KS Energy.
Yours sincerely, Kris Taenar Wiluan Executive Chairman and Chief Executive Officer
KS Energy Services Limited Annual Report 20094
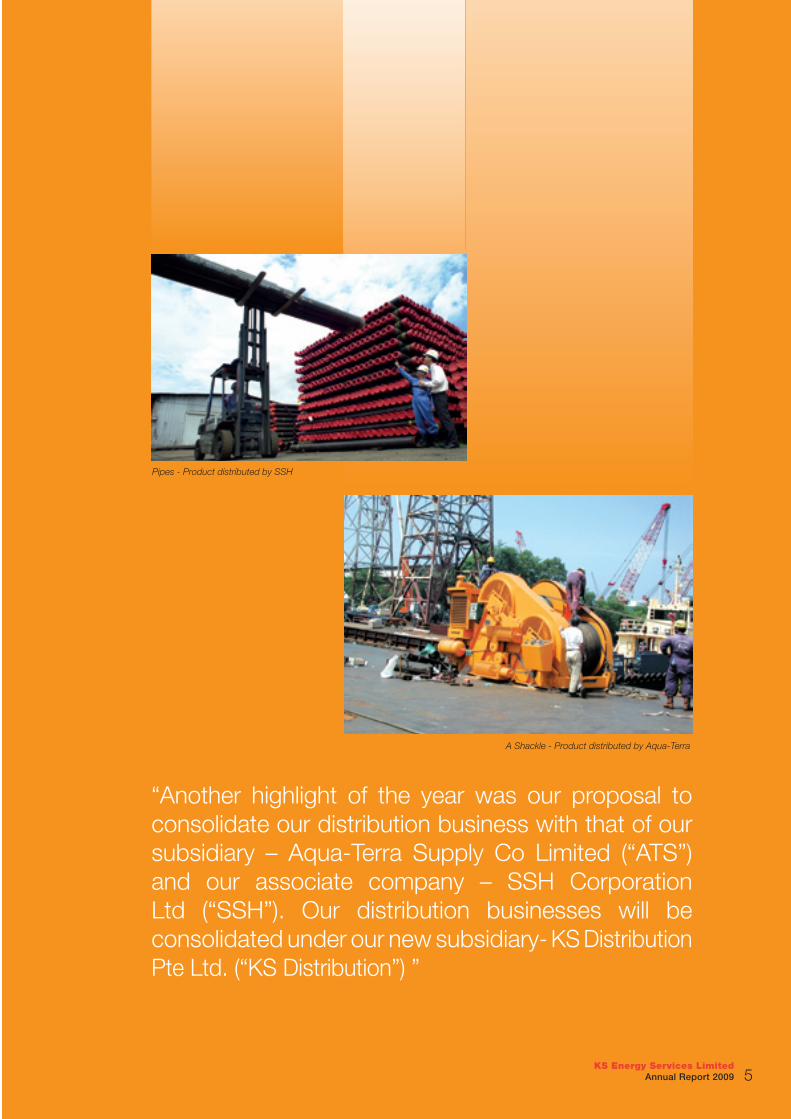
“Another highlight of the year was our proposal to consolidate our distribution business with that of our subsidiary – Aqua-Terra Supply Co Limited (“ATS”) and our associate company – SSH Corporation Ltd (“SSH”). Our distribution businesses will be consolidated under our new subsidiary- KS Distribution Pte Ltd. (“KS Distribution”) ”
A Shackle - Product distributed by Aqua-Terra
Pipes - Product distributed by SSH
KS Energy Services Limited Annual Report 2009 5

OVERVIEW
FY2009 witnessed a year of volatile oil prices and sluggish global economy. Feeling the impact of the weak market demand, both our “Distribution” and “Drilling and Capital Equipment Charter” businesses reported weaker performance. As a result, KS Energy closed the year on lower revenue and profi tability.
Another challenge this year was the credit crunch as fi nancial institutions globally contracted their loan portfolios. To counter these effects, the Group successfully completed its fi rst warrant issue in August 2009, raising approximately $16.4 million. The money had been used to fund our working capital needs. Our total borrowings were lower this year and our gearing improved from 0.76 times to 0.58 times at the close of FY 2009.
Our integration efforts took another step forward as we continue with our efforts to streamline our “Distribution” business and re-organise our Drilling and Capital Equipment Charter business. The current slow-down in the global economic landscape has given us the opportunity to speed up our business consolidation and in the process, bring us closer to our vision to transform KS Energy into an integrated energy services hub.
“The current slow-down in the global economic landscape has given us the opportunity to speed up our business consolidation and in the process, bring us closer to our vision to transform KS Energy into an integrated energy services hub.”
opeRAtion & FinAnciAl ReVieW
KS Energy Services Limited Annual Report 20096
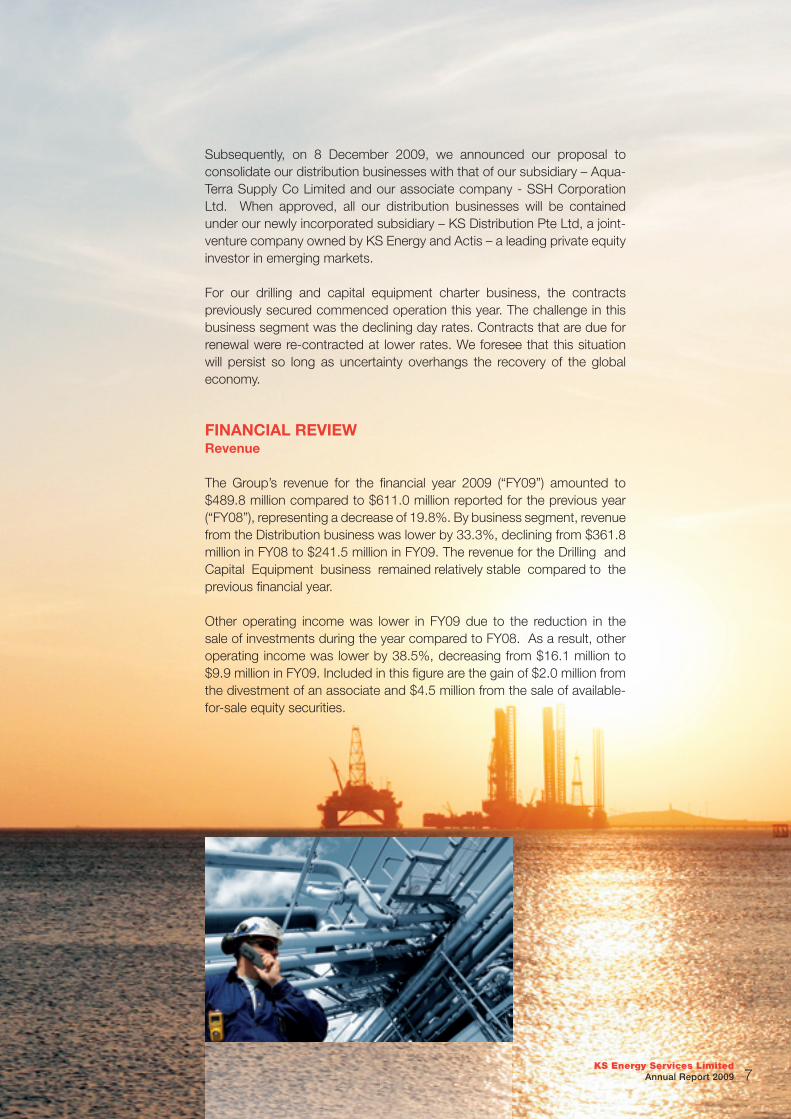
Subsequently, on 8 December 2009, we announced our proposal to consolidate our distribution businesses with that of our subsidiary – Aqua-Terra Supply Co Limited and our associate company - SSH Corporation Ltd. When approved, all our distribution businesses will be contained under our newly incorporated subsidiary – KS Distribution Pte Ltd, a joint-venture company owned by KS Energy and Actis – a leading private equity investor in emerging markets.
For our drilling and capital equipment charter business, the contracts previously secured commenced operation this year. The challenge in this business segment was the declining day rates. Contracts that are due for renewal were re-contracted at lower rates. We foresee that this situation will persist so long as uncertainty overhangs the recovery of the global economy.
FINANCIAL REVIEWRevenue
The Group’s revenue for the fi nancial year 2009 (“FY09”) amounted to $489.8 million compared to $611.0 million reported for the previous year (“FY08”), representing a decrease of 19.8%. By business segment, revenue from the Distribution business was lower by 33.3%, declining from $361.8 million in FY08 to $241.5 million in FY09. The revenue for the Drilling and Capital Equipment business remained relatively stable compared to the previous fi nancial year.
Other operating income was lower in FY09 due to the reduction in the sale of investments during the year compared to FY08. As a result, other operating income was lower by 38.5%, decreasing from $16.1 million to $9.9 million in FY09. Included in this fi gure are the gain of $2.0 million from the divestment of an associate and $4.5 million from the sale of available-for-sale equity securities.
KS Energy Services Limited Annual Report 2009 7

Expenses Distribution costs totalled $21.1 million in FY09, representing a decrease of 15.3%, compared to $24.9 million incurred in FY08. This is in line with the lower level of activities in the Group’s Distribution business.
Administrative expenses reported a drop of 24.5%, decreasing from $37.1 million to $28.0 million due to lower manpower costs and jobs credit grant received.
Other operating expenses contracted by 26.1%, decreasing from $31.4 million to $23.2 million mainly due to foreign exchange differences, lower allowance for doubtful debts and operating expenses from non-core assets that were divested last year.
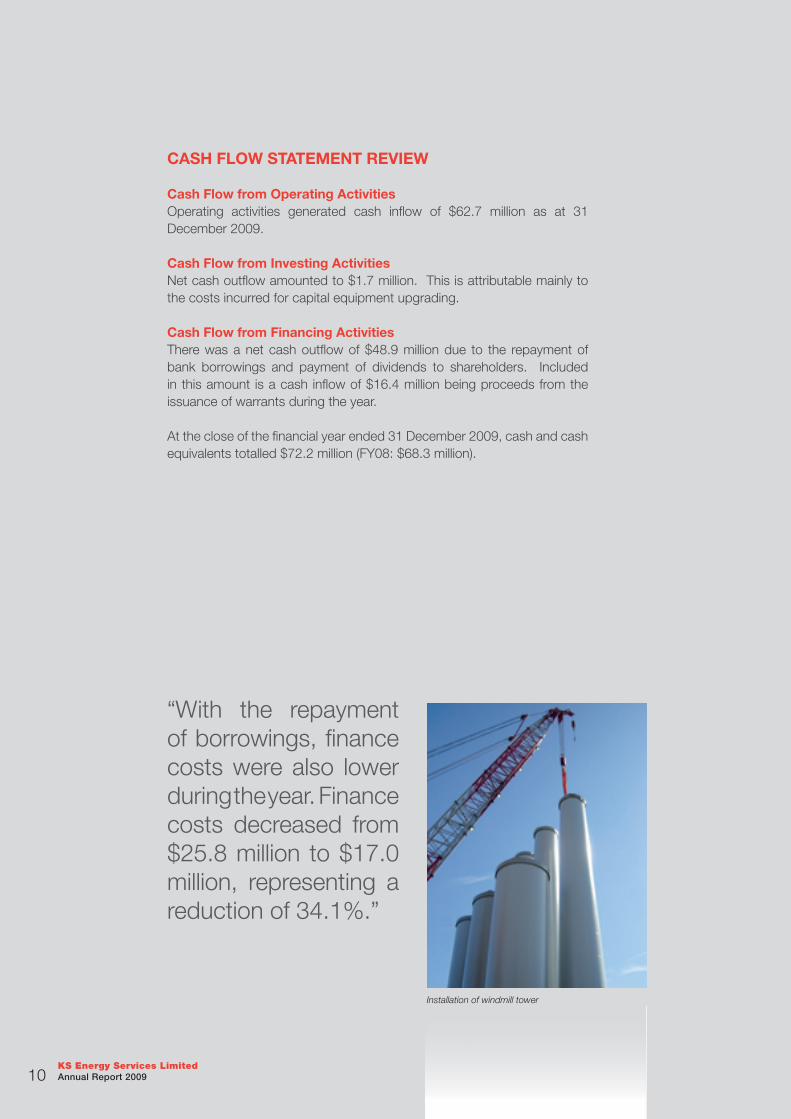
With the repayment of borrowings, fi nance costs were also lower during the year. Finance costs decreased from $25.8 million to $17.0 million, representing a reduction of 34.1%.
Profi tabilityGross profi t margin narrowed from 27.0% to 23.0% refl ecting the diffi cult market conditions. In FY09, gross profi t totalled $112.9 million compared to $165.1 million in FY08, representing a decrease of 31.6%.
The share of results from associates declined from a profi t of $8.2 million in FY08 to a loss of $0.1 million in FY09 due to lower contribution from an associate.
The Group’s share of results of jointly controlled entities rose from a loss of $4.6 million in FY08 to a profi t of $19.4 million in FY09. This is mainly from the insurance claim for the KS Titan 1 lift boat as well as the gain from the divestment of a jointly controlled entity.
At the close of the fi nancial year 2009, the Group reported a net profi t after tax and minority interest of $40.0 million, representing a decrease of 22.9% from the net profi t after tax and minority interest of $51.9 million reported in FY08.
KS Energy Services Limited Annual Report 20098
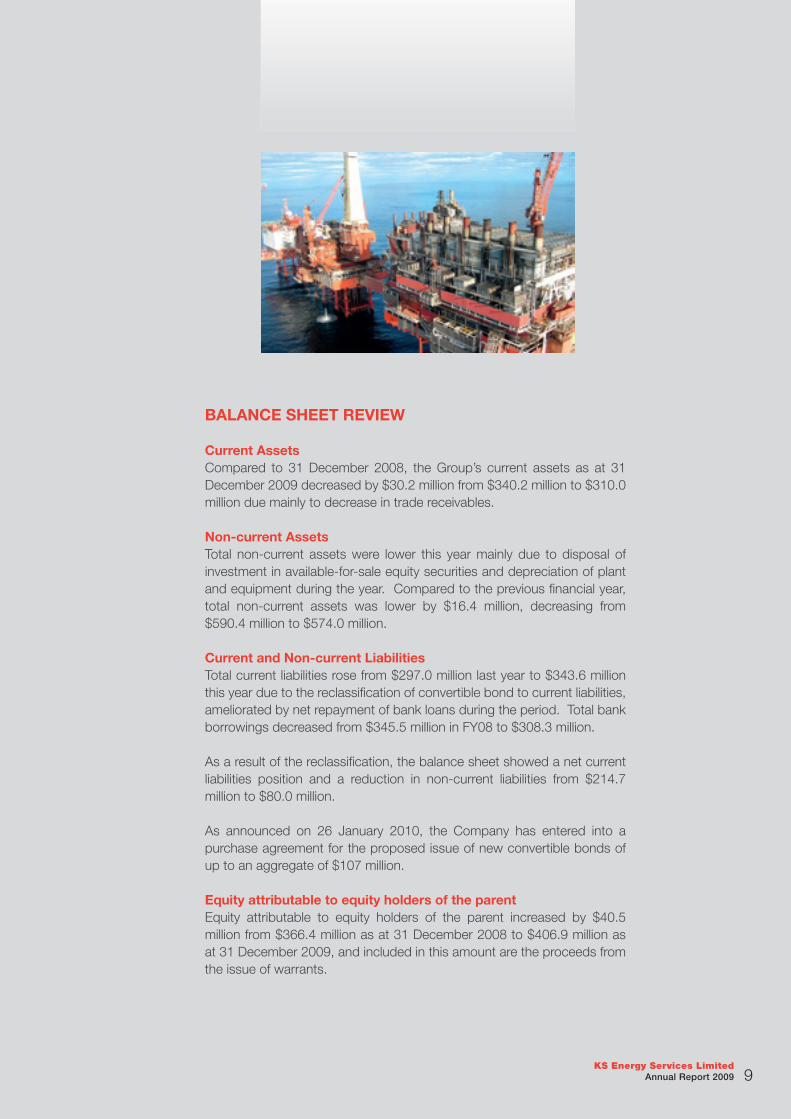
BALANCE SHEET REVIEW
Current AssetsCompared to 31 December 2008, the Group’s current assets as at 31 December 2009 decreased by $30.2 million from $340.2 million to $310.0 million due mainly to decrease in trade receivables.
Non-current AssetsTotal non-current assets were lower this year mainly due to disposal of investment in available-for-sale equity securities and depreciation of plant and equipment during the year. Compared to the previous fi nancial year, total non-current assets was lower by $16.4 million, decreasing from $590.4 million to $574.0 million.
Current and Non-current LiabilitiesTotal current liabilities rose from $297.0 million last year to $343.6 million this year due to the reclassifi cation of convertible bond to current liabilities, ameliorated by net repayment of bank loans during the period. Total bank borrowings decreased from $345.5 million in FY08 to $308.3 million.
As a result of the reclassifi cation, the balance sheet showed a net current liabilities position and a reduction in non-current liabilities from $214.7 million to $80.0 million.
As announced on 26 January 2010, the Company has entered into a purchase agreement for the proposed issue of new convertible bonds of up to an aggregate of $107 million.
Equity attributable to equity holders of the parentEquity attributable to equity holders of the parent increased by $40.5 million from $366.4 million as at 31 December 2008 to $406.9 million as at 31 December 2009, and included in this amount are the proceeds from the issue of warrants.
KS Energy Services Limited Annual Report 2009 9
CASH FLOW STATEMENT REVIEW
Cash Flow from Operating ActivitiesOperating activities generated cash infl ow of $62.7 million as at 31 December 2009.
Cash Flow from Investing ActivitiesNet cash outfl ow amounted to $1.7 million. This is attributable mainly to the costs incurred for capital equipment upgrading.
Cash Flow from Financing ActivitiesThere was a net cash outfl ow of $48.9 million due to the repayment of bank borrowings and payment of dividends to shareholders. Included in this amount is a cash infl ow of $16.4 million being proceeds from the issuance of warrants during the year.
At the close of the fi nancial year ended 31 December 2009, cash and cash equivalents totalled $72.2 million (FY08: $68.3 million).
“With the repayment of borrowings, fi nance costs were also lower during the year. Finance costs decreased from $25.8 million to $17.0 million, representing a reduction of 34.1%.”
Installation of windmill tower
KS Energy Services Limited Annual Report 200910
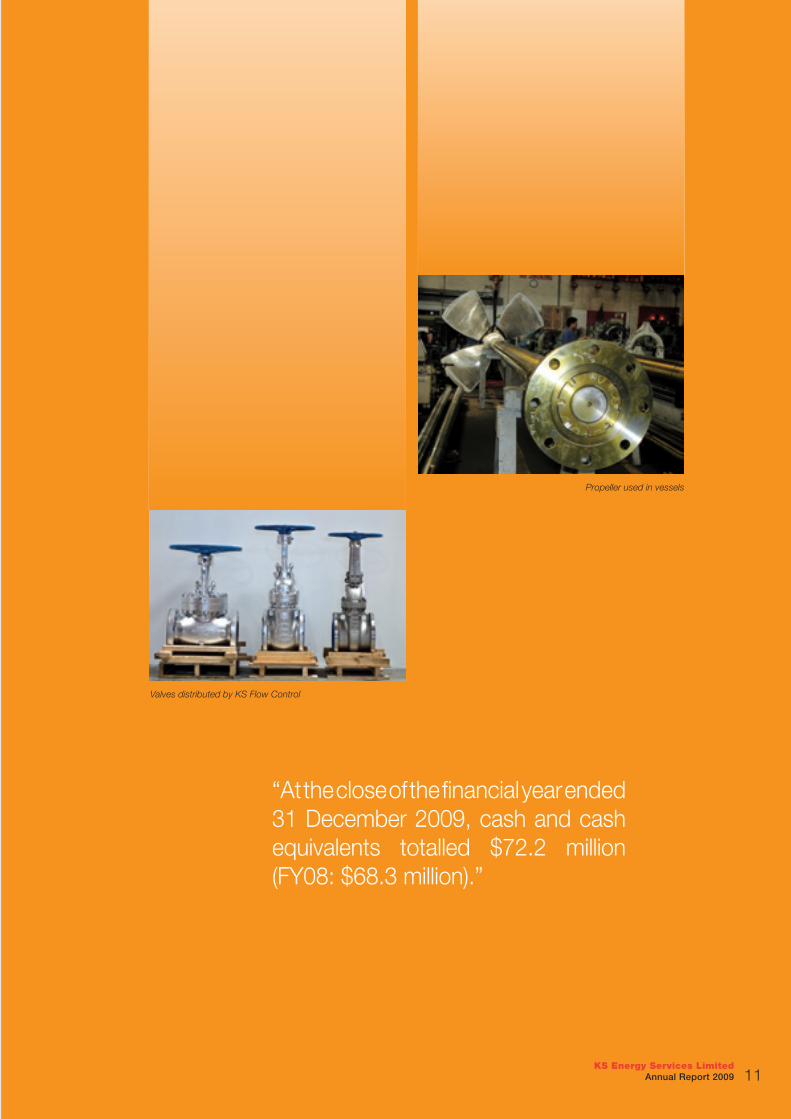
“At the close of the fi nancial year ended 31 December 2009, cash and cash equivalents totalled $72.2 million (FY08: $68.3 million).”
Valves distributed by KS Flow Control
Propeller used in vessels
KS Energy Services Limited Annual Report 2009 11
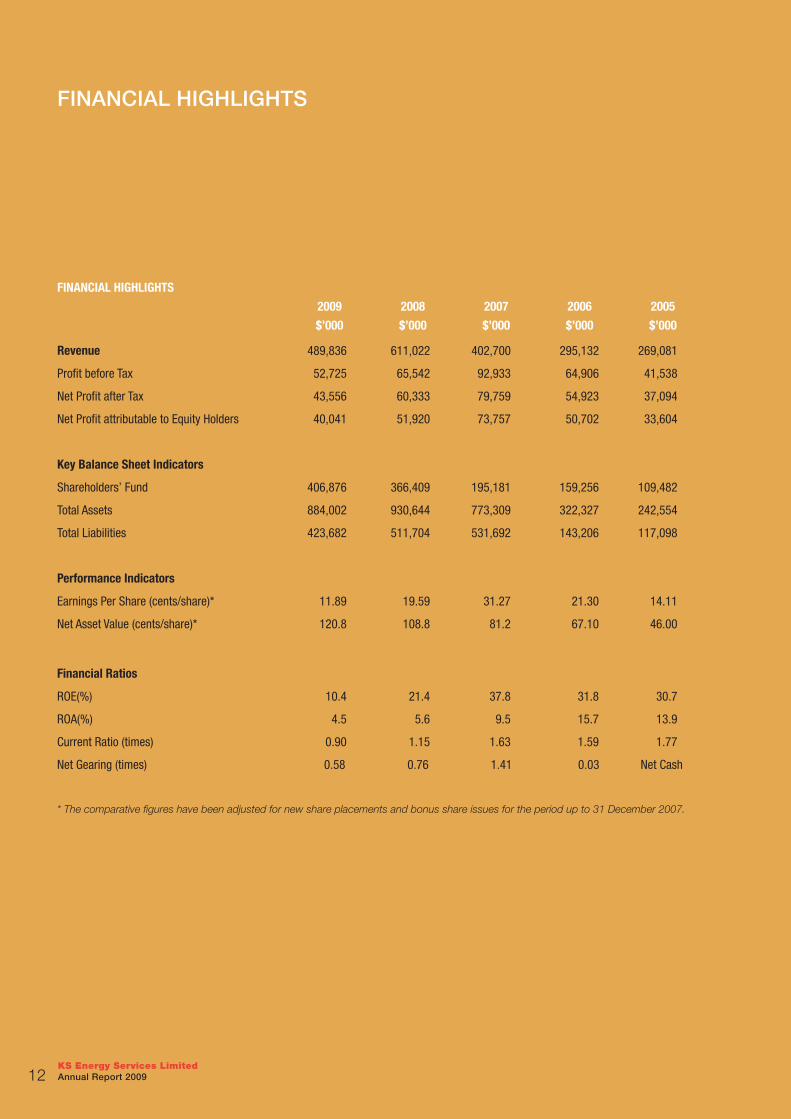
* The comparative figures have been adjusted for new share placements and bonus share issues for the period up to 31 December 2007.
FINANCIAL HIGHLIGHTS
2009 2008 2007 2006 2005
$’000 $’000 $’000 $’000 $’000
Revenue 489,836 611,022 402,700 295,132 269,081
Profit before Tax 52,725 65,542 92,933 64,906 41,538
Net Profit after Tax 43,556 60,333 79,759 54,923 37,094
Net Profit attributable to Equity Holders 40,041 51,920 73,757 50,702 33,604
Key Balance Sheet Indicators
Shareholders’ Fund 406,876 366,409 195,181 159,256 109,482
Total Assets 884,002 930,644 773,309 322,327 242,554
Total Liabilities 423,682 511,704 531,692 143,206 117,098
Performance Indicators
Earnings Per Share (cents/share)* 11.89 19.59 31.27 21.30 14.11
Net Asset Value (cents/share)* 120.8 108.8 81.2 67.10 46.00
Financial Ratios
ROE(%) 10.4 21.4 37.8 31.8 30.7
ROA(%) 4.5 5.6 9.5 15.7 13.9
Current Ratio (times) 0.90 1.15 1.63 1.59 1.77
Net Gearing (times) 0.58 0.76 1.41 0.03 Net Cash
FinAnciAl HigHligHts
KS Energy Services Limited Annual Report 200912
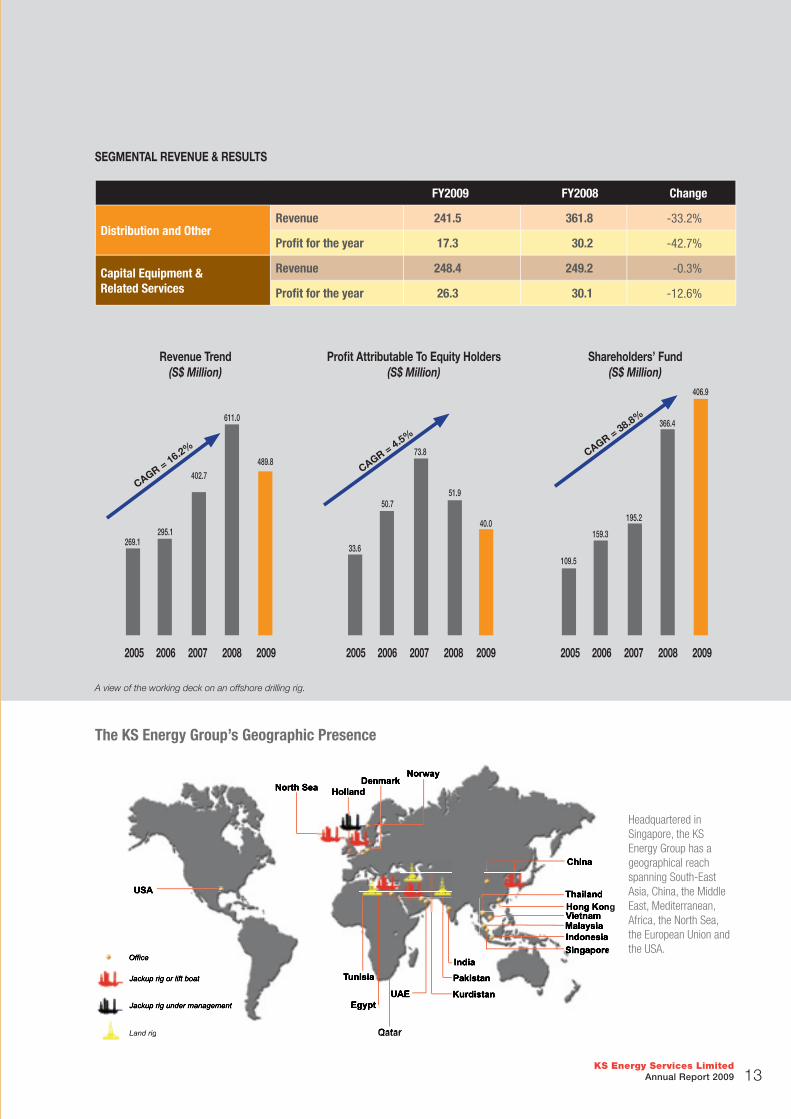
SEGMENTAL REVENUE & RESULTS
FY2009 FY2008 Change
Distribution and OtherRevenue 241.5 361.8 -33.2%
Profi t for the year 17.3 30.2 -42.7%
Capital Equipment & Related Services
Revenue 248.4 249.2 -0.3%
Profi t for the year 26.3 30.1 -12.6%
A view of the working deck on an offshore drilling rig.
Revenue Trend (S$ Million)
Profi t Attributable To Equity Holders (S$ Million)
Shareholders’ Fund (S$ Million)
33.6
50.7
40.0
51.9
73.8
2005 2006 2007 2008 2009
CAGR = 4.5%
2005 2006 2007 2008 2009
109.5
159.3
195.2
366.4
406.9
C
AGR = 38.8%
The KS Energy Group’s Geographic Presence
Egypt
North Sea Denmark
Pakistan
UAE
Qatar Qatar
USA
Kurdistan
Singapore Singapore
Malaysia
Thailand
Indonesia Indonesia
Vietnam
India
China
Hong Kong Hong Kong
Tunisia
Holland
Norway
Headquartered in Singapore, the KS Energy Group has a geographical reach spanning South-East Asia, China, the Middle East, Mediterranean, Africa, the North Sea, the European Union and the USA.
Jackup rig or lift boat
Land rig
Office
Jackup rig under management
2005 2006 2007 2008 2009
269.1295.1
402.7
611.0
489.8
CAGR = 16.2%
KS Energy Services Limited Annual Report 2009 13
BOARD OF DIRECTORS
KRIS TAENAR WILUAN Executive Chairman & Chief Executive Offi cer
KOH SOO KEONG Executive Director
ABDULLAH MOHAMMED SALEH Non-Executive Director
LIM HO SENG Lead Independent Director
LEE BENG CHENG Independent Director
WONG MENG YENG Independent Director
NELSON McCALLUM GIBB Alternate Director to Mr Abdulla Mohammed Saleh and
Director of Group Business Development
AUDIT COMMITTEE
LIM HO SENG Chairman
WONG MENG YENG
LEE BENG CHENG
NOMINATING COMMITTEE
WONG MENG YENG Chairman
LEE BENG CHENG
KRIS TAENAR WILUAN
REMUNERATION COMMITTEE
LEE BENG CHENG Chairman
WONG MENG YENG
LIM HO SENG
COMPANY SECRETARIES
SHIRLEY LIM
BUSARAKHAM KOHSIKAPORN
REGISTERED OFFICE
No 19 Jurong Port Road Singapore 619093
Tel: (65) 6577 4600
Fax: (65) 6577 4618
Website: www.ksenergy.com.sg
Company Registration No: 198300104G
REGISTRAR & SHARE TRANSFER OFFICE
Tricor Barbinder Share Registration Services
(a division of Tricor Singapore Pte Ltd)
8 Cross Street #11-00 PWC Building Singapore 048424
AUDITORS
KPMG LLP
Certifi ed Public Accountants
16 Raffl es Quay #22-00 Hong Leong Building Singapore 048581
Partner-in-charge: TAN HUAY LIM
Year of appointment: 2005
BANKERS
Deutsche Bank
The Development Bank of Singapore Limited
The Hong Kong & Shanghai Banking Corporation Limited
ING Bank N.V.
Maybank Group
Oversea-Chinese Banking Corporation Limited
Standard Chartered Bank
United Overseas Bank Limited
coRpoRAte DAtA
KS Energy Services Limited Annual Report 200914
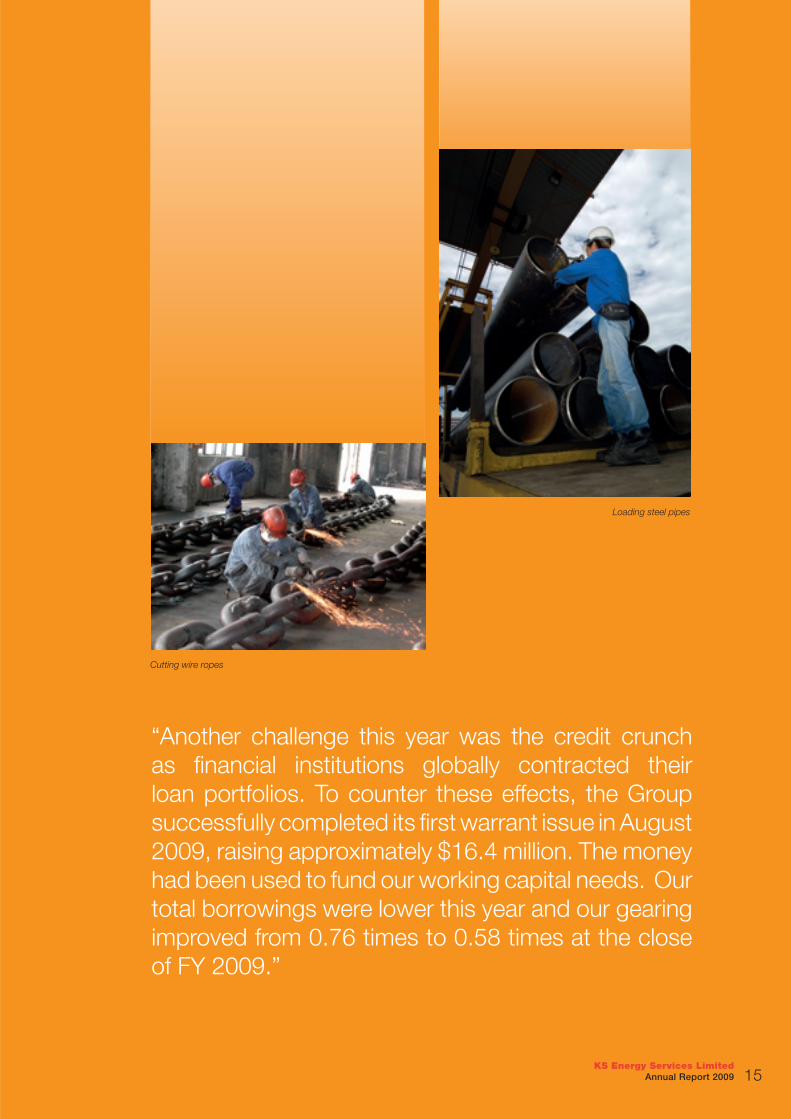
“Another challenge this year was the credit crunch as fi nancial institutions globally contracted their loan portfolios. To counter these effects, the Group successfully completed its fi rst warrant issue in August 2009, raising approximately $16.4 million. The money had been used to fund our working capital needs. Our total borrowings were lower this year and our gearing improved from 0.76 times to 0.58 times at the close of FY 2009.”
Loading steel pipes
Cutting wire ropes
KS Energy Services Limited Annual Report 2009 15

BoARD oF DiRectoRs
KOH SOO KEONGExecutive Director
KRIS TAENAR WILUANExecutive Chairman & Chief Executive Offi cer
Mr Wiluan was appointed the Chairman and Chief Executive Offi cer of KS Energy in 2006. Mr Wiluan is the founder of the Citramas Group, whose business activities include oilfi eld equipment manufacturing, shipping and logistics, drilling services, infrastructure development comprising port, ferry terminals and telephone companies, and the hotel and leisure industry. Under the umbrella of the Citramas Group is the Indonesian public-listed PT Citra Tubindo Tbk, a manufacturer of tubular products for the oil and gas industry whose shares are quoted on the Jakarta and Surabaya Stock Exchanges, and 35 other subsidiary companies whose activities span different parts of ASEAN. The Citramas Group provides employment to more than 3,000 employees across the region.
The President of the Citramas Group, Mr Wiluan is also the President and CEO of PT Citra Tubindo Tbk, and the Chairman of PT Citra Bonang, a Jakarta-based industrial chemicals and food distribution group of companies with more than 50 branches throughout Indonesia.
Mr Wiluan is also the Chairman and Chief Executive Offi cer of Aqua-Terra Supply Co. Limited and the Executive Chairman and Chief Executive Offi cer of SSH Corporation Ltd. He graduated from London University with a BSc Honours Degree in Mathematics and Computer Science.
KOH SOO KEONGExecutive Director
Mr Koh was appointed as an Executive Director in May 2009. Mr Koh was, until April 2007, the Chief Executive Offi cer and President of Toll Asia Pte Ltd, formerly SembCorp Logistics Ltd (SembLog) which was acquired by Toll in May 2006. Currently, he is the Managing Director of EcoSave Pte Ltd. With over 20 years of experience in the logistics industry, he has helmed SembLog and its preceding companies since 1986. He is a board member of four other publicly listed companies and the Chairman of the Agri-Food and Veterinary Authority of Singapore.
Mr Koh holds a Bachelor of Engineering (Honours), a Master of Business Administration and a Postgraduate Diploma in Business Law from the National University of Singapore.
ABDULLA MOHAMMED SALEH Non-Executive Director
Mr Saleh was appointed as Chairman of the Dubai Financial Services Authority on 17 June 2007, having served as a director of the DFSA since 2004. Mr Saleh is the Vice Chairman of Emirates NBD PJSC, the largest banking entity in the Middle East. Emirates NBD PJSC was formed by the merger of National Bank of Dubai (NBD) and Emirates Bank International (EBI). Mr Saleh was one of NBD’s founders in 1963, and became its Managing Director from 1982 until January 2004 and thereafter Chairman from 2005 till the merger with EBI.
Mr Saleh is a former adviser on fi nancial matters to the Late Ruler of Dubai, HH Sheikh Rashid Bin Saeed Al Maktoum. He served as an Arbitrator on the Paris-based High Board of the Euro-Arab Arbitration Centre, from 1988 to 2000. He is a Board Member of the Dubai Chamber of Commerce and Industry. He has been a Member of the Board of Qatar Fuel Additives Company since 1990 and has been Chairman of International Octane Limited since 1990. He is a Director and major shareholder of Dubai Transport Company LLC (DUTCO), the holding company of the DUTCO Group of Companies. He has been Chairman of MARSH INSCO (insurance brokers) since 1976.
Mr Saleh was educated in Sharjah and London and also attended the Institute of Bankers after completing his academic studies.
ABDULLA MOHAMMED SALEH Non-Executive Director
KRIS TAENAR WILUANExecutive Chairman & Chief Executive Offi cer
KS Energy Services Limited Annual Report 200916

LIM HO SENGLead Independent Director
Mr Lim is Lead Independent Director and Chairman of the Audit Committee and a member of the Remuneration Committee of the Group. He was appointed our Independent Non-Executive Director on 1 September 2005. He is the Chairman of Baker Technology Ltd and sits on the Board of several other public companies listed on the Stock Exchange of Singapore. He was the former Chief Executive Offi cer of NTUC Fairprice Cooperative Ltd. Mr Lim is a Fellow of the Institute of Certifi ed Public Accountants Singapore, the Institute of Certifi ed Public Accountants Australia and the Association of Chartered Certifi ed Accountants of United Kingdom. He is also a Fellow of the Institute of Chartered Secretaries & Administrators and the Singapore Institute of Directors.
LEE BENG CHENGIndependent Director
Mr Lee has extensive experience in the oil and gas and marine industries, having worked in the oil refi ning and petrochemical sectors, offshore drilling rig and platform construction including drilling several oil and gas wells both onshore and offshore in Asia. He held senior positions in several public-listed and private entities in the hydrocarbon industry in Singapore, Malaysia and China including Vice Chairman of the listed Shenzhen-Chiwan Petroleum Supply Base, Chairman of Singapore Offshore Petroleum Supply Base, President of Sembawang Marine & Logistics Ltd (formerly known as Sembawang Maritime Ltd), Managing Director of Hong Kong listed Promet Petroleum Ltd. Mr Lee holds a First Class Honours Degree in Mechanical Engineering and a Master of Science (with distinction) from Leeds University, UK. He is also a member of the Singapore Institute of Management, the Institute of Engineers Singapore and the Singapore Institute of Directors.
WONG MENG YENGIndependent Director
Mr Wong has been an advocate and solicitor in Singapore since 1984 and practises corporate law. He is currently a director of Alliance LLC, a law corporation he co-founded in 2001. Over the last 10 years he has been an Independent Director of several companies listed on the Singapore Exchange. Mr Wong graduated from the National University of Singapore in 1983 with a Bachelor of Laws (Honours) Degree.
NELSON McCALLUM GIBBAlternate Director to Mr Abdulla Mohammed Saleh and Director of Group Business Development
Mr Gibb was appointed as an alternate director to Mr Abdulla Mohammed Saleh on 22 December 2009. He has been with Dutco since 1996 and is currently the Group’s Chief Operating Offi cer. The Dutco Group is a leading Dubai based conglomerate comprising 20 Companies and over 25,000 employees.
The Company has signifi cant interests in all sectors of construction, hospitality & leisure, oil and gas, manufacturing, development and investments and trading. Dutco are partners in the Middle East with many international companies such as the Balfour Beatty plc from the UK and Mc Connell Dowell Ltd. from Australia. Prior to joining Dutco in 1996, Mr Gibb was the Director for the International Business of the leading Mechanical and Electrical Engineering Company, Balfour Kilpatrick Ltd (a member of the Balfour Beatty Group of Companies, a major UK listed Construction Group), whose Projects and Companies were based across Asia, Africa, and the Middle East.
Mr Gibb was educated in West Africa, Indonesia and Scotland, completing his BA (Hons) at Stratchclyde University in Glasgow. Mr Gibb sits on many of the Boards of the Group of Companies of the Dutco Group.
LIM HO SENGLead Independent Director
LEE BENG CHENG, BILLYIndependent Director
WONG MENG YENGIndependent Director
NELSON McCALLUM GIBBAlternate Director to Mr Abdulla Mohammed Saleh
KS Energy Services Limited Annual Report 2009 17

LEE SENG QUEE
Mr Lee joined the Company on 1 March 2007 as Strategic Advisor to Chairman.
Mr Lee has been with the Citramas Group since 1978, where he is responsible for corporate matters. He is also an Advisor to the Board of Directors of PT Citra Tubindo Tbk.
Mr Lee practises as a Public Accountant and holds professional qualifi cations including Fellow Member of the Institute of Certifi ed Public Accountants of Singapore; Fellow Member of CPA Australia; Fellow Member of the Association of Chartered Certifi ed Accountants; Fellow Member of the Institute of Chartered Secretaries and Administrators, UK and Member of the Singapore Institute of Directors. Mr Lee also holds a Master of Business Administration majoring in Business Laws from the Nanyang Business School, Nanyang Technological University.
Mr Lee is author of and updates the publication, CCH Hands On Guide for Corporate Secretarial Essentials.
SHEIKH FAISAL F.J. AL–THANI
Sheikh Al-Thani was appointed an Independent Director of the Group on 20 January 2006. He has over 23 years of working experience in the oil and gas industry in Qatar. He started his career in 1987 with state-owned Qatar Petroleum and spent more than a decade working there before being seconded to Arco Qatar, British Petroleum and Anadarko Qatar Energy Co., LLC as Deputy General Manager and Qatar Petroleum representative in the said companies. In March of 2008, he assumed the position of Sr. Director and Head of Business Development in the Middle East for Maersk Oil Qatar as seconded by Qatar Petroleum. Sheikh Al-Thani is the Chairman of both Naama Real Estate Company and Qatar National Export Import Company. He is a prolifi c author and has published numerous books on risk management and trends in the oil and gas industry in the Middle East. He is also the current Chairman of the Society of Petroleum Engineers International - Qatar Section and the Chairman and founding member of the local Qatar Society of Petroleum Engineers (QSPE), a Fulbright scholar, completed his fi rst degree in Petroleum Engineering at the University of Tulsa, Oklahoma followed by a Masters in Project Management at the University of Bath as well as a PhD in Project Finance at Leeds University, UK.
NG SHIN EIN
Ms Ng Shin Ein was appointed to the Board in 1 May 2009. She is the Regional Managing Director of Blue Ocean Associates Pte Ltd, a pan-asian investment and strategic advisory fi rm. Blue Ocean Associates takes proprietary stakes in companies and also advises corporates and other investment funds.
Prior to this, Ms Ng was with the Singapore Exchange, where she was responsible for developing Singapore’s capital market by bringing foreign companies to list in Singapore. Additionally, she was part of the Singapore Exchange’s IPO Approval Committee.
Ms Ng started her career as a corporate lawyer in Messrs Lee & Lee. Whilst in legal practice, she advised on joint ventures, mergers and acquisitions and fund-raising exercises.
Ms Ng also serves on the board of Yanlord Land Group Ltd and First Resources Ltd, both listed on SGX, and is also a director of NTUC Fairprice.
BoARD oF ADVisoRs
KS Energy Services Limited Annual Report 200918
MAnAgeMent BoARD
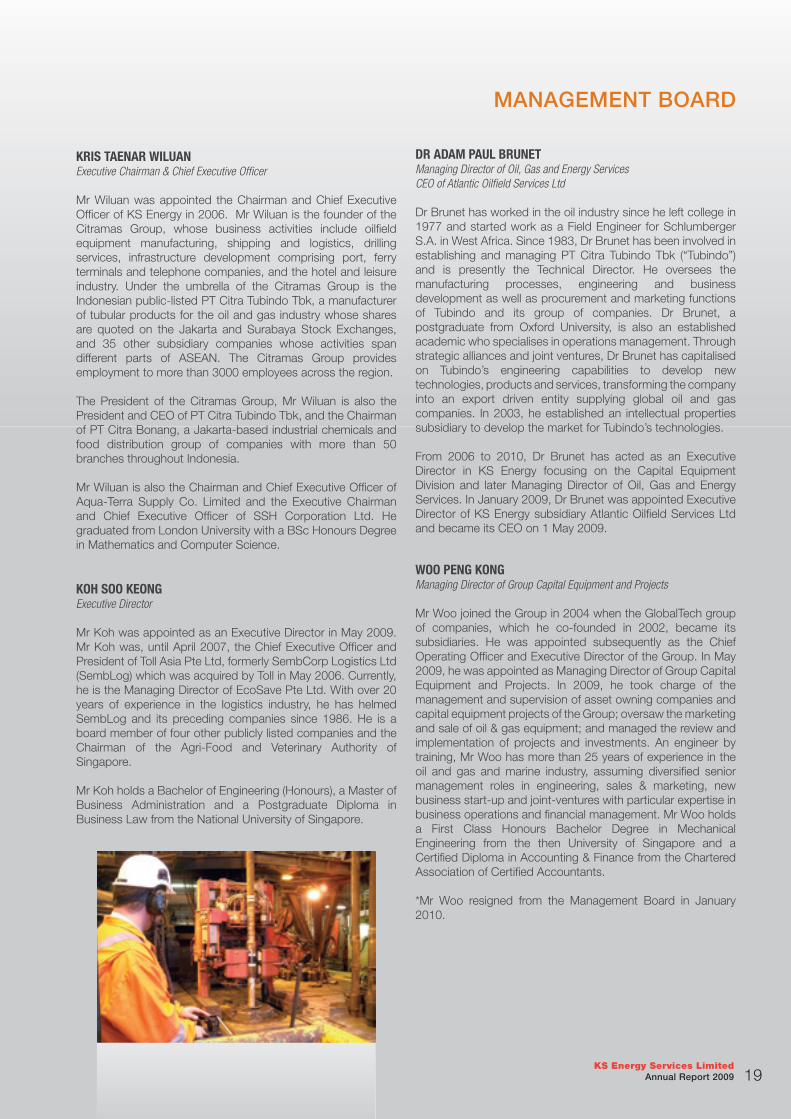
KRIS TAENAR WILUANExecutive Chairman & Chief Executive Offi cer
Mr Wiluan was appointed the Chairman and Chief Executive Offi cer of KS Energy in 2006. Mr Wiluan is the founder of the Citramas Group, whose business activities include oilfi eld equipment manufacturing, shipping and logistics, drilling services, infrastructure development comprising port, ferry terminals and telephone companies, and the hotel and leisure industry. Under the umbrella of the Citramas Group is the Indonesian public-listed PT Citra Tubindo Tbk, a manufacturer of tubular products for the oil and gas industry whose shares are quoted on the Jakarta and Surabaya Stock Exchanges, and 35 other subsidiary companies whose activities span different parts of ASEAN. The Citramas Group provides employment to more than 3000 employees across the region.
The President of the Citramas Group, Mr Wiluan is also the President and CEO of PT Citra Tubindo Tbk, and the Chairman of PT Citra Bonang, a Jakarta-based industrial chemicals and food distribution group of companies with more than 50 branches throughout Indonesia.
Mr Wiluan is also the Chairman and Chief Executive Offi cer of Aqua-Terra Supply Co. Limited and the Executive Chairman and Chief Executive Offi cer of SSH Corporation Ltd. He graduated from London University with a BSc Honours Degree in Mathematics and Computer Science.
KOH SOO KEONGExecutive Director
Mr Koh was appointed as an Executive Director in May 2009. Mr Koh was, until April 2007, the Chief Executive Offi cer and President of Toll Asia Pte Ltd, formerly SembCorp Logistics Ltd (SembLog) which was acquired by Toll in May 2006. Currently, he is the Managing Director of EcoSave Pte Ltd. With over 20 years of experience in the logistics industry, he has helmed SembLog and its preceding companies since 1986. He is a board member of four other publicly listed companies and the Chairman of the Agri-Food and Veterinary Authority of Singapore.
Mr Koh holds a Bachelor of Engineering (Honours), a Master of Business Administration and a Postgraduate Diploma in Business Law from the National University of Singapore.
DR ADAM PAUL BRUNET Managing Director of Oil, Gas and Energy ServicesCEO of Atlantic Oilfi eld Services Ltd
Dr Brunet has worked in the oil industry since he left college in 1977 and started work as a Field Engineer for Schlumberger S.A. in West Africa. Since 1983, Dr Brunet has been involved in establishing and managing PT Citra Tubindo Tbk (“Tubindo”) and is presently the Technical Director. He oversees the manufacturing processes, engineering and business development as well as procurement and marketing functions of Tubindo and its group of companies. Dr Brunet, a postgraduate from Oxford University, is also an established academic who specialises in operations management. Through strategic alliances and joint ventures, Dr Brunet has capitalised on Tubindo’s engineering capabilities to develop new technologies, products and services, transforming the company into an export driven entity supplying global oil and gas companies. In 2003, he established an intellectual properties subsidiary to develop the market for Tubindo’s technologies.
From 2006 to 2010, Dr Brunet has acted as an Executive Director in KS Energy focusing on the Capital Equipment Division and later Managing Director of Oil, Gas and Energy Services. In January 2009, Dr Brunet was appointed Executive Director of KS Energy subsidiary Atlantic Oilfi eld Services Ltd and became its CEO on 1 May 2009.
WOO PENG KONGManaging Director of Group Capital Equipment and Projects
Mr Woo joined the Group in 2004 when the GlobalTech group of companies, which he co-founded in 2002, became its subsidiaries. He was appointed subsequently as the Chief Operating Offi cer and Executive Director of the Group. In May 2009, he was appointed as Managing Director of Group Capital Equipment and Projects. In 2009, he took charge of the management and supervision of asset owning companies and capital equipment projects of the Group; oversaw the marketing and sale of oil & gas equipment; and managed the review and implementation of projects and investments. An engineer by training, Mr Woo has more than 25 years of experience in the oil and gas and marine industry, assuming diversifi ed senior management roles in engineering, sales & marketing, new business start-up and joint-ventures with particular expertise in business operations and fi nancial management. Mr Woo holds a First Class Honours Bachelor Degree in Mechanical Engineering from the then University of Singapore and a Certifi ed Diploma in Accounting & Finance from the Chartered Association of Certifi ed Accountants.
*Mr Woo resigned from the Management Board in January 2010.
KS Energy Services Limited Annual Report 2009 19

GOH BOON CHYEManaging Director of Group Distribution Business
Mr Goh joined the Group in 1999. He is responsible to grow the Group’s distribution businesses in new markets around the world. Mr Goh was the Chief Financial Offi cer in 1999. On 29 November 2002, Mr Goh held the post of Chief Operating Offi cer. Mr Goh was appointed the Chief Business Development Offi cer on 16 February 2006. Prior to 1998, Mr Goh held the post of Financial Controller in Parker Hannifi n Pte Ltd and Motorola Electronics Pte Ltd.
Mr Goh graduated from the then University of Singapore in 1976 with a Bachelor of Accountancy Degree and is a Certifi ed Accountant by profession. He also holds a MBA from Oklahoma City University. Mr Goh is a fellow of the Singapore Institute of Certifi ed Public Accountants and the Association of Chartered Certifi ed Accountants of United Kingdom.
WONG SOON YINChief Financial Offi cer
Ms Wong was appointed as Chief Financial Offi cer in December 2008. Ms Wong is responsible for the accounting and fi nance matters of the Company. She sits on the Board of various subsidiaries within the KS Group. She has almost 30 years of experience as an accounting professional. Prior to joining KS Energy, Ms Wong was the Chief Financial Offi cer of Green Dot Capital Pte Ltd. She has extensive accounting and fi nancial experience from her previous employment with the Singapore Technologies Group and Ernst & Young.
Ms Wong is a fellow with the Institute of Certifi ed Public Accountants of Singapore. She holds a Bachelor of Accountancy Degree from the then University of Singapore.
MAnAgeMent BoARD
DIANA LENGDirector of Group Treasury
Ms Leng joined the Group in 2007 and was appointed a member of the Management Board a year later. Ms Leng is responsible for Group Treasury, Corporate Finance, Mergers & Acquisitions, and all funding-related activities. She also sits on the Board of Atlantic Oilfi eld Services (AOS), the Group’s operating arm of its Capital Equipment Division as well as several other subsidiaries within the KS Group. Ms Leng brings with her considerable experience in banking and fi nance, having held several positions in banking, insurance and asset management. She started her banking career in the Netherlands, and held various positions internationally. In her last position as Director of Business Management of a global bank, she was responsible for the development and implementation of business strategies for its Corporate Lending Group in Asia. Prior to that, she was a Vice President in its Structured Finance department, handling origination, structuring and execution of transactions, as well as the provision of fi nancing solutions for clients trading in oil and other commodities. Ms Leng holds a Bachelor of Business Administration from Maastricht University, the Netherlands with a minor degree in Finance from the Leonard Stern School of Business at New York University, USA, and a Master of Business Administration (with Distinction) from Maastricht University.
NELSON McCALLUM GIBBAlternate Director to Mr Abdulla Mohammed Saleh and Director of Group Business Development
Mr Gibb was appointed as an alternate director to Mr Abdulla Mohammed Saleh on 22 December 2009. He has been with Dutco since 1996 and is currently the Group’s Chief Operating Offi cer. The Dutco Group is a leading Dubai based conglomerate comprising 20 Companies and over 25,000 employees.
The Company has signifi cant interests in all sectors of construction, hospitality & leisure, oil and gas, manufacturing, development and investments and trading. Dutco are partners in the Middle East with many international companies such as the Balfour Beatty plc from the UK and Mc Connell Dowell Ltd. from Australia. Prior to joining Dutco in 1996, Mr Gibb was the Director for the International Business of the leading Mechanical and Electrical Engineering Company, Balfour Kilpatrick Ltd (a member of the Balfour Beatty Group of Companies, a major UK listed Construction Group), whose Projects and Companies were based across Asia, Africa, and the Middle East.
Mr Gibb was educated in West Africa, Indonesia and Scotland completing his BA (Hons) at Stratchclyde University in Glasgow. Mr Gibb sits on many of the Boards of the Group of Companies of the Dutco Group.
KS Energy Services Limited Annual Report 200920
RegionAl DiRectoRs
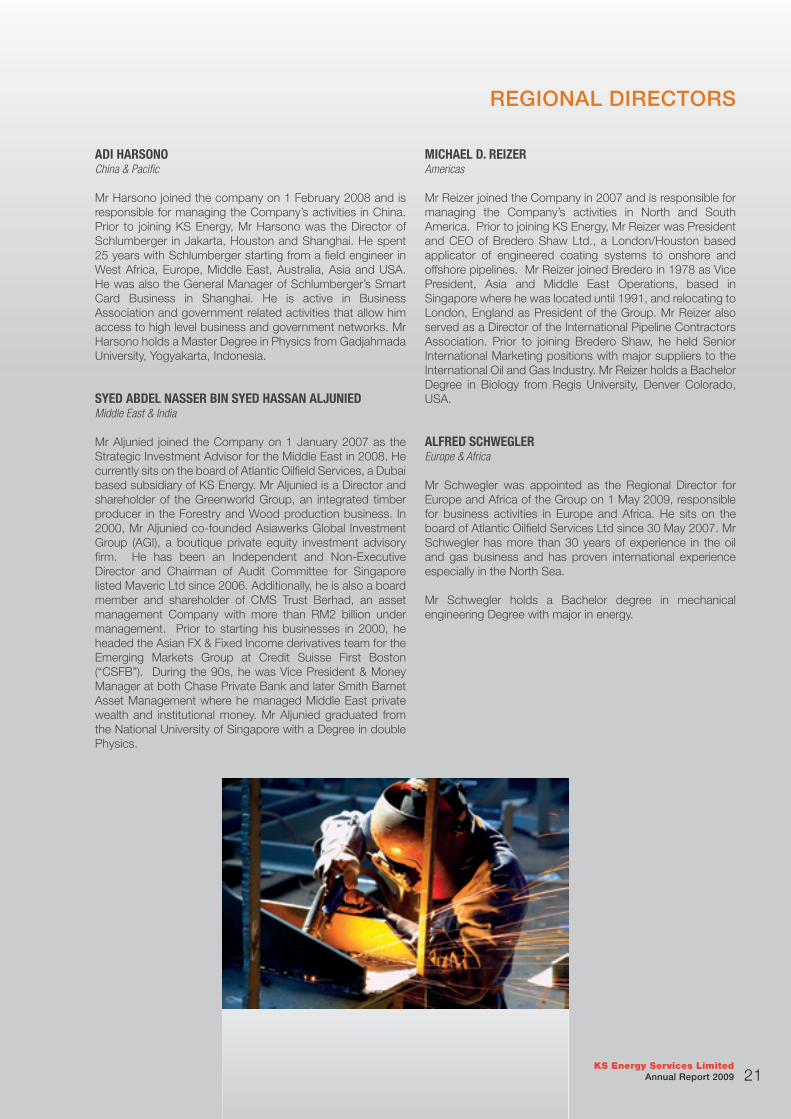
ADI HARSONOChina & Pacifi c
Mr Harsono joined the company on 1 February 2008 and is responsible for managing the Company’s activities in China. Prior to joining KS Energy, Mr Harsono was the Director of Schlumberger in Jakarta, Houston and Shanghai. He spent 25 years with Schlumberger starting from a fi eld engineer in West Africa, Europe, Middle East, Australia, Asia and USA. He was also the General Manager of Schlumberger’s Smart Card Business in Shanghai. He is active in Business Association and government related activities that allow him access to high level business and government networks. Mr Harsono holds a Master Degree in Physics from Gadjahmada University, Yogyakarta, Indonesia.
SYED ABDEL NASSER BIN SYED HASSAN ALJUNIEDMiddle East & India
Mr Aljunied joined the Company on 1 January 2007 as the Strategic Investment Advisor for the Middle East in 2008. He currently sits on the board of Atlantic Oilfi eld Services, a Dubai based subsidiary of KS Energy. Mr Aljunied is a Director and shareholder of the Greenworld Group, an integrated timber producer in the Forestry and Wood production business. In 2000, Mr Aljunied co-founded Asiawerks Global Investment Group (AGI), a boutique private equity investment advisory fi rm. He has been an Independent and Non-Executive Director and Chairman of Audit Committee for Singapore listed Maveric Ltd since 2006. Additionally, he is also a board member and shareholder of CMS Trust Berhad, an asset management Company with more than RM2 billion under management. Prior to starting his businesses in 2000, he headed the Asian FX & Fixed Income derivatives team for the Emerging Markets Group at Credit Suisse First Boston (“CSFB”). During the 90s, he was Vice President & Money Manager at both Chase Private Bank and later Smith Barnet Asset Management where he managed Middle East private wealth and institutional money. Mr Aljunied graduated from the National University of Singapore with a Degree in double Physics.
MICHAEL D. REIZERAmericas
Mr Reizer joined the Company in 2007 and is responsible for managing the Company’s activities in North and South America. Prior to joining KS Energy, Mr Reizer was President and CEO of Bredero Shaw Ltd., a London/Houston based applicator of engineered coating systems to onshore and offshore pipelines. Mr Reizer joined Bredero in 1978 as Vice President, Asia and Middle East Operations, based in Singapore where he was located until 1991, and relocating to London, England as President of the Group. Mr Reizer also served as a Director of the International Pipeline Contractors Association. Prior to joining Bredero Shaw, he held Senior International Marketing positions with major suppliers to the International Oil and Gas Industry. Mr Reizer holds a Bachelor Degree in Biology from Regis University, Denver Colorado, USA.
ALFRED SCHWEGLER Europe & Africa
Mr Schwegler was appointed as the Regional Director for Europe and Africa of the Group on 1 May 2009, responsible for business activities in Europe and Africa. He sits on the board of Atlantic Oilfi eld Services Ltd since 30 May 2007. Mr Schwegler has more than 30 years of experience in the oil and gas business and has proven international experience especially in the North Sea.
Mr Schwegler holds a Bachelor degree in mechanical engineering Degree with major in energy.
KS Energy Services Limited Annual Report 2009 21

gRoup stRuctuRe
AS AT 31ST DECEMBER 2009
28.2% SSH Corporation Ltd*
54.8% Aqua-Terra Supply Co. Limited*
70% GlobalTech System Engineering Pte Ltd
99.9% PT KS Flow Control
80% GlobalTech Offshore & Marine Pte Ltd
100% KS Equipment (Shanghai) Ltd
100% GlobalTech Group Pte Ltd
100% KS Flow Control Pte Ltd
100% KS Distribution Pte Ltd
DiStribution anD othErS
* Listed on SGX Main Board
100% Sphinx Frontier Ltd
100% QIM Ventures Limited
100% Atlantic Marine Service Egypt
100% KS Discovery (HK) Limited
100% Specialist Resources International Pte Ltd
100% KS Technical Resources Pte Ltd
100% KS Discoverer 3 (HK) Limited
100% KS Discoverer 4 Pte Ltd
100% KS North Sea Rig Pte Ltd
100% KS Oilfield Services Ltd
100% United Oilfield Services Pte Ltd
100% KS Discoverer 2 Pte Ltd
50% Global Oilfield Services Pte Ltd
70% KT Lion Oilfield Services Limited
50% KSAM2 Petrodrill Offshore Inc
50% Casadilla Group Pte Ltd
50% Girdnal Oilfield Services Inc
50% Yakki International Pte Ltd
CapitaL EquipmEnt anD rELatED SErViCES
Note 1
Note 1
Note 1
Note 1 and 2
Note 3
Note 1
Note 1: Please note that pursuant to the Business Consolidation, this structure will change upon completion of Business Consolidation
Note 2: GlobalTech Offshore & Marine Pte Ltd became a wholly-owned subsidiary of KS Flow Control Pte Ltd on 7 January 2010
Note 3: As at 7 January 2010, GlobalTech Group Pte Ltd held 82% shareholding in GlobalTech System Engineering Pte Ltd
100% Atlantic Oilfield Services Ltd
100% Atlantic Marine Services (Cyprus) Group Limited
100% Atlantic Marine Services BV
100% Atlantic Onshore Services BV
100% Atlantic Marine Services Denmark BV
KS Energy Services Limited Annual Report 200922
“Other operating income was lower in FY09 due to the reduction in the sale of investments during the year compared to FY08. As a result, other operating income was lower by 38.5%, decreasing from $16.1 million to $9.9 million in FY09.”
KS Energy Services Limited Annual Report 2009 23

Financial Contents
Corporate Governance Statement 25
Directors’ Report 34
Statement by Directors 38
Independent Auditors’ Report 39
Consolidated Income Statement 40
Balance Sheets 42
Consolidated Statement of 43
Changes in Equity
Consolidated Cash Flow Statement 45
Notes to the Financial Statements 47
Statistics of Shareholders 130
Notice of Annual General Meeting 134
Proxy Form

KS Energy Services Limited Annual Report 2009 25
CORPORATE GOVERNANCE STATEMENT
KS Energy Services Limited (the “Company”) is committed to maintaining good standards of corporate governance in conducting the Group’s business and the Board of Directors of the Company (the “Board”) ensures that an effective self-regulatory and monitoring mechanism exists and is maintained.
The Company confirms that it has adhered to the principles and guidelines as set out in the 2005 Code of Corporate Governance (“Code”), where applicable, and explanations are provided for areas of non-compliance.
BOARD OF DIRECTORS
Principle 1: Board’s Conduct of its Affairs
The Board’s primary role is to protect and enhance long-term shareholders’ value. It sets the overall strategic direction of the Company and supervises the management of the Company (the “Management”). It is also responsible for the overall corporate governance of the Company including setting its strategic direction, establishing goals for the Management and monitoring the achievement of these goals.
The principal functions of the Board apart from its statutory responsibilities are to:
a) set values and standards of the Company and ensure that obligations to shareholders and others are understood and met;
b) provide entrepreneurial leadership, approve the strategic and financial objectives, corporate policies and authorisation matrix of the Company;
c) oversee the processes for risk management, financial reporting and compliance and evaluate the adequacy of internal controls; approve annual budget, key operational matters, major acquisition and divestment proposals, major funding proposals of the Company;
d) review management performance;
e) approve the nominations to the Board of Directors and appointment of key management, as may be recommended by the Nominating Committee; and
f) assume responsibility for corporate governance framework of the Company.
To facilitate effective management, certain functions of the Board have been delegated to various Board Committees, namely Audit, Nominating and Remuneration Committees. Each Board Committee has the authority to examine particular issue and report back to the Board with their recommendations. The ultimate responsibility for the final decision on all matters, however, lies with the Board. Further information regarding the functions of the respective Board Committees is set out in the later part of this Report.
The Board conducts regular scheduled meetings on a quarterly basis. Ad-hoc meetings are convened when circumstances require. The Company’s Articles of Association (the “Articles”) provide for Board meetings to be conducted by way of telephone and video conferencing.

KS Energy Services Limited Annual Report 200926
CORPORATE GOVERNANCE STATEMENT
The attendance of the Directors at meetings of the Board and Board committees as well as number of such meetings during the financial year is set out in the table below:
Board Audit CommitteeNominating Committee
Remuneration Committee
Name of DirectorNo. of
Meetings Held
AttendanceNo. of
Meetings Held
AttendanceNo. of
Meetings Held
AttendanceNo. of
Meetings Held
Attendance
Mr. Kris Taenar Wiluan 8 8 - - 2 2 - -
Mr. Koh Soo Keong* 8 8 - - - - - -
Mr. Abdulla Mohammed Saleh* (Alternate: Nelson McCallum Gibb)
6 1 - - - - - -
Mr. Lim Ho Seng 8 8 5 5 - - 5 4
Mr. Lee Beng Cheng 8 8 5 5 2 2 5 5
Mr. Wong Meng Yeng 8 8 5 5 2 2 5 5
Mr. Goh Boon Chye * 2 2 - - - - - -
Dr. Adam Paul Brunet* 1 1 - - - - - -
Sheikh Faisal F.J. Al-Thani* 1 0 - - - - - -
Mr. Woo Peng Kong* 2 2 - - - - - -
* Dr Adam Paul Brunet retired on 28 April 2009* Sheikh Faisal F. J. Althani retired on 28 April 2009* Mr Koh Soo Keong was re-designated as an executive director on 1 May 2009 * Mr. Goh Boon Chye resigned on 1 May 2009* Mr. Woo Peng Kong resigned on 1 May 2009* Mr. Abdulla Mohammed Saleh was appointed on 1 May 2009 (Alternate: Nelson McCallum Gibb was appointed on 22 December 2009)
Principle 2: Board Composition and Balance
The Board of Directors comprises the following:
Executive Directors Mr. Kris Taenar Wiluan Mr. Koh Soo Keong
Non-Executive and Non-Independent DirectorMr. Abdulla Mohammed Saleh (Alternate: Nelson McCallum Gibb)
Non-Executive and Independent DirectorsMr. Lim Ho SengMr. Lee Beng ChengMr. Wong Meng Yeng
There is an independent element on the Board with three independent directors out of six directors of the Company.
The size of the Board is reviewed on an ongoing basis and its current size is considered appropriate for the facilitation of effective decision making. As a team, the Board collectively provides core competencies in the areas of oil and gas industry knowledge, legal, accounting, finance, business and management experience. Key information of the Board members is set out on pages 16 and 17 of the Annual Report.

KS Energy Services Limited Annual Report 2009 27
CORPORATE GOVERNANCE STATEMENT
The duties and responsibilities of the executive directors are clearly set out in their service agreements and the duties and responsibilities of the non-executive directors are clearly set out in their Engagement Letters.
Each Director is responsible for his own training needs and utilizes a budget provided by the Company for his training requirements to keep abreast developments in law, regulation, accounting and industrial practices and changes in technology.
The Company has orientation programmes for newly appointed directors to familiarise themselves with the Company’s senior management, culture, business, governance and best practices. An orientation programme was conducted for a newly appointed director, Mr Abdulla Mohammed Saleh, in FY2009.
Principle 3: Chairman and CEO
The Board is of the opinion that there is an independent element on the Board to enable independent exercise of objective judgment on corporate affairs of the Group and that there is a good balance of power and authority. As such, there is no need for the role of the Chairman and the CEO to be separated.
The Group’s Executive Chairman and Chief Executive Officer (“CEO”), Mr. Kris Taenar Wiluan plays an instrumental role in developing the business of the Group and provides the Group with strong leadership and vision. He is responsible for the operational and strategic policies of the Group. The Group’s Executive Chairman also has the responsibilities of setting the meeting agenda of the board meetings, leading the other Board members, promoting high standards of corporate governance and maintaining effective communication with shareholders of the Company.
He ensures that board meetings are held when necessary. He reviews most board papers before they are presented to the Board and ensures that board members are provided with complete, adequate and timely information. As a general rule, board papers are sent to directors in advance in order for directors to be adequately prepared for the meeting. Management staff who can provide additional insight into matters under review to be discussed, are invited to attend board meetings, as and when necessary.
The two Executive Directors and the Management Board are responsible for the day-to-day operations of the Company. There is clear division of responsibilities between the Executive Chairman and the Executive Directors.
The Executive Chairman and CEO’s performance and appointment to the Board is reviewed periodically by the Nominating Committee (“NC”) and his remuneration package is reviewed by the Remuneration Committee (“RC”).
Lead Independent Director (“LID”)
Mr Lim Ho Seng was appointed LID on 1 May 2008. As LID, Mr Lim is the principal liaison to address shareholders’ concerns, in which direct contact through normal channels of the Chairman/CEO or CFO has failed to resolve or for which such contact is inappropriate. His other specific roles as LID are as follows:
a) act as liaison between the independent directors of the Board and the Chairman of the Board;
b) advise the Chairman of the Board as to the quality, quantity and timeliness of the information submitted by the Company’s management that is necessary or appropriate for the independent directors to effectively and responsibly perform their duties;
c) assist the Board and Company officers in better ensuring compliance with and implementation of the Governance Guidelines; and
d) serve as a liaison for consultation and communication with shareholders.
KS Energy Services Limited Annual Report 200928
CORPORATE GOVERNANCE STATEMENT
Principle 6: Access to InformationPrincipal 10: Accountability
Board members are provided with management information, background and explanatory notes pertaining to such areas e.g. budget, forecast, the funding positions and quarterly financial statements of the Group, to help them carry out their responsibilities effectively. In addition, all relevant information on material events and transactions are circulated to directors as and when they arise.
All Board members have direct access to senior management and to the Company Secretary. The appointment and the removal of the Company Secretary is a matter reserved for the Board.
The Board is updated on amendments/requirements of the Singapore Exchange Securities Trading Limited (“SGX-ST”), and other statutory and regulatory requirements from time to time.
Under the direction of the Executive Chairman, the Company Secretary’s responsibilities include ensuring that:
a) board procedures are followed;
b) applicable requirements of the Companies Act and listing rules of the SGX are complied with; and
c) good information flows within the Board and its committees and between senior management and Non-Executive directors.
All Board members also have separate and independent access to the senior management of the Company and the Group. All Board members are aware that they, whether as a group or individually, in the furtherance of their duties, can take independent professional advice, if necessary, at the Company’s expense.
BOARD COMMITTEES
Nominating Committee
Principle 4: Board Membership
The Nominating Committee comprises the following:
Mr. Wong Meng Yeng (Chairman and Independent Director)Mr. Lee Beng Cheng (Independent Director)Mr. Kris Taenar Wiluan (Executive Director)
The functions of the NC include the following:
a) identify, review and recommend candidates for appointment as Directors of the Company and appointment to the Board committee as well as to senior management positions in the Company;
b) evaluate the effectiveness of the Board as a whole and assess the contribution by each Director, to the effectiveness of the Board;
c) determine annually whether or not a Director is independent; and
d) make recommendations to the Board on the re-appointment or re-election of the Directors to the Board.
During the year, the NC met, reviewed and determined the independence of the Directors.
In accordance with the provisions of the Articles, one-third of the Directors retire by rotation and subject themselves to re-election at every Annual General Meeting (“AGM”). New Directors who are appointed by the Board will submit themselves for re-election at the following AGM.

KS Energy Services Limited Annual Report 2009 29
The NC has recommended the nomination of Mr. Kris Taenar Wiluan, Mr. Lee Beng Cheng and Mr. Abdulla Mohammed Saleh, for re-election at the forthcoming AGM. Their profiles are set out in pages 16 and 17 of the Annual Report.
Principle 5: Board Performance
An evaluation of the Board performance for FY2009 was conducted by the NC. The aim of this evaluation was to review the effectiveness of the Board as a whole and to provide an opportunity to obtain constructive feedback from each Director on whether the Board’s procedures and processes had allowed him to discharge his duties effectively. Board members are encouraged to propose changes which may be made to enhance Board effectiveness as a whole.
The NC, in considering the contribution of each Director to the effectiveness of the Board, had reviewed:
a) the attendance and participation of the Directors at Board and Board Committee meetings;
b) the competing time commitments of Directors with multiple board seats; and
c) the independence of independent Directors, where applicable.
Audit Committee
Principle 11: Audit Committee
The Audit Committee comprises the following:
Mr. Lim Ho Seng (Chairman and Lead Independent Director)Mr. Lee Beng Cheng (Independent Director)Mr. Wong Meng Yeng (Independent Director)
The AC performs the following functions:
a) reviews with the external auditors, their audit plan, evaluation of the accounting controls, audit reports and any matters which the external auditors wish to discuss;
b) reviews with the internal auditors, their audit plan, the adequacy of the internal audit procedures and their evaluation of the effectiveness of the overall internal control systems, including financial, operational and compliance controls and risk management;
c) reviews the quarterly and annual financial statements, including announcements to shareholders and the SGX-ST prior to submission to the Board so as to ensure the integrity of the Company’s financial statements;
d) reviews any significant findings and recommendations of the external and internal auditors and related management response and assistance given by the management to auditors;
e) reviews interested person transactions to ensure that internal control procedures approved by the shareholders are adhered to; and
f) conducts annual review of the independence and objectivity of the external auditors, including the volume of non-audit services provided by the external auditors, to satisfy itself that the nature and extent of such services will not prejudice the independence and objectivity of the external auditors before confirming their re-nomination.
During the year, the AC had reviewed the quarterly and full-year financial statements and, considered both the external and internal audit plans. It also reviewed adequacy of internal control procedures and transactions with Interested Persons. The AC met with both the external and internal auditors, without the presence of management, to obtain feedback on Management’s co-operation during the audit and on other matters or, concerns that warrants the AC’s attention.
CORPORATE GOVERNANCE STATEMENT

KS Energy Services Limited Annual Report 200930
The Company has put in place a Whistle-Blowing Policy for the Group to encourage and to provide a channel for employees of the Group to report and to raise in good faith and in confidence, any concerns about possible improprieties in matters of financial reporting or other matters. The objective of the Whistle-Blowing Policy is to facilitate independent investigation of such matters, and for appropriate follow-up action.
The AC has full authority to commission investigations and review findings into matters when alerted of any suspected fraud, irregularity, failure of internal controls or infringement of any law that may likely to have a material impact on the Group’s operating results.
The AC had reviewed the level of non-audit services performed by the external auditors to ensure that the independence and objectivity of the external auditors are not compromised.
The AC has recommended to the Board the re-appointment of KPMG LLP as auditors for FY2010.
Principle 12: Internal ControlsPrinciple 13: Internal Audit
The Group recognises the importance of the internal audit which, being independent of Management is one of the principal means through which the AC effectively discharges its responsibilities. The internal audit function is outsourced to Messrs BDO Raffles Consultants Pte Ltd (the “IA”), which reports directly to the AC.
The Group maintains a system of internal controls for all companies within the Group, but recognises that no internal control system will preclude all errors and irregularities. The system is designed to manage rather than to eliminate the risk of failure to achieve business objectives. The controls are to provide reasonable, but not absolute, assurance to safeguard shareholders’ investments and the Group’s assets.
The AC and the Board of Directors, with the assistance of internal audit, review the effectiveness of the key internal controls, including financial, operational and compliance controls, and risk management on an on-going basis.
Based on its review, the AC believes that the internal auditor is independent and has the appropriate standing to perform its function effectively. The internal auditor plans its internal audit schedules in consultation with Management and submits its plan to the AC for approval.
As part of the effort to further enhanced the Company’s risk management process, an Enterprise Risk Management (“ERM”) Committee was formed to assist the board in identifying potential events that may affect the entity, and manage risk within its risk appetite and to provide reasonable assurance regarding the achievement of entity objectives.
Remuneration Committee
Principle 7: Procedures for Developing Remuneration PoliciesPrinciple 8: Level and Mix of RemunerationPrinciple 9: Disclosure on Remuneration
The Remuneration Committee comprises the following:
Mr. Lee Beng Cheng (Chairman and Independent Director)Mr. Lim Ho Seng (Lead Independent Director)Mr. Wong Meng Yeng (Independent Director)
The functions of the RC include the following:
a) recommending to the Board base salary level, benefits and incentive programs, and identify components of salary which can best be used to focus management staff on achieving corporate objectives;
CORPORATE GOVERNANCE STATEMENT

KS Energy Services Limited Annual Report 2009 31
b) approving the structure of compensation programme (including but not limited to Directors’ fees, salaries, allowances, bonuses, options and benefits in kind) for the Directors and senior management to ensure that the programme is competitive and sufficient to attract, retain and motivate senior management of the required quality to run the Company successfully; and
c) reviewing, on annual basis, the compensation packages of the Company’s Directors and senior management personnel and determining appropriate adjustments.
The Company’s remuneration package comprises a base/fixed salary component and a variable bonus component that is linked to the Company/Group and individual performances.
Disclosure on Directors’ Remuneration
In setting the remuneration packages of the Executive Directors, the RC takes into account the respective performances of the Group and of the individual. In its deliberation, the RC takes into consideration, remuneration packages and employment conditions within the industry and benchmarked against comparable companies.
Non-Executive Directors are paid a basic fee and an additional fee for serving on any of the committees. The Chairman of each of these committees is compensated for his additional responsibilities that may be assigned to him. Such fees are approved by the shareholders of the Company as a lump sum payment at the AGM of the Company.
The Directors did not participate in any decision concerning their own remuneration.
The breakdown of Directors’ remuneration for FY 2009 is set out below:
Breakdown of the directors’ remuneration
Salary & CPF(%)
Fee(%)
Bonus & CPF(%)
Other Benefits(%)
Total(%)
$500,000 to below $1,000,000
Mr. Kris Tanear Wiluan 73 - 27 - 100
$250,000 to below $500,000
Mr. Woo Peng Kong Note 1 86 - 7 7 100
Mr. Goh Boon Chye Note 2 74 - 16 10 100
Below $250,000
Mr. Koh Soo Keong Note 3 100 - - - 100
Dr. Adam Paul Brunet Note 4 78 - 22 - 100
Mr. Lim Ho Seng - 100 - - 100
Mr. Lee Beng Cheng - 100 - - 100
Mr. Wong Meng Yeng - 100 - - 100
Sheikh Faisal F.J. Al-Thani Note 5 - 100 - - 100
Mr. Abdulla Mohammed Saleh Note 6
(Alternate: Nelson McCallum Gibb)- 100 - - 100
Note 1: Mr. Woo Peng Kong resigned as an Executive Director on 1 May 2009Note 2: Mr. Goh Boon Chye resigned as an Executive Director on 1 May 2009Note 3: Mr. Koh Soo Keong was re-designated as an Executive Director on 1 May 2009Note 4: Dr Adam Paul Brunet retired as Executive Director on 28 April 2009 Note 5: Sheikh Faisal F.J. Al-Thani retired as Independent Director on 28 April 2009Note 6: Mr. Abdulla Mohammed Saleh was appointed on 1 May 2009 (Alternate: Nelson McCallum Gibb was appointed on 22 December 2009)
CORPORATE GOVERNANCE STATEMENT
KS Energy Services Limited Annual Report 200932
The remuneration of the top 5 executives who are not Directors of the Company, falls within the remuneration band of $200,000 to below $500,000
COMMUNICATION WITH SHAREHOLDERS
Principle 14: Communication with ShareholdersPrinciple 15: Greater Shareholder Participation
The Company strives for timeliness and transparency in its disclosures to the shareholders and the public. All information on the Company’s developments and initiatives are first disseminated via SGXNET followed by a news release, where appropriate. The Company currently holds analyst briefing upon the release of its quarterly financial results.
The Company does not practise selective disclosure. Price-sensitive information is first publicly released via SGXNET, either before the Company meets with any group of investors or analysts or simultaneously with such meetings. Results and annual reports are announced or issued within the period prescribed by the SGX-ST.
The Company regularly updates its corporate website at www.ksenergy.com.sg through which shareholders will be able to access information on the Group. The website provides a business profile, corporate announcements, press releases and other information of the Group.
At general meetings of the Company, shareholders are given the opportunity to express their views and ask questions regarding the Company and the Group. The Chairpersons of the Board Committees, external auditors and key management staff are invited to attend the AGMs of the Company.
The Board may from time to time review the provisions of the existing Articles of the Company to ensure they are in line with the good corporate governance practices as recommended by the Code. If the Board thinks fit, it may propose any necessary amendments for shareholders’ approval.
DEALINGS IN SECURITIES
The Company has adopted a policy governing dealings in the securities of the Company for Directors and employees. Directors and employees are prohibited from dealing in the securities of the Company during the period commencing two weeks before the announcement of the Company’s financial statements for the first and third quarter of its financial year, and one month before the announcement of the Company’s half year and full year financial statements, as the case may be, and ending on the date of the announcement of the relevant results.
Directors and employees of the Company are also prohibited from dealing in the securities of the Company whilst in possession of price-sensitive information. The Company issues regular circulars to its Directors, principal officers and relevant officers who have access to unpublished material price-sensitive information to remind them of the aforementioned prohibition and of the requirement to report their dealings in shares of the Company.
MATERIAL CONTRACTS
Other than as disclosed below, there were no other material contracts entered into by the Company and its subsidiaries involving the interest of the CEO, Director or controlling shareholder, which were either subsisting at the end of the financial year or, if not then subsisting, entered into since the end of the previous financial year.
CORPORATE GOVERNANCE STATEMENT
KS Energy Services Limited Annual Report 2009 33
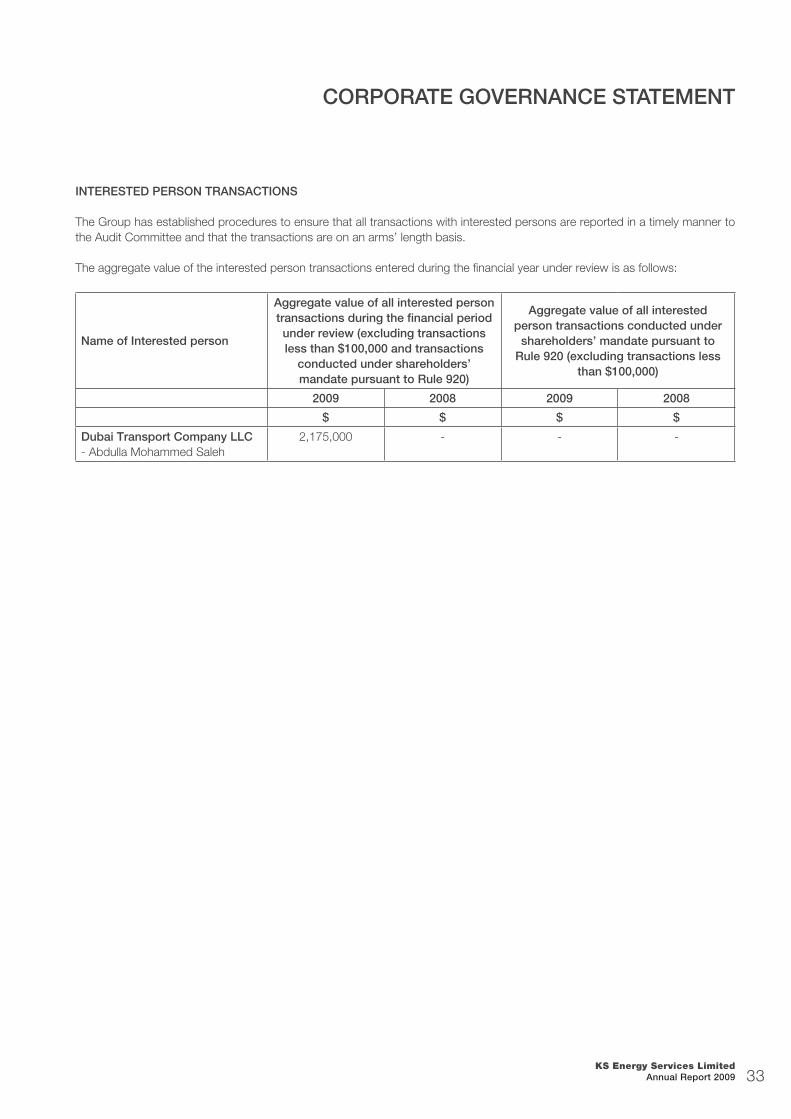
INTERESTED PERSON TRANSACTIONS
The Group has established procedures to ensure that all transactions with interested persons are reported in a timely manner to the Audit Committee and that the transactions are on an arms’ length basis.
The aggregate value of the interested person transactions entered during the financial year under review is as follows:
Name of Interested person
Aggregate value of all interested person transactions during the financial period under review (excluding transactions less than $100,000 and transactions
conducted under shareholders’ mandate pursuant to Rule 920)
Aggregate value of all interested person transactions conducted under
shareholders’ mandate pursuant to Rule 920 (excluding transactions less
than $100,000)
2009 2008 2009 2008
$ $ $ $
Dubai Transport Company LLC- Abdulla Mohammed Saleh
2,175,000 - - -
CORPORATE GOVERNANCE STATEMENT
KS Energy Services Limited Annual Report 200934
We are pleased to submit this annual report to the members of the Company, together with the audited financial statements for the financial year ended 31 December 2009.
Directors
The directors in office at the date of this report are as follows:
Kris Taenar Wiluan Koh Soo Keong Abdulla Mohammed Saleh (Appointed on 1 May 2009)(Alternate: Nelson McCallum Gibb) (Appointed on 22 December 2009)Lim Ho Seng Lee Beng Cheng Wong Meng Yeng
Directors’ interests
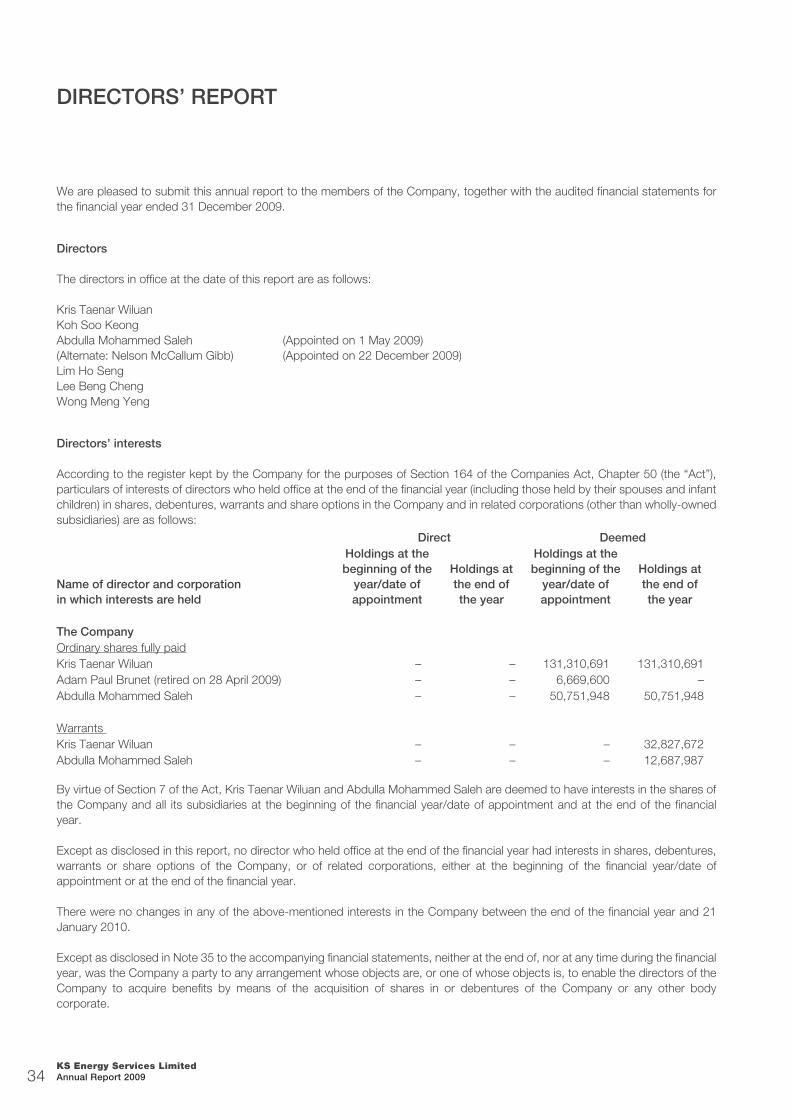
According to the register kept by the Company for the purposes of Section 164 of the Companies Act, Chapter 50 (the “Act”), particulars of interests of directors who held office at the end of the financial year (including those held by their spouses and infant children) in shares, debentures, warrants and share options in the Company and in related corporations (other than wholly-owned subsidiaries) are as follows:
Direct Deemed
Name of director and corporation in which interests are held
Holdings at the beginning of the
year/date of appointment
Holdings at the end ofthe year
Holdings at the beginning of the
year/date of appointment
Holdings at the end ofthe year
The CompanyOrdinary shares fully paidKris Taenar Wiluan – – 131,310,691 131,310,691Adam Paul Brunet (retired on 28 April 2009) – – 6,669,600 –Abdulla Mohammed Saleh – – 50,751,948 50,751,948
Warrants Kris Taenar Wiluan – – – 32,827,672Abdulla Mohammed Saleh – – – 12,687,987
By virtue of Section 7 of the Act, Kris Taenar Wiluan and Abdulla Mohammed Saleh are deemed to have interests in the shares of the Company and all its subsidiaries at the beginning of the financial year/date of appointment and at the end of the financial year.
Except as disclosed in this report, no director who held office at the end of the financial year had interests in shares, debentures, warrants or share options of the Company, or of related corporations, either at the beginning of the financial year/date of appointment or at the end of the financial year.
There were no changes in any of the above-mentioned interests in the Company between the end of the financial year and 21 January 2010.
Except as disclosed in Note 35 to the accompanying financial statements, neither at the end of, nor at any time during the financial year, was the Company a party to any arrangement whose objects are, or one of whose objects is, to enable the directors of the Company to acquire benefits by means of the acquisition of shares in or debentures of the Company or any other body corporate.
DIRECTORS’ REPORT
KS Energy Services Limited Annual Report 2009 35
Directors’ interests (cont’d)
During the financial year, the Company and/or its related corporations have in the normal course of business entered into transactions with parties which are affiliated to the directors, being related parties and parties in which some of the directors are deemed to have an interest, with the directors having disclosed their interests in such transactions pursuant to Section 156 of the Companies Act, Chapter 50. Such transactions may comprise sale and purchase of goods, operating lease arrangements, consultancy services and/or other transactions carried out on normal commercial terms and in the normal course of business of the Company and/or its related corporations. However, the directors have neither received nor become entitled to receive any benefit arising out of these transactions other than those to which they may be entitled as directors and members of these corporations.
Except as disclosed above and in Note 28 to the accompanying financial statements, since the end of the last financial year, no director has received or become entitled to receive a benefit by reason of a contract made by the Company or a related corporation with the director, or with a firm of which he is a member, or with a company in which he has a substantial financial interest.
Share options
The KS Energy Employee Share Option Scheme (the “Scheme”) and KS Energy Performance Share Plan (the “Plan”) was approved at the Company’s Extraordinary General Meeting held on 2 July 2009. The Scheme is administered by the Remuneration Committee (the “Committee”), comprising:
Lee Beng Cheng (Chairman)Wong Meng YengLim Ho Seng
Other information regarding the Scheme is set out below:
(a) Subject to the absolute discretion of the Committee, options may be granted, under the Scheme, to the Group’s employees, executive directors and non-executive directors provided that certain criteria are met. Subject to the absolute discretion of the Committee, Controlling Shareholders and their Associates who meet certain criteria are eligible to participate in the Scheme, provided that the participation of each Controlling Shareholder or his Associate and each grant of an option to any of them may only be effected with the specific prior approval of Shareholders in general meeting by a separate resolution.
(b) The aggregate number of ordinary shares over which options may be granted on any date under the Scheme, when added
to the number of ordinary shares issued and/or issuable in respect of:
all options granted under the Scheme;
all contingent award of ordinary shares granted pursuant to the rules of the Plan; and
all ordinary shares in the capital of the Company, options or awards granted under any other share option or share scheme of the Company then in force;
shall not exceed 15% of the total number of issued ordinary shares, excluding treasury shares, in the capital of the Company on the day preceding the relevant date of grant. Furthermore, the aggregate number of ordinary shares over which options may be granted under the Scheme to Controlling Shareholders and their Associates shall not exceed 25% of the ordinary shares available under the Scheme, and the number of ordinary shares over which options may be granted under the Scheme to each Controlling Shareholder or his Associate shall not exceed 10% of the ordinary shares available under the Scheme.
(c) The Scheme shall continue to be in force at the discretion of the Committee, subject to a maximum period of ten years commencing on the date on which the Scheme is adopted by shareholders of the Company in general meeting, provided that the Scheme may continue beyond the aforesaid period of time with the approval of shareholders of the Company in general meeting and of any relevant authority which may then be required.
DIRECTORS’ REPORT
KS Energy Services Limited Annual Report 200936
Share options (cont’d)
(d) The subscription price of the options shall be fixed by the Committee at its absolute discretion at:
the Market Price, determined by reference to the price equal to the average of the last dealt prices for a Share, as determined by reference to the daily official list or other publication published by the SGX-ST for five consecutive market days immediately preceding the offer date of that option, rounded up to the nearest whole cent in the event of fractional prices;
or at a discount to the Market Price, the quantum of such discount to be determined by the Committee at its absolute discretion, provided that the maximum discount shall not exceed 20% of the Market Price and is approved by shareholders of the Company in general meeting in a separate resolution.
(e) Options granted with the Exercise Price set at the Market Price may be exercised at any time after the first anniversary of the date of grant, provided that the option shall be exercised before the tenth anniversary of the date of grant or such earlier date as may be determined by the Committee, failing which the unexercised option shall immediately be null and void.
(f) Options granted with the Exercise Price set at a discount to the Market Price may be exercised at any time after the second anniversary of the date of grant, provided that the option shall be exercised before the tenth anniversary of the date of grant or such earlier date as may be determined by the Committee, failing which the unexercised option shall immediately be null and void.
(g) No options have been granted since the commencement of the Scheme.
During the financial year, there were:
(i) no options granted by the Company or its subsidiaries to any person to take up unissued shares in the Company or its subsidiaries; and
(ii) no shares issued by virtue of any exercise of options to take up unissued shares of the Company or its subsidiaries.
As at the end of the financial year, there were no unissued shares of the Company or its subsidiaries under option.
Audit Committee
The members of the Audit Committee during the year and at the date of this report are:
Lim Ho Seng (Chairman and Lead Independent Director)Lee Beng Cheng (Independent Director)Wong Meng Yeng (Independent Director)
The Audit Committee performs the functions specified in Section 201B of the Act, the SGX Listing Manual and the Code of Corporate Governance.
The Audit Committee held 5 meetings since the last directors’ report. In performing its functions, the Audit Committee met with the Company’s external and internal auditors to discuss the scope of their work, the results of their examination and evaluation of the Company’s internal accounting control system.
The Audit Committee also reviewed the following:
assistance provided by the Company’s officers to the internal and external auditors;
quarterly financial information and annual financial statements of the Group and the Company prior to their submission to the directors of the Company for adoption; and
interested person transactions (as defined in Chapter 9 of the SGX Listing Manual).
DIRECTORS’ REPORT

KS Energy Services Limited Annual Report 2009 37
Audit Committee (cont’d) The Audit Committee has full access to management and is given the resources required for it to discharge its functions. It has full authority and the discretion to invite any director or executive officer to attend its meetings. The Audit Committee also recommends the appointment of the external auditors and reviews the level of audit and non-audit fees.
The Audit Committee reviewed the independence of the external auditors as required under Section 206(1A) of the Act and determined that the external auditors were independent in carrying out their audit of the financial statements of the Group and the Company.
The Audit Committee is satisfied with the independence and objectivity of the external auditors and has recommended to the Board of Directors that the auditors, KPMG LLP, be nominated for re-appointment as auditors at the forthcoming Annual General Meeting of the Company.
The auditors, KPMG LLP, have indicated their willingness to accept re-appointment.
On behalf of the Board of Directors
_________________________________Kris Taenar WiluanDirector
_________________________________Koh Soo KeongDirector
Singapore31 March 2010
DIRECTORS’ REPORT
KS Energy Services Limited Annual Report 200938
In our opinion:
(a) the financial statements set out on pages 40 to 129 are drawn up so as to give a true and fair view of the state of affairs of the Group and of the Company as at 31 December 2009 and the results, changes in equity and cash flows of the Group for the year ended on that date in accordance with the provisions of the Singapore Companies Act, Chapter 50 and Singapore Financial Reporting Standards; and
(b) at the date of this statement, there are reasonable grounds to believe that the Company will be able to pay its debts as and when they fall due.
The Board of Directors has, on the date of this statement, authorised these financial statements for issue.
On behalf of the Board of Directors
_________________________________Kris Taenar WiluanDirector
_________________________________Koh Soo KeongDirector
Singapore31 March 2010
STATEMENT By DIRECTORS

KS Energy Services Limited Annual Report 2009 39
Members of the CompanyKS Energy Services Limited
We have audited the accompanying financial statements of KS Energy Services Limited (the “Company”) and its subsidiaries (the “Group”), which comprise the balance sheets of the Group and the Company as at 31 December 2009, the income statement, statement of comprehensive income, statement of changes in equity and cash flow statement of the Group for the year then ended, and a summary of significant accounting policies and other explanatory notes, as set out on pages 40 to 129.
Management’s responsibility for the financial statements
Management is responsible for the preparation and fair presentation of these financial statements in accordance with the provisions of the Singapore Companies Act, Chapter 50 (the “Act”) and Singapore Financial Reporting Standards. This responsibility includes:
(a) devising and maintaining a system of internal accounting controls sufficient to provide a reasonable assurance that assets are safeguarded against loss from unauthorised use or disposition; and transactions are properly authorised and that they are recorded as necessary to permit the preparation of true and fair profit and loss accounts and balance sheets and to maintain accountability of assets;
(b) selecting and applying appropriate accounting policies; and
(c) making accounting estimates that are reasonable in the circumstances.
Auditors’ responsibility
Our responsibility is to express an opinion on these financial statements based on our audit. We conducted our audit in accordance with Singapore Standards on Auditing. Those standards require that we comply with ethical requirements and plan and perform the audit to obtain reasonable assurance whether the financial statements are free from material misstatement.
An audit involves performing procedures to obtain audit evidence about the amounts and disclosures in the financial statements. The procedures selected depend on the auditor’s judgement, including the assessment of the risks of material misstatement of the financial statements, whether due to fraud or error. In making those risk assessments, the auditor considers internal control relevant to the entity’s preparation and fair presentation of the financial statements in order to design audit procedures that are appropriate in the circumstances, but not for the purpose of expressing an opinion on the effectiveness of the entity’s internal control. An audit also includes evaluating the appropriateness of accounting policies used and the reasonableness of accounting estimates made by management, as well as evaluating the overall presentation of the financial statements.
We believe that the audit evidence we have obtained is sufficient and appropriate to provide a basis for our audit opinion.
Opinion
In our opinion:
(a) the consolidated financial statements of the Group and the balance sheet of the Company are properly drawn up in accordance with the provisions of the Act and Singapore Financial Reporting Standards to give a true and fair view of the state of affairs of the Group and of the Company as at 31 December 2009 and the results, changes in equity and cash flows of the Group for the year ended on that date; and
(b) the accounting and other records required by the Act to be kept by the Company and by those subsidiaries incorporated in Singapore of which we are the auditors have been properly kept in accordance with the provisions of the Act.
KPMG LLPPublic Accountants andCertified Public Accountants
Singapore31 March 2010
INDEPENDENT AUDITORS’ REPORT

KS Energy Services Limited Annual Report 200940
GroupNote 2009 2008
$’000 $’000
Revenue 4 489,836 611,022Cost of sales (348,919) (428,596)Gross profit before direct depreciation 140,917 182,426Direct depreciation 17 (28,043) (17,326)Gross profit after direct depreciation 112,874 165,100Other operating income 9,893 16,099Distribution costs (21,065) (24,886)Administrative expenses (28,039) (37,116)Other operating expenses (23,242) (31,432)Profit from operations 5 50,421 87,765Finance costs 6 (16,969) (25,800)Share of results of associates (net of tax) (105) 8,208Share of results of jointly controlled entities (net of tax) 15 19,378 (4,631)Profit before income tax 52,725 65,542Income tax expense 7 (9,169) (5,209)Profit for the year 43,556 60,333
Attributable to:Equity holders of the Company 40,041 51,920Minority interests 3,515 8,413Profit for the year 43,556 60,333
Earnings per share:Basic (cents) 8 11.89 19.59
Diluted (cents) 8 11.89 19.59
The accompanying notes form an integral part of these financial statements.
CONSOLIDATED INCOME STATEMENTyear ended 31 December 2009

KS Energy Services Limited Annual Report 2009 41
Note 2009 2008$’000 $’000
Profit for the year 43,556 60,333
Other comprehensive incomeForeign currency translation differences for foreign operations (8,417) 475Effective portion of changes in fair value of cash flow hedge (299) (316)Change in fair value of available-for-sale equity securities – (7,537)Transferred to profit or loss on disposal of available-for-sale equity securities (1,452) (12,625)Income tax relating to components of other comprehensive income 7 222 3,004Other comprehensive expense for the year, net of income tax (9,946) (16,999)Total comprehensive income for the year 33,610 43,334
Attributable to:Owners of the Company 30,095 34,921Minority interests 3,515 8,413Total comprehensive income for the year 33,610 43,334
The accompanying notes form an integral part of these financial statements.
CONSOLIDATED STATEMENT OF COMPREHENSIVE INCOMEyear ended 31 December 2009
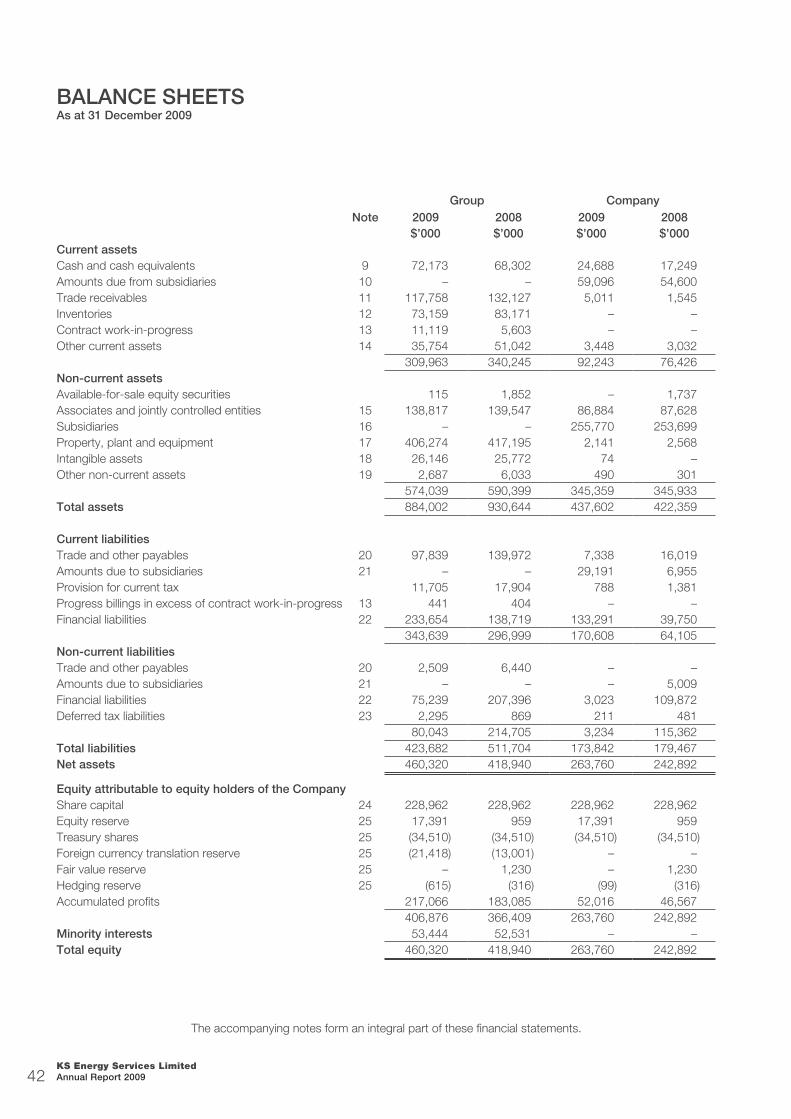
KS Energy Services Limited Annual Report 200942
Group CompanyNote 2009 2008 2009 2008
$’000 $’000 $’000 $’000Current assetsCash and cash equivalents 9 72,173 68,302 24,688 17,249Amounts due from subsidiaries 10 – – 59,096 54,600Trade receivables 11 117,758 132,127 5,011 1,545Inventories 12 73,159 83,171 – –Contract work-in-progress 13 11,119 5,603 – –Other current assets 14 35,754 51,042 3,448 3,032
309,963 340,245 92,243 76,426Non-current assetsAvailable-for-sale equity securities 115 1,852 – 1,737Associates and jointly controlled entities 15 138,817 139,547 86,884 87,628Subsidiaries 16 – – 255,770 253,699Property, plant and equipment 17 406,274 417,195 2,141 2,568Intangible assets 18 26,146 25,772 74 –Other non-current assets 19 2,687 6,033 490 301
574,039 590,399 345,359 345,933Total assets 884,002 930,644 437,602 422,359
Current liabilitiesTrade and other payables 20 97,839 139,972 7,338 16,019Amounts due to subsidiaries 21 – – 29,191 6,955Provision for current tax 11,705 17,904 788 1,381Progress billings in excess of contract work-in-progress 13 441 404 – –Financial liabilities 22 233,654 138,719 133,291 39,750
343,639 296,999 170,608 64,105Non-current liabilitiesTrade and other payables 20 2,509 6,440 – –Amounts due to subsidiaries 21 – – – 5,009Financial liabilities 22 75,239 207,396 3,023 109,872Deferred tax liabilities 23 2,295 869 211 481
80,043 214,705 3,234 115,362Total liabilities 423,682 511,704 173,842 179,467Net assets 460,320 418,940 263,760 242,892
Equity attributable to equity holders of the CompanyShare capital 24 228,962 228,962 228,962 228,962Equity reserve 25 17,391 959 17,391 959Treasury shares 25 (34,510) (34,510) (34,510) (34,510)Foreign currency translation reserve 25 (21,418) (13,001) – –Fair value reserve 25 – 1,230 – 1,230Hedging reserve 25 (615) (316) (99) (316)Accumulated profits 217,066 183,085 52,016 46,567
406,876 366,409 263,760 242,892Minority interests 53,444 52,531 – –Total equity 460,320 418,940 263,760 242,892
The accompanying notes form an integral part of these financial statements.
BALANCE SHEETSAs at 31 December 2009
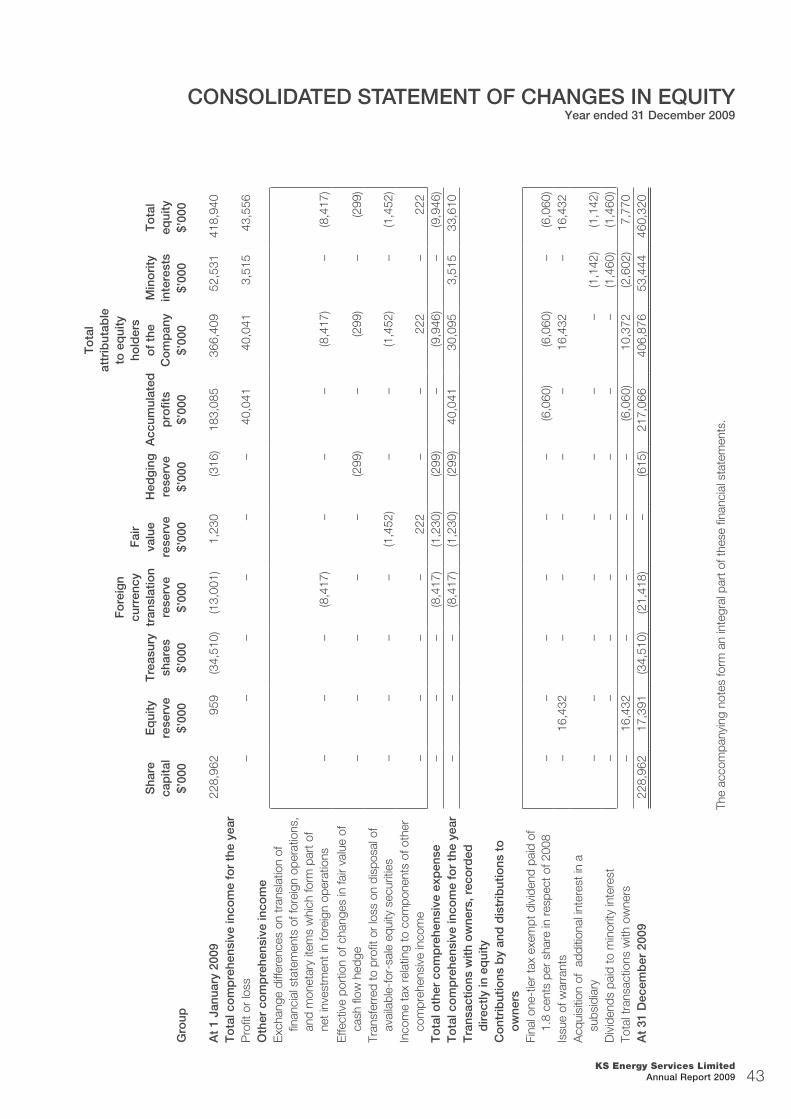
KS Energy Services Limited Annual Report 2009 43
Sha
re
cap
ital
Eq
uity
re
serv
eT
reas
ury
shar
es
Fo
reig
n cu
rren
cy
tran
slat
ion
rese
rve
Fai
r va
lue
rese
rve
Hed
gin
g
rese
rve
Acc
umul
ated
p
rofit
s
To
tal
attr
ibut
able
to
eq
uity
ho
lder
s o
f th
e C
om
pan
yM
ino
rity
in
tere
sts
To
tal
equi
tyG
roup
$’00
0$’
000
$’00
0$’
000
$’00
0$’
000
$’00
0$’
000
$’00
0$’
000
At
1 Ja
nuar
y 20
0922
8,96
295
9(3
4,51
0)(1
3,00
1)1,
230
(316
)18
3,08
536
6,40
952
,531
418,
940
To
tal c
om
pre
hens
ive
inco
me
for
the
year
Pro
fit o
r lo
ss–
––
––
–40
,041
40,0
413,
515
43,5
56O
ther
co
mp
rehe
nsiv
e in
com
eE
xcha
nge
diffe
renc
es o
n tr
ansl
atio
n of
fin
anci
al s
tate
men
ts o
f for
eign
ope
ratio
ns,
and
mon
etar
y ite
ms
whi
ch fo
rm p
art o
f ne
t inv
estm
ent i
n fo
reig
n op
erat
ions
––
–(8
,417
)–
––
(8,4
17)
–(8
,417
)E
ffect
ive
port
ion
of c
hang
es in
fair
valu
e of
ca
sh fl
ow h
edge
–
––
––
(299
)–
(299
)–
(299
)Tr
ansf
erre
d to
pro
fit o
r lo
ss o
n di
spos
al o
f av
aila
ble-
for-
sale
equ
ity s
ecur
ities
––
––
(1,4
52)
––
(1,4
52)
–(1
,452
)In
com
e ta
x re
latin
g to
com
pone
nts
of o
ther
co
mpr
ehen
sive
inco
me
––
––
222
––
222
–22
2T
ota
l oth
er c
om
pre
hens
ive
exp
ense
––
–(8
,417
)(1
,230
)(2
99)
–(9
,946
)–
(9,9
46)
To
tal c
om
pre
hens
ive
inco
me
for
the
year
––
–(8
,417
)(1
,230
)(2
99)
40,0
4130
,095
3,51
533
,610
Tra
nsac
tions
with
ow
ners
, rec
ord
ed
dir
ectly
in e
qui
tyC
ont
rib
utio
ns b
y an
d d
istr
ibut
ions
to
o
wne
rsFi
nal o
ne-t
ier
tax
exem
pt d
ivid
end
paid
of
1.8
cent
s pe
r sh
are
in r
espe
ct o
f 200
8–
––
––
–(6
,060
)(6
,060
)–
(6,0
60)
Issu
e of
war
rant
s –
16,4
32–
––
––
16,4
32–
16,4
32A
cqui
sitio
n of
add
ition
al in
tere
st in
a
subs
idia
ry–
––
––
––
–(1
,142
)(1
,142
)D
ivid
ends
pai
d to
min
ority
inte
rest
––
––
––
––
(1,4
60)
(1,4
60)
Tota
l tra
nsac
tions
with
ow
ners
–16
,432
––
––
(6,0
60)
10,3
72(2
,602
)7,
770
At
31 D
ecem
ber
200
922
8,96
217
,391
(34,
510)
(21,
418)
–(6
15)
217,
066
406,
876
53,4
4446
0,32
0
The
acco
mpa
nyin
g no
tes
form
an
inte
gral
par
t of t
hese
fina
ncia
l sta
tem
ents
.
CONSOLIDATED STATEMENT OF CHANGES IN EqUITyyear ended 31 December 2009

KS Energy Services Limited Annual Report 200944
Sha
re
cap
ital
Eq
uity
re
serv
eT
reas
ury
shar
es
Fo
reig
n cu
rren
cy
tran
slat
ion
rese
rve
Fai
r va
lue
rese
rve
Hed
gin
g
rese
rve
Acc
umul
ated
p
rofit
s
To
tal
attr
ibut
able
to
eq
uity
ho
lder
s o
f th
e C
om
pan
yM
ino
rity
in
tere
sts
To
tal
equi
tyG
roup
$’00
0$’
000
$’00
0$’
000
$’00
0$’
000
$’00
0$’
000
$’00
0$’
000
At
1 Ja
nuar
y 20
0875
,941
959
(34,
510)
(13,
476)
18,3
88–
147,
879
195,
181
46,4
3624
1,61
7T
ota
l co
mp
rehe
nsiv
e in
com
e fo
r th
e ye
arP
rofit
for
the
year
––
––
––
51,9
2051
,920
8,41
360
,333
Oth
er c
om
pre
hens
ive
inco
me
Exc
hang
e di
ffere
nces
on
tran
slat
ion
of fi
nanc
ial
stat
emen
ts o
f for
eign
ope
ratio
ns, a
nd
mon
etar
y ite
ms
whi
ch fo
rm p
art o
f net
in
vest
men
t in
fore
ign
oper
atio
ns–
––
475
––
–47
5–
475
Effe
ctiv
e po
rtio
n of
cha
nges
in fa
ir va
lue
of c
ash
flow
hed
ge–
––
––
(316
)–
(316
)–
(316
)C
hang
e in
fair
valu
e of
ava
ilabl
e-fo
r-sa
le e
quity
se
curit
ies
––
––
(7,5
37)
––
(7,5
37)
–(7
,537
)Tr
ansf
erre
d to
pro
fit o
r lo
ss o
n di
spos
al o
f av
aila
ble-
for-
sale
equ
ity s
ecur
ities
––
––
(12,
625)
––
(12,
625)
–(1
2,62
5)In
com
e ta
x re
latin
g to
com
pone
nts
of o
ther
co
mpr
ehen
sive
inco
me
––
––
3,00
4–
–3,
004
–3,
004
To
tal o
ther
co
mp
rehe
nsiv
e in
com
e –
––
475
(17,
158)
(316
)–
(16,
999)
–(1
6,99
9)T
ota
l co
mp
rehe
nsiv
e in
com
e fo
r th
e ye
ar–
––
475
(17,
158)
(316
)51
,920
34,9
218,
413
43,3
34T
rans
actio
ns w
ith o
wne
rs, r
eco
rded
dir
ectly
in
eq
uity
Co
ntri
but
ions
by
and
dis
trib
utio
ns t
o o
wne
rsIs
sue
of n
ew s
hare
s15
3,02
1–
––
––
–15
3,02
1–
153,
021
Fina
l one
-tie
r ta
x ex
empt
div
iden
d pa
id o
f 3.0
ce
nts
per
shar
e in
res
pect
of 2
007
––
––
––
(7,2
15)
(7,2
15)
–(7
,215
)In
terim
one
-tie
r ta
x ex
empt
div
iden
d pa
id o
f 3.5
ce
nts
per
shar
e–
––
––
–(8
,417
)(8
,417
)–
(8,4
17)
Spe
cial
inte
rim o
ne-t
ier
tax
exem
pt d
ivid
end
paid
of 0
.45
cent
s pe
r sh
are
––
––
––
(1,0
82)
(1,0
82)
–(1
,082
)A
cqui
sitio
n of
sub
sidi
arie
s–
––
––
––
–74
874
8D
ivid
ends
pai
d to
min
ority
inte
rest
––
––
––
––
(1,8
76)
(1,8
76)
Dis
posa
l of s
ubsi
diar
ies
––
––
––
––
(1,1
90)
(1,1
90)
Tota
l tra
nsac
tions
with
ow
ners
153,
021
––
––
–(1
6,71
4)13
6,30
7(2
,318
)13
3,98
9A
t 31
Dec
emb
er 2
008
228,
962
959
(34,
510)
(13,
001)
1,23
0(3
16)
183,
085
366,
409
52,5
3141
8,94
0
The
acco
mpa
nyin
g no
tes
form
an
inte
gral
par
t of t
hese
fina
ncia
l sta
tem
ents
.
CONSOLIDATED STATEMENT OF CHANGES IN EqUITyyear ended 31 December 2009

KS Energy Services Limited Annual Report 2009 45
Group2009 2008$’000 $’000
Operating activitiesProfit before income tax 52,725 65,542Adjustments for:Amortisation of intangible assets 1,608 4,794Depreciation of property, plant and equipment 33,571 21,251Dividend income from available-for-sale equity securities – (882)Impairment loss on intangible assets 82 –Impairment loss on property, plant and equipment 3,068 –Gain on disposal of associate (1,996) –Gain on disposal of available-for-sale equity securities (4,551) (11,317)(Gain)/Loss on disposal of property, plant and equipment (161) 109(Gain)/Loss on liquidation/disposal of subsidiaries (271) 137Interest income (328) (1,912)Finance costs 16,969 25,800Negative goodwill (27) –Plant and equipment written off 38 77Share of results of associates 105 (8,208)Share of results of jointly controlled entities (19,378) 4,631Operating profit before changes in working capital 81,454 100,022
Changes in working capital:Change in inventories 10,452 57,342Change in trade receivables 18,665 (5,061)Change in contract work-in-progress (5,516) (5,405)Change in other current assets 11,913 14,068Change in trade and other payables (40,550) 9,022Cash generated from operations 76,418 169,988Income taxes paid (13,736) (7,716)Cash flows from operating activities 62,682 162,272
The accompanying notes form an integral part of these financial statements.
CONSOLIDATED CASH FLOW STATEMENTyear ended 31 December 2009
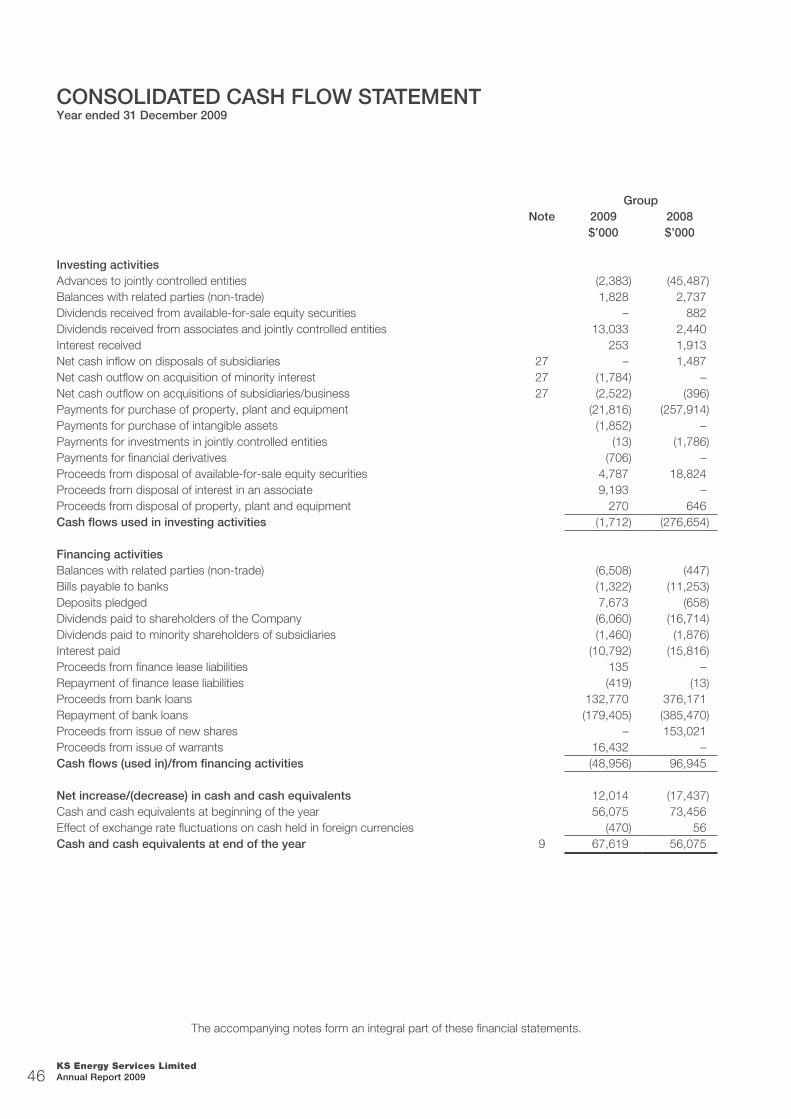
KS Energy Services Limited Annual Report 200946
GroupNote 2009 2008
$’000 $’000
Investing activitiesAdvances to jointly controlled entities (2,383) (45,487)Balances with related parties (non-trade) 1,828 2,737Dividends received from available-for-sale equity securities – 882Dividends received from associates and jointly controlled entities 13,033 2,440Interest received 253 1,913Net cash inflow on disposals of subsidiaries 27 – 1,487Net cash outflow on acquisition of minority interest 27 (1,784) –Net cash outflow on acquisitions of subsidiaries/business 27 (2,522) (396)Payments for purchase of property, plant and equipment (21,816) (257,914)Payments for purchase of intangible assets (1,852) –Payments for investments in jointly controlled entities (13) (1,786)Payments for financial derivatives (706) –Proceeds from disposal of available-for-sale equity securities 4,787 18,824Proceeds from disposal of interest in an associate 9,193 –Proceeds from disposal of property, plant and equipment 270 646Cash flows used in investing activities (1,712) (276,654)
Financing activitiesBalances with related parties (non-trade) (6,508) (447)Bills payable to banks (1,322) (11,253)Deposits pledged 7,673 (658)Dividends paid to shareholders of the Company (6,060) (16,714)Dividends paid to minority shareholders of subsidiaries (1,460) (1,876)Interest paid (10,792) (15,816)Proceeds from finance lease liabilities 135 –Repayment of finance lease liabilities (419) (13)Proceeds from bank loans 132,770 376,171Repayment of bank loans (179,405) (385,470)Proceeds from issue of new shares – 153,021Proceeds from issue of warrants 16,432 –Cash flows (used in)/from financing activities (48,956) 96,945
Net increase/(decrease) in cash and cash equivalents 12,014 (17,437)Cash and cash equivalents at beginning of the year 56,075 73,456Effect of exchange rate fluctuations on cash held in foreign currencies (470) 56Cash and cash equivalents at end of the year 9 67,619 56,075
The accompanying notes form an integral part of these financial statements.
CONSOLIDATED CASH FLOW STATEMENTyear ended 31 December 2009
KS Energy Services Limited Annual Report 2009 47
These notes form an integral part of the financial statements.
The financial statements were authorised for issue by the Board of Directors on 31 March 2010.
1 Domicile and activities
KS Energy Services Limited (the “Company”) is incorporated in the Republic of Singapore and has its registered office at No. 19 Jurong Port Road, Singapore 619093.
The principal activities of the Company are those of trading in hydraulic products, instrumentation and equipment for the shipbuilding, marine and oil and gas industries, commission agents, trading in hardware products and oilfield equipment, and investment holding. The principal activities of the subsidiaries are set out in Note 16 to the financial statements.
The consolidated financial statements relate to the Company and its subsidiaries (together referred to as the “Group”) and the Group’s interests in associates and jointly controlled entities.
2 Basis of preparation
2.1 Statement of compliance
The financial statements have been prepared in accordance with Singapore Financial Reporting Standards (“FRS”).
2.2 Basis of measurement
The financial statements have been prepared on the historical cost basis except for the following material items in the balance sheet:
derivative financial instruments are measured at fair value
financial instruments at fair value through profit or loss are measured at fair value
available-for-sale financial assets are measured at fair value
2.3 Going concern basis of preparation of financial statements
As described in Note 22, the Group and the Company have existing convertible notes with a carrying value of $109.1 million as at 31 December 2009 which have been reclassified as current liabilities as at 31 December 2009. The Company has refinanced a portion of its existing convertible notes and is confident of securing further funding to refinance and/or redeem the remaining convertible notes before their maturity dates, including the Company having in place a standby financial arrangement which will provide adequate funds to meet the remaining obligations under the existing convertible notes, if the need arises.
The Group and the Company have investments in and loans to a jointly controlled entity, KSAM2 Petrodrill Offshore Inc., with a carrying value of $56.8 million and $57.1 million respectively as at 31 December 2009. As set out in Note 15, the Group and the Company have to fulfil outstanding capital commitments to complete the construction of the asset (“KS Endeavor”) of the jointly controlled entity. The Company and one of the joint venture partners are in the process of negotiating with financial institutions to provide financing for the in-progress project. The directors are confident of meeting the required funding needs.
The directors are of the opinion that the Group and the Company will be able to continue to operate as a going concern with the above initiatives implemented by the Company. Accordingly, the financial statements of the Group and of the Company have been prepared on a going concern basis. The financial statements do not include any adjustments relating to recoverability and classification of recorded asset amounts or to amounts and classification of liabilities that may be necessary if the Group and the Company are unable to continue as a going concern.
NOTES TO THE FINANCIAL STATEMENTS

KS Energy Services Limited Annual Report 200948
2 Basis of preparation (cont’d)
2.4 Functional and presentation currency
Items included in the financial statements of each entity in the Group are measured using the currency that best reflects the economic substance of the underlying transactions, events and conditions relevant to that entity (the “functional currency”).
The consolidated financial statements are presented in Singapore dollars, which is the Company’s functional currency. All financial information presented in Singapore dollars has been rounded to the nearest thousand, unless otherwise stated.
2.5 Use of estimates and judgements
The preparation of financial statements in conformity with FRSs requires management to make judgements, estimates and assumptions that affect the application of accounting policies and the reported amounts of assets, liabilities, income and expenses. Actual results may differ from these estimates.
Estimates and underlying assumptions are reviewed on an ongoing basis. Revisions to accounting estimates are recognised in the period in which the estimates are revised and in any future periods affected.
In particular, information about significant areas of estimation uncertainty and critical judgements in applying accounting policies that have the most significant effect on the amount recognised in the financial statements and that have a significant risk of resulting in a material adjustment within the next financial year are described in the following notes:
Note 4 – estimation of revenue from shipbuilding contracts
Note 7 – estimation of provisions for current and deferred taxation
Note 11 – assessment of the recoverability of trade and other receivables
Note 12 – assessment of the allowance for inventory obsolescence or slow-moving stocks or for any shortfall in net realisable value of inventories
Note 15 – assumptions of recoverable amounts relating to investments in associates and jointly controlled entities and loans to jointly controlled entities
Note 16 – assumptions of recoverable amounts relating to investments in and loans to subsidiaries
Note 17 – depreciation and impairment of property, plant and equipment
Note 18 – assumptions of recoverable amounts relating to goodwill impairment
Note 27 – allocation of the Group’s purchase price for subsidiaries acquired during the year to identifiable assets and liabilities
2.6 Changes in accounting policies
Overview
Starting as of 1 January 2009 on adoption of new/revised FRSs, the Group has changed its accounting policies in the following areas:
Determination and presentation of operating segments
Presentation of financial statements
Disclosure of financial risks
NOTES TO THE FINANCIAL STATEMENTS
KS Energy Services Limited Annual Report 2009 49
2 Basis of preparation (cont’d)
2.6 Changes in accounting policies (cont’d)
Determination and presentation of operating segments
As of 1 January 2009, the Group determines and presents operating segments based on the information that internally is provided to the Chief Executive Officer (“CEO”), who is the Group’s chief operating decision maker. This change in accounting policy is due to the adoption of FRS 108 Operating Segments. Previously operating segments were determined and presented in accordance with FRS 14 Segment Reporting. The new accounting policy in respect of operating segment disclosure is presented as follows.
Comparative segment information has been re-presented in conformity with the transitional requirements of such standard. Since the change in accounting policy only impacts presentation and disclosure aspects, there is no impact on earnings per share.
An operating segment is a component of the Group that engages in business activities from which it may earn revenues and incur expenses, including revenues and expenses that relate to transactions with any of the Group’s other components. An operating segment’s operating results are reviewed regularly by the CEO to make decisions about resources to be allocated to the segment and assess its performance, and for which discrete financial information is available.
Segment results that are reported to the CEO include items directly attributable to a segment as well as those that can be allocated on a reasonable basis. Unallocated items comprise mainly corporate assets, corporate expenses, and income tax assets and liabilities.
Segment capital expenditure is the total cost incurred during the period to acquire property, plant and equipment, and intangible assets other than goodwill.
Presentation of financial statements
The Group applies revised FRS 1 Presentation of Financial Statements (2008), which became effective as of 1 January 2009. As a result, the Group presents in the consolidated statement of changes in equity all owner changes in equity, whereas all non-owner changes in equity are presented in the consolidated statement of comprehensive income.
Comparative information has been re-presented so that it is also in conformity with the revised standard. Since the change in accounting policy only impacts presentation aspects, there is no impact on earnings per share.
Disclosure of financial risks
The Group applies the amendments to FRS 107 Financial Instruments: Disclosures, which became effective as of 1 January 2009. Amendments to FRS 107 require additional disclosure of fair value measurements and liquidity risk. The fair value measurement and liquidity risk disclosures are presented in Note 29. In addition, the Group discloses the maximum amount of issued financial guarantees in the earliest time period for which the guarantees could be called upon in the contractual maturity analysis. Previously, the Group disclosed the maximum amount of issued financial guarantees in the contractual maturity analysis only if the Group assessed that it is probable that the guarantee would be called upon.
FRS 107 does not require comparative information to be restated and therefore, the contractual maturity analysis for the comparative period has not been re-presented. Since the change in accounting policy only impacts presentation and disclosure aspects, there is no impact on earnings per share.
3 Significant accounting policies
The accounting policies set out below have been applied consistently to all periods presented in these financial statements, and have been applied consistently by Group entities, except as explained in Note 2.6, which addresses changes in accounting policies.
NOTES TO THE FINANCIAL STATEMENTS

KS Energy Services Limited Annual Report 200950
3 Significant accounting policies (cont’d)
3.1 Basis of consolidation
Business combinations
Business combinations are accounted for under the purchase method. The cost of an acquisition is measured at the fair value of the assets given, equity instruments issued and liabilities incurred or assumed at the date of exchange, plus costs directly attributable to the acquisition.
The excess of the Group’s interest in the net fair value of the identifiable assets, liabilities and contingent liabilities over the cost of acquisition is credited to profit or loss in the period of the acquisition.
Acquisitions from entities under common control
Business combinations arising from transfers of interests in entities that are under the control of the shareholder that controls the Group are accounted for as if the acquisition had occurred at the beginning of the earliest comparative period presented or, if later, at the date that common control was established; for this purpose, comparatives are restated. The assets and liabilities acquired are recognised at the carrying amounts recognised previously in the Group’s controlling shareholder’s consolidated financial statements. The components of equity of the acquired entities are added to the same components within Group equity except that any share capital of the acquired entities is recognised as part of capital reserve. Any difference between the cash paid for the acquisition and net assets acquired is recognised directly in equity.
Subsidiaries
Subsidiaries are entities controlled by the Group. Control exists when the Group has the power to govern the financial and operating policies of an entity so as to obtain benefits from its activities. In assessing control, potential voting rights presently exercisable are taken into account. The financial statements of subsidiaries are included in the consolidated financial statements from the date that control commences until the date that control ceases.
Associates and jointly controlled entities (equity accounted investees)
Associates are those entities in which the Group has significant influence, but not control, over their financial and operating policies. Significant influence is presumed to exist when the Group holds between 20% and 50% of the voting power of another entity. Jointly controlled entities are entities over whose activities the Group has joint control, established by contractual agreements and requiring unanimous consent for strategic financial and operating decisions.
Associates and jointly controlled entities (collectively referred to as “equity accounted investees”) are accounted for using the equity method and are recognised initially at cost. The Group’s investments include goodwill identified on acquisition, net of any accumulated impairment losses. The consolidated financial statements include the Group’s share of the income, expenses and equity movements of equity accounted investees, after adjustments to align their accounting policies with those of the Group, from the date that significant influence or joint control commences until the date that significant influence or joint control ceases.
When the Group’s share of losses exceeds its interest in an equity accounted investee, the carrying amount of that interest, including any long-term investments, is reduced to nil, and the recognition of further losses is discontinued except to the extent that the Group has an obligation or has made payments on behalf of the investee.
Transactions eliminated on consolidation
Intra-group balances and transactions, and any unrealised income and expenses arising from intra-group transactions, are eliminated in preparing the consolidated financial statements. Unrealised gains arising from transactions with equity accounted investees are eliminated against the investment to the extent of the Group’s interest in the investee. Unrealised losses are eliminated in the same way as unrealised gains, but only to the extent that there is no evidence of impairment.
NOTES TO THE FINANCIAL STATEMENTS

KS Energy Services Limited Annual Report 2009 51
3 Significant accounting policies (cont’d)
3.1 Basis of consolidation (cont’d)
Accounting for subsidiaries, associates and jointly controlled entities by the Company
Investments in subsidiaries, associates and jointly controlled entities are stated in the Company’s balance sheet at cost less accumulated impairment losses.
3.2 Foreign currencies
Foreign currency transactions
Transactions in foreign currencies are translated to the respective functional currencies of Group entities at exchange rates at the dates of the transactions. Monetary assets and liabilities denominated in foreign currencies at the balance sheet date are retranslated to the functional currency at the exchange rate at that date. The foreign currency gain or loss on monetary items is the difference between amortised cost in the functional currency at the beginning of the period, adjusted for effective interest and payments during the period, and the amortised cost in foreign currency translated at the exchange rate at the end of the reporting period. Non-monetary assets and liabilities denominated in foreign currencies that are measured at fair value are retranslated to the functional currency at the exchange rate at the date on which the fair value was determined. Non-monetary items that are measured in terms of historical cost in a foreign currency are translated using the exchange rate at the date of the transaction.
Foreign currency differences arising on retranslation are recognised in profit or loss, except for differences arising on the retranslation of monetary items that in substance form part of the Group’s net investment in a foreign operation (see below), which are recognised in other comprehensive income.
Foreign operations
The assets and liabilities of foreign operations, including goodwill and fair value adjustments arising on the acquisition of foreign operations, are translated to Singapore dollars for consolidation at exchange rates prevailing at the balance sheet date. The income and expenses of foreign operations (none of which has the currency of a hyperinflationary economy as its functional currency) are translated to Singapore dollars at exchange rates prevailing at the dates of the transactions.
Foreign currency differences are recognised in other comprehensive income. When a foreign operation is disposed of, in part or in full, the relevant amount in the foreign currency translation reserve is transferred to profit or loss as part of the profit or loss on disposal.
Net investment in a foreign operation
When the settlement of a monetary item receivable from or payable to a foreign operation is neither planned nor likely in the foreseeable future, foreign exchange gains and losses arising from such a monetary item are considered to form part of a net investment in a foreign operation and are recognised in other comprehensive income, and are presented within equity in the foreign currency translation reserve. When the foreign operation is disposed of, the cumulative amount in foreign currency translation reserve is transferred to profit or loss as part of profit or loss on disposal.
NOTES TO THE FINANCIAL STATEMENTS
KS Energy Services Limited Annual Report 200952
3 Significant accounting policies (cont’d)
3.3 Property, plant and equipment
Recognition and measurement
Items of property, plant and equipment are stated at cost less accumulated depreciation and accumulated impairment losses.
Cost includes expenditure that is directly attributable to the acquisition of the asset. The cost of self-constructed assets includes the cost of materials and direct labour, any other costs directly attributable to bringing the asset to a working condition for its intended use, the cost of dismantling and removing the items and restoring the site on which they are located, and capitalised borrowing costs. Purchased software that is integral to the functionality of the related equipment is capitalised as part of that equipment.
When parts of an item of property, plant and equipment have different useful lives, they are accounted for as separate items (major components) of property, plant and equipment.
Leased assets
Leased assets in which the Group assumes substantially all the risks and rewards of ownership are classified as finance leases. Upon initial recognition, property, plant and equipment acquired through finance leases are capitalised at the lower of its fair value and the present value of the minimum lease payments. Subsequent to initial recognition, the asset is stated at cost less accumulated depreciation and accumulated impairment losses. Leased assets are depreciated over the shorter of the lease term and their useful lives.
Subsequent costs
The cost of replacing a part of an item of property, plant and equipment is recognised in the carrying amount of the item if it is probable that the future economic benefits embodied within the part will flow to the Group, and its cost can be measured reliably. The costs of the day-to-day servicing of property, plant and equipment are recognised in profit or loss as incurred.
Disposals
Gains or losses arising on disposal of an item of property, plant and equipment are determined by comparing the proceeds from disposal with the carrying amount of property, plant and equipment, and are recognised net within other income in profit or loss on the date of disposal.
Depreciation
Depreciation is calculated over the depreciable amount, which is the cost of an asset, or other amount substituted for cost, less its residual value.
No depreciation is provided on assets under construction. Depreciation on other property, plant and equipment is recognised in profit or loss on a straight-line basis over the estimated useful lives of each part of an item of property, plant and equipment, since this most closely reflects the expected pattern of consumption of the future economic benefits embodied in the asset. Leased assets are depreciated over the shorter of the lease term and their useful lives unless it is reasonably certain that the Group will obtain ownership by the end of the lease term.
NOTES TO THE FINANCIAL STATEMENTS

KS Energy Services Limited Annual Report 2009 53
3 Significant accounting policies (cont’d)
3.3 Property, plant and equipment (cont’d)
Depreciation (cont’d)
The estimated useful lives are as follows:
Leasehold properties Remaining lease termPlant and machinery 5 to 10 yearsRigs 10 to 20 yearsRenovation, furniture and fittings 3 to 10 years Office equipment 3 to 7 yearsMotor vehicles 5 to 7 years
Dry docking is considered a separate component of the rig and is separately depreciated over the period between dry dockings, or from acquisition until the next dry docking.
Depreciation methods, useful lives and residual values are reviewed at each balance sheet date, and adjusted if appropriate.
3.4 Intangible assets
Goodwill
Goodwill and negative goodwill arise on the acquisition of subsidiaries, associates and jointly controlled entities.
Acquisitions occurring between 1 January 2001 and 1 January 2005
Goodwill represents the excess of the cost of the acquisition over the Group’s interest in the net fair value of the identifiable assets and liabilities of the acquiree.
Goodwill arising on the acquisition of subsidiaries is presented in intangible assets. Goodwill arising on the acquisition of associates and jointly controlled entities is presented together with investments in associates and jointly controlled entities.
Goodwill was stated at cost from the date of initial recognition and amortised over its estimated useful life of 20 years. On 1 January 2005, the Group discontinued amortisation of this goodwill. This remaining goodwill balance is subject to testing for impairment, as described in Note 3.8.
Negative goodwill was derecognised by crediting accumulated profit on 1 January 2005.
Acquisitions on or after 1 January 2005
Goodwill represents the excess of the cost of the acquisition over the Group’s interest in the net fair value of the identifiable assets, liabilities and contingent liabilities of the acquiree.
Goodwill arising on the acquisition of subsidiaries is presented in intangible assets. Goodwill arising on the acquisition of associates and jointly controlled entities is presented together with investments in associates and jointly controlled entities.
Goodwill is measured at cost less accumulated impairment losses. Goodwill is tested for impairment as described in Note 3.8. Negative goodwill is recognised immediately in profit or loss.
Acquisitions of minority interests
Goodwill arising on the acquisition of a minority interest in a subsidiary represents the excess of the cost of the additional investment over the carrying amount of the net assets acquired at the date of exchange.
NOTES TO THE FINANCIAL STATEMENTS

KS Energy Services Limited Annual Report 200954
3 Significant accounting policies (cont’d)
3.4 Intangible assets (cont’d)
Other intangible assets
Other intangible assets that are acquired by the Group, which have finite useful lives, are measured at cost less accumulated amortisation and accumulated impairment losses. Other intangible assets are amortised in profit or loss on a straight-line basis over their estimated useful lives, from the date on which they are available for use. The estimated useful lives are as follows:
Computer software 3 yearsCustomer lists 10 yearsOther intangible assets 2 to 15 years
3.5 Financial instruments
Non-derivative financial assets
The Group initially recognises loans and receivables and deposits on the date that they are originated. All other financial assets (including assets designated at fair value through profit or loss) are recognised initially on the trade date at which the Group becomes a party to the contractual provisions of the instrument.
The Group derecognises a financial asset when the contractual rights to the cash flows from the asset expire, or it transfers the rights to receive the contractual cash flows on the financial asset in a transaction in which substantially all the risks and rewards of ownership of the financial asset are transferred. Any interest in transferred financial assets that is created or retained by the Group is recognised as a separate asset or liability.
Financial assets and liabilities are offset and the net amount presented in the balance sheet when, and only when, the Group has a legal right to offset the amounts and intends either to settle on a net basis or to realise the asset and settle the liability simultaneously.
The Group has the following non-derivative financial assets: loans and receivables and available-for-sale financial assets.
Loans and receivables
Loans and receivables are financial assets with fixed or determinable payments that are not quoted in an active market. Such assets are recognised initially at fair value plus any directly attributable transaction costs. Subsequent to initial recognition, loans and receivables are measured at amortised cost using the effective interest rate method, less any impairment losses.
Loans and receivables comprise trade and other receivables, excluding advances to suppliers, prepayments and deferred mobilisation costs.
Inter-company loans
Loans to subsidiaries
In the Company’s financial statements, low-interest and interest-free inter-company loans to subsidiaries are recognised initially at fair value. The difference between the fair value and the loan amount at inception is recognised as additional investments in subsidiaries in the Company’s financial statements. Subsequent to initial recognition, these loans are measured at amortised cost less accumulated impairment losses. The unwinding of the difference is recognised as interest income in the Company’s income statement over the expected repayment period of the loans using the effective interest rate method.
NOTES TO THE FINANCIAL STATEMENTS
KS Energy Services Limited Annual Report 2009 55
3 Significant accounting policies (cont’d)
3.5 Financial instruments (cont’d)
Loans from subsidiaries
In the Company’s financial statements, low-interest and interest-free inter-company loans from subsidiaries are recognised initially at fair value. The difference between the fair value and the loan amount at inception is recognised as distributions from subsidiaries in the Company’s financial statements. Subsequent to initial recognition, these loans are measured at amortised cost. The unwinding of the difference is recognised as interest expense in the Company’s income statement over the expected repayment period of the loans using the effective interest rate method.
Cash and cash equivalents comprise cash balances and bank deposits.
Available-for-sale financial assets
The Group’s investments in certain equity securities are classified as available-for-sale financial assets if they are designated as available-for-sale and are not classified in any of the previous categories. Subsequent to initial recognition, they are measured at fair value and changes therein, other than impairment losses (see Note 3.8), are recognised in other comprehensive income and presented within equity in the fair value reserve. When an investment is derecognised, the cumulative gain or loss in other comprehensive income is transferred to profit or loss. Any fair value changes relating to equity securities which are considered significant or prolonged are accounted for as impairment losses in profit or loss.
Non-derivative financial liabilities
The Group initially recognises debt securities issued and subordinated liabilities on the date that they are originated. All other financial liabilities (including liabilities designated at fair value through profit or loss) are recognised initially on the trade date at which the Group becomes a party to the contractual provisions of the instrument.
The Group derecognises a financial liability when its contractual obligations are discharged or cancelled or expire.
Financial assets and liabilities are offset and the net amount presented in the balance sheet when, and only when, the Group has a legal right to offset the amounts and intends either to settle on a net basis or to realise the asset and settle the liability simultaneously.
The Group has the following non-derivative financial liabilities: loans and borrowings, trade and other payables, excluding deferred income.
Such financial liabilities are recognised initially at fair value plus any directly attributable transaction costs. Subsequent to initial recognition, these financial liabilities are measured at amortised cost using the effective interest rate method.
Derivative financial instruments, including hedge accounting
The Group holds derivative financial instruments to hedge its foreign currency and interest rate risk exposures. Embedded derivatives are separated from the host contract and accounted for separately if the economic characteristics and risks of the host contract and the embedded derivative are not closely related, a separate instrument with the same terms as the embedded derivative would meet the definition of a derivative, and the combined instrument is not measured at fair value through profit or loss.
On initial designation of the hedge, the Group formally documents the relationship between the hedging instrument(s) and hedged item(s), including the risk management objectives and strategy in undertaking the hedge transaction, together with the methods that will be used to assess the effectiveness of the hedging relationship. The Group makes an assessment, both at the inception of the hedge relationship as well as on an ongoing basis, whether the hedging instruments are expected to be “highly effective” in offsetting the changes in the fair value or cash flows of the respective hedged items during the period for which the hedge is designated, and whether the actual results of each hedge are within a range of 80%-125%. For a cash flow hedge of a forecast transaction, the transaction should be highly probable to occur and should present an exposure to variations in cash flows that could ultimately affect reported net income.
NOTES TO THE FINANCIAL STATEMENTS

KS Energy Services Limited Annual Report 200956
3 Significant accounting policies (cont’d)
3.5 Financial instruments (cont’d)
Derivative financial instruments, including hedge accounting (cont’d)
Derivatives are recognised initially at fair value, and attributable transaction costs are recognised in profit or loss as incurred. Subsequent to initial recognition, derivatives are measured at fair value, and changes therein are accounted for as described below.
Cash flow hedges
When a derivative is designated as the hedging instrument in a hedge of the variability in cash flows attributable to a particular risk associated with a recognised asset or liability or a highly probable forecast transaction that could affect profit or loss, the effective portion of changes in the fair value of the derivative is recognised in other comprehensive income and presented in the hedging reserve in equity. The amount recognised in other comprehensive income is removed and included in profit or loss in the same period as the hedged cash flows affect profit or loss under the same line item in the income statement as the hedged item. Any ineffective portion of changes in the fair value of the derivative is recognised immediately in profit or loss.
If the hedging instrument no longer meets the criteria for hedge accounting, expires or is sold, terminated, exercised, or the designation is revoked, then hedge accounting is discontinued prospectively. The cumulative gain or loss previously recognised in other comprehensive income and presented in the hedging reserve in equity remains there until the forecast transaction affects profit or loss. When the hedged item is a non-financial asset, the amount recognised in other comprehensive income is transferred to the carrying amount of the asset when the asset is recognised. If the forecast transaction is no longer expected to occur, then the balance in other comprehensive income is recognised immediately in profit or loss. In other cases, the amount recognised in other comprehensive income is transferred to profit or loss in the same period that the hedged item affects profit or loss.
Economic hedges
Hedge accounting is not applied to derivative instruments that economically hedge monetary assets and liabilities denominated in foreign currencies. Changes in the fair value of such derivatives are recognised in profit or loss as part of foreign currency gains and losses.
Separable embedded derivatives
Changes in the fair value of separable embedded derivatives are recognised immediately in profit or loss.
Other non-trading derivatives
When a derivative financial instrument is not held for trading, and is not designated in a qualifying hedge relationship, all changes in its fair value are recognised immediately in profit or loss.
Intra-group financial guarantees
Financial guarantees are financial instruments issued by the Group that requires the issuer to make specified payments to reimburse the holder for the loss it incurs because a specified debtor fails to meet payment when due in accordance with the original or modified terms of a debt instrument.
Intra-group financial guarantees are accounted for in the Company’s financial statements as insurance contracts. A provision is recognised based on the Company’s estimate of the ultimate cost of settling all claims incurred but unpaid at the balance sheet date. The provision is assessed by reviewing individual claims and tested for adequacy by comparing the amount recognised and the amount that would be required to settle the guarantee contract.
NOTES TO THE FINANCIAL STATEMENTS

KS Energy Services Limited Annual Report 2009 57
3 Significant accounting policies (cont’d)
3.5 Financial instruments (cont’d)
Third party financial guarantees
Third party financial guarantees are recognised initially at fair value and are classified as financial liabilities. Subsequent to initial measurement, the financial guarantees are stated at the higher of the initial fair value less cumulative amortisation and the amount that would be recognised if they were accounted for as contingent liabilities. When financial guarantees are terminated before their original expiry date, the carrying amount of the financial guarantees is transferred to profit or loss.
3.6 Club memberships
Club memberships are stated at cost less accumulated impairment losses.
3.7 Inventories
Inventories held for trading
Inventories are stated at the lower of cost and net realisable value. The cost of inventories is calculated using the weighted average cost formula and comprises all costs of purchase, costs of conversion and other costs incurred in bringing the inventories to their present location and condition. In the case of manufactured inventories and work-in-progress, cost includes an appropriate share of production overheads based on normal operating capacity. Net realisable value is the estimated selling price in the ordinary course of business, less the estimated costs of completion and selling expenses. A write-down on cost is made when the cost is not recoverable or if the selling prices have declined below cost.
Contract work-in-progress
Contract work-in-progress represents the gross unbilled amount expected to be collected from customers for contract work performed to date. It is measured at cost plus profit recognised to date less recognised losses, allowance for foreseeable losses and net of progress billings, and are presented as part of inventories as “Contract work-in-progress” (as an asset) or as part of trade and other payables as “Progress claims in excess of contract work-in-progress” (as a liability) in the balance sheet as applicable. Contract cost includes all expenditure related directly to specific projects and an allocation of fixed and variable overheads incurred in the Group’s contract activities based on normal operating capacity. Allowance is made where applicable for any foreseeable losses on uncompleted contracts as soon as the possibility of the loss is ascertained.
Progress claims not yet paid by the customers are included in the balance sheet under “Trade receivables”. Amounts received before the related work is performed are included in the balance sheet, as a liability, as “Trade payables”.
3.8 Impairment
Financial assets (including receivables)
A financial asset not carried at fair value through profit or loss is assessed at each balance sheet date to determine whether there is objective evidence that it is impaired. A financial asset is impaired if objective evidence indicates that a loss event has occurred after the initial recognition of the asset, and that the loss event had a negative effect on the estimated future cash flows of that asset that can be estimated reliably.
Objective evidence that financial assets (including equity securities) are impaired can include default or delinquency by a debtor, restructuring of an amount due to the Group on terms that the Group would not consider otherwise, indications that a debtor or issuer will enter bankruptcy, the disappearance of an active market for a security. In addition, for an investment in an equity security, a significant or prolonged decline in its fair value below its cost is objective evidence of impairment.
NOTES TO THE FINANCIAL STATEMENTS

KS Energy Services Limited Annual Report 200958
3 Significant accounting policies (cont’d)
3.8 Impairment (cont’d)
The Group considers evidence of impairment for receivables at both a specific asset and collective level. All individually significant receivables are assessed for specific impairment. All individually significant receivables found not to be specifically impaired are then collectively assessed for any impairment that has been incurred but not yet identified. Receivables that are not individually significant are collectively assessed for impairment by grouping together receivables with similar risk characteristics.
In assessing collective impairment, the Group uses historical trends of the probability of default, timing of recoveries and the amount of loss incurred, adjusted for management’s judgement as to whether current economic and credit conditions are such that the actual losses are likely to be greater or less than suggested by historical trends.
An impairment loss in respect of a financial asset measured at amortised cost is calculated as the difference between its carrying amount and the present value of the estimated future cash flows discounted at the asset’s original effective interest rate. Losses are recognised in profit or loss and reflected in an allowance account against receivables. Interest on the impaired asset continues to be recognised through the unwinding of the discount. When a subsequent event causes the amount of impairment loss to decrease, the decrease in impairment loss is reversed through profit or loss. An impairment loss is reversed if the reversal can be related objectively to an event occurring after the impairment loss was recognised. For financial assets measured at amortised cost, the reversal is recognised in profit or loss.
An impairment loss in respect of available-for-sale investment securities is calculated by reference to its current fair value. Impairment losses on available-for-sale investment securities are recognised by transferring the cumulative loss that has been recognised in other comprehensive income, and presented in the fair value reserve in equity, to profit or loss. The cumulative loss that is removed from other comprehensive income and recognised in profit or loss is the difference between the acquisition cost, net of any principal repayment and amortisation, and the current fair value, less any impairment loss previously recognised in profit or loss. Changes in impairment attributable to time value are reflected as a component of interest income.
If, in a subsequent period, the fair value of an impaired available-for-sale equity security increases and the increase can be related objectively to an event occurring after the impairment loss was recognised in profit or loss, then the impairment loss is reversed, with the amount of the reversal recognised in profit or loss. However, any subsequent recovery in the fair value of an impaired available-for-sale equity security is recognised in other comprehensive income.
Impairment losses recognised in a previous interim period in respect of available-for-sale equity securities and financial assets carried at cost are not reversed even if the impairment losses would have been reduced or avoided had the impairment assessment been made at a subsequent reporting or balance sheet date.
Non-financial assets
The carrying amounts of the Group’s non-financial assets, other than inventories and contract work-in-progress, are reviewed at each balance sheet date to determine whether there is any indication of impairment. If any such indication exists, then the asset’s recoverable amount is estimated. For goodwill, the recoverable amount is estimated at each balance sheet date, and as and when indicators of impairment are identified.
The recoverable amount of an asset or cash-generating unit is the greater of its value in use and its fair value less costs to sell. In assessing value in use, the estimated future cash flows are discounted to their present value using a pre-tax discount rate that reflects current market assessments of the time value of money and the risks specific to the asset or cash-generating unit. For the purpose of impairment testing, assets that cannot be tested individually are grouped together into the smallest group of assets that generates cash inflows from continuing use that are largely independent of the cash inflows of other assets or groups of assets (the “cash-generating unit, or CGU”). Subject to an operating segment ceiling test, for the purposes of goodwill impairment testing, CGUs to which goodwill has been allocated are aggregated so that the level at which impairment is tested reflects the lowest level at which goodwill is monitored for internal reporting purposes. Goodwill acquired in a business combination is allocated to groups of CGUs that are expected to benefit from the synergies of the combination.
NOTES TO THE FINANCIAL STATEMENTS

KS Energy Services Limited Annual Report 2009 59
3 Significant accounting policies (cont’d)
3.8 Impairment (cont’d)
The Group’s corporate assets do not generate separate cash inflows. If there is an indication that a corporate asset may be impaired, then the recoverable amount is determined for the CGU to which the corporate asset belongs.
An impairment loss is recognised if the carrying amount of an asset or its CGU exceeds its estimated recoverable amount. Impairment losses are recognised in profit or loss, unless it reverses a previous revaluation, credited to equity, in which case it is charged to other comprehensive income. Impairment losses recognised in respect of CGUs are allocated first to reduce the carrying amount of any goodwill allocated to the units, and then to reduce the carrying amounts of the other assets in the unit (group of units) on a pro rata basis.
An impairment loss in respect of goodwill is not reversed, even if it relates to an impairment loss recognised in an interim period that would have been reduced or avoided had the impairment assessment been made at a subsequent reporting or balance sheet date. In respect of other assets, impairment losses recognised in prior periods are assessed at each balance sheet date for any indications that the loss has decreased or no longer exists. An impairment loss is reversed if there has been a change in the estimates used to determine the recoverable amount. An impairment loss is reversed only to the extent that the asset’s carrying amount does not exceed the carrying amount that would have been determined, net of depreciation or amortisation, if no impairment loss had been recognised.
Goodwill that forms part of the carrying amount of an investment in an associate is not recognised separately, and therefore is not tested for impairment separately. Instead, the entire amount of the investment in an associate is tested for impairment as a single asset when there is objective evidence that the investment in an associate may be impaired.
3.9 Employee benefits
Defined contribution plans
A defined contribution plan is a post-employment benefit plan under which an entity pays fixed contributions into a separate entity and will have no legal or constructive obligation to pay further amounts. Obligations for contributions to defined contribution pension plans are recognised as an employee benefit expense in profit or loss in the periods during which services are rendered by employees.
Short-term benefits
Short-term employee benefit obligations are measured on an undiscounted basis and are expensed as the related service is provided.
A provision is recognised for the amount expected to be paid under short-term cash bonus or profit-sharing plans if the Group has a present legal or constructive obligation to pay this amount as a result of past service provided by the employee and the obligation can be estimated reliably.
Share-based payment transactions
The share-based incentive schemes allow the Group’s employees, executive directors and non-executive directors to acquire shares of the Company.
The cost of equity-settled transaction with employees for the awards granted is measured by reference to the fair value at the date on which they are granted. The fair value is determined by using a stochastic model, taking into account the performance conditions applying to the share-based incentive schemes.
The cost of equity-settled transaction is recognised, together with a corresponding increase in equity, over the period in which the performance and/or service conditions are fulfilled. The cumulative expense recognised for equity-settled transactions at each reporting date until the vesting date reflects the extent to which the vesting period has expired and the Group’s best estimate of the number of equity instruments that will ultimately vest. The income statement expense or credit for a period represents the movement in cumulative expense recognised as at the beginning and end of that period.
NOTES TO THE FINANCIAL STATEMENTS
KS Energy Services Limited Annual Report 200960
3 Significant accounting policies (cont’d)
3.9 Employee benefits (cont’d)
No expense is recognised for awards that do not ultimately vest, except for equity-settled transactions where vesting is conditional upon a market or non-vesting condition, which are treated as vesting irrespective of whether or not the market or non-vesting condition is satisfied, provided that all other performance and/or service conditions are satisfied.
Where the terms of an equity-settled transaction award are modified, the minimum expense recognised is the expense as if the terms had not been modified, if the original terms of the award are met. An additional expense is recognised for any modification that increases the total fair value of the share-based payment transaction, or is otherwise beneficial to the employees as measured at the date of modification.
Where an equity-settled award is cancelled, it is treated as if it vested on the date of cancellation, and any expense not yet recognised for the award is recognised immediately. This includes any award where non-vesting conditions within the control of either the entity or the employee are not met. However, if a new award is substituted for the cancelled award, and designated as a replacement award on the date that it is granted, the cancelled and new awards are treated as if they were a modification of the original award, as described in the previous paragraph. All cancellations of equity-settled transaction awards are treated equally.
3.10 Provisions
A provision is recognised if, as a result of a past event, the Group has a present legal or constructive obligation that can be estimated reliably, and it is probable that an outflow of economic benefits will be required to settle the obligation. Provisions are determined by discounting the expected future cash flows at a pre-tax rate that reflects current market assessments of the time value of money and the risks specific to the liability. The unwinding of the discount is recognised as finance cost.
Contingent assets arise from unplanned or other unexpected events that give rise to the possibility of an inflow of economic benefits to the entity. Contingent assets are not recognised in financial statements as this may result in the recognition of income that may never be realised. However, when the realisation of income is virtually certain, then the related asset is not a contingent asset and its recognition is appropriate.
Contingent assets are assessed continually to ensure that developments are appropriately reflected in the financial statements. If it has become virtually certain that an inflow of economic benefit will arise, the asset and the related income are recognised in the financial statements of the period in which the change occurs. If an inflow of economic benefits has become probable, the contingent asset is disclosed.
3.11 Share capital
Ordinary shares
Ordinary shares are classified as equity. Incremental costs directly attributable to the issue of ordinary shares and share options are recognised as a deduction from equity, net of any tax effects.
Repurchase of share capital (treasury shares)
When share capital recognised as equity is repurchased, the amount of the consideration paid, which includes directly attributable costs, net of any tax effects, is recognised as a deduction from equity. Repurchased shares are classified as treasury shares and are presented as a deduction from total equity. When treasury shares are sold, reissued or cancelled subsequently, the amount received is recognised as an increase in equity, and the resulting surplus or deficit on the transaction is transferred to / from retained earnings.
Compound financial instruments
Compound financial instruments issued by the Group comprise convertible notes that can be converted to share capital at the option of the holder, and the number of shares to be issued does not vary with changes in their fair value.
NOTES TO THE FINANCIAL STATEMENTS
KS Energy Services Limited Annual Report 2009 61
3 Significant accounting policies (cont’d)
3.11 Share capital (cont’d)
The liability component of a compound financial instrument is recognised initially at the fair value of a similar liability that does not have an equity conversion option. The equity component is recognised initially at the difference between the fair value of the compound financial instrument as a whole and the fair value of the liability component. Any directly attributable transaction costs are allocated to the liability and equity components in proportion to their initial carrying amounts.
Subsequent to initial recognition, the liability component of a compound financial instrument is measured at amortised cost using the effective interest rate method. The equity component of a compound financial instrument is not remeasured subsequent to initial recognition.
Interest, dividends, losses and gains relating to the financial liability are recognised in profit or loss. Distributions to the equity holders are recognised in equity, net of any tax benefit.
3.12 Revenue
Sale of goods
Revenue from the sale of goods in the course of ordinary activities is measured at the fair value of the consideration received or receivable, net of returns and allowances, trade discounts and volume rebates. Revenue is recognised when persuasive evidence exists, usually in the form of an executed sales agreement, that the significant risks and rewards of ownership have been transferred to the buyer, recovery of the consideration is probable, the associated costs and possible return of goods can be estimated reliably, there is no continuing management involvement with the goods, and the amount of revenue can be measured reliably. If it is probable that discounts will be granted and the amount can be measured reliably, then the discount is recognised as a reduction of revenue as the sales are recognised.
Transfers of risk and rewards vary depending on the individual terms of the contract of sales.
Rendering of services
Revenue from rendering of services is recognised when the related services have been rendered.
Revenue from day rate based compensation for operations of rigs are recognised based upon contracted day rates and the number of operating days during the period in which the services are rendered.
Mobilisation fees are recognised over the estimated duration of the contract. Incremental cost of mobilisation is deferred and recognised over the estimated duration of the contracts. To the extent that cost exceeds revenue to be recognised, it is expensed as incurred.
Revenue is measured at the fair value of the consideration received or receivable and represents amounts receivable for services provided in the normal course of business, net of discounts and sales related taxes.
Contract revenue
When the outcome of a construction contract can be estimated reliably, contract revenue and costs are recognised in profit or loss using the percentage of completion method, measured by the proportion of costs incurred to-date to the estimated total costs for each contract. Contract revenue includes the initial amount agreed in the contract plus any variations in contract work, claims and incentive payments to the extent that it is probable that they will result in revenue and can be measured reliably.
When the outcome of a construction contract cannot be estimated reliably, contract revenue is recognised only to the extent of contract costs incurred that are likely to be recoverable and contract costs are recognised in profit or loss as an expense in the period in which they are incurred.
NOTES TO THE FINANCIAL STATEMENTS
KS Energy Services Limited Annual Report 200962
3 Significant accounting policies (cont’d)
3.12 Revenue (cont’d)
Commission income
When the Group acts in the capacity of an agent rather than as the principal in a transaction, the revenue recognised is the net amount of commission earned by the Group.
Commission relates to the sale of products in which the Group acts as an agent in the transaction rather than as the principal. In distinguishing between an agent and a principal, management considers the following factors:
Whether the Group takes title of the goods and has responsibility in respect of the goods sold.
Whether the Group collects the revenue from the final customer and whether the credit risk is borne by the supplier of the goods.
Rental income from operating leases
Rental income receivable under operating leases is recognised in profit or loss on a straight-line basis over the term of the lease. Lease incentives granted are recognised as an integral part of the total rental income to be received. Contingent rentals are recognised as income in the period in which they are earned.
Interest income
Interest income is recognised on an accrual basis using the effective interest rate method.
Dividend income
Dividend income is recognised on the date that the Group’s right to receive payment is established, which in the case of quoted securities is the ex-dividend date.
3.13 Government grants
Jobs Credit Scheme
Cash grants received from the Government in relation to the Jobs Credit Scheme are recognised as income upon receipt and set off against staff costs in the profit or loss.
3.14 Lease payments
Payments made under operating leases are recognised in profit or loss on a straight-line basis over the term of the lease. Lease incentives received are recognised in profit or loss as an integral part of the total lease payments made. Contingent rentals are charged to profit or loss in the period in which they are incurred.
Minimum lease payments made under finance leases are apportioned between finance expense and reduction of the lease liability. The finance expense is allocated to each period during the lease term so as to produce a constant periodic rate of interest on the remaining balance of the liability. Contingent lease payments are accounted for by revising the minimum lease payments over the remaining term of the lease when the lease adjustment is confirmed.
NOTES TO THE FINANCIAL STATEMENTS
KS Energy Services Limited Annual Report 2009 63
3 Significant accounting policies (cont’d)
3.15 Finance costs
Finance costs comprise interest expense on borrowings, unwinding of the discount on provisions and losses on hedging instruments that are recognised in profit or loss. All borrowing costs are recognised in profit or loss using the effective interest rate method, except to the extent that they are capitalised as being directly attributable to the acquisition, construction or production of an asset which necessarily takes a substantial period of time to be prepared for its intended use or sale.
3.16 Income tax
Income tax expense comprises current and deferred tax. Current tax and deferred tax are recognised in profit or loss except to the extent that it relates to a business combination, or items recognised directly in equity or in other comprehensive income.
Current tax is the expected tax payable or receivable on the taxable income or loss for the year, using tax rates enacted or substantively enacted at the balance sheet date, and any adjustment to tax payable in respect of previous years.
Deferred tax is recognised in respect of temporary differences between the carrying amounts of assets and liabilities for financial reporting purposes and the amounts used for taxation purposes. Deferred tax is not recognised for the following temporary differences: the initial recognition of goodwill, the initial recognition of assets or liabilities in a transaction that is not a business combination and that affects neither accounting nor taxable profit or loss, and differences relating to investments in subsidiaries and jointly controlled entities to the extent that it is probable that they will not reverse in the foreseeable future. Deferred tax is measured at the tax rates that are expected to be applied to the temporary differences when they reverse, based on the laws that have been enacted or substantively enacted by the balance sheet date. Deferred tax assets and liabilities are offset if there is a legally enforceable right to offset current tax liabilities and assets and they relate to income taxes levied by the same tax authority on the same taxable entity, or on different tax entities, but they intend to settle current tax liabilities and assets on a net basis or their tax assets and liabilities will be realised simultaneously.
A deferred tax asset is recognised for unused tax losses, tax credits and deductible temporary differences, to the extent that it is probable that future taxable profits will be available against which they can be utilised. Deferred tax assets are reviewed at each balance sheet date and are reduced to the extent that it is no longer probable that the related tax benefit will be realised.
3.17 Earnings per share
The Group presents basic and diluted earnings per share (EPS) data for its ordinary shares. Basic EPS is calculated by dividing the profit or loss attributable to ordinary shareholders of the Company by the weighted average number of ordinary shares outstanding during the period, adjusted for own shares held. Diluted EPS is determined by adjusting the profit or loss attributable to ordinary shareholders and the weighted average number of ordinary shares outstanding, adjusted for own shares held, for the effects of all dilutive potential ordinary shares, which comprise convertible notes, warrants and share options granted to employees.
3.18 Segment reporting
An operating segment is a component of the Group that engages in business activities from which it may earn revenues and incur expenses, including revenues and expenses that relate to transactions with any of the Group’s other components. All operating segments’ operating results are reviewed regularly by the Group’s CEO to make decisions about resources to be allocated to the segment and assess its performance, and for which discrete financial information is available.
NOTES TO THE FINANCIAL STATEMENTS

KS Energy Services Limited Annual Report 200964
4 Revenue
Group
2009 2008$’000 $’000
Contract revenue:
- Construction of ships 3,060 25,186
- Engineering works 11,266 19,361
14,326 44,547
Sale of goods 227,075 401,765
Rendering of services 225,833 136,932
Commission income 623 11,076
Rental income 21,979 16,702
489,836 611,022
Revenue from shipbuilding contracts
The Group recognises revenue arising from shipbuilding contracts by reference to the stage of completion of the contract activity at the balance sheet date, when the outcome of a construction contract can be estimated reliably. The stage of completion is measured by reference to the proportion of contract costs incurred for work performed to date as a percentage of the estimated total contract costs. Significant assumptions are required to estimate the total contract costs in determining the stage of completion. The estimates are made based on past experience and knowledge of the project managers.
Significant judgement is required in estimating reasonable amounts of variation claims to be recognised as revenue in project budgets and in determining if the Group has to make provisions for any potential liquidated damages exposure.
NOTES TO THE FINANCIAL STATEMENTS
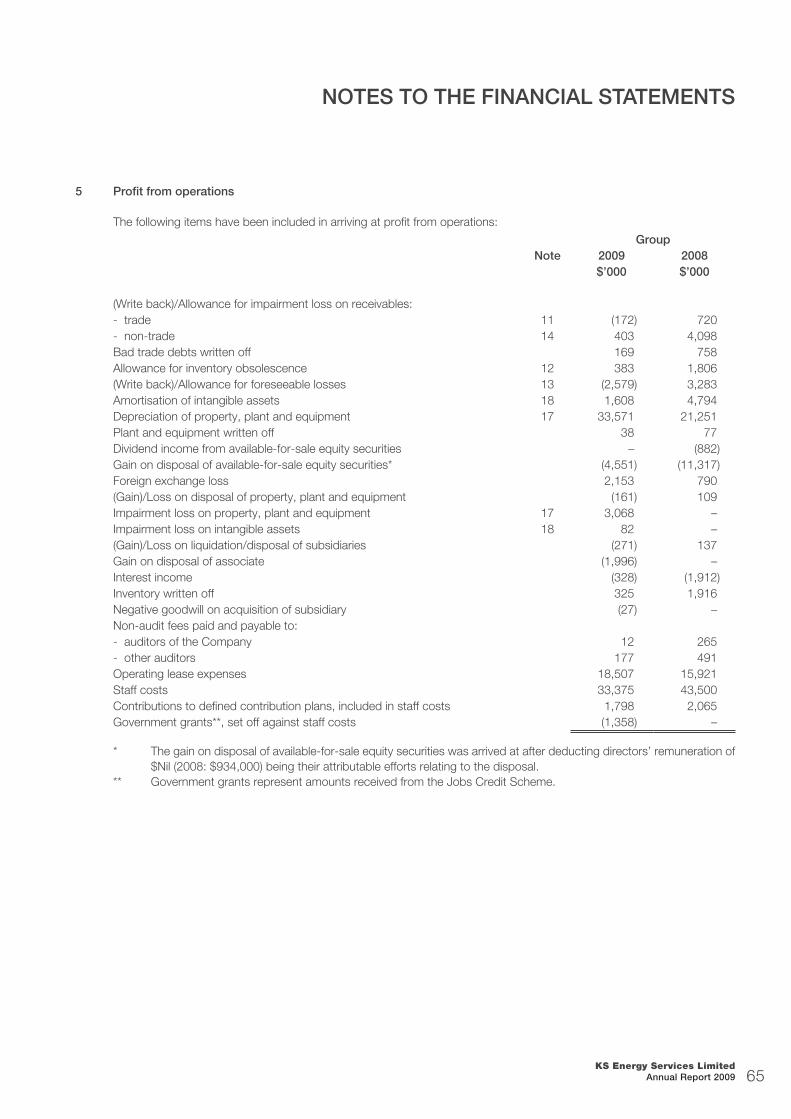
KS Energy Services Limited Annual Report 2009 65
5 Profit from operations
The following items have been included in arriving at profit from operations:Group
Note 2009 2008$’000 $’000
(Write back)/Allowance for impairment loss on receivables:- trade 11 (172) 720- non-trade 14 403 4,098Bad trade debts written off 169 758Allowance for inventory obsolescence 12 383 1,806(Write back)/Allowance for foreseeable losses 13 (2,579) 3,283Amortisation of intangible assets 18 1,608 4,794Depreciation of property, plant and equipment 17 33,571 21,251Plant and equipment written off 38 77Dividend income from available-for-sale equity securities – (882)Gain on disposal of available-for-sale equity securities* (4,551) (11,317)Foreign exchange loss 2,153 790(Gain)/Loss on disposal of property, plant and equipment (161) 109Impairment loss on property, plant and equipment 17 3,068 –Impairment loss on intangible assets 18 82 –(Gain)/Loss on liquidation/disposal of subsidiaries (271) 137Gain on disposal of associate (1,996) –Interest income (328) (1,912)Inventory written off 325 1,916Negative goodwill on acquisition of subsidiary (27) –Non-audit fees paid and payable to: - auditors of the Company 12 265- other auditors 177 491Operating lease expenses 18,507 15,921Staff costs 33,375 43,500Contributions to defined contribution plans, included in staff costs 1,798 2,065Government grants**, set off against staff costs (1,358) –
* The gain on disposal of available-for-sale equity securities was arrived at after deducting directors’ remuneration of $Nil (2008: $934,000) being their attributable efforts relating to the disposal.
** Government grants represent amounts received from the Jobs Credit Scheme.
NOTES TO THE FINANCIAL STATEMENTS

KS Energy Services Limited Annual Report 200966
6 Finance income and finance costs
Group2009 2008$’000 $’000
Recognised in profit or lossFinance income: Ineffective portion of changes in fair value of cash flow hedge (75) –
Interest expense on:- Bank overdrafts – 5- Finance lease liabilities 71 51- Bills payable to banks 441 873- Bank loans 9,137 15,787
9,649 16,716Amortisation of discount on convertible notes 6,044 5,711Amortisation of transaction costs incurred in connection with the issue of convertible notes
213 213
Amortisation of transaction costs incurred in connection with bank loans 1,138 2,909Ineffective portion of changes in fair value of cash flow hedge – 251
17,044 25,800
Net finance costs 16,969 25,800
7 Income tax expense
GroupNote 2009 2008
$’000 $’000Current tax expenseCurrent year 4,290 8,885Adjustment of tax provision in respect of prior periods (2,622) (6,077)Foreign tax suffered 6,030 3,088
7,698 5,896
Deferred tax expenseOrigination and reversal of temporary differences 1,754 (687)Adjustment of tax provision in respect of prior periods (283) –
23 1,471 (687)
Total income tax expense 9,169 5,209
NOTES TO THE FINANCIAL STATEMENTS
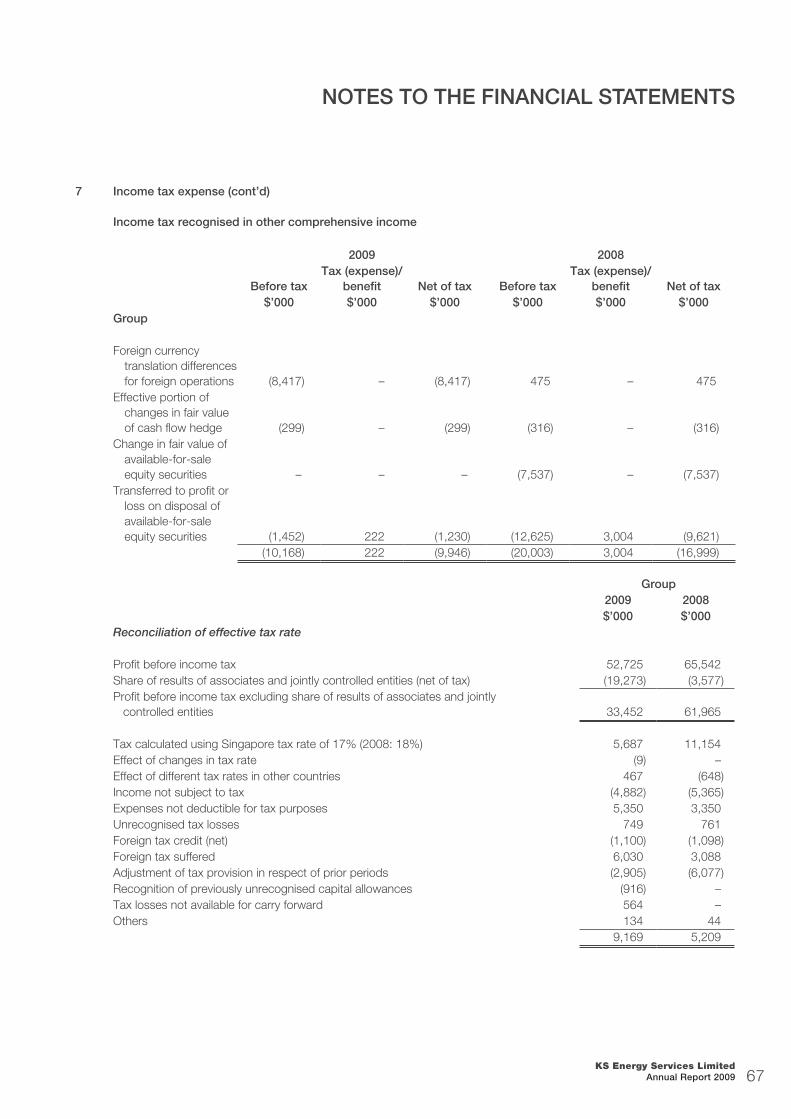
KS Energy Services Limited Annual Report 2009 67
7 Income tax expense (cont’d)
Income tax recognised in other comprehensive income
2009 2008
Before taxTax (expense)/
benefit Net of tax Before taxTax (expense)/
benefit Net of tax$’000 $’000 $’000 $’000 $’000 $’000
Group
Foreign currency translation differences for foreign operations (8,417) – (8,417) 475 – 475
Effective portion of changes in fair value of cash flow hedge (299) – (299) (316) – (316)
Change in fair value of available-for-sale equity securities – – – (7,537) – (7,537)
Transferred to profit or loss on disposal of available-for-sale equity securities (1,452) 222 (1,230) (12,625) 3,004 (9,621)
(10,168) 222 (9,946) (20,003) 3,004 (16,999)
Group2009 2008$’000 $’000
Reconciliation of effective tax rate
Profit before income tax 52,725 65,542Share of results of associates and jointly controlled entities (net of tax) (19,273) (3,577)Profit before income tax excluding share of results of associates and jointly controlled entities 33,452 61,965
Tax calculated using Singapore tax rate of 17% (2008: 18%) 5,687 11,154Effect of changes in tax rate (9) –Effect of different tax rates in other countries 467 (648)Income not subject to tax (4,882) (5,365)Expenses not deductible for tax purposes 5,350 3,350Unrecognised tax losses 749 761Foreign tax credit (net) (1,100) (1,098)Foreign tax suffered 6,030 3,088Adjustment of tax provision in respect of prior periods (2,905) (6,077)Recognition of previously unrecognised capital allowances (916) –Tax losses not available for carry forward 564 –Others 134 44
9,169 5,209
NOTES TO THE FINANCIAL STATEMENTS
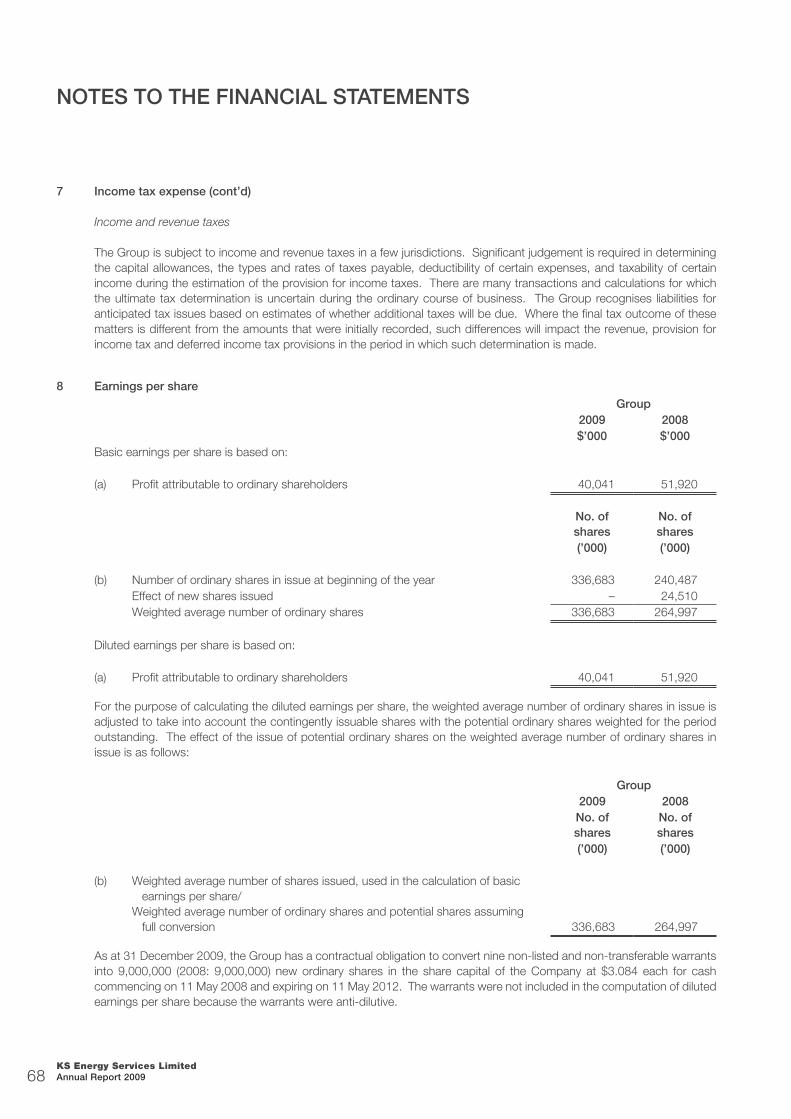
KS Energy Services Limited Annual Report 200968
7 Income tax expense (cont’d)
Income and revenue taxes
The Group is subject to income and revenue taxes in a few jurisdictions. Significant judgement is required in determining the capital allowances, the types and rates of taxes payable, deductibility of certain expenses, and taxability of certain income during the estimation of the provision for income taxes. There are many transactions and calculations for which the ultimate tax determination is uncertain during the ordinary course of business. The Group recognises liabilities for anticipated tax issues based on estimates of whether additional taxes will be due. Where the final tax outcome of these matters is different from the amounts that were initially recorded, such differences will impact the revenue, provision for income tax and deferred income tax provisions in the period in which such determination is made.
8 Earnings per share
Group2009 2008$’000 $’000
Basic earnings per share is based on:
(a) Profit attributable to ordinary shareholders 40,041 51,920
No. of shares
No. of shares
(’000) (’000)
(b) Number of ordinary shares in issue at beginning of the year 336,683 240,487Effect of new shares issued – 24,510Weighted average number of ordinary shares 336,683 264,997
Diluted earnings per share is based on:
(a) Profit attributable to ordinary shareholders 40,041 51,920
For the purpose of calculating the diluted earnings per share, the weighted average number of ordinary shares in issue is adjusted to take into account the contingently issuable shares with the potential ordinary shares weighted for the period outstanding. The effect of the issue of potential ordinary shares on the weighted average number of ordinary shares in issue is as follows:
Group2009 2008
No. of shares
No. of shares
(’000) (’000)
(b) Weighted average number of shares issued, used in the calculation of basic earnings per share/ Weighted average number of ordinary shares and potential shares assuming full conversion 336,683 264,997
As at 31 December 2009, the Group has a contractual obligation to convert nine non-listed and non-transferable warrants into 9,000,000 (2008: 9,000,000) new ordinary shares in the share capital of the Company at $3.084 each for cash commencing on 11 May 2008 and expiring on 11 May 2012. The warrants were not included in the computation of diluted earnings per share because the warrants were anti-dilutive.
NOTES TO THE FINANCIAL STATEMENTS

KS Energy Services Limited Annual Report 2009 69
8 Earnings per share (cont’d)
An option to convert a five-year $96,795,000 zero-coupon convertible note into 23,900,000 shares, expiring on 8 August 2012, was not included in the computation of diluted earnings per share because the convertible note was anti-dilutive.
As at 31 December 2009, the Group issued 84,170,634 warrants, which entitle the holder of these warrants to subscribe for 84,170,634 new ordinary shares in the share capital of the Company, on the basis of one warrant for every four existing shares held by entitled shareholders at an exercise price of $1.40 for each new share. These warrants were not included in the computation of diluted earnings per share because they were anti-dilutive.
9 Cash and cash equivalents
Group Company2009 2008 2009 2008$’000 $’000 $’000 $’000
Cash and bank balances 45,439 36,255 5,500 3,507Fixed deposits with banks 26,734 32,047 19,188 13,742
72,173 68,302 24,688 17,249Deposits pledged (4,554) (12,227)Cash and cash equivalents in the cash flow statement 67,619 56,075
In 2008, the deposit pledged of $4,248,000 or US$2,950,000 was in respect of the performance bond provided by the Group to a charteree of a rig owned by a subsidiary, to provide assurance that the Group would fulfil its contractual obligations under the charter contract. The performance bond was issued by a bank and the Group placed the equivalent amount in a restricted account at the bank. In March 2009, the charteree accepted the substitution of the performance bond with a guarantee provided by the Company to the subsidiary and the restricted deposit was discharged during the year.
At 31 December 2009, deposits pledged represent bank balances of subsidiaries pledged as security to obtain banking facilities as disclosed in Note 22.
The weighted average effective interest rates per annum relating to cash and cash equivalents at the balance sheet date for the Group and the Company are 0.26% (2008: 1.10%) and 0.25% (2008: 2.55%) respectively. Interest rates reprice at intervals of one to three months.
The Group and the Company’s exposure to interest rate risk and foreign currency risk and sensitivity analysis for cash and cash equivalents are disclosed in Note 29.
10 Amounts due from subsidiaries
Company2009 2008$’000 $’000
Non-trade 59,851 56,975Allowance for doubtful receivables (755) (2,375)Loans and receivables 59,096 54,600
The amounts due from subsidiaries, which are mainly denominated in United States dollars, are unsecured and repayable on demand. These amounts are interest-free except for amounts totalling $45,328,000 (2008: $3,750,000) which bear interest at 4% to 6% (2008: 6%) per annum.
NOTES TO THE FINANCIAL STATEMENTS
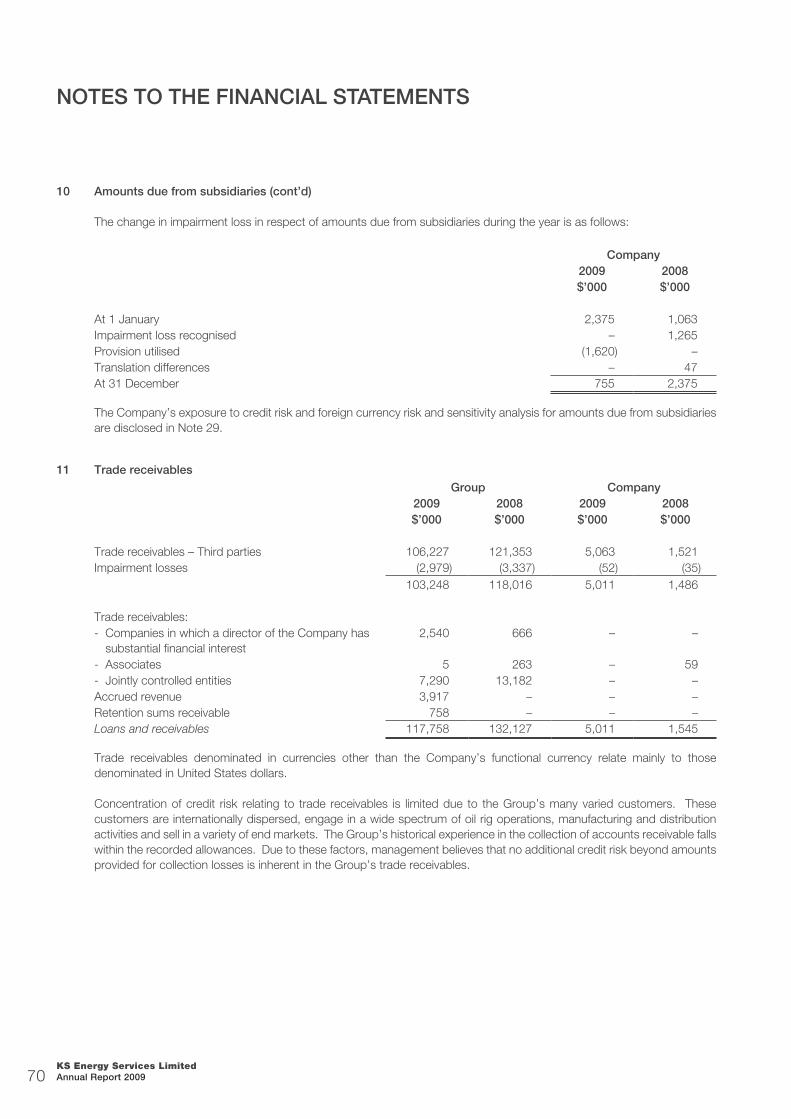
KS Energy Services Limited Annual Report 200970
10 Amounts due from subsidiaries (cont’d)
The change in impairment loss in respect of amounts due from subsidiaries during the year is as follows:
Company2009 2008$’000 $’000
At 1 January 2,375 1,063Impairment loss recognised – 1,265Provision utilised (1,620) –Translation differences – 47At 31 December 755 2,375
The Company’s exposure to credit risk and foreign currency risk and sensitivity analysis for amounts due from subsidiaries are disclosed in Note 29.
11 Trade receivables
Group Company2009 2008 2009 2008$’000 $’000 $’000 $’000
Trade receivables – Third parties 106,227 121,353 5,063 1,521Impairment losses (2,979) (3,337) (52) (35)
103,248 118,016 5,011 1,486
Trade receivables:- Companies in which a director of the Company has
substantial financial interest2,540 666 – –
- Associates 5 263 – 59- Jointly controlled entities 7,290 13,182 – –Accrued revenue 3,917 – – –Retention sums receivable 758 – – –Loans and receivables 117,758 132,127 5,011 1,545
Trade receivables denominated in currencies other than the Company’s functional currency relate mainly to those denominated in United States dollars.
Concentration of credit risk relating to trade receivables is limited due to the Group’s many varied customers. These customers are internationally dispersed, engage in a wide spectrum of oil rig operations, manufacturing and distribution activities and sell in a variety of end markets. The Group’s historical experience in the collection of accounts receivable falls within the recorded allowances. Due to these factors, management believes that no additional credit risk beyond amounts provided for collection losses is inherent in the Group’s trade receivables.
NOTES TO THE FINANCIAL STATEMENTS

KS Energy Services Limited Annual Report 2009 71
11 Trade receivables (cont’d)
The maximum exposure to credit risk for trade receivables at the balance sheet date (by type of customer) is:
Group Company2009 2008 2009 2008$’000 $’000 $’000 $’000
Distribution business customers 57,837 81,331 – –Capital equipment business customers 59,921 50,796 5,011 1,545
117,758 132,127 5,011 1,545
The Group’s top three most significant customers account for $28,922,000 (2008: $27,308,000) of the trade receivables carrying amount at 31 December 2009.
Impairment losses
The ageing of trade receivables at the balance sheet date is:
2009 2008
GrossImpairment
loss GrossImpairment
loss$’000 $’000 $’000 $’000
GroupNot past due 50,616 – 59,932 –Past due 0 - 30 days 18,509 – 29,048 –Past due 31 - 120 days 35,090 (64) 34,480 (1,114)Past due more than 120 days 16,522 (2,915) 12,004 (2,223)
120,737 (2,979) 135,464 (3,337)
Company Not past due 20 – 27 –Past due 0 - 30 days 1 – 1,408 –Past due 31 - 120 days 4,865 – 49 –Past due more than 120 days 177 (52) 96 (35)
5,063 (52) 1,580 (35)
The change in impairment loss in respect of trade receivables during the year is as follows:
Group Company2009 2008 2009 2008$’000 $’000 $’000 $’000
At 1 January 3,337 2,800 35 152Impairment loss (reversed)/recognised (Note 5) (172) 720 18 (145)Provision utilised (173) (30) (1) –Disposal of subsidiaries – (167) – –Translation differences (13) 14 – 28At 31 December 2,979 3,337 52 35
NOTES TO THE FINANCIAL STATEMENTS
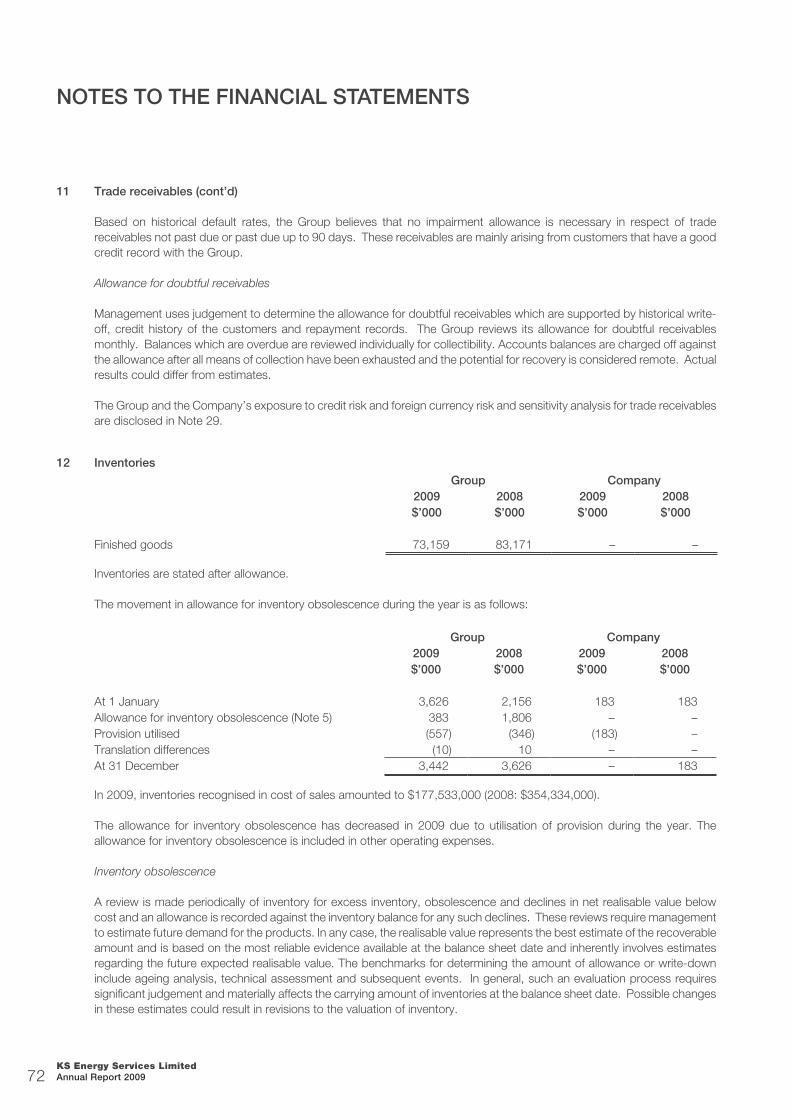
KS Energy Services Limited Annual Report 200972
11 Trade receivables (cont’d)
Based on historical default rates, the Group believes that no impairment allowance is necessary in respect of trade receivables not past due or past due up to 90 days. These receivables are mainly arising from customers that have a good credit record with the Group.
Allowance for doubtful receivables
Management uses judgement to determine the allowance for doubtful receivables which are supported by historical write-off, credit history of the customers and repayment records. The Group reviews its allowance for doubtful receivables monthly. Balances which are overdue are reviewed individually for collectibility. Accounts balances are charged off against the allowance after all means of collection have been exhausted and the potential for recovery is considered remote. Actual results could differ from estimates.
The Group and the Company’s exposure to credit risk and foreign currency risk and sensitivity analysis for trade receivables are disclosed in Note 29.
12 Inventories
Group Company2009 2008 2009 2008$’000 $’000 $’000 $’000
Finished goods 73,159 83,171 – –
Inventories are stated after allowance.
The movement in allowance for inventory obsolescence during the year is as follows:
Group Company2009 2008 2009 2008$’000 $’000 $’000 $’000
At 1 January 3,626 2,156 183 183Allowance for inventory obsolescence (Note 5) 383 1,806 – –Provision utilised (557) (346) (183) –Translation differences (10) 10 – –At 31 December 3,442 3,626 – 183
In 2009, inventories recognised in cost of sales amounted to $177,533,000 (2008: $354,334,000).
The allowance for inventory obsolescence has decreased in 2009 due to utilisation of provision during the year. The allowance for inventory obsolescence is included in other operating expenses.
Inventory obsolescence
A review is made periodically of inventory for excess inventory, obsolescence and declines in net realisable value below cost and an allowance is recorded against the inventory balance for any such declines. These reviews require management to estimate future demand for the products. In any case, the realisable value represents the best estimate of the recoverable amount and is based on the most reliable evidence available at the balance sheet date and inherently involves estimates regarding the future expected realisable value. The benchmarks for determining the amount of allowance or write-down include ageing analysis, technical assessment and subsequent events. In general, such an evaluation process requires significant judgement and materially affects the carrying amount of inventories at the balance sheet date. Possible changes in these estimates could result in revisions to the valuation of inventory.
NOTES TO THE FINANCIAL STATEMENTS
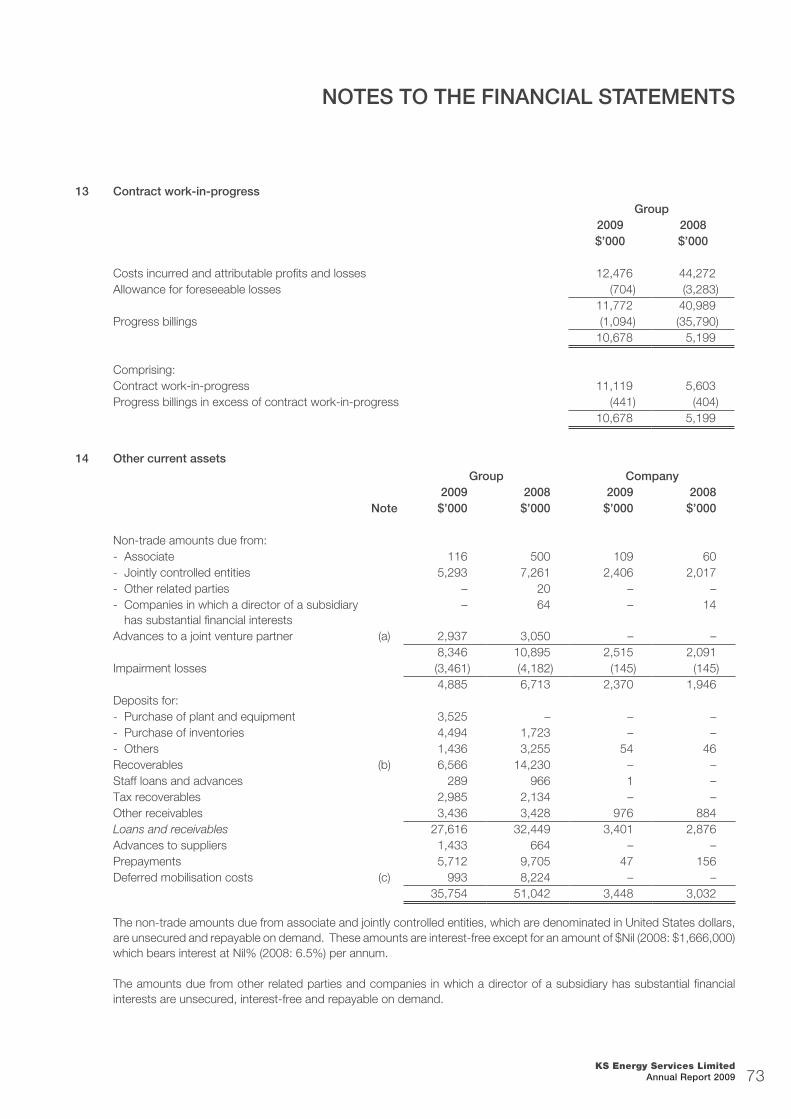
KS Energy Services Limited Annual Report 2009 73
13 Contract work-in-progress
Group2009 2008$’000 $’000
Costs incurred and attributable profits and losses 12,476 44,272Allowance for foreseeable losses (704) (3,283)
11,772 40,989Progress billings (1,094) (35,790)
10,678 5,199
Comprising:Contract work-in-progress 11,119 5,603Progress billings in excess of contract work-in-progress (441) (404)
10,678 5,199
14 Other current assets
Group Company2009 2008 2009 2008
Note $’000 $’000 $’000 $’000
Non-trade amounts due from:- Associate 116 500 109 60- Jointly controlled entities 5,293 7,261 2,406 2,017- Other related parties – 20 – –- Companies in which a director of a subsidiary
has substantial financial interests– 64 – 14
Advances to a joint venture partner (a) 2,937 3,050 – –8,346 10,895 2,515 2,091
Impairment losses (3,461) (4,182) (145) (145)4,885 6,713 2,370 1,946
Deposits for: - Purchase of plant and equipment 3,525 – – –- Purchase of inventories 4,494 1,723 – –- Others 1,436 3,255 54 46Recoverables (b) 6,566 14,230 – –Staff loans and advances 289 966 1 –Tax recoverables 2,985 2,134 – –Other receivables 3,436 3,428 976 884Loans and receivables 27,616 32,449 3,401 2,876Advances to suppliers 1,433 664 – –Prepayments 5,712 9,705 47 156Deferred mobilisation costs (c) 993 8,224 – –
35,754 51,042 3,448 3,032
The non-trade amounts due from associate and jointly controlled entities, which are denominated in United States dollars, are unsecured and repayable on demand. These amounts are interest-free except for an amount of $Nil (2008: $1,666,000) which bears interest at Nil% (2008: 6.5%) per annum.
The amounts due from other related parties and companies in which a director of a subsidiary has substantial financial interests are unsecured, interest-free and repayable on demand.
NOTES TO THE FINANCIAL STATEMENTS
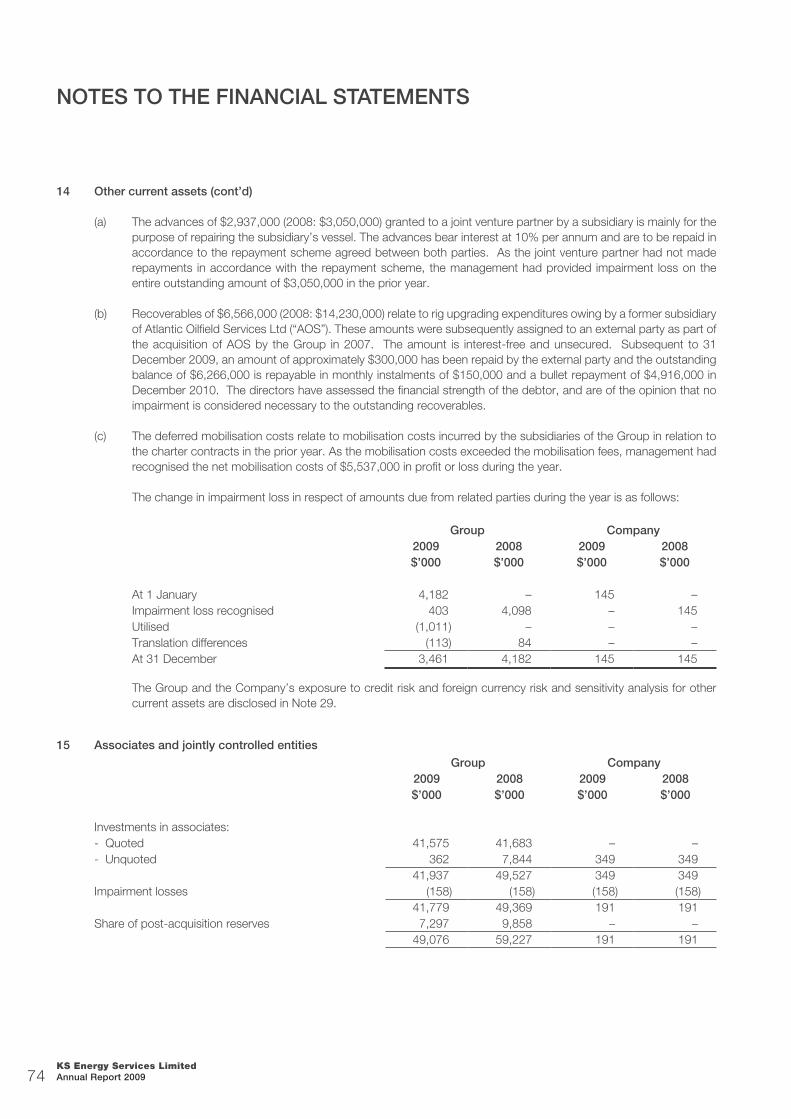
KS Energy Services Limited Annual Report 200974
14 Other current assets (cont’d)
(a) The advances of $2,937,000 (2008: $3,050,000) granted to a joint venture partner by a subsidiary is mainly for the purpose of repairing the subsidiary’s vessel. The advances bear interest at 10% per annum and are to be repaid in accordance to the repayment scheme agreed between both parties. As the joint venture partner had not made repayments in accordance with the repayment scheme, the management had provided impairment loss on the entire outstanding amount of $3,050,000 in the prior year.
(b) Recoverables of $6,566,000 (2008: $14,230,000) relate to rig upgrading expenditures owing by a former subsidiary of Atlantic Oilfield Services Ltd (“AOS”). These amounts were subsequently assigned to an external party as part of the acquisition of AOS by the Group in 2007. The amount is interest-free and unsecured. Subsequent to 31 December 2009, an amount of approximately $300,000 has been repaid by the external party and the outstanding balance of $6,266,000 is repayable in monthly instalments of $150,000 and a bullet repayment of $4,916,000 in December 2010. The directors have assessed the financial strength of the debtor, and are of the opinion that no impairment is considered necessary to the outstanding recoverables.
(c) The deferred mobilisation costs relate to mobilisation costs incurred by the subsidiaries of the Group in relation to the charter contracts in the prior year. As the mobilisation costs exceeded the mobilisation fees, management had recognised the net mobilisation costs of $5,537,000 in profit or loss during the year.
The change in impairment loss in respect of amounts due from related parties during the year is as follows:
Group Company2009 2008 2009 2008$’000 $’000 $’000 $’000
At 1 January 4,182 – 145 –Impairment loss recognised 403 4,098 – 145Utilised (1,011) – – –Translation differences (113) 84 – –At 31 December 3,461 4,182 145 145
The Group and the Company’s exposure to credit risk and foreign currency risk and sensitivity analysis for other current assets are disclosed in Note 29.
15 Associates and jointly controlled entities
Group Company2009 2008 2009 2008$’000 $’000 $’000 $’000
Investments in associates:- Quoted 41,575 41,683 – –- Unquoted 362 7,844 349 349
41,937 49,527 349 349Impairment losses (158) (158) (158) (158)
41,779 49,369 191 191Share of post-acquisition reserves 7,297 9,858 – –
49,076 59,227 191 191
NOTES TO THE FINANCIAL STATEMENTS

KS Energy Services Limited Annual Report 2009 75
15 Associates and jointly controlled entities (cont’d)
Group Company2009 2008 2009 2008$’000 $’000 $’000 $’000
Investments in jointly controlled entities 6,388 6,494 5,622 5,672Loans to jointly controlled entities 84,148 81,765 84,148 81,765Impairment losses – – (3,077) –
90,536 88,259 86,693 87,437Share of post-acquisition reserves (795) (7,939) – –
89,741 80,320 86,693 87,437
Total 138,817 139,547 86,884 87,628
Quoted shares in an associate, at fair value 38,125 16,775 – –
The loans to jointly controlled entities, which are mainly denominated in United States dollars, are unsecured and interest-free, and settlement is neither planned nor likely to occur in the foreseeable future. These loans form part of the Company’s net investments in the jointly controlled entities and are stated at cost less accumulated impairment losses.
In addition, loans to jointly controlled entities amounting to $27,068,000 (2008: $35,350,000) are subordinated to the term loans obtained by the respective jointly controlled entities.
Impairment
At 31 December 2009, based on management’s impairment assessment on the investments in associates and jointly controlled entities and loans to jointly controlled entities, the recoverable amount from the Company’s investment in a jointly controlled entity was determined to be lower than the carrying amount. Accordingly, the Company recognised an impairment loss on investment in the jointly controlled entity of $3,077,000 (2008: $Nil) in profit or loss under “Other operating expenses” for the financial year ended 31 December 2009.
Details of the associates and jointly controlled entities are as follows:
Name of associates / jointly controlled entities Principal activities
Country of incorporation
Ownershipinterest held by the Group
2009 2008% %
Associates
SSH Corporation Ltd Trading and dealing in industrial materials, general hardware, welding and cutting equipment and related products
Singapore 28.2 28.2
Jambi Supply Base Pte Ltd Supply of oil and gas equipment, consumables and provision of engineering services
Singapore 45 45
Landrig 5 (BVI) Ltd Ownership and charter of land rigs British Virgin Islands
– ** 40
M.E.I. Engineers Pte. Ltd. Provision of consultancy services, engineering design and procurement services
Singapore 20 20
NOTES TO THE FINANCIAL STATEMENTS
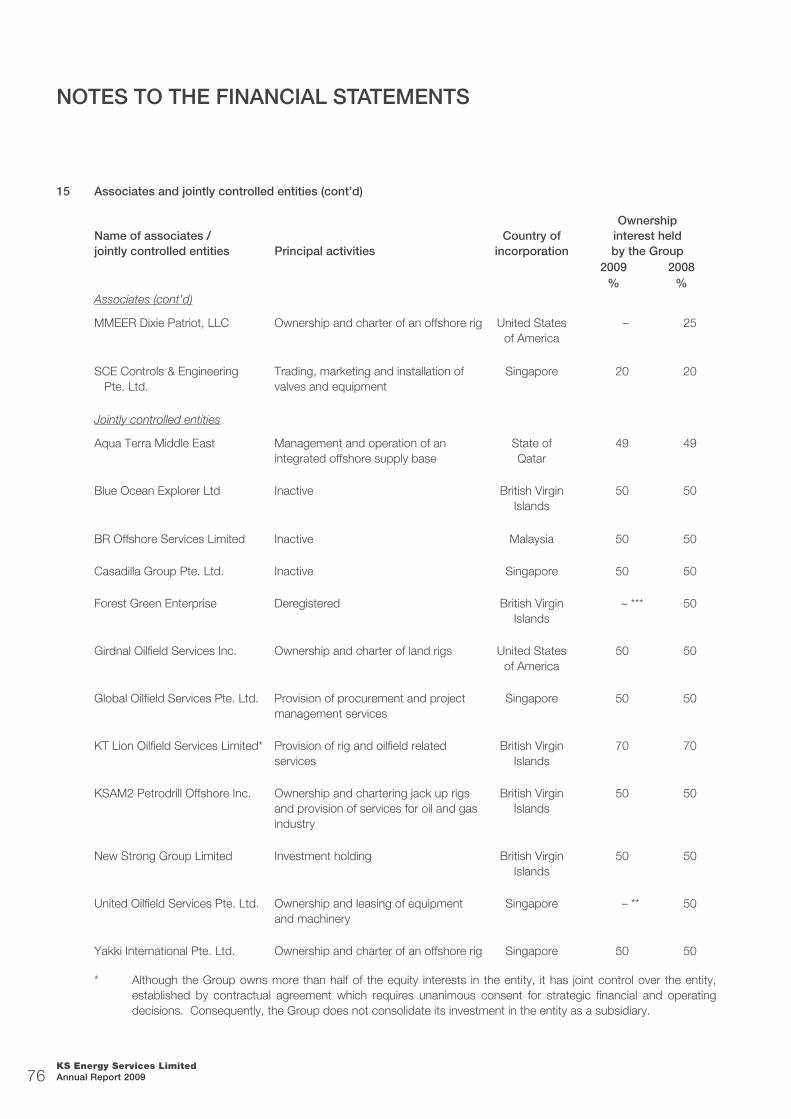
KS Energy Services Limited Annual Report 200976
15 Associates and jointly controlled entities (cont’d)
Name of associates / jointly controlled entities Principal activities
Country of incorporation
Ownershipinterest held by the Group
2009 2008% %
Associates (cont’d)
MMEER Dixie Patriot, LLC Ownership and charter of an offshore rig United Statesof America
– 25
SCE Controls & Engineering Pte. Ltd.
Trading, marketing and installation of valves and equipment
Singapore 20 20
Jointly controlled entities
Aqua Terra Middle East Management and operation of an integrated offshore supply base
State ofQatar
49 49
Blue Ocean Explorer Ltd Inactive British Virgin Islands
50 50
BR Offshore Services Limited Inactive Malaysia 50 50
Casadilla Group Pte. Ltd. Inactive Singapore 50 50
Forest Green Enterprise Deregistered British Virgin Islands
– *** 50
Girdnal Oilfield Services Inc. Ownership and charter of land rigs United States of America
50 50
Global Oilfield Services Pte. Ltd. Provision of procurement and project management services
Singapore 50 50
KT Lion Oilfield Services Limited* Provision of rig and oilfield related services
British Virgin Islands
70 70
KSAM2 Petrodrill Offshore Inc. Ownership and chartering jack up rigs and provision of services for oil and gas industry
British Virgin Islands
50 50
New Strong Group Limited Investment holding British Virgin Islands
50 50
United Oilfield Services Pte. Ltd. Ownership and leasing of equipment and machinery
Singapore – ** 50
Yakki International Pte. Ltd. Ownership and charter of an offshore rig Singapore 50 50
* Although the Group owns more than half of the equity interests in the entity, it has joint control over the entity, established by contractual agreement which requires unanimous consent for strategic financial and operating decisions. Consequently, the Group does not consolidate its investment in the entity as a subsidiary.
NOTES TO THE FINANCIAL STATEMENTS

KS Energy Services Limited Annual Report 2009 77
15 Associates and jointly controlled entities (cont’d)
** During the year, the Group acquired the remaining 50% equity interests in United Oilfield Services Pte. Ltd. and the remaining 60% equity interests in Landrig 5 (BVI) Ltd. These two entities became wholly-owned subsidiaries of the Group and are consolidated in the consolidated financial statements.
*** During the year, a jointly controlled entity, Forest Green Enterprise was deregistered. Consequently, the Group did not equity account for the jointly controlled entity as at the balance sheet date.
KPMG LLP, Singapore is the auditor of all Singapore-incorporated joint ventures. Deloitte & Touche, Singapore is the auditor of the Group’s significant associate, SSH Corporation Ltd, whose shares are listed on the Singapore Exchange Limited (“SGX”). For this purpose, an associated company is considered significant as defined under the SGX Listing Manual if the Group’s share of its net tangible assets represents 20% or more of the Group’s consolidated net tangible assets, or if the Group’s share of its pre-tax profits accounts for 20% or more of the Group’s consolidated pre-tax profits.
Associates
Summarised financial information of the associates, not adjusted for the percentage of ownership held by the Group, is as follows:
Group2009 2008$’000 $’000
Assets and liabilitiesTotal assets 181,420 294,281
Total liabilities (64,057) (142,063)
ResultsRevenue 166,789 286,520
(Loss)/Profit after tax (2,265) 29,668
Investments in associates include goodwill of $5,203,000 (2008: $5,203,000).
Jointly controlled entities
The aggregate amounts of assets and liabilities of the jointly controlled entities as at the balance sheet dates, not adjusted for the percentage of ownership held by the Group, are as follows:
Group2009 2008$’000 $’000
Assets and liabilitiesNon-current assets 96,638 154,334Current assets 160,646 158,327Total assets 257,284 312,661
Non-current liabilities (187,774) (172,023)Current liabilities (40,330) (113,550)Total liabilities (228,104) (285,573)
NOTES TO THE FINANCIAL STATEMENTS

KS Energy Services Limited Annual Report 200978
15 Associates and jointly controlled entities (cont’d)
The Group’s share of assets and liabilities of the jointly controlled entities has not been disclosed as such assets and liabilities cannot be allocated to the Group on a reasonable basis given that the Group’s profit-sharing ratios in certain jointly controlled entities are variable and are different from the proportion of ownership interest held by the Group in those jointly controlled entities.
Other summarised financial information of the jointly controlled entities, adjusted for the percentage of ownership held by the Group, is as follows:
Group2009 2008$’000 $’000
ResultsRevenue 37,216 13,882Expenses (17,838) (18,513)Profit/(Loss) after tax 19,378 (4,631)
Contingent liabilities incurred directly by the Group(1) 14,413 44,441
Group’s share of jointly controlled entities’ capital commitments 73,203 73,892
(1) The contingent liabilities incurred directly by the Group relate to the financial guarantees issued to certain banks by the Group in respect of banking facilities granted to certain jointly controlled entities. Included in these contingent liabilities are the following:
(a) In 2008, the Company issued a financial guarantee to a bank in respect of banking facilities granted to a jointly controlled entity amounting to $12,094,000 or US$8,400,000, of which the amount utilised at the balance sheet date, was $4,914,000 or US$3,413,000. In addition, a subsidiary of the Company, which leases certain equipment from the aforesaid jointly controlled entity, entered into an assignment agreement with the bank pursuant to which the following rights, title and interest of the subsidiary were assigned to the bank as security for the banking facilities granted to the jointly controlled entity:
(i) all earnings of the subsidiary arising from the sublease of a leased offshore rig and related equipment to a third party;
(ii) all rights, title and interest of the subsidiary to and in the above-mentioned sublease of the leased offshore rig and related equipment to a third party;
(iii) all sums owing to the subsidiary from any party in connection with the above-mentioned leased offshore rig and related equipment;
(iv) all monies held in the subsidiary’s escrow accounts with the bank;
(v) a fixed charge over all the rights, title and interest of the subsidiary as set out in sub-paragraphs (i) to (iv) above; and
(vi) all sums owing to the subsidiary from the jointly controlled entity shall be subordinated to the banking facilities granted to the jointly controlled entity and if the bank so requires, such sums owing to the subsidiary from the jointly controlled entity shall be collected by the subsidiary and paid to the bank.
At 31 December 2009, the Company acquired the remaining equity interests in this jointly controlled entity and it became a wholly-owned subsidiary of the Group. Please see Note 22 for details.
NOTES TO THE FINANCIAL STATEMENTS
KS Energy Services Limited Annual Report 2009 79
15 Associates and jointly controlled entities (cont’d)
(b) In 2008, the Company issued a financial guarantee to a bank in respect of banking facilities granted to a jointly controlled entity amounting to $21,597,000 or US$15,000,000, of which the amount utilised at the balance sheet date, was $16,363,000 or US$11,363,000. The Company and the joint venture shareholder shall maintain their respective 50% ownership each in the jointly controlled entity. The bank loan was fully repaid by the jointly controlled entity during the year.
(c) The Company issued financial guarantees to banks in respect of banking facilities granted to jointly controlled entities amounting to $24,068,000 (2008: $35,200,000), of which the amounts utilised at the balance sheet date were $14,413,000 (2008: $23,164,000).
Share of jointly controlled entity’s capital commitments
The Group and the Company have investment in and loans to a jointly controlled entity, KSAM2 Petrodrill Offshore Inc. (“KSAM2”) with carrying values of $56.8 million (2008: $46.3 million) and $57.1 million (2008: $46.4 million) respectively at balance sheet date. The shareholders of KSAM2 are namely, the Company (50%), Maurlis International Ltd. Inc. (“MIL”) (10%) and AK VIII Ltd (“AK”) (40%). KSAM2 is constructing a rig (“KS Endeavor”) with total estimated costs of $246.7 million and KSAM2 incurred in-progress costs of $113.9 million at balance sheet date. The remaining outstanding capital commitments amounted to $132.8 million.
Subsequent to the balance sheet date, the Company, MIL and AK entered into 2 supplemental agreements dated 9
February 2010 with respect to the shareholders agreements and construction agreements. Both the Company and MIL have agreed to bear the costs of the remaining upgrading costs of about US$15 million in the proportion of 83% and 17% respectively. In addition, KSAM2 has secured an extension to repay the remaining costs of construction owing to the contractor (a subsidiary of MIL) in 2 instalment payments, i.e. 17 February 2010 and 30 November 2010.
As at 31 December 2009, the Group’s share of KSAM2’s capital commitment amounted to $73.2 million. In February 2010, management secured a short term loan of $64.9 million to partially finance the repayment of the first instalment under the addendum agreements. The short term loan is due within six months with an option by the lender to renew the facility for a further three months. As at the date of this report, the Group’s share of the capital commitment is approximately $18.3 million. The Company and MIL are in the process of securing additional funding to complete the construction of the in-progress project at the balance sheet date. The Group and the Company did not recognise any impairment to the investment in and loans granted to the jointly controlled entity as at balance sheet date as the management of KSAM2 are confident of obtaining the necessary funding to complete the construction of the project.
Source of estimation uncertainty
The Group maintains impairment losses at a level considered adequate to provide for potential non-recoverability of the investments in associates and jointly controlled entities and the loans to jointly controlled entities. The level of allowance is evaluated by the Group on the basis of factors that affect the recoverability of the investments and loans. These factors include, but are not limited to, the activities and financial position of the entities and market factors. The Group reviews and identifies balances that are to be impaired on a continuous basis. The amount and timing of recorded expenses for any period would differ if the Group made different judgement or utilised different estimates. An increase in the Group’s impairment losses would increase the Group’s recorded other operating expenses and decrease the carrying value of the investments in associates and jointly controlled entities and/or the loans to jointly controlled entities.
NOTES TO THE FINANCIAL STATEMENTS

KS Energy Services Limited Annual Report 200980
16 Subsidiaries
Company2009 2008$’000 $’000
Quoted shares, at cost 27,787 27,787Unquoted shares, at cost 32,862 33,036
60,649 60,823Impairment losses (2,939) (758)
57,710 60,065Loans to subsidiaries 198,060 193,634
255,770 253,699
Quoted shares, at fair value 65,408 23,085
The loans to subsidiaries, which are mainly denominated in United States dollars, are unsecured and interest-free, and settlement is neither planned nor likely to occur in the foreseeable future. These loans form part of the Company’s net investment in the subsidiaries and are stated at cost less accumulated impairment losses.
In addition, loans to subsidiaries amounting to $85,023,000 (2008: $72,288,000) are subordinated to the term loans obtained by the subsidiary.
Impairment
The change in impairment losses in respect of investments in and loans to subsidiaries during the year is as follows:
Company2009 2008$’000 $’000
At 1 January 758 758Impairment losses recognised 2,181 –At 31 December 2,939 758
At 31 December 2009, based on management’s impairment assessment on the investments in and loans to subsidiaries, the recoverable amounts from the Company’s investment in two subsidiaries were determined to be lower than the carrying amount. Accordingly, the Company recognised an impairment loss on investment in the subsidiaries of $2,181,000 (2008: $Nil) in profit or loss under “Other operating expenses” for the financial year ended 31 December 2009. No further impairment to the investments and loans is considered necessary at the balance sheet date.
NOTES TO THE FINANCIAL STATEMENTS
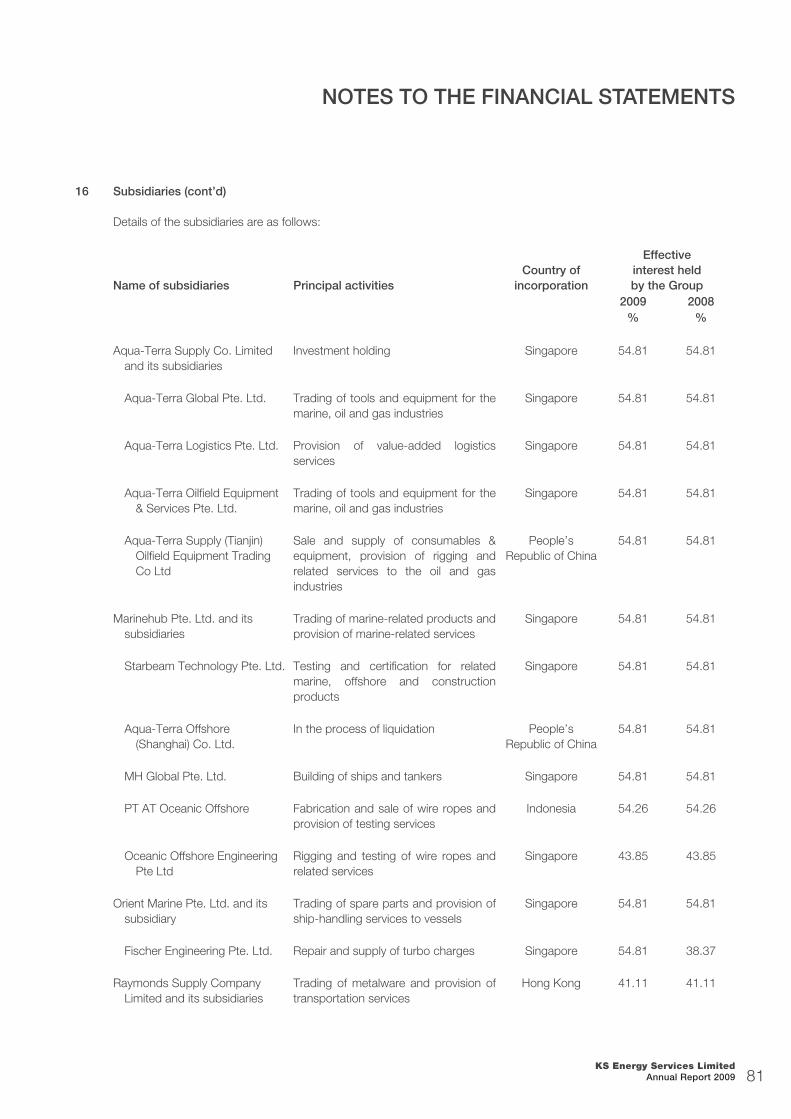
KS Energy Services Limited Annual Report 2009 81
16 Subsidiaries (cont’d)
Details of the subsidiaries are as follows:
Name of subsidiaries Principal activitiesCountry of
incorporation
Effectiveinterest held by the Group
2009 2008% %
Aqua-Terra Supply Co. Limited and its subsidiaries
Investment holding Singapore 54.81 54.81
Aqua-Terra Global Pte. Ltd. Trading of tools and equipment for the marine, oil and gas industries
Singapore 54.81 54.81
Aqua-Terra Logistics Pte. Ltd. Provision of value-added logistics services
Singapore 54.81 54.81
Aqua-Terra Oilfield Equipment & Services Pte. Ltd.
Trading of tools and equipment for the marine, oil and gas industries
Singapore 54.81 54.81
Aqua-Terra Supply (Tianjin) Oilfield Equipment Trading Co Ltd
Sale and supply of consumables & equipment, provision of rigging and related services to the oil and gas industries
People’s Republic of China
54.81 54.81
Marinehub Pte. Ltd. and its subsidiaries
Trading of marine-related products and provision of marine-related services
Singapore 54.81 54.81
Starbeam Technology Pte. Ltd. Testing and certification for related marine, offshore and construction products
Singapore 54.81 54.81
Aqua-Terra Offshore (Shanghai) Co. Ltd.
In the process of liquidation People’s Republic of China
54.81 54.81
MH Global Pte. Ltd. Building of ships and tankers Singapore 54.81 54.81
PT AT Oceanic Offshore Fabrication and sale of wire ropes and provision of testing services
Indonesia 54.26 54.26
Oceanic Offshore Engineering Pte Ltd
Rigging and testing of wire ropes and related services
Singapore 43.85 43.85
Orient Marine Pte. Ltd. and its subsidiary
Trading of spare parts and provision of ship-handling services to vessels
Singapore 54.81 54.81
Fischer Engineering Pte. Ltd. Repair and supply of turbo charges Singapore 54.81 38.37
Raymonds Supply Company Limited and its subsidiaries
Trading of metalware and provision of transportation services
Hong Kong 41.11 41.11
NOTES TO THE FINANCIAL STATEMENTS
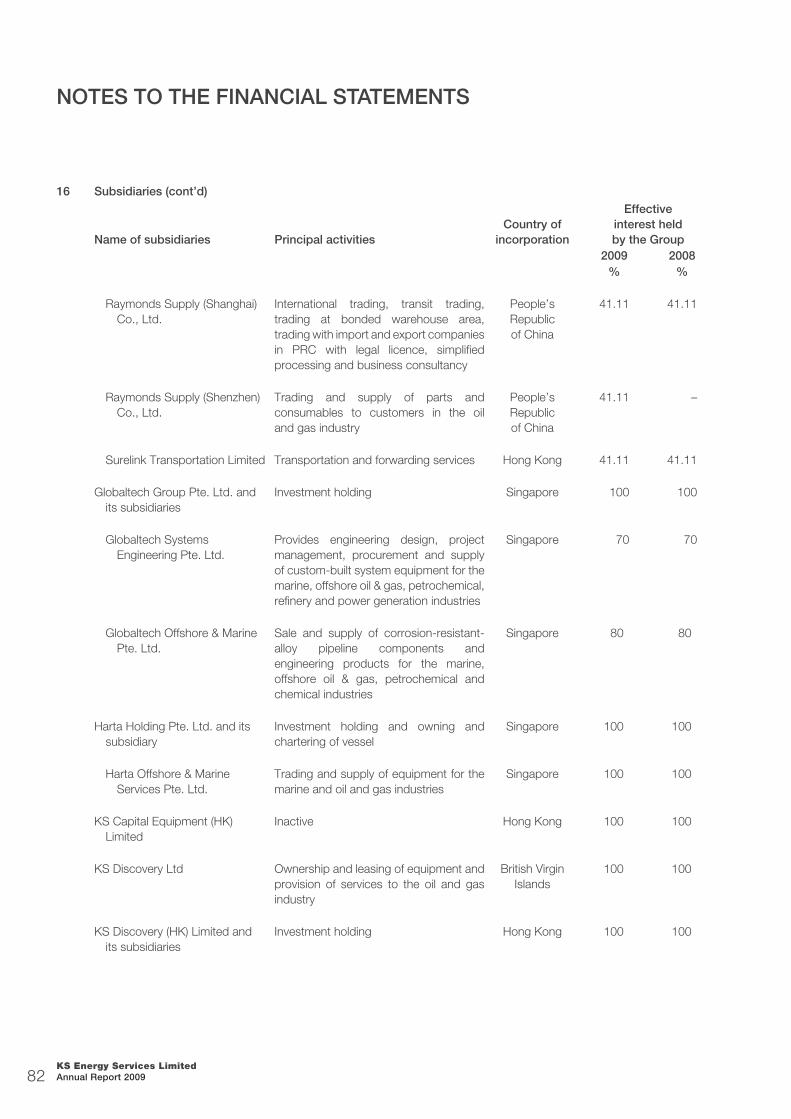
KS Energy Services Limited Annual Report 200982
16 Subsidiaries (cont’d)
Name of subsidiaries Principal activitiesCountry of
incorporation
Effectiveinterest held by the Group
2009 2008% %
Raymonds Supply (Shanghai) Co., Ltd.
International trading, transit trading, trading at bonded warehouse area, trading with import and export companies in PRC with legal licence, simplified processing and business consultancy
People’s Republic of China
41.11 41.11
Raymonds Supply (Shenzhen) Co., Ltd.
Trading and supply of parts and consumables to customers in the oil and gas industry
People’s Republic of China
41.11 –
Surelink Transportation Limited Transportation and forwarding services Hong Kong 41.11 41.11
Globaltech Group Pte. Ltd. and its subsidiaries
Investment holding Singapore 100 100
Globaltech Systems Engineering Pte. Ltd.
Provides engineering design, project management, procurement and supply of custom-built system equipment for the marine, offshore oil & gas, petrochemical, refinery and power generation industries
Singapore 70 70
Globaltech Offshore & Marine Pte. Ltd.
Sale and supply of corrosion-resistant-alloy pipeline components and engineering products for the marine, offshore oil & gas, petrochemical and chemical industries
Singapore 80 80
Harta Holding Pte. Ltd. and its subsidiary
Investment holding and owning and chartering of vessel
Singapore 100 100
Harta Offshore & Marine Services Pte. Ltd.
Trading and supply of equipment for the marine and oil and gas industries
Singapore 100 100
KS Capital Equipment (HK) Limited
Inactive Hong Kong 100 100
KS Discovery Ltd Ownership and leasing of equipment and provision of services to the oil and gas industry
British Virgin Islands
100 100
KS Discovery (HK) Limited and its subsidiaries
Investment holding Hong Kong 100 100
NOTES TO THE FINANCIAL STATEMENTS
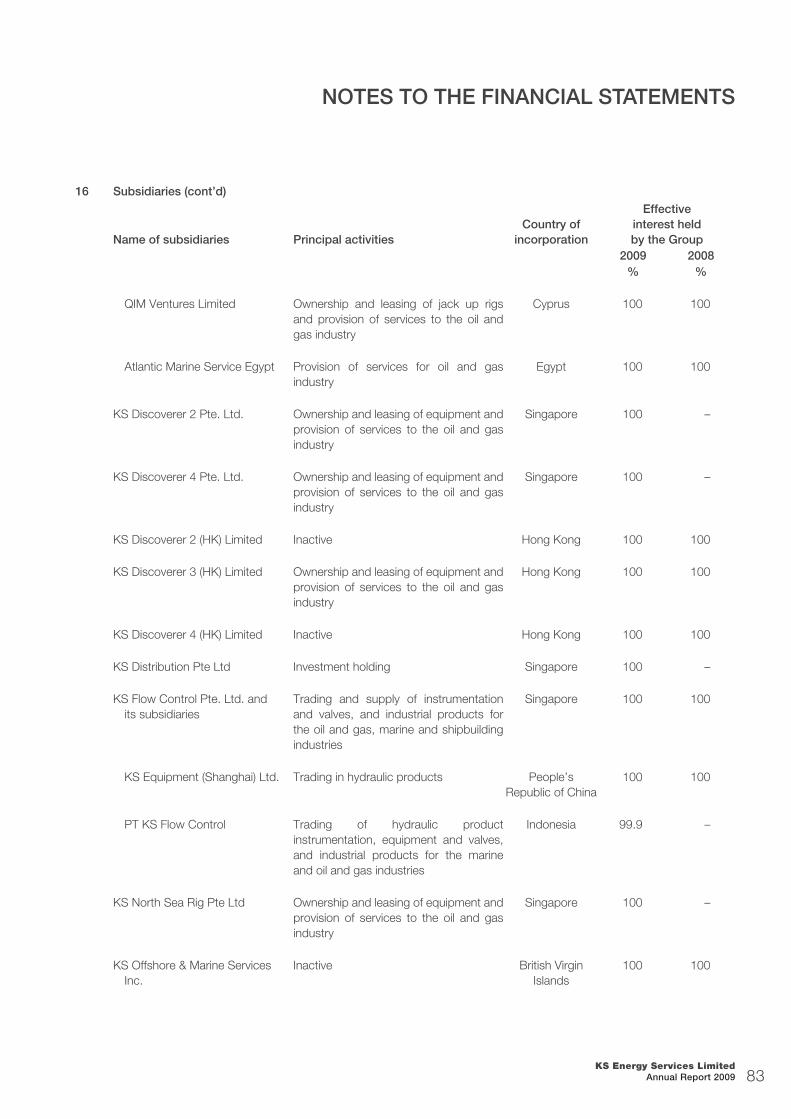
KS Energy Services Limited Annual Report 2009 83
16 Subsidiaries (cont’d)
Name of subsidiaries Principal activitiesCountry of
incorporation
Effectiveinterest held by the Group
2009 2008% %
QIM Ventures Limited Ownership and leasing of jack up rigs and provision of services to the oil and gas industry
Cyprus 100 100
Atlantic Marine Service Egypt Provision of services for oil and gas industry
Egypt 100 100
KS Discoverer 2 Pte. Ltd. Ownership and leasing of equipment and provision of services to the oil and gas industry
Singapore 100 –
KS Discoverer 4 Pte. Ltd. Ownership and leasing of equipment and provision of services to the oil and gas industry
Singapore 100 –
KS Discoverer 2 (HK) Limited Inactive Hong Kong 100 100
KS Discoverer 3 (HK) Limited Ownership and leasing of equipment and provision of services to the oil and gas industry
Hong Kong 100 100
KS Discoverer 4 (HK) Limited Inactive Hong Kong 100 100
KS Distribution Pte Ltd Investment holding Singapore 100 –
KS Flow Control Pte. Ltd. and its subsidiaries
Trading and supply of instrumentation and valves, and industrial products for the oil and gas, marine and shipbuilding industries
Singapore 100 100
KS Equipment (Shanghai) Ltd. Trading in hydraulic products People’s Republic of China
100 100
PT KS Flow Control Trading of hydraulic product instrumentation, equipment and valves, and industrial products for the marine and oil and gas industries
Indonesia 99.9 –
KS North Sea Rig Pte Ltd Ownership and leasing of equipment and provision of services to the oil and gas industry
Singapore 100 –
KS Offshore & Marine Services Inc.
Inactive British Virgin Islands
100 100
NOTES TO THE FINANCIAL STATEMENTS

KS Energy Services Limited Annual Report 200984
16 Subsidiaries (cont’d)
Name of subsidiaries Principal activitiesCountry of
incorporation
Effectiveinterest held by the Group
2009 2008% %
KS Oilfield Equipment Pte. Ltd. Inactive Singapore 100 100
KS Oilfield Services Ltd Provision of oilfield support and consultancy services
Mauritius 100 100
KS Oilfield Support Ltd In the process of liquidation Mauritius 100 100
KS Oil Rig Services Inc. Deregistered British Virgin Islands
–** 100
KS Technical Resources Pte Ltd and its subsidiary
Inactive Singapore 100 100
Specialist Resources International Pte Ltd
Inactive Singapore 100 100
KS Technical Resources (HK) Limited
Inactive Hong Kong 100 100
KS Venture Pte. Ltd. and its subsidiary
Inactive Singapore 100 100
Atlantic Esbjerg Limited In the process of liquidation Mauritius 100 100
S&E Cumford (Thailand) Ltd Inactive Thailand 100 100
S&E Tech Pte. Ltd. and its subsidiary
Inactive Singapore 100 100
S&E Cumford (M) Sdn. Bhd. In the process of liquidation Malaysia 100 100
Sphinx Frontier Ltd. and its subsidiaries
Investment holding British Virgin Islands
100 100
Atlantic Oilfield Services Ltd. and its subsidiaries
Provision of rig rental, rig management and support services to the oil and gas industry
Bermuda 100 100
Atlantic Marine Services (Cyprus) Group Ltd. and its subsidiaries
Provision of rig management and support services to the oil and gas industry
Cyprus 100 100
NOTES TO THE FINANCIAL STATEMENTS
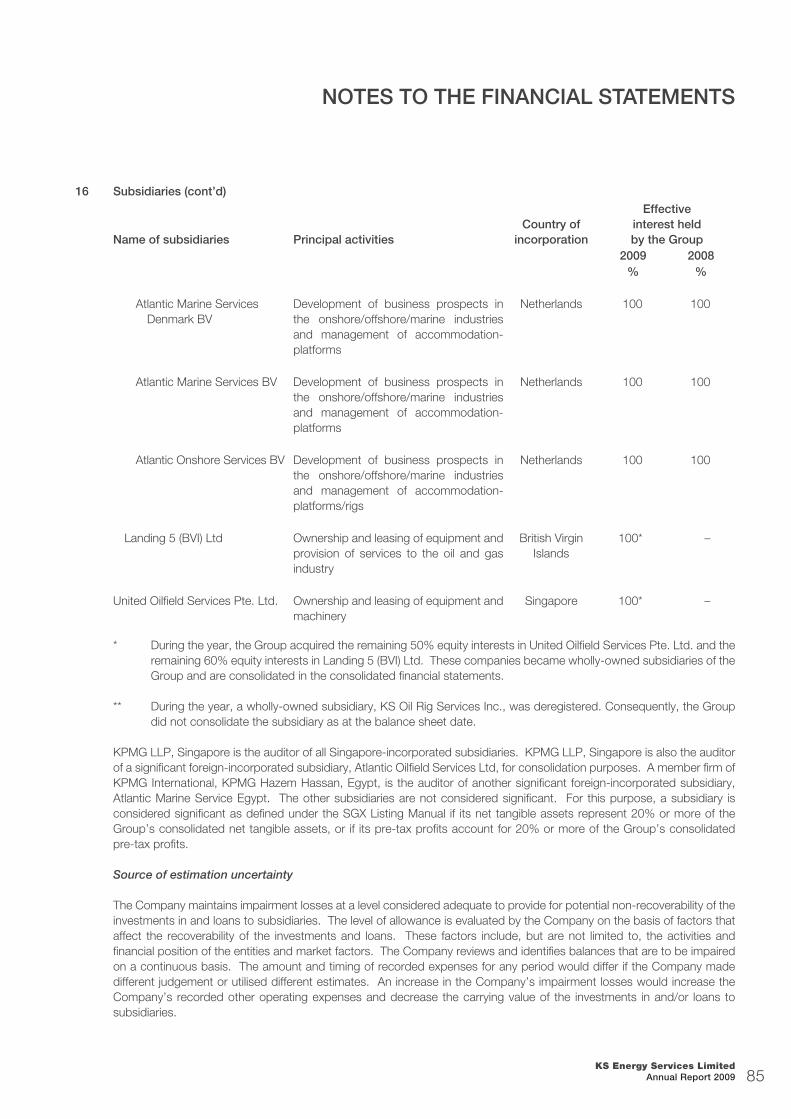
KS Energy Services Limited Annual Report 2009 85
16 Subsidiaries (cont’d)
Name of subsidiaries Principal activitiesCountry of
incorporation
Effectiveinterest held by the Group
2009 2008% %
Atlantic Marine Services Denmark BV
Development of business prospects in the onshore/offshore/marine industries and management of accommodation-platforms
Netherlands 100 100
Atlantic Marine Services BV Development of business prospects in the onshore/offshore/marine industries and management of accommodation-platforms
Netherlands 100 100
Atlantic Onshore Services BV Development of business prospects in the onshore/offshore/marine industries and management of accommodation-platforms/rigs
Netherlands 100 100
Landing 5 (BVI) Ltd Ownership and leasing of equipment and provision of services to the oil and gas industry
British Virgin Islands
100* –
United Oilfield Services Pte. Ltd. Ownership and leasing of equipment and machinery
Singapore 100* –
* During the year, the Group acquired the remaining 50% equity interests in United Oilfield Services Pte. Ltd. and the remaining 60% equity interests in Landing 5 (BVI) Ltd. These companies became wholly-owned subsidiaries of the Group and are consolidated in the consolidated financial statements.
** During the year, a wholly-owned subsidiary, KS Oil Rig Services Inc., was deregistered. Consequently, the Group did not consolidate the subsidiary as at the balance sheet date.
KPMG LLP, Singapore is the auditor of all Singapore-incorporated subsidiaries. KPMG LLP, Singapore is also the auditor of a significant foreign-incorporated subsidiary, Atlantic Oilfield Services Ltd, for consolidation purposes. A member firm of KPMG International, KPMG Hazem Hassan, Egypt, is the auditor of another significant foreign-incorporated subsidiary, Atlantic Marine Service Egypt. The other subsidiaries are not considered significant. For this purpose, a subsidiary is considered significant as defined under the SGX Listing Manual if its net tangible assets represent 20% or more of the Group’s consolidated net tangible assets, or if its pre-tax profits account for 20% or more of the Group’s consolidated pre-tax profits.
Source of estimation uncertainty
The Company maintains impairment losses at a level considered adequate to provide for potential non-recoverability of the investments in and loans to subsidiaries. The level of allowance is evaluated by the Company on the basis of factors that affect the recoverability of the investments and loans. These factors include, but are not limited to, the activities and financial position of the entities and market factors. The Company reviews and identifies balances that are to be impaired on a continuous basis. The amount and timing of recorded expenses for any period would differ if the Company made different judgement or utilised different estimates. An increase in the Company’s impairment losses would increase the Company’s recorded other operating expenses and decrease the carrying value of the investments in and/or loans to subsidiaries.
NOTES TO THE FINANCIAL STATEMENTS

KS Energy Services Limited Annual Report 200986
17 Property, plant and equipment
Leasehold properties
Plant and machinery Rigs
Renovation, furniture
and fittingsOffice
equipmentMotor
vehicles Total$’000 $’000 $’000 $’000 $’000 $’000 $’000
GroupCostAt 1 January 2008 3,617 14,439 115,200 2,584 5,400 3,408 144,648Additions 1,959 3,431 244,261 4,400 1,620 2,243 257,914Assets acquired in business
combinations (Note 27) – 324 – 26 84 194 628Reclassification from
inventories – – 51,417 – – – 51,417Write-off – (1) – (130) (322) – (453)Disposals – (531) – (150) (24) (401) (1,106)Disposals of subsidiaries – (578) – (220) (533) (954) (2,285)Translation differences – 5 3,002 (8) (1) (1) 2,997At 31 December 2008 5,576 17,089 413,880 6,502 6,224 4,489 453,760Additions – 3,564 15,519 1,880 596 257 21,816Assets acquired in business
combinations (Note 27) – 11,486 – – 10 11 11,507Reclassification to
inventories – (44) – – (51) – (95)Write-off – – (17) (145) (101) – (263)Disposals – (73) – (31) (72) (678) (854)Translation differences – (248) (8,733) (54) (231) (163) (9,429)At 31 December 2009 5,576 31,774 420,649 8,152 6,375 3,916 476,442
NOTES TO THE FINANCIAL STATEMENTS

KS Energy Services Limited Annual Report 2009 87
17 Property, plant and equipment (cont’d)
Leasehold properties
Plant and machinery Rigs
Renovation, furniture
and fittingsOffice
equipmentMotor
vehicles Total
$’000 $’000 $’000 $’000 $’000 $’000 $’000Accumulated depreciation
and impairment lossesAt 1 January 2008 1,716 3,120 4,870 1,185 3,773 1,914 16,578Depreciation charge for the
year 164 692 18,343 748 725 579 21,251Write-off – – – (67) (309) – (376)Disposals – – – (50) (19) (282) (351)Disposals of subsidiaries – (452) – (132) (36) (258) (878)Translation differences – – 325 10 4 2 341At 31 December 2008 1,880 3,360 23,538 1,694 4,138 1,955 36,565Depreciation charge for the
year 459 4,432 25,955 1,213 944 568 33,571Impairment loss – 3,068 – – – – 3,068Write-off – – (1) (127) (97) – (225)Disposals – (73) (3) (18) (71) (580) (745)Translation differences – (416) (1,154) (94) (222) (180) (2,066)At 31 December 2009 2,339 10,371 48,335 2,668 4,692 1,763 70,168
Carrying amountAt 1 January 2008 1,901 11,319 110,330 1,399 1,627 1,494 128,070
At 31 December 2008 3,696 13,729 390,342 4,808 2,086 2,534 417,195
At 31 December 2009 3,237 21,403 372,314 5,484 1,683 2,153 406,274
NOTES TO THE FINANCIAL STATEMENTS
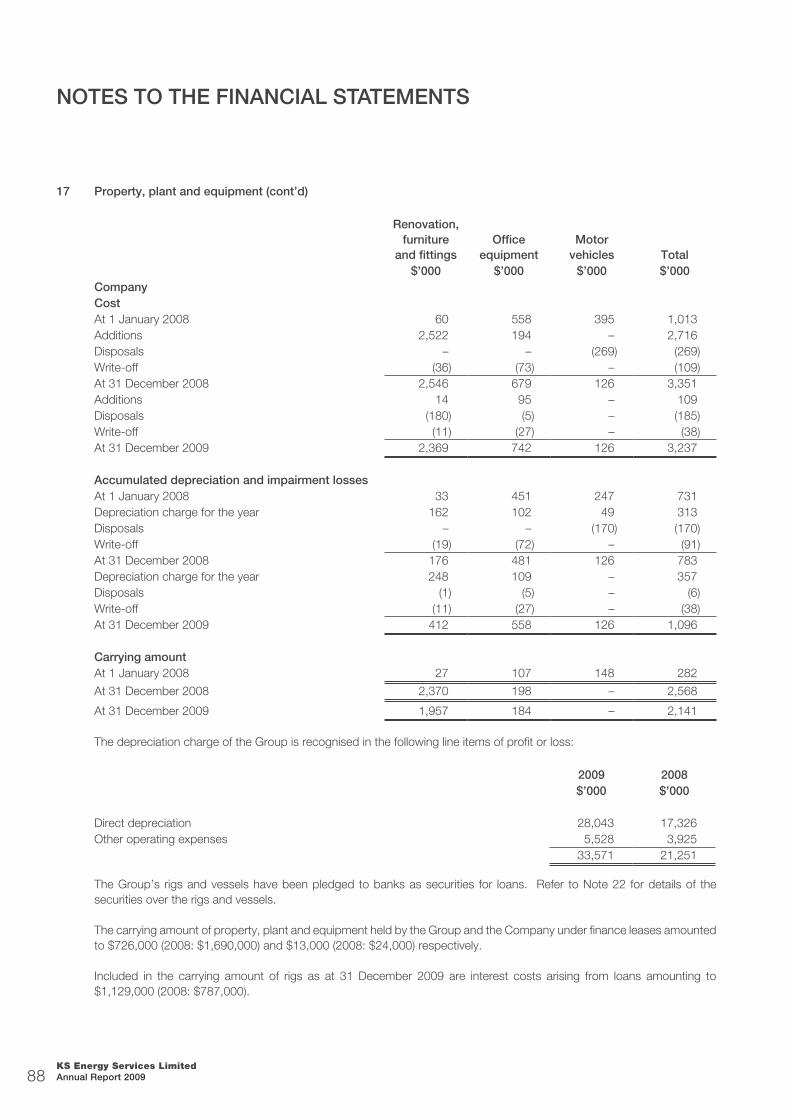
KS Energy Services Limited Annual Report 200988
17 Property, plant and equipment (cont’d)
Renovation, furniture
and fittingsOffice
equipmentMotor
vehicles Total$’000 $’000 $’000 $’000
CompanyCostAt 1 January 2008 60 558 395 1,013Additions 2,522 194 – 2,716Disposals – – (269) (269)Write-off (36) (73) – (109)At 31 December 2008 2,546 679 126 3,351Additions 14 95 – 109Disposals (180) (5) – (185)Write-off (11) (27) – (38)At 31 December 2009 2,369 742 126 3,237
Accumulated depreciation and impairment lossesAt 1 January 2008 33 451 247 731Depreciation charge for the year 162 102 49 313Disposals – – (170) (170)Write-off (19) (72) – (91)At 31 December 2008 176 481 126 783Depreciation charge for the year 248 109 – 357Disposals (1) (5) – (6)Write-off (11) (27) – (38)At 31 December 2009 412 558 126 1,096
Carrying amountAt 1 January 2008 27 107 148 282
At 31 December 2008 2,370 198 – 2,568
At 31 December 2009 1,957 184 – 2,141
The depreciation charge of the Group is recognised in the following line items of profit or loss:
2009 2008$’000 $’000
Direct depreciation 28,043 17,326Other operating expenses 5,528 3,925
33,571 21,251
The Group’s rigs and vessels have been pledged to banks as securities for loans. Refer to Note 22 for details of the securities over the rigs and vessels.
The carrying amount of property, plant and equipment held by the Group and the Company under finance leases amounted to $726,000 (2008: $1,690,000) and $13,000 (2008: $24,000) respectively.
Included in the carrying amount of rigs as at 31 December 2009 are interest costs arising from loans amounting to $1,129,000 (2008: $787,000).
NOTES TO THE FINANCIAL STATEMENTS

KS Energy Services Limited Annual Report 2009 89
17 Property, plant and equipment (cont’d)
Impairment
The rigs and plant and machinery comprise a significant portion of the Group’s assets. The carrying amounts of the Group’s rigs and plant and machinery were $372,314,000 and $21,403,000 respectively as at 31 December 2009 (2008: $390,342,000 and $13,729,000 respectively). The Group evaluates, amongst other factors, the business outlook for the rigs, plant and machinery and related equipment, including factors such as steel value, technological development, laws and regulation applicable to the assets, and changes in economic and market conditions. Indicators of possible impairment include extended periods of idle time and/or inability to contract specific assets or groups of assets, such as a specific type of drilling rig, or assets in a specific geographical region.
The management had assessed the recoverable amounts of the rigs and vessels (included in plant and machinery) based on either their values in use, using 10-year cash flow forecasts and terminal value of 15% to 20%, using a discount rate of 8% to 13%, or fair value less costs to sell, based on valuation reports by an independent professional valuer.
A vessel owned by a subsidiary of the Group had been idle during the year and management has been actively sourcing for potential buyers and charterers up to the balance sheet date. Management has assessed the recoverable amount of the vessel based on a valuation carried out by an independent professional valuer in February 2010. The recoverable amount of the vessel was determined to be lower than its carrying amount. Accordingly, an impairment loss of $3,068,000 was recognised in profit or loss under “Other operating expenses” for the financial year ended 31 December 2009 as disclosed in Note 5. In addition, management has also fully written off the non-trade amounts due from the subsidiary of $14,984,000 at the balance sheet date (Note 10).
Based on the assessments, except for the above impairment losses, the management determined that no further impairment to the rigs and plant and machinery is considered necessary at the balance sheet date.
Depreciation
Property, plant and equipment are depreciated on a straight-line basis over the estimated useful lives. The Group reviews the estimated useful lives of the assets regularly based on the factors that include asset utilisation, internal technical evaluation, technological changes, environmental and anticipated use of the assets in order to determine the amount of depreciation expense to be recorded during any reporting period. Changes in the expected level of use of the assets and the Group’s historical experience with similar assets after taking into account anticipated technological changes could impact the economic useful lives and the residual values of the assets, therefore future depreciation charges could be revised. Any changes in the economic useful lives could impact the depreciation charges and consequently affect the Group’s results.
NOTES TO THE FINANCIAL STATEMENTS

KS Energy Services Limited Annual Report 200990
18 Intangible assets
Note Goodwill Customer listsComputer software
Other intangible
assets Total$’000 $’000 $’000 $’000 $’000
GroupCostAt 1 January 2008 21,675 1,141 – 11,553 34,369Acquisition through business
combinations 27 – 266 – 936 1,202Disposal of subsidiaries 27 (50) – – – (50)Translation differences (2) – – 47 45At 31 December 2008 21,623 1,407 – 12,536 35,566Additions – 75 1,777 – 1,852Acquisition of minority interest 27 445 341 – 435 1,221Disposals – (272) – (267) (539)Translation differences (304) – – (230) (534)At 31 December 2009 21,764 1,551 1,777 12,474 37,566
Accumulated amortisationAt 1 January 2008 – 53 – 4,916 4,969Amortisation charge during the
year – 115 – 4,679 4,794Translation differences – – – 31 31At 31 December 2008 – 168 – 9,626 9,794Amortisation charge during the
year – 126 179 1,303 1,608Impairment losses – 82 – – 82Translation differences – – – (64) (64)At 31 December 2009 – 376 179 10,865 11,420
Carrying amountAt 1 January 2008 21,675 1,088 – 6,637 29,400
At 31 December 2008 21,623 1,239 – 2,910 25,772
At 31 December 2009 21,764 1,175 1,598 1,609 26,146
NOTES TO THE FINANCIAL STATEMENTS
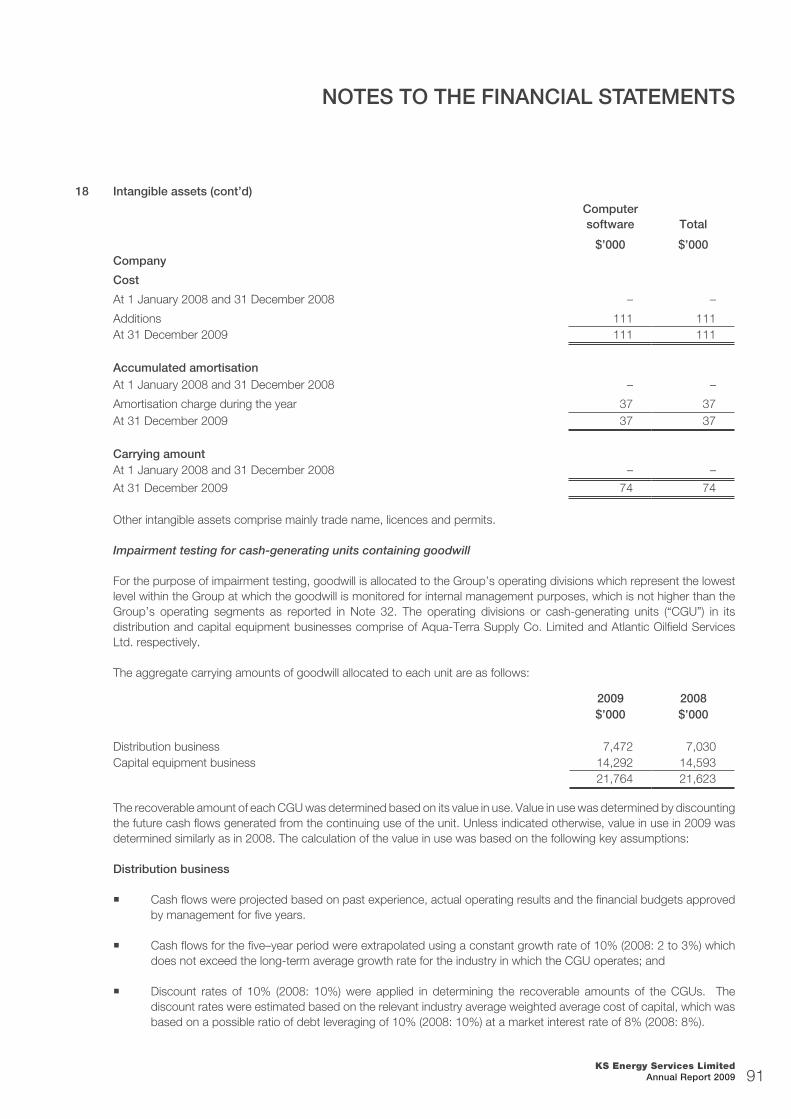
KS Energy Services Limited Annual Report 2009 91
18 Intangible assets (cont’d)
Computer software Total
$’000 $’000Company
Cost
At 1 January 2008 and 31 December 2008 – –
Additions 111 111At 31 December 2009 111 111
Accumulated amortisationAt 1 January 2008 and 31 December 2008 – –
Amortisation charge during the year 37 37At 31 December 2009 37 37
Carrying amountAt 1 January 2008 and 31 December 2008 – –
At 31 December 2009 74 74
Other intangible assets comprise mainly trade name, licences and permits.
Impairment testing for cash-generating units containing goodwill
For the purpose of impairment testing, goodwill is allocated to the Group’s operating divisions which represent the lowest level within the Group at which the goodwill is monitored for internal management purposes, which is not higher than the Group’s operating segments as reported in Note 32. The operating divisions or cash-generating units (“CGU”) in its distribution and capital equipment businesses comprise of Aqua-Terra Supply Co. Limited and Atlantic Oilfield Services Ltd. respectively.
The aggregate carrying amounts of goodwill allocated to each unit are as follows:
2009 2008$’000 $’000
Distribution business 7,472 7,030Capital equipment business 14,292 14,593
21,764 21,623
The recoverable amount of each CGU was determined based on its value in use. Value in use was determined by discounting the future cash flows generated from the continuing use of the unit. Unless indicated otherwise, value in use in 2009 was determined similarly as in 2008. The calculation of the value in use was based on the following key assumptions:
Distribution business
Cash flows were projected based on past experience, actual operating results and the financial budgets approved by management for five years.
Cash flows for the five–year period were extrapolated using a constant growth rate of 10% (2008: 2 to 3%) which does not exceed the long-term average growth rate for the industry in which the CGU operates; and
Discount rates of 10% (2008: 10%) were applied in determining the recoverable amounts of the CGUs. The discount rates were estimated based on the relevant industry average weighted average cost of capital, which was based on a possible ratio of debt leveraging of 10% (2008: 10%) at a market interest rate of 8% (2008: 8%).
NOTES TO THE FINANCIAL STATEMENTS
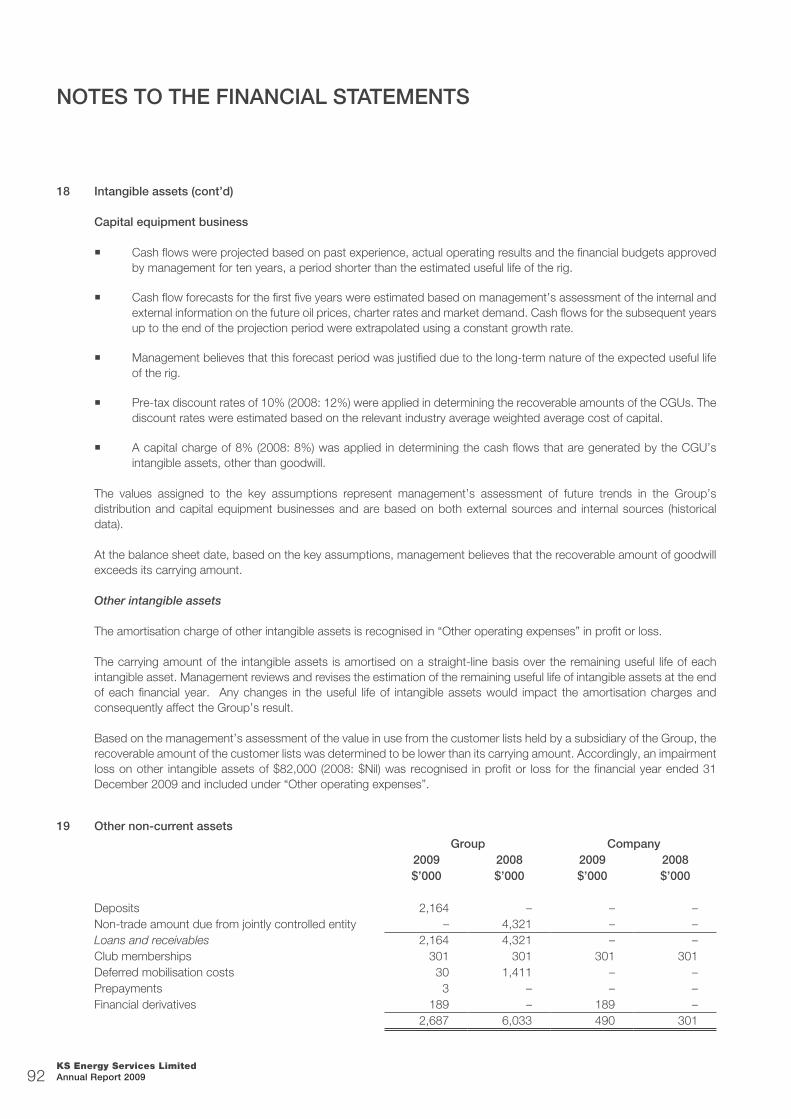
KS Energy Services Limited Annual Report 200992
18 Intangible assets (cont’d)
Capital equipment business
Cash flows were projected based on past experience, actual operating results and the financial budgets approved by management for ten years, a period shorter than the estimated useful life of the rig.
Cash flow forecasts for the first five years were estimated based on management’s assessment of the internal and external information on the future oil prices, charter rates and market demand. Cash flows for the subsequent years up to the end of the projection period were extrapolated using a constant growth rate.
Management believes that this forecast period was justified due to the long-term nature of the expected useful life of the rig.
Pre-tax discount rates of 10% (2008: 12%) were applied in determining the recoverable amounts of the CGUs. The discount rates were estimated based on the relevant industry average weighted average cost of capital.
A capital charge of 8% (2008: 8%) was applied in determining the cash flows that are generated by the CGU’s intangible assets, other than goodwill.
The values assigned to the key assumptions represent management’s assessment of future trends in the Group’s distribution and capital equipment businesses and are based on both external sources and internal sources (historical data).
At the balance sheet date, based on the key assumptions, management believes that the recoverable amount of goodwill exceeds its carrying amount.
Other intangible assets
The amortisation charge of other intangible assets is recognised in “Other operating expenses” in profit or loss.
The carrying amount of the intangible assets is amortised on a straight-line basis over the remaining useful life of each intangible asset. Management reviews and revises the estimation of the remaining useful life of intangible assets at the end of each financial year. Any changes in the useful life of intangible assets would impact the amortisation charges and consequently affect the Group’s result.
Based on the management’s assessment of the value in use from the customer lists held by a subsidiary of the Group, the recoverable amount of the customer lists was determined to be lower than its carrying amount. Accordingly, an impairment loss on other intangible assets of $82,000 (2008: $Nil) was recognised in profit or loss for the financial year ended 31 December 2009 and included under “Other operating expenses”.
19 Other non-current assets
Group Company2009 2008 2009 2008$’000 $’000 $’000 $’000
Deposits 2,164 – – –Non-trade amount due from jointly controlled entity – 4,321 – –Loans and receivables 2,164 4,321 – –Club memberships 301 301 301 301Deferred mobilisation costs 30 1,411 – –Prepayments 3 – – –Financial derivatives 189 – 189 –
2,687 6,033 490 301
NOTES TO THE FINANCIAL STATEMENTS

KS Energy Services Limited Annual Report 2009 93
19 Other non-current assets (cont’d)
In 2008, the non-trade amount due from the jointly controlled entity, which was denominated in United States dollars, was unsecured, bears interest at 6.5% per annum, and repayable by 2012. This amount was subordinated to a bank for banking facilities granted to the jointly controlled entity as disclosed in Note 15. In the current financial year, the Company acquired the remaining equity interests in the jointly controlled entity and the entity became a wholly-owned subsidiary of the Group.
Included in deposits is $2,129,000 or US$1,510,000 (2008: $Nil) of deposit held by an external customer of the Group, which is held against the performance bank guarantee in relation to a rig management contract entered into with the external party. The deposit is expected to be released by the end of the 3 years period of the management contract.
The Group and the Company’s exposure to credit risk and foreign currency risk and sensitivity analysis for other non-current assets are disclosed in Note 29.
20 Trade and other payables
Group Company2009 2008 2009 2008$’000 $’000 $’000 $’000
CurrentTrade payables:- Third parties 56,569 73,180 682 1,879- Associate 197 17 – –- Jointly controlled entities 1,453 1,581 – –- Companies in which a director of a subsidiary has
substantial financial interests 6,274 6,197 – –64,493 80,975 682 1,879
Non-trade payables:- Associate 189 136 – –- Jointly controlled entities 3,526 8,715 3,525 8,715- Companies in which a director of a subsidiary has
substantial financial interests 70 1,442 – –Accrued operating expenses 22,045 34,736 2,267 4,934Deposits received 1,167 4,294 – –Other payables 4,335 4,116 864 491Financial liabilities at amortised cost 95,825 134,414 7,338 16,019Advances received from customers 79 77 – –Deferred income 1,935 5,481 – –
97,839 139,972 7,338 16,019Non-currentAccrued operating lease expense 2,256 5,232 – –Other payables – 1,024 – –Financial liabilities at amortised cost 2,256 6,256 – –Deferred income 253 184 – –
2,509 6,440 – –
Total trade and other payables 100,348 146,412 7,338 16,019
Total financial liabilities at amortised cost 98,081 140,670 7,338 16,019
NOTES TO THE FINANCIAL STATEMENTS
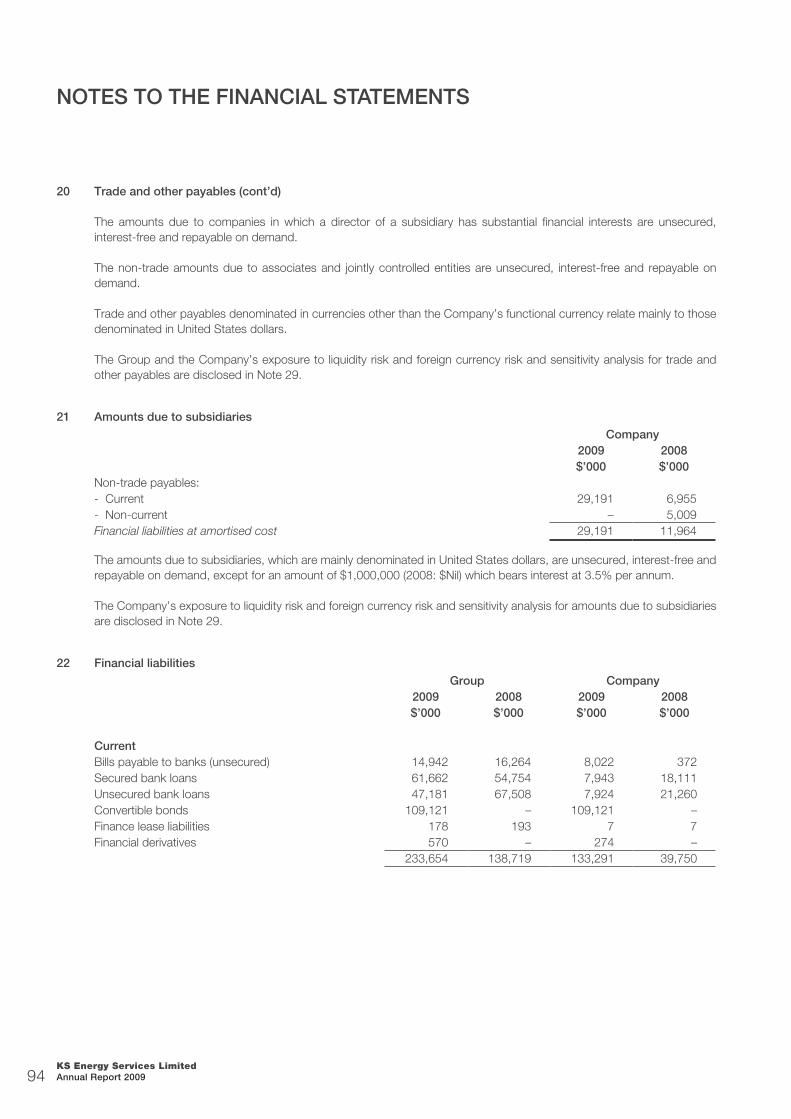
KS Energy Services Limited Annual Report 200994
20 Trade and other payables (cont’d)
The amounts due to companies in which a director of a subsidiary has substantial financial interests are unsecured, interest-free and repayable on demand.
The non-trade amounts due to associates and jointly controlled entities are unsecured, interest-free and repayable on demand.
Trade and other payables denominated in currencies other than the Company’s functional currency relate mainly to those denominated in United States dollars.
The Group and the Company’s exposure to liquidity risk and foreign currency risk and sensitivity analysis for trade and other payables are disclosed in Note 29.
21 Amounts due to subsidiaries
Company2009 2008$’000 $’000
Non-trade payables:- Current 29,191 6,955- Non-current – 5,009Financial liabilities at amortised cost 29,191 11,964
The amounts due to subsidiaries, which are mainly denominated in United States dollars, are unsecured, interest-free and repayable on demand, except for an amount of $1,000,000 (2008: $Nil) which bears interest at 3.5% per annum.
The Company’s exposure to liquidity risk and foreign currency risk and sensitivity analysis for amounts due to subsidiaries are disclosed in Note 29.
22 Financial liabilities
Group Company2009 2008 2009 2008$’000 $’000 $’000 $’000
CurrentBills payable to banks (unsecured) 14,942 16,264 8,022 372Secured bank loans 61,662 54,754 7,943 18,111Unsecured bank loans 47,181 67,508 7,924 21,260Convertible bonds 109,121 – 109,121 –Finance lease liabilities 178 193 7 7Financial derivatives 570 – 274 –
233,654 138,719 133,291 39,750
NOTES TO THE FINANCIAL STATEMENTS
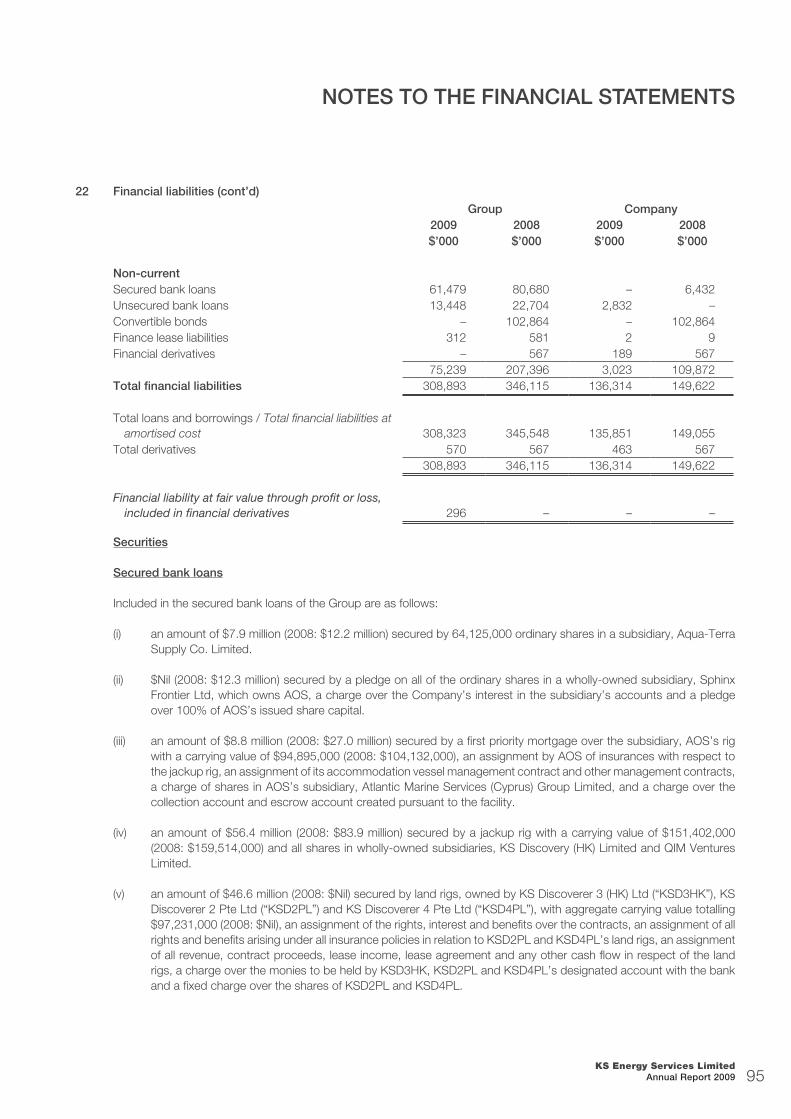
KS Energy Services Limited Annual Report 2009 95
22 Financial liabilities (cont’d)
Group Company2009 2008 2009 2008$’000 $’000 $’000 $’000
Non-currentSecured bank loans 61,479 80,680 – 6,432Unsecured bank loans 13,448 22,704 2,832 –Convertible bonds – 102,864 – 102,864Finance lease liabilities 312 581 2 9Financial derivatives – 567 189 567
75,239 207,396 3,023 109,872Total financial liabilities 308,893 346,115 136,314 149,622
Total loans and borrowings / Total financial liabilities at amortised cost 308,323 345,548 135,851 149,055
Total derivatives 570 567 463 567308,893 346,115 136,314 149,622
Financial liability at fair value through profit or loss, included in financial derivatives 296 – – –
Securities
Secured bank loans
Included in the secured bank loans of the Group are as follows:
(i) an amount of $7.9 million (2008: $12.2 million) secured by 64,125,000 ordinary shares in a subsidiary, Aqua-Terra Supply Co. Limited.
(ii) $Nil (2008: $12.3 million) secured by a pledge on all of the ordinary shares in a wholly-owned subsidiary, Sphinx Frontier Ltd, which owns AOS, a charge over the Company’s interest in the subsidiary’s accounts and a pledge over 100% of AOS’s issued share capital.
(iii) an amount of $8.8 million (2008: $27.0 million) secured by a first priority mortgage over the subsidiary, AOS’s rig with a carrying value of $94,895,000 (2008: $104,132,000), an assignment by AOS of insurances with respect to the jackup rig, an assignment of its accommodation vessel management contract and other management contracts, a charge of shares in AOS’s subsidiary, Atlantic Marine Services (Cyprus) Group Limited, and a charge over the collection account and escrow account created pursuant to the facility.
(iv) an amount of $56.4 million (2008: $83.9 million) secured by a jackup rig with a carrying value of $151,402,000 (2008: $159,514,000) and all shares in wholly-owned subsidiaries, KS Discovery (HK) Limited and QIM Ventures Limited.
(v) an amount of $46.6 million (2008: $Nil) secured by land rigs, owned by KS Discoverer 3 (HK) Ltd (“KSD3HK”), KS Discoverer 2 Pte Ltd (“KSD2PL”) and KS Discoverer 4 Pte Ltd (“KSD4PL”), with aggregate carrying value totalling $97,231,000 (2008: $Nil), an assignment of the rights, interest and benefits over the contracts, an assignment of all rights and benefits arising under all insurance policies in relation to KSD2PL and KSD4PL’s land rigs, an assignment of all revenue, contract proceeds, lease income, lease agreement and any other cash flow in respect of the land rigs, a charge over the monies to be held by KSD3HK, KSD2PL and KSD4PL’s designated account with the bank and a fixed charge over the shares of KSD2PL and KSD4PL.
NOTES TO THE FINANCIAL STATEMENTS
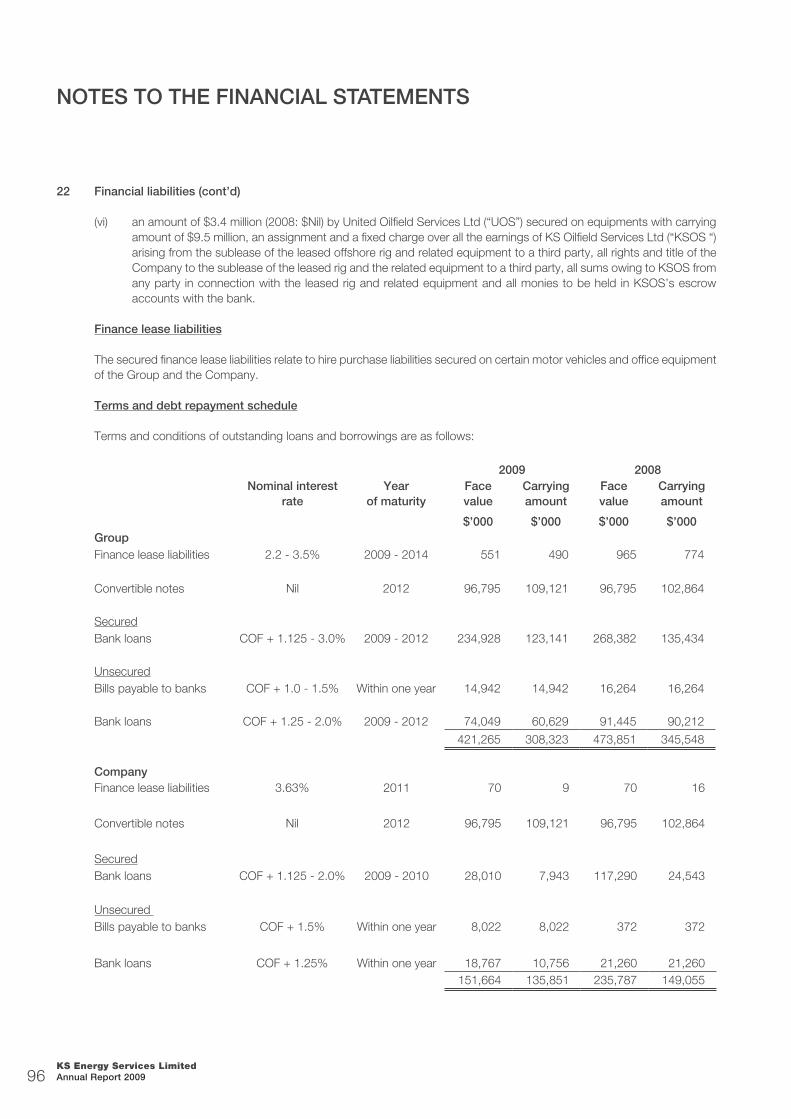
KS Energy Services Limited Annual Report 200996
22 Financial liabilities (cont’d)
(vi) an amount of $3.4 million (2008: $Nil) by United Oilfield Services Ltd (“UOS”) secured on equipments with carrying amount of $9.5 million, an assignment and a fixed charge over all the earnings of KS Oilfield Services Ltd (“KSOS “)arising from the sublease of the leased offshore rig and related equipment to a third party, all rights and title of the Company to the sublease of the leased rig and the related equipment to a third party, all sums owing to KSOS from any party in connection with the leased rig and related equipment and all monies to be held in KSOS’s escrow accounts with the bank.
Finance lease liabilities
The secured finance lease liabilities relate to hire purchase liabilities secured on certain motor vehicles and office equipment of the Group and the Company.
Terms and debt repayment schedule
Terms and conditions of outstanding loans and borrowings are as follows:
2009 2008Nominal interest
rateyear
of maturityFace value
Carrying amount
Face value
Carrying amount
$’000 $’000 $’000 $’000Group Finance lease liabilities 2.2 - 3.5% 2009 - 2014 551 490 965 774
Convertible notes Nil 2012 96,795 109,121 96,795 102,864
SecuredBank loans COF + 1.125 - 3.0% 2009 - 2012 234,928 123,141 268,382 135,434
UnsecuredBills payable to banks COF + 1.0 - 1.5% Within one year 14,942 14,942 16,264 16,264
Bank loans COF + 1.25 - 2.0% 2009 - 2012 74,049 60,629 91,445 90,212
421,265 308,323 473,851 345,548
Company Finance lease liabilities 3.63% 2011 70 9 70 16
Convertible notes Nil 2012 96,795 109,121 96,795 102,864
SecuredBank loans COF + 1.125 - 2.0% 2009 - 2010 28,010 7,943 117,290 24,543
Unsecured Bills payable to banks COF + 1.5% Within one year 8,022 8,022 372 372
Bank loans COF + 1.25% Within one year 18,767 10,756 21,260 21,260151,664 135,851 235,787 149,055
NOTES TO THE FINANCIAL STATEMENTS

KS Energy Services Limited Annual Report 2009 97
22 Financial liabilities (cont’d)
The following are the expected contractual undiscounted cash outflows of financial liabilities, including interest payments and excluding the impact of netting agreements:
Cash outflows
Carrying amount
Contractual cash flows
Within 1 year
After 1 year but within
5 years$’000 $’000 $’000 $’000
Group 2009Non-derivative financial liabilitiesVariable interest rate loans 183,770 193,674 115,807 77,867Finance lease liabilities 490 571 203 368Bills payable 14,942 14,979 14,979 –Convertible notes 109,121 126,966 126,966 –Trade and other payables* 98,081 98,081 95,825 2,256
406,404 434,271 353,780 80,491
Derivative financial liabilities Interest rate swap used for hedging 570 581 581 –
2008Non-derivative financial liabilitiesVariable interest rate loans 225,646 240,644 131,801 108,843Finance lease liabilities 774 920 224 696Bills payable 16,264 16,395 16,395 –Convertible notes 102,864 126,966 – 126,966Trade and other payables* 140,670 140,670 134,414 6,256
486,218 525,595 282,834 242,761
Derivative financial liabilities Interest rate swap used for hedging 567 571 400 171
NOTES TO THE FINANCIAL STATEMENTS

KS Energy Services Limited Annual Report 200998
22 Financial liabilities (cont’d)
Cash outflows
Carrying amount
Contractual cash flows
Within 1 year
After 1 year but within
5 years$’000 $’000 $’000 $’000
Company2009Non-derivative financial liabilitiesVariable interest rate loans 18,699 19,129 16,135 2,994Finance lease liabilities 9 10 8 2Bills payable 8,022 8,066 8,066 –Convertible notes 109,121 126,966 126,966 –Trade and other payables* 7,338 7,338 7,338 –Amounts due to subsidiaries 29,191 29,226 29,226 –
172,380 190,735 187,739 2,996
Derivative financial liabilities Interest rate swap used for hedging 463 474 474 –
2008Non-derivative financial liabilitiesVariable interest rate loans 45,803 46,528 40,020 6,508Finance lease liabilities 16 19 9 10Bills payable 372 372 372 –Convertible notes 102,864 126,966 – 126,966Trade and other payables* 16,019 16,019 16,019 –Amounts due to subsidiaries 11,964 11,964 6,955 5,009
177,038 201,868 63,375 138,493
Derivative financial liabilities Interest rate swap used for hedging 567 571 400 171
* Excluding advances received from customers and deferred income
Maturity of borrowings (excluding trade and other payables, finance lease liabilities and financial derivatives)
Group Company2009 2008 2009 2008$’000 $’000 $’000 $’000
Payable:
- Within 1 year 232,906 138,526 133,010 39,743
- After 1 year but within 5 years 74,927 206,248 2,832 109,296Total 307,833 344,774 135,842 149,039
NOTES TO THE FINANCIAL STATEMENTS
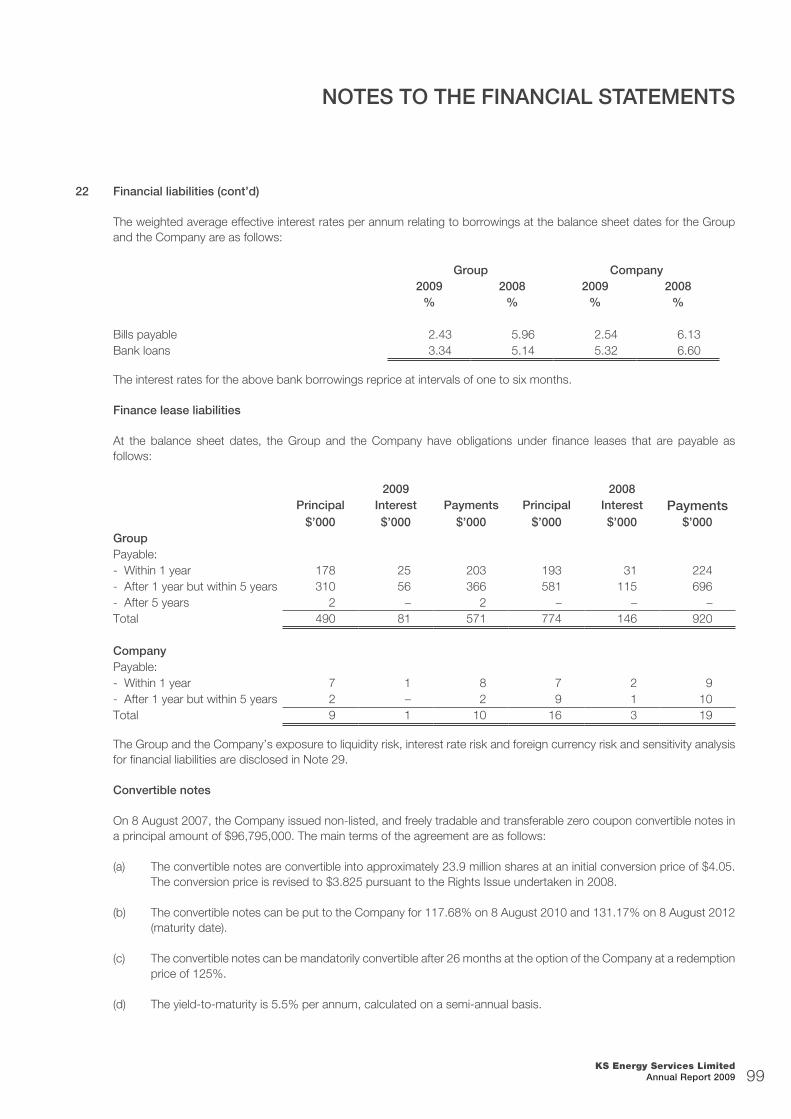
KS Energy Services Limited Annual Report 2009 99
22 Financial liabilities (cont’d)
The weighted average effective interest rates per annum relating to borrowings at the balance sheet dates for the Group and the Company are as follows:
Group Company2009 2008 2009 2008
% % % %
Bills payable 2.43 5.96 2.54 6.13Bank loans 3.34 5.14 5.32 6.60
The interest rates for the above bank borrowings reprice at intervals of one to six months.
Finance lease liabilities
At the balance sheet dates, the Group and the Company have obligations under finance leases that are payable as follows:
2009 2008Principal Interest Payments Principal Interest Payments
$’000 $’000 $’000 $’000 $’000 $’000GroupPayable:- Within 1 year 178 25 203 193 31 224- After 1 year but within 5 years 310 56 366 581 115 696- After 5 years 2 – 2 – – –Total 490 81 571 774 146 920
CompanyPayable:- Within 1 year 7 1 8 7 2 9- After 1 year but within 5 years 2 – 2 9 1 10Total 9 1 10 16 3 19
The Group and the Company’s exposure to liquidity risk, interest rate risk and foreign currency risk and sensitivity analysis for financial liabilities are disclosed in Note 29.
Convertible notes
On 8 August 2007, the Company issued non-listed, and freely tradable and transferable zero coupon convertible notes in a principal amount of $96,795,000. The main terms of the agreement are as follows:
(a) The convertible notes are convertible into approximately 23.9 million shares at an initial conversion price of $4.05. The conversion price is revised to $3.825 pursuant to the Rights Issue undertaken in 2008.
(b) The convertible notes can be put to the Company for 117.68% on 8 August 2010 and 131.17% on 8 August 2012 (maturity date).
(c) The convertible notes can be mandatorily convertible after 26 months at the option of the Company at a redemption price of 125%.
(d) The yield-to-maturity is 5.5% per annum, calculated on a semi-annual basis.
NOTES TO THE FINANCIAL STATEMENTS
KS Energy Services Limited Annual Report 2009100
22 Financial liabilities (cont’d)
(e) The convertible notes become repayable on demand if there is a change of control of the Company or a delisting of the Company’s shares. The early redemption amount is the principal plus an amount that would equal a yield of 5.5% per annum, calculated on a semi-annual basis.
Refinancing of convertible notes due in 2010
The Group and the Company have existing convertible notes with a carrying value of $109.1 million as at 31 December 2009. The existing convertible notes are due for redemption by 8 August 2010 with an accreted value of $114.4 million. Accordingly, the entire carrying amount of the convertible notes has been reclassified as current liabilities as at 31 December 2009.
As part of its refinancing plans, the Company has implemented or is in the process of carrying out the following debt or equity financing alternatives:
1 As described in Note 35 to the financial statements, the Company signed an agreement in January 2010 to:
Issue new convertible notes (“New Convertible Bonds”) to a third party investor totalling $50 million of principal value. The New Convertible Bonds were successfully issued on 26 March 2010 with net proceeds of $42.4 million. The said net proceeds were utilised to repurchase $36.8 million (in principal value) of the existing convertible notes based on the par value plus accrued interest up to 26 March 2010.
Enter into an option to issue additional notes (“Additional Convertible Bonds”) of up to $57 million of principal value to other investors. The Company has engaged a financial institution to commence the marketing of the Additional Convertible Bonds to potential investors in March 2010.
2 As described in Note 35 to the financial statements, the Company (together with certain of its subsidiaries and associates) and Actis Excalibur Limited entered into various schemes of arrangement to carry out a business consolidation on 8 December 2009. Pursuant to this business consolidation, the Group is expecting to receive net proceeds of about $26 million from Actis Excalibur Limited by May 2010. The business consolidation has been approved by the various shareholders of the companies involved and management is of the view that the closing of the exercise in May 2010 is procedural in nature and is confident of securing the net proceeds of $26 million.
3 The Company has in place a standby financial arrangement, which will provide adequate funds to meet the remaining obligations under the existing convertible notes, if the need arises.
The total net proceeds from the various financing alternatives 1 to 3 highlighted above (excluding the proceeds from the Additional Convertible Bonds) amounted to approximately $114.3 million, which is sufficient for the Group and the Company to refinance the existing convertible bonds with an accreted value of $114.4 million. The directors consider it appropriate to adopt the going concern basis in preparing the financial statements.
NOTES TO THE FINANCIAL STATEMENTS

KS Energy Services Limited Annual Report 2009 101
23
Def
erre
d t
ax
M
ovem
ents
in d
efer
red
tax
asse
ts a
nd li
abilit
ies
(prio
r to
offs
ettin
g of
bal
ance
s) d
urin
g th
e ye
ar a
re a
s fo
llow
s:
At
1 Ja
nuar
y
2008
Rec
ogni
sed
in p
rofit
or
loss
(Not
e 7)
Rec
ogni
sed
in o
ther
com
pre
hens
ive
inco
me
Acq
uisi
tion
of
sub
sid
iarie
s
(Not
e 27
)
Exc
hang
e
diff
eren
ces
At
31 D
ecem
ber
2008
Rec
ogni
sed
in
pro
fit o
r lo
ss
(Not
e 7)
Rec
ogni
sed
in o
ther
com
pre
hens
ive
inco
me
Acq
uisi
tion
of s
ubsi
dia
ry
and
min
ority
inte
rest
s
(Not
e 27
)
Exc
hang
e
diff
eren
ces
At
31 D
ecem
ber
2009
$’00
0$’
000
$’00
0$’
000
$’00
0$’
000
$’00
0$’
000
$’00
0$’
000
$’00
0
Gro
up
Def
erre
d t
ax li
abili
ties
Pro
pert
y, p
lant
and
equi
pmen
t94
5(7
35)
–18
3(5
)38
81,
519
–16
611
2,08
4
Ava
ilabl
e-fo
r-sa
le e
quity
secu
ritie
s3,
226
– (3
,004
)–
–22
2–
(222
)–
––
Con
vert
ible
not
es21
148
––
–25
9(4
8)–
––
211
4,38
2(6
87)
(3,0
04)
183
(5)
869
1,47
1(2
22)
166
112,
295
NOTES TO THE FINANCIAL STATEMENTS
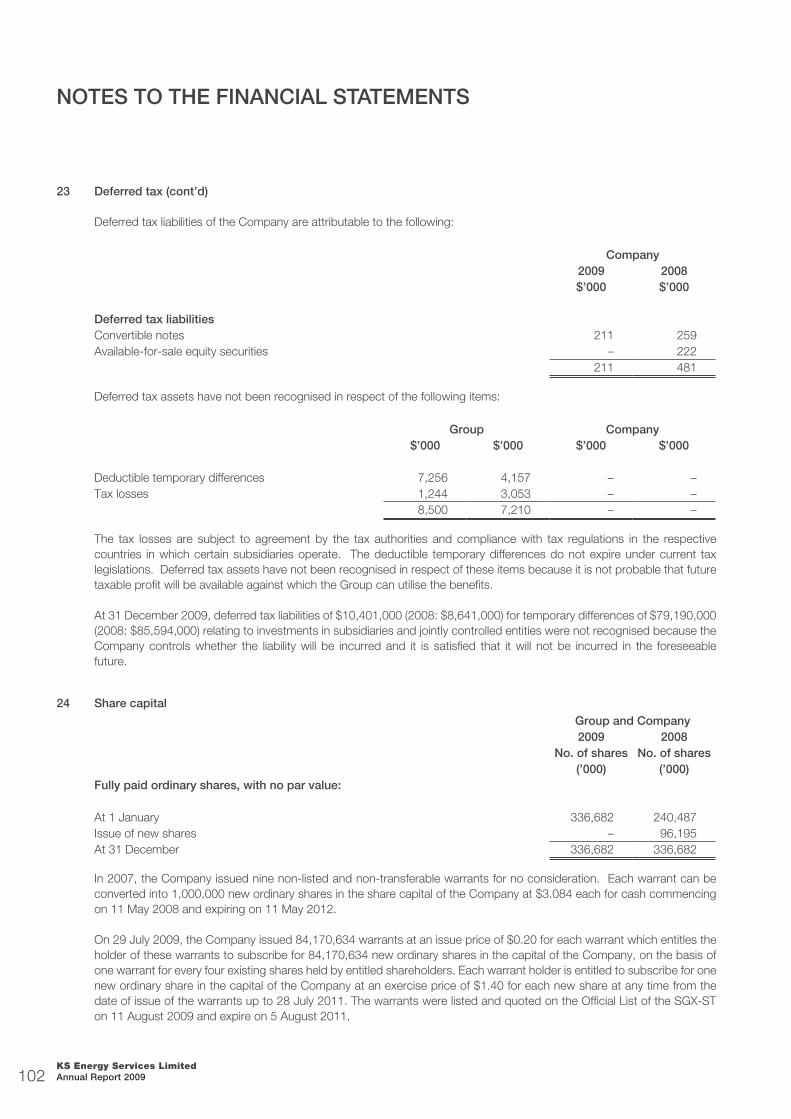
KS Energy Services Limited Annual Report 2009102
23 Deferred tax (cont’d)
Deferred tax liabilities of the Company are attributable to the following:
Company2009 2008$’000 $’000
Deferred tax liabilitiesConvertible notes 211 259Available-for-sale equity securities – 222
211 481
Deferred tax assets have not been recognised in respect of the following items:
Group Company$’000 $’000 $’000 $’000
Deductible temporary differences 7,256 4,157 – –Tax losses 1,244 3,053 – –
8,500 7,210 – –
The tax losses are subject to agreement by the tax authorities and compliance with tax regulations in the respective countries in which certain subsidiaries operate. The deductible temporary differences do not expire under current tax legislations. Deferred tax assets have not been recognised in respect of these items because it is not probable that future taxable profit will be available against which the Group can utilise the benefits.
At 31 December 2009, deferred tax liabilities of $10,401,000 (2008: $8,641,000) for temporary differences of $79,190,000 (2008: $85,594,000) relating to investments in subsidiaries and jointly controlled entities were not recognised because the Company controls whether the liability will be incurred and it is satisfied that it will not be incurred in the foreseeable future.
24 Share capital
Group and Company2009 2008
No. of shares No. of shares(’000) (’000)
Fully paid ordinary shares, with no par value:
At 1 January 336,682 240,487Issue of new shares – 96,195At 31 December 336,682 336,682
In 2007, the Company issued nine non-listed and non-transferable warrants for no consideration. Each warrant can be converted into 1,000,000 new ordinary shares in the share capital of the Company at $3.084 each for cash commencing on 11 May 2008 and expiring on 11 May 2012.
On 29 July 2009, the Company issued 84,170,634 warrants at an issue price of $0.20 for each warrant which entitles the holder of these warrants to subscribe for 84,170,634 new ordinary shares in the capital of the Company, on the basis of one warrant for every four existing shares held by entitled shareholders. Each warrant holder is entitled to subscribe for one new ordinary share in the capital of the Company at an exercise price of $1.40 for each new share at any time from the date of issue of the warrants up to 28 July 2011. The warrants were listed and quoted on the Official List of the SGX-ST on 11 August 2009 and expire on 5 August 2011.
NOTES TO THE FINANCIAL STATEMENTS
KS Energy Services Limited Annual Report 2009 103
24 Share capital (cont’d)
The holders of ordinary shares (excluding treasury shares) are entitled to receive dividends as declared from time to time and are entitled to one vote per share at meetings of the Company. All shares (excluding treasury shares) rank equally with regard to the Company’s residual assets.
Capital management
The Board’s policy is to maintain an adequate capital base so as to maintain investor, creditor and market confidence and to sustain future development of the business. The Board of Directors monitors the return on capital, which the Group defines as net operating income divided by total shareholders’ equity excluding minority interest. The Board also monitors the level of dividends to ordinary shareholders.
The Board seeks to maintain a balance between the higher returns that might be possible with higher levels of borrowings and the advantages and security afforded by a sound capital position. In view of the challenging global economic situation, the Group endeavours to achieve a return on shareholders’ equity to be above 15% per annum; in 2009 the return was 10.4% (2008: 21.4%). In comparison, the weighted average interest expense on interest-bearing borrowings (excluding liabilities with imputed interest) was 3.34% (2008: 5.14%).
From time to time, the Company purchases its own shares on the market; the timing of these purchases depends on market prices. Buy and sell decisions are made on a specific transaction basis by the Board; the Company does not have a defined shares buy-back plan. This amount is classified as a deduction from equity under “Treasury shares”. At 31 December 2009, the Company held 11,308,000 (2008: 11,308,000) of its own uncancelled shares.
There were no changes in the Group’s approach to capital management during the year. The Company and its subsidiaries are not subjected to any externally imposed capital requirements.
25 Reserves
Equity reserves
The equity reserves relates to the value of the warrants received for the issue of warrants by the Company.
Convertible notes – equity component
The convertible notes-equity component comprises the value of the embedded option to convert the liability component of the convertible notes into equity of the Company as at the date of issue of the convertible notes, which is net of deferred tax effect.
Treasury shares
Treasury shares comprise the cost of the Company’s shares held by the Group.
Foreign currency translation reserve
The foreign currency translation reserve comprises foreign currency differences arising from the translation of the financial statements of foreign operations whose functional currencies are different from that of the Company, as well as from the translation of foreign currency loans which form part of the Group’s net investment in foreign operations.
Fair value reserve
The fair value reserve comprises the cumulative net change in the fair value (net of deferred tax effect) of available-for-sale financial assets until such assets are derecognised.
NOTES TO THE FINANCIAL STATEMENTS
KS Energy Services Limited Annual Report 2009104
25 Reserves (cont’d)
Hedging reserve
The hedging reserve comprises the effective portion of the cumulative net change in the fair value of cash flow hedging instrument that is related to hedged transactions that are exposed to interest rate risk.
Dividends
On 15 May 2009, the shareholders approved a total gross dividend of 1.8 cents per share (one-tier tax exempt) amounting to $6.1 million in respect of the financial year ended 31 December 2008.
No dividend has been declared in respect of the financial year ended 31 December 2009.
26 Equity compensation benefits
Under the terms of the KS Energy Employee Share Option Scheme (the “Scheme”), subject to the absolute discretion of the Committee, options may be granted, to the Group’s employees, executive directors and non-executive directors provided that certain criteria are met. Subject to the absolute discretion of the Committee, Controlling Shareholders and their Associates who meet certain criteria are eligible to participate in the Scheme, provided that the participation of each Controlling Shareholder or his Associate and each grant of an option to any of them may only be effected with the specific prior approval of Shareholders in general meeting by a separate resolution.
The aggregate number of ordinary shares over which options may be granted on any date under the Scheme, when added to the number of ordinary shares issued and/or issuable in respect of:
all options granted under the Scheme;
all contingent award of ordinary shares granted pursuant to the rules of the Plan; and
all ordinary shares in the capital of the Company, options or awards granted under any other share option or share scheme of the Company then in force;
shall not exceed 15% of the total number of issued ordinary shares, excluding treasury shares, in the capital of the Company on the day preceding the relevant date of grant. Furthermore, the aggregate number of ordinary shares over which options may be granted under the Scheme to Controlling Shareholders and their Associates shall not exceed 25% of the ordinary shares available under the Scheme, and the number of ordinary shares over which options may be granted under the Scheme to each Controlling Shareholder or his Associate shall not exceed 10% of the ordinary shares available under the Scheme.
The Scheme shall continue to be in force at the discretion of the Committee, subject to a maximum period of ten years commencing on the date on which the Scheme is adopted by shareholders of the Company in general meeting, provided that the Scheme may continue beyond the aforesaid period of time with the approval of shareholders of the Company in general meeting and of any relevant authority which may then be required.
The subscription price of the options shall be fixed by the Committee at its absolute discretion at:
the Market Price, determined by reference to the price equal to the average of the last dealt prices for a Share, as determined by reference to the daily official list or other publication published by the SGX-ST for five consecutive market days immediately preceding the offer date of that option, rounded up to the nearest whole cent in the event of fractional prices;
or at a discount to the Market Price, the quantum of such discount to be determined by the Committee at its absolute discretion, provided that the maximum discount shall not exceed 20% of the Market Price and is approved by shareholders of the Company in general meeting in a separate resolution.
NOTES TO THE FINANCIAL STATEMENTS

KS Energy Services Limited Annual Report 2009 105
26 Equity compensation benefits (cont’d)
Options granted with the Exercise Price set at the Market Price may be exercised at any time after the first anniversary of the date of grant, provided that the option shall be exercised before the tenth anniversary of the date of grant or such earlier date as may be determined by the Committee, failing which the unexercised option shall immediately be null and void.
Options granted with the Exercise Price set at a discount to the Market Price may be exercised at any time after the second anniversary of the date of grant, provided that the option shall be exercised before the tenth anniversary of the date of grant or such earlier date as may be determined by the Committee, failing which the unexercised option shall immediately be null and void.
No options have been granted since the commencement of the Scheme.
27 Acquisitions of subsidiaries and minority interests
Acquisition of subsidiaries
United Oilfield Services Pte Ltd (“UOS”)
On 3 July 2009, the Company entered into a sales and purchase agreement to acquire the remaining 50% of the issued and paid-up capital of a jointly controlled entity, UOS, a company incorporated in Singapore, from Ezra Holdings Limited. UOS became a wholly-owned subsidiary of the Group. The consideration for the purchase of shares was $121,000, being the net asset value of the acquired shares as at 31 December 2008, and was satisfied in cash. UOS contributed a net profit of $395,000 to the Group’s consolidated net profit after tax and minority interests for the year ended 31 December 2009.
Landrig 5 (BVI) Ltd (“Landrig 5”)
On 11 March 2009, a subsidiary of the Group entered into a sales and purchase agreement to acquire the remaining 60% of the issued and paid-up capital of an associate, Landrig 5, a company incorporated in the British Virgin Islands, from Dutco (BVI) Ltd. Landrig 5 became a wholly-owned subsidiary of the Group. The principal activities of Landrig 5 are those relating to the ownership and charter of land rigs. The consideration for the purchase of shares is $2,175,000, being the cost of the shares acquired, and was satisfied in cash. Landrig 5 remained dormant during the year.
Raymonds Supply (Shenzhen) Co Ltd (“Raymonds Shenzhen”)
On 11 November 2009, a 75%-owned subsidiary in Hong Kong, Raymonds Supply Company Ltd (“Raymonds HK”) completed the acquisition of Raymonds Shenzhen from a director and shareholder of Raymonds HK, at a consideration of $144,000.
As the fair value of the net assets acquired was in excess of the cash consideration paid, Raymonds HK recognised a negative goodwill of $27,000 to profit or loss. Raymonds HK had also invested an additional amount of $141,000 in the issued and paid-up share capital of Raymonds Shenzhen for additional working capital purposes. Raymonds Shenzhen contributed a net loss of $14,000 to the Group’s consolidated net profit after tax for the year ended 31 December 2009.
Oceanic Offshore Engineering Pte Ltd (“Oceanic”)
On 11 January 2008, a subsidiary of the Group, Marinehub Pte Ltd, entered into a sales and purchase agreement to acquire 80% of the issued and paid-up capital of Oceanic, a company incorporated in Singapore, whose principal activities are a specialist for rigging and testing of wire ropes and related services. The aggregate consideration for the purchase of shares is approximately $306,000 and is satisfied in cash. Oceanic contributed a net profit of $3,100,000 to the Group’s consolidated net profit after tax and minority interests for the year ended 31 December 2008.
NOTES TO THE FINANCIAL STATEMENTS

KS Energy Services Limited Annual Report 2009106
27 Acquisitions of subsidiaries and minority interests (cont’d)
UT Technologies Pte Ltd (“UT”)
On 12 August 2008, a subsidiary of the Group, Orient Marine Pte Ltd, entered into an agreement with UT to acquire UT’s existing business and assets for a cash consideration of $700,000. UT contributed a net profit of $70,000 to the Group’s consolidated net profit after tax and minority interests for the year ended 31 December 2008.
If the above acquisitions of subsidiaries/business had occurred on 1 January 2009, the Group’s revenue would have been $492,775,000 and net profit after tax and minority interests would have been $40,225,000.
The effect of the acquisitions of subsidiaries/business is set out below:
GroupNote 2009 2008
$’000 $’000
Property, plant and equipment 17 11,507 628Intangible assets 18 – 1,202Inventories 345 307Trade receivables 299 3,404Other current assets 3,995 505Cash and cash equivalents 182 611Trade and other payables (7,013) (4,435)Borrowings (4,759) –Finance lease liabilities – (206)Provision for current tax (54) (44)Deferred tax liabilities 23 (34) (217)Net identifiable assets and liabilities 4,468 1,755Minority interest – (748)Amount previously accounted for as jointly controlled entity (1,737) –Net assets acquired 2,731 1,007Negative goodwill recognised to profit or loss (27) –Total consideration for acquisitions of subsidiaries/business, satisfied by cash payment
2,704 1,007
Cash acquired (182) (611)Net cash outflows 2,522 396
The pre-acquisition carrying amounts of the assets and liabilities of the acquired businesses were determined based on applicable FRSs immediately before their acquisition. The values of the assets given and liabilities incurred or assumed at the date of exchange, plus costs directly attributable on the dates of acquisition have been assessed by the management.
Based on management’s provisional assessment, no fair value adjustments were made in respect of the net identified assets and liabilities of the above acquisitions at the dates of acquisitions as the fair value adjustments to the net identified assets and liabilities were considered insignificant.
For the year ended 31 December 2009, the allocation of purchase prices of Oceanic and UT to the Group’s share of the identifiable assets, liabilities and contingent liabilities has been determined and completed during the year. No adjustments to the provisional values of the acquired identifiable assets and liabilities and goodwill are required.
NOTES TO THE FINANCIAL STATEMENTS
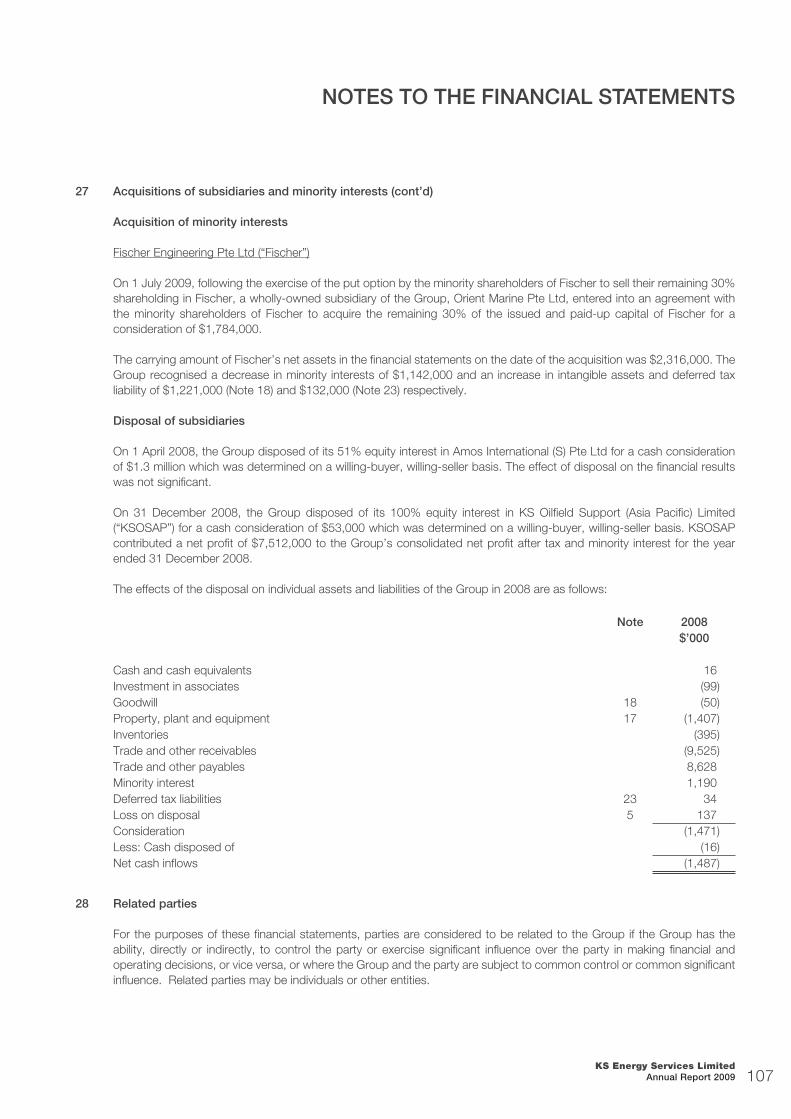
KS Energy Services Limited Annual Report 2009 107
27 Acquisitions of subsidiaries and minority interests (cont’d)
Acquisition of minority interests
Fischer Engineering Pte Ltd (“Fischer”)
On 1 July 2009, following the exercise of the put option by the minority shareholders of Fischer to sell their remaining 30% shareholding in Fischer, a wholly-owned subsidiary of the Group, Orient Marine Pte Ltd, entered into an agreement with the minority shareholders of Fischer to acquire the remaining 30% of the issued and paid-up capital of Fischer for a consideration of $1,784,000.
The carrying amount of Fischer’s net assets in the financial statements on the date of the acquisition was $2,316,000. The Group recognised a decrease in minority interests of $1,142,000 and an increase in intangible assets and deferred tax liability of $1,221,000 (Note 18) and $132,000 (Note 23) respectively.
Disposal of subsidiaries
On 1 April 2008, the Group disposed of its 51% equity interest in Amos International (S) Pte Ltd for a cash consideration of $1.3 million which was determined on a willing-buyer, willing-seller basis. The effect of disposal on the financial results was not significant.
On 31 December 2008, the Group disposed of its 100% equity interest in KS Oilfield Support (Asia Pacific) Limited (“KSOSAP”) for a cash consideration of $53,000 which was determined on a willing-buyer, willing-seller basis. KSOSAP contributed a net profit of $7,512,000 to the Group’s consolidated net profit after tax and minority interest for the year ended 31 December 2008.
The effects of the disposal on individual assets and liabilities of the Group in 2008 are as follows:
Note 2008$’000
Cash and cash equivalents 16Investment in associates (99)Goodwill 18 (50)Property, plant and equipment 17 (1,407)Inventories (395)Trade and other receivables (9,525)Trade and other payables 8,628Minority interest 1,190Deferred tax liabilities 23 34Loss on disposal 5 137Consideration (1,471)Less: Cash disposed of (16)Net cash inflows (1,487)
28 Related parties
For the purposes of these financial statements, parties are considered to be related to the Group if the Group has the ability, directly or indirectly, to control the party or exercise significant influence over the party in making financial and operating decisions, or vice versa, or where the Group and the party are subject to common control or common significant influence. Related parties may be individuals or other entities.
NOTES TO THE FINANCIAL STATEMENTS

KS Energy Services Limited Annual Report 2009108
28 Related parties (cont’d)
Other than disclosed elsewhere in the financial statements, the transactions with related parties are as follows:
Key management personnel compensation
Key management personnel are directors and those persons having authority and responsibility for planning, directing and controlling the activities of the Group, directly or indirectly. The amounts stated below for key management compensation are for all the executive directors and other key management personnel. The amounts do not include compensation of any of the key management personnel and directors of the Group who received compensation from related corporations outside the Group in their capacity as directors and/or executives of those related corporations.
Key management personnel compensation is as follows:
Group2009 2008$’000 $’000
Short-term employee benefits 10,274 11,260Post-employment benefits 166 170
10,440 11,430
Included in key management personnel compensation is directors’ remuneration of the Company of $1,320,000 (2008: $2,420,000).
Other transactions with key management personnel
Group2009 2008$’000 $’000
Transactions with companies in which directors of the Company have substantial financial interestsSale of goods 4,890 19,466Purchase of goods (2,554) (1,811)Operating lease expense (17) (477)Professional fees (39) (65)Acquisition of additional interest in Landrig 5 (2,175) –
Transactions with companies in which a director of a subsidiary has substantial financial interestsManagement fee income 632 412Supply of manpower and other shared services (21,739) (14,718)
Transactions with a director of a subsidiaryPurchase of leasehold property – (1,959)
NOTES TO THE FINANCIAL STATEMENTS

KS Energy Services Limited Annual Report 2009 109
28 Related parties (cont’d)
Other related party transactions
Group2009 2008$’000 $’000
Transactions with jointly controlled entitiesSale of goods 3,587 –Interest income 130 309Management fee income 4,151 3,199Operating lease expense (12,855) (4,795)Modification services rendered 1,395 817
Transactions with associatesSale of goods 473 679Management fee income 10 6Purchase of goods (1,133) (396)Operating lease expense (1,910) (526)
29 Financial risk management
Overview
The Group has exposure to the following risks from its use of financial instruments:
credit risk liquidity risk market risk interest rate risk foreign currency risk
This note presents information about the Group’s exposure to each of the above risks, the Group’s objectives, policies and processes for measuring and managing risk, and the Group’s management of capital. Further quantitative disclosures are included throughout these consolidated financial statements.
Risk management framework
The Board of Directors has overall responsibility for the establishment and oversight of the Group’s risk management framework. The Group’s risk management policies are established to identify and analyse the risks faced by the Group, to set appropriate risk limits and controls, and to monitor risks and adherence to limits. The Group has a system of controls in place to create an acceptable balance between the cost of risks occurring and the cost of managing the risks. The management continually monitors the Group’s risk management process to ensure that an appropriate balance between risk and control is achieved. Risk management policies and systems are reviewed regularly to reflect changes in market conditions and the Group’s activities.
The Audit Committee oversees how management monitors compliance with the Group’s risk management policies and procedures and reviews the adequacy of the risk management framework in relation to the risks faced by the Group. The Audit Committee is assisted in its oversight role by Internal Auditors. The Internal Auditors undertake both regular and ad hoc reviews of risk management controls and procedures, the results of which are reported to the Audit Committee.
NOTES TO THE FINANCIAL STATEMENTS

KS Energy Services Limited Annual Report 2009110
29 Financial risk management (cont’d)
Financial instruments by category
Set out below is a comparison by category of carrying amounts of all the Group’s financial instruments that are carried in the financial statements:
NoteLoans and receivables
Available-for-sale financial
assets
Financial liabilities at amortised
cost
Financial liabilities at fair value
through profit or loss Total
$’000 $’000 $’000 $’000 $’000Group2009Assets Cash and cash equivalents 9 72,173 – – – 72,173Trade receivables 11 117,758 – – – 117,758Other current assets 14 27,616 – – – 27,616Other non-current assets 19 2,164 – – – 2,164Available-for-sale equity securities – 115 – – 115
219,711 115 – – 219,826
LiabilitiesTrade and other payables 20 – – 98,081 – 98,081Financial liabilities 22 – – 308,323 296 308,619
– – 406,404 296 406,700
2008Assets Cash and cash equivalents 9 68,302 – – – 68,302Trade receivables 11 132,127 – – – 132,127Other current assets 14 32,449 – – – 32,449Other non-current assets 19 4,321 – – – 4,321Available-for-sale equity securities – 1,852 – – 1,852
237,199 1,852 – – 239,051
LiabilitiesTrade and other payables 20 – – 140,670 – 140,670Financial liabilities 22 – – 345,548 – 345,548
– – 486,218 – 486,218
NOTES TO THE FINANCIAL STATEMENTS
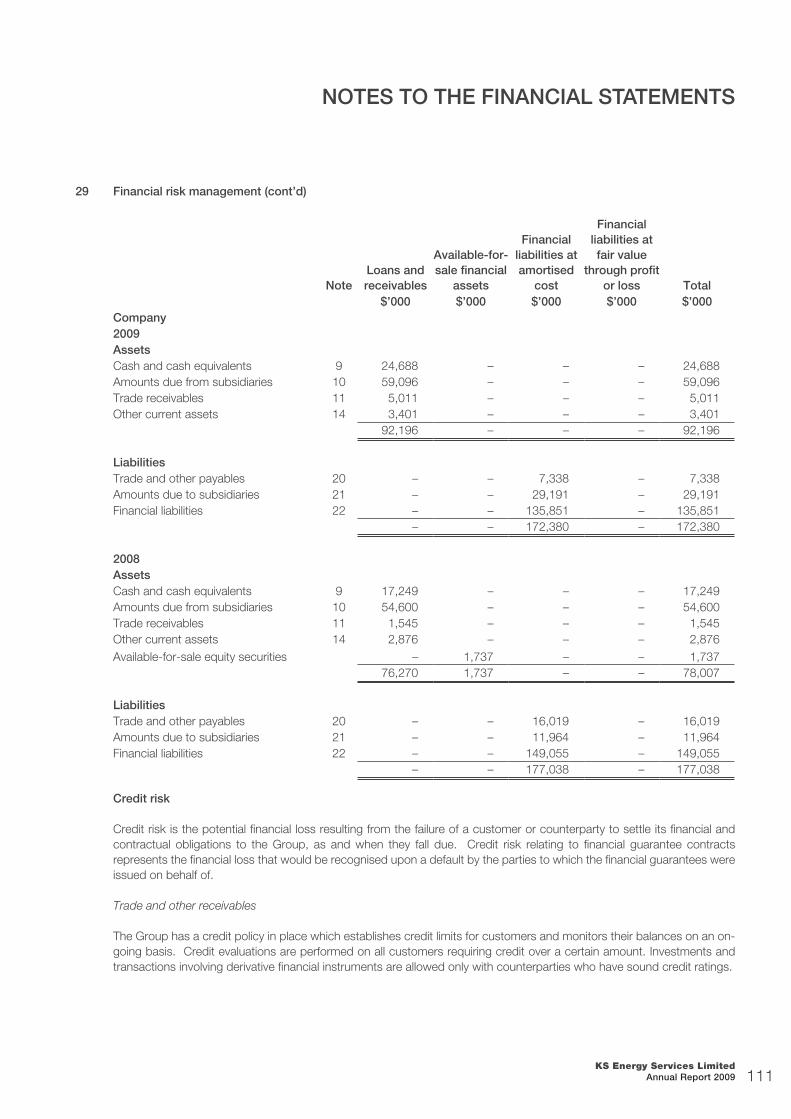
KS Energy Services Limited Annual Report 2009 111
29 Financial risk management (cont’d)
NoteLoans and receivables
Available-for-sale financial
assets
Financial liabilities at amortised
cost
Financial liabilities at fair value
through profit or loss Total
$’000 $’000 $’000 $’000 $’000Company2009Assets Cash and cash equivalents 9 24,688 – – – 24,688Amounts due from subsidiaries 10 59,096 – – – 59,096Trade receivables 11 5,011 – – – 5,011Other current assets 14 3,401 – – – 3,401
92,196 – – – 92,196
LiabilitiesTrade and other payables 20 – – 7,338 – 7,338Amounts due to subsidiaries 21 – – 29,191 – 29,191Financial liabilities 22 – – 135,851 – 135,851
– – 172,380 – 172,380
2008AssetsCash and cash equivalents 9 17,249 – – – 17,249Amounts due from subsidiaries 10 54,600 – – – 54,600Trade receivables 11 1,545 – – – 1,545Other current assets 14 2,876 – – – 2,876Available-for-sale equity securities – 1,737 – – 1,737
76,270 1,737 – – 78,007
LiabilitiesTrade and other payables 20 – – 16,019 – 16,019Amounts due to subsidiaries 21 – – 11,964 – 11,964Financial liabilities 22 – – 149,055 – 149,055
– – 177,038 – 177,038
Credit risk
Credit risk is the potential financial loss resulting from the failure of a customer or counterparty to settle its financial and contractual obligations to the Group, as and when they fall due. Credit risk relating to financial guarantee contracts represents the financial loss that would be recognised upon a default by the parties to which the financial guarantees were issued on behalf of.
Trade and other receivables
The Group has a credit policy in place which establishes credit limits for customers and monitors their balances on an on-going basis. Credit evaluations are performed on all customers requiring credit over a certain amount. Investments and transactions involving derivative financial instruments are allowed only with counterparties who have sound credit ratings.
NOTES TO THE FINANCIAL STATEMENTS

KS Energy Services Limited Annual Report 2009112
29 Financial risk management (cont’d)
At the balance sheet date, the Group has concentration of credit risk in 3 (2008: 3) major trade debtors representing approximately 25% (2008: 21%) of total trade receivables. The maximum exposure to credit risk is represented by the carrying amount of each financial asset, including derivative financial instruments, in the balance sheet.
The Group does not require collateral in respect of trade and other receivables.
The Group establishes an allowance for impairment that represents its estimate of incurred losses in respect of trade receivables. The main components of this allowance are a specific loss component that relates to individually significant exposures, and a collective loss component established for groups of similar assets in respect of losses that have been incurred but not yet identified. The collective loss allowance is determined based on historical data of payment statistics for similar financial assets.
The allowance account in respect of trade receivables is used to record impairment losses unless the Group is satisfied that no recovery of the amount owing is possible. At that point, the financial asset is considered irrecoverable and the amount charged to the allowance account is written off against the carrying amount of the impaired financial asset.
Cash and fixed deposits are placed with banks and approved financial institutions. The Group limits its credit risk exposure in respect of investments by only investing in liquid securities.
Exposure to credit risk
The carrying amount of financial assets represents the maximum credit exposure. The Group’s and Company’s maximum exposure to credit risk at the balance sheet date was:
Group CompanyCarrying amount Carrying amount
Note 2009 2008 2009 2008$’000 $’000 $’000 $’000
Loans and receivablesCash and cash equivalents 9 72,173 68,302 24,688 17,249Amounts due from subsidiaries 10 – – 59,096 54,600Trade receivables 11 117,758 132,127 5,011 1,545Other current assets 14 27,616 32,449 3,401 2,876Other non-current assets 19 2,164 4,321 – –Available-for-sale financial assetsAvailable-for-sale equity securities 115 1,852 – 1,737
219,826 239,051 92,196 78,007
Liquidity risk
Liquidity risk is the risk that the Group will encounter difficulty in meeting the obligations associated with its financial liabilities that are settled by delivering cash or another financial asset. The Group’s approach to managing liquidity is to ensure, as far as possible, that it will always have sufficient liquidity to meet its liabilities when due, under both normal and stressed conditions, without incurring unacceptable losses or risking damage to the Group’s reputation.
The Group monitors its liquidity risk and maintains a level of cash and cash equivalents deemed adequate by management to finance the Group’s operations and to mitigate the effects of fluctuations in cash flows.
NOTES TO THE FINANCIAL STATEMENTS
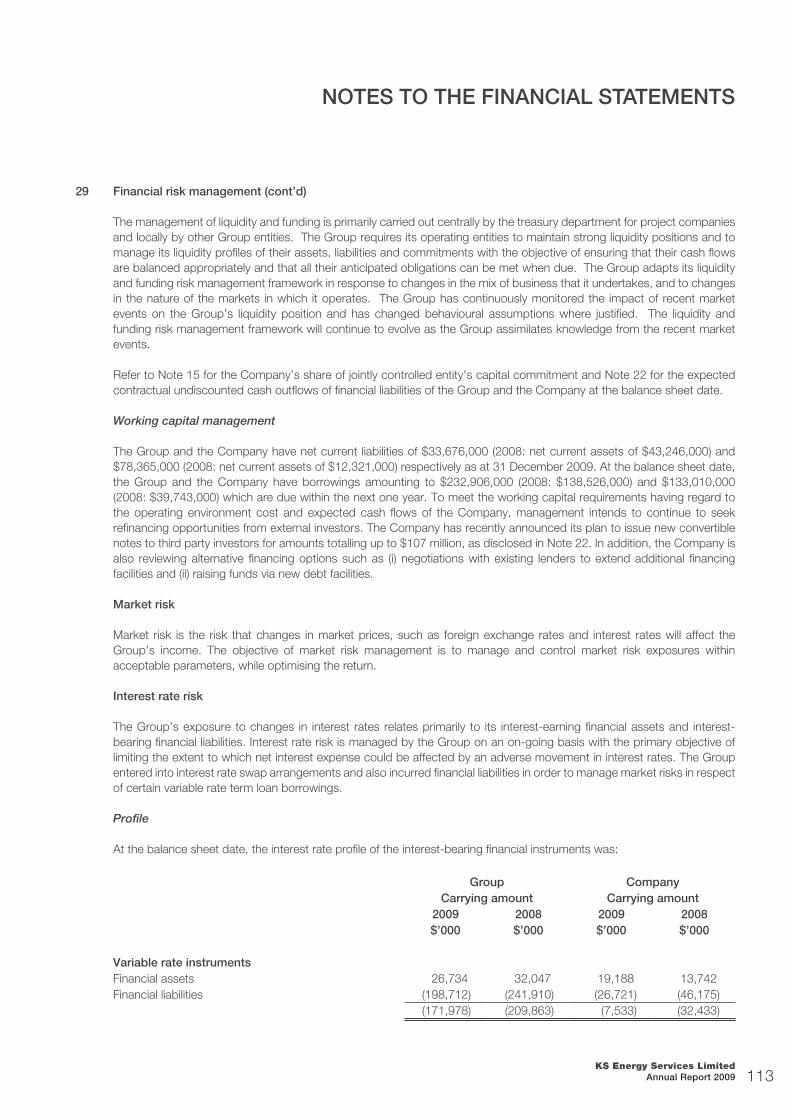
KS Energy Services Limited Annual Report 2009 113
29 Financial risk management (cont’d)
The management of liquidity and funding is primarily carried out centrally by the treasury department for project companies and locally by other Group entities. The Group requires its operating entities to maintain strong liquidity positions and to manage its liquidity profiles of their assets, liabilities and commitments with the objective of ensuring that their cash flows are balanced appropriately and that all their anticipated obligations can be met when due. The Group adapts its liquidity and funding risk management framework in response to changes in the mix of business that it undertakes, and to changes in the nature of the markets in which it operates. The Group has continuously monitored the impact of recent market events on the Group’s liquidity position and has changed behavioural assumptions where justified. The liquidity and funding risk management framework will continue to evolve as the Group assimilates knowledge from the recent market events.
Refer to Note 15 for the Company’s share of jointly controlled entity’s capital commitment and Note 22 for the expected contractual undiscounted cash outflows of financial liabilities of the Group and the Company at the balance sheet date.
Working capital management
The Group and the Company have net current liabilities of $33,676,000 (2008: net current assets of $43,246,000) and $78,365,000 (2008: net current assets of $12,321,000) respectively as at 31 December 2009. At the balance sheet date, the Group and the Company have borrowings amounting to $232,906,000 (2008: $138,526,000) and $133,010,000 (2008: $39,743,000) which are due within the next one year. To meet the working capital requirements having regard to the operating environment cost and expected cash flows of the Company, management intends to continue to seek refinancing opportunities from external investors. The Company has recently announced its plan to issue new convertible notes to third party investors for amounts totalling up to $107 million, as disclosed in Note 22. In addition, the Company is also reviewing alternative financing options such as (i) negotiations with existing lenders to extend additional financing facilities and (ii) raising funds via new debt facilities.
Market risk
Market risk is the risk that changes in market prices, such as foreign exchange rates and interest rates will affect the Group’s income. The objective of market risk management is to manage and control market risk exposures within acceptable parameters, while optimising the return.
Interest rate risk
The Group’s exposure to changes in interest rates relates primarily to its interest-earning financial assets and interest-bearing financial liabilities. Interest rate risk is managed by the Group on an on-going basis with the primary objective of limiting the extent to which net interest expense could be affected by an adverse movement in interest rates. The Group entered into interest rate swap arrangements and also incurred financial liabilities in order to manage market risks in respect of certain variable rate term loan borrowings.
Profile
At the balance sheet date, the interest rate profile of the interest-bearing financial instruments was:
Group CompanyCarrying amount Carrying amount
2009 2008 2009 2008$’000 $’000 $’000 $’000
Variable rate instrumentsFinancial assets 26,734 32,047 19,188 13,742Financial liabilities (198,712) (241,910) (26,721) (46,175)
(171,978) (209,863) (7,533) (32,433)
NOTES TO THE FINANCIAL STATEMENTS

KS Energy Services Limited Annual Report 2009114
29 Financial risk management (cont’d)
Cash flow sensitivity analysis for variable rate instruments
A change of 100 basis points in interest rates at the balance sheet date would have increased / (decreased) equity and profit or loss by the amounts shown below. This analysis assumes that all other variables, in particular foreign currency rates, remain constant. The analysis is performed on the same basis for 2008.
Profit or loss Equity100 bp
increase100 bp
decrease100 bp
increase100 bp
decrease$’000 $’000 $’000 $’000
Group31 December 2009Fixed deposits 267 (267) – –Variable rate borrowings (1,987) 1,987 – –Interest rate swap 140 (140) 250 (250)Cash flow sensitivity (net) (1,580) 1,580 250 (250)
31 December 2008Fixed deposits 320 (320) – –Variable rate borrowings (2,419) 2,419 – –Interest rate swap 97 (97) 122 (122)Cash flow sensitivity (net) (2,002) 2,002 122 (122)
Company31 December 2009Fixed deposits 192 (192) – –Variable rate borrowings (267) 267 – –Interest rate swap 140 (140) 79 (79)Cash flow sensitivity (net) 65 (65) 79 (79)
31 December 2008Fixed deposits 137 (137) – –Variable rate borrowings (462) 462 – –Interest rate swap 97 (97) 122 (122)Cash flow sensitivity (net) (228) 228 122 (122)
To reduce the Group’s interest rate exposure in respect of the variable rate instruments and effectively convert term loan borrowings from floating interest rate basis to fixed interest rate basis, the Group entered into interest rate swap contracts with financial institutions. At the balance sheet date, the Group has three interest rate swap contracts classified as derivative financial instruments to hedge against the variable interest rates arising from the Group’s variable rate borrowings.
NOTES TO THE FINANCIAL STATEMENTS

KS Energy Services Limited Annual Report 2009 115
29 Financial risk management (cont’d)
Cash flow hedge
As at 31 December 2009, the Group has two interest rate swaps with notional amounts totalling approximately $84.2 million (2008: $21.9 million), which were classified as cash flow hedges and stated at fair value. At the balance sheet date, one of the interest rate swap was a financial liability with a fair value of $274,000 (2008: $567,000), whereas the other interest rate swap was a financial asset with a fair value of $189,000. The fair values of these derivative financial instruments were recognised as derivative financial liability and derivative financial asset respectively in Notes 22 and 19.
The effective portion of the changes in fair value of the cash flow hedges of $299,000 (2008: $316,000) was recognised as hedging reserve in Note 25, and the ineffective portion comprising a gain of $75,000 (2008: loss of $251,000) was recognised in profit or loss in Note 6. The cash flows on the interest rate swap match the cash flow profile of interest payments on the interest-bearing borrowing which are at intervals of three months.
The following table indicates the periods in which the cash flows associated with derivatives that are cash flow hedges are expected to occur.
2009 2008
Carrying amount
Expected cash flows
1 year or less
2 – 5 years
More than 5 years
Carrying amount
Expected cash flows
1 year or less
2 – 5 years
More than 5 years
$’000 $’000 $’000 $’000 $’000 $’000 $’000 $’000 $’000 $’000GroupInterest rate swaps Asset 189 1,091 740 351 – – – – – –Liabilities (274) (285) (285) – – (567) (571) (400) (171) –
(85) 806 455 351 – (567) (571) (400) (171) –
CompanyInterest rate swaps Liabilities (274) (285) (285) – – (567) (571) (400) (171) –
The following table indicates the periods in which the cash flows associated with derivatives that are cash flow hedges are expected to impact profit or loss.
GroupInterest rate swaps Asset 189 1,091 740 351 – – – – – –Liabilities (274) (285) (285) – – (567) (571) (400) (171) –
(85) 806 455 351 – (567) (571) (400) (171) –
CompanyInterest rate swaps Liabilities (274) (285) (285) – – (567) (571) (400) (171) –
NOTES TO THE FINANCIAL STATEMENTS
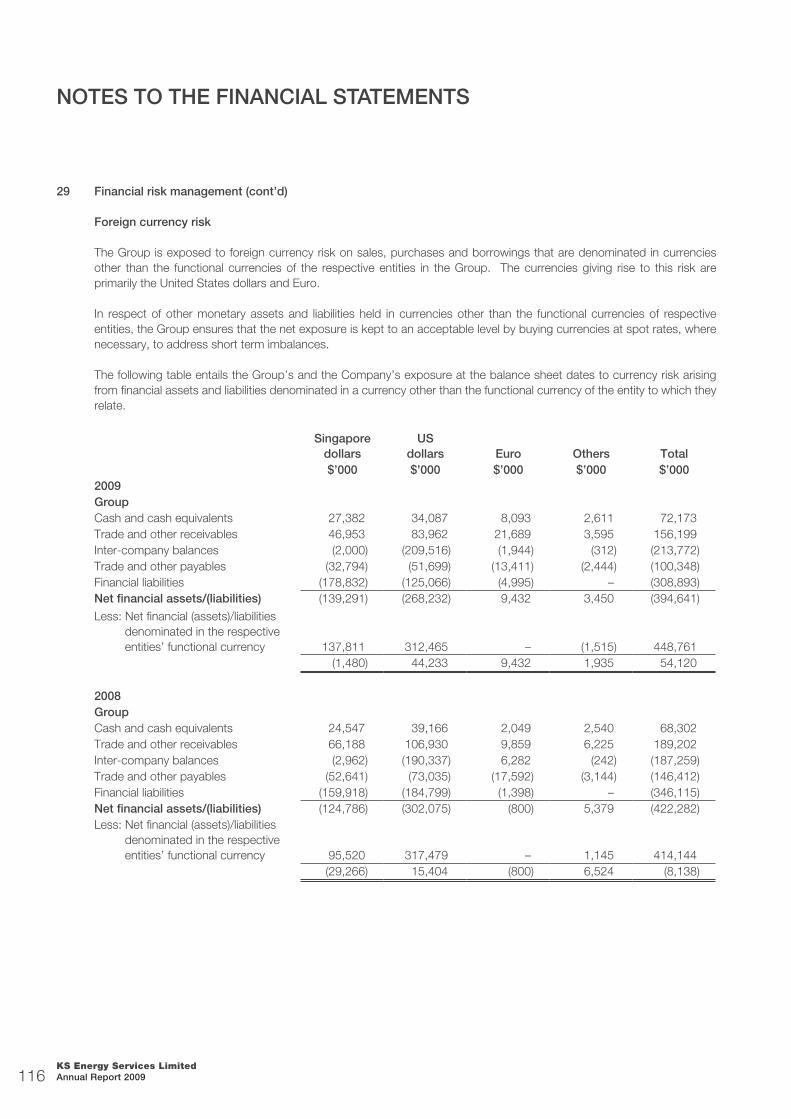
KS Energy Services Limited Annual Report 2009116
29 Financial risk management (cont’d)
Foreign currency risk
The Group is exposed to foreign currency risk on sales, purchases and borrowings that are denominated in currencies other than the functional currencies of the respective entities in the Group. The currencies giving rise to this risk are primarily the United States dollars and Euro.
In respect of other monetary assets and liabilities held in currencies other than the functional currencies of respective entities, the Group ensures that the net exposure is kept to an acceptable level by buying currencies at spot rates, where necessary, to address short term imbalances.
The following table entails the Group’s and the Company’s exposure at the balance sheet dates to currency risk arising from financial assets and liabilities denominated in a currency other than the functional currency of the entity to which they relate.
Singapore dollars
US dollars
Euro Others Total
$’000 $’000 $’000 $’000 $’0002009GroupCash and cash equivalents 27,382 34,087 8,093 2,611 72,173Trade and other receivables 46,953 83,962 21,689 3,595 156,199Inter-company balances (2,000) (209,516) (1,944) (312) (213,772)Trade and other payables (32,794) (51,699) (13,411) (2,444) (100,348)Financial liabilities (178,832) (125,066) (4,995) – (308,893)Net financial assets/(liabilities) (139,291) (268,232) 9,432 3,450 (394,641)
Less: Net financial (assets)/liabilities denominated in the respective entities’ functional currency 137,811 312,465 – (1,515) 448,761
(1,480) 44,233 9,432 1,935 54,120
2008GroupCash and cash equivalents 24,547 39,166 2,049 2,540 68,302Trade and other receivables 66,188 106,930 9,859 6,225 189,202Inter-company balances (2,962) (190,337) 6,282 (242) (187,259)Trade and other payables (52,641) (73,035) (17,592) (3,144) (146,412)Financial liabilities (159,918) (184,799) (1,398) – (346,115)Net financial assets/(liabilities) (124,786) (302,075) (800) 5,379 (422,282)Less: Net financial (assets)/liabilities
denominated in the respective entities’ functional currency 95,520 317,479 – 1,145 414,144
(29,266) 15,404 (800) 6,524 (8,138)
NOTES TO THE FINANCIAL STATEMENTS

KS Energy Services Limited Annual Report 2009 117
29 Financial risk management (cont’d)
Singapore dollars
US dollars
Euro Others Total
$’000 $’000 $’000 $’000 $’0002009CompanyCash and cash equivalents 4,976 13,312 6,382 18 24,688Trade and other receivables 1,139 7,538 272 – 8,949Inter-company balances (35) 29,940 – – 29,905Quasi equity loans to subsidiaries and
jointly controlled entities 2,219 279,988 – – 282,207Trade and other payables (2,554) (4,500) (284) – (7,338)Financial liabilities (121,386) (9,933) (4,995) – (136,314)Net financial assets/(liabilities) (115,641) 316,345 1,375 18 202,097Less: Net financial (assets)/liabilities
denominated in the Company’s functional currency 115,641 – – – 115,641
– 316,345 1,375 18 317,738
2008CompanyCash and cash equivalents 7,614 8,807 784 44 17,249Trade and other receivables 1,081 3,588 205 4 4,878Inter-company balances (5,408) 48,044 – – 42,636Quasi equity loans to subsidiaries and
jointly controlled entities 1,994 273,405 – – 275,399Trade and other payables (4,921) (10,193) (902) (3) (16,019)Financial liabilities (115,679) (33,943) – – (149,622)Net financial assets/(liabilities) (115,319) 289,708 87 45 174,521Less: Net financial (assets)/liabilities
denominated in the Company’s functional currency 115,319 – – – 115,319
– 289,708 87 45 289,840
Sensitivity analysis
The following table indicates the approximate change in the Group’s and Company’s profit after tax and equity in response to a 10% change in the foreign exchange rates to which the Group and Company has significant exposure at the balance sheet date. The sensitivity analysis includes balances between group entities where the denomination of the balances is in a currency other than the functional currencies of the lender or the borrower.
A 10% strengthening of Singapore dollar against the following currencies at the balance sheet date would increase / (decrease) equity and profit or loss by the amounts shown below. This analysis assumes that all other variables, in particular interest rates, remain constant.
NOTES TO THE FINANCIAL STATEMENTS

KS Energy Services Limited Annual Report 2009118
29 Financial risk management (cont’d)
Group Company
EquityProfit
or loss EquityProfit
or loss$’000 $’000 $’000 $’000
2009Singapore dollars – 148 – –US dollars – (4,423) – (31,635)Euro – (943) – (138)Others – (194) – (2)
2008Singapore dollars – 2,927 – –US dollars – (1,540) – (28,971)Euro – 80 – (9)Others – (652) – (5)
A 10% weakening of Singapore dollars against the above currencies would have had the equal but opposite effect on the above currencies to the amounts shown above, on the basis that all other variables remain constant.
Insurance risk
The Company issues financial guarantees on behalf of its subsidiaries and jointly controlled entities. There are no terms and conditions attached to the financial guarantee contracts that would have a material effect on the amount, timing and certainty of the Company’s future cash flows. Estimates of the Company’s obligations arising from financial guarantee contracts may be affected by future events, which cannot be predicted with certainty. The assumptions made may vary from actual experience so that the actual liability may vary considerably from the best estimates.
See Note 31 for information on the periods in which the financial guarantees will expire and the contractual undiscounted cash flow in respect of the financial guarantees.
Equity price risk - sensitivity analysis
In 2008, the Group was exposed to equity price changes arising from a quoted equity investment classified as available-for-sale equity securities. The Group’s quoted equity investment is listed on the Singapore Stock Exchange (“SGX”). The Group disposed of the remaining investments in the quoted equity securities during the year. A 10% increase or decrease in the underlying equity prices at the balance sheet date would increase or decrease equity by the following amount:
Group Company2009 2008 2009 2008$’000 $’000 $’000 $’000
Equity – 150 – 150
This analysis assumes all other variables remain constant.
NOTES TO THE FINANCIAL STATEMENTS

KS Energy Services Limited Annual Report 2009 119
29 Financial risk management (cont’d)
Estimation of fair values
Fair values
At 31 December 2009, the carrying amounts of financial assets and financial liabilities approximated their fair values.
The following summarises the significant methods and assumptions used in estimating the fair values of financial instruments of the Group at balance sheet date.
Investments in equity securities
The fair value of available-for-sale financial assets and quoted investments in subsidiaries and associates is determined by reference to their quoted bid prices at the balance sheet dates. The fair value of quoted investments in subsidiaries and associates is determined for disclosure purposes only.
Convertible notes
The fair value is calculated based on the present value of future principal and interest cash flows, discounted at the market rate of interest at the balance sheet date. In respect of the liability component of convertible notes, the market rate of interest is determined by reference to similar liabilities that do not have a conversion option.
Derivatives
The fair value of interest rate swaps is based on broker quotes. These quotes are tested for reasonableness by discounting estimated future cash flows based on the terms and maturity of each contract and using market interest rates for a similar instrument at the measurement date.
Non-derivative financial assets and liabilities
Fair value, which is determined for disclosure purposes, is calculated based on the present value of future principal and interest cash flows, discounted at the market rate of interest at the balance sheet dates. For finance leases, the market rate of interest is determined by reference to similar lease agreements.
Financial guarantees
The fair value of financial guarantees issued by the Group to third party corporation is estimated by reference to the difference in interest rates, by comparing the actual rates charged by the bank with these guarantees made available, with the estimated rates that the banks would have charged had these guarantees not been available.
Other financial assets and liabilities
The notional amounts of financial assets and liabilities with a maturity of less than one year (including trade and other receivables, cash and cash equivalents, and trade and other payables) are assumed to approximate their fair values because of the short period to maturity. All other financial assets and liabilities are discounted to determine their fair values.
NOTES TO THE FINANCIAL STATEMENTS

KS Energy Services Limited Annual Report 2009120
29 Financial risk management (cont’d)
Fair values versus carrying amounts
The carrying amounts of the Group and the Company’s financial instruments carried at cost or amortised cost are not materially different from their fair values as at 31 December 2009 and 2008, except as follows:
2009 2008Carrying amount Fair value
Carrying amount Fair value
$’000 $’000 $’000 $’000
GroupLiabilities held at amortised costFinance lease liabilities 490 532 774 781
CompanyLiabilities held at amortised costFinance lease liabilities 9 9 16 16
The basis of determining fair values is disclosed above.
Fair value hierarchy
The table below analyses financial instruments carried at fair value, by valuation method. The different levels have been defined as follows:
Level 1: quoted prices (unadjusted) in active markets for identical assets or liabilities
Level 2: inputs other than quoted prices included within Level 1 that are observable for asset or liability, either directly (i.e., as prices) or indirectly (i.e., derived from prices)
Level 3: inputs for the asset or liability that are not based on observable market data (unobservable inputs).
Level 1 Level 2 Level 3 Total$’000 $’000 $’000 $’000
Group2009Derivative financial assets – 189 – 189Derivative financial liabilities – (570) – (570)
– (381) – (381)
2008Available-for-sale financial assets 1,737 – – 1,737Derivative financial liabilities – (567) – (567)
1,737 (567) – 1,170
NOTES TO THE FINANCIAL STATEMENTS

KS Energy Services Limited Annual Report 2009 121
29 Financial risk management (cont’d)
Level 1 Level 2 Level 3 Total$’000 $’000 $’000 $’000
Company2009Derivative financial assets – 189 – 189Derivative financial liabilities – (463) – (463)
– (274) – (274)
2008Available-for-sale financial assets 1,737 – – 1,737Derivative financial liabilities – (567) – (567)
1,737 (567) – 1,170
During the year, there were no transfers between Level 1 and Level 2 of the fair value hierarchy.
In 2008, the Company had available-for-sale quoted equity securities with carrying amount of $1,737,000, which were listed on the SGX. This asset was analysed as Level 1 as the fair value determined was based on observable market data, i.e. the quoted price in an active market.
At 31 December 2009 and 31 December 2008, in order to determine the fair value of the interest rate swaps, management had obtained independent valuations from the banks, which were based on valuation techniques in which significant inputs were based on observable market data. The interest rate swaps were analysed as Level 2 as the inputs used for the valuations were based on observable market data.
30 Commitments
Capital commitments
At 31 December 2009, the Group has entered into contracts to purchase plant and equipment of $31,725,000 (2008: $3,350,000) and inventories of $1,828,000 (2008: $Nil).
Operating lease commitments
Offices and warehouses
The Group and the Company lease office space and warehouse from an associate under an operating lease.
The Group also leases from Jurong Town Corporation and other owners for office and warehousing premises. The lease from the Jurong Town Corporation is for 30 years from 1 May 2002 and is subject to an escalation clause but the amount of the rent increase is not to exceed a certain percentage. Such increases are not included in the amounts below.
The leases from other owners are negotiated for an average term of 1 to 3 years at prevailing market terms.
NOTES TO THE FINANCIAL STATEMENTS

KS Energy Services Limited Annual Report 2009122
30 Commitments (cont’d)
Where the Group and the Company are lessees:
At the balance sheet dates, the Group and the Company have commitments for future minimum lease payments under non-cancellable operating leases as follows:
Group Company2009 2008 2009 2008$’000 $’000 $’000 $’000
Within 1 year 14,765 18,045 138 238After 1 year but within 5 years 21,408 40,372 26 145After 5 years 1,779 1,830 – –
37,952 60,247 164 383
Where the Group is a lessor:
At the balance sheet dates, the Group has future minimum lease payments receivable under non-cancellable operating leases as follows:
Group2009 2008$’000 $’000
Within 1 year 18,873 21,462After 1 year but within 5 years 27,482 52,633
46,355 74,095
31 Contingent liabilities (unsecured)
Group
Claim by BR Energy (M) Sdn Bhd
On 28 October 2009, the Company was served with a Writ of Summons (“the Writ”) in respect of a claim by BR Energy (M) Sdn Bhd (“BRE”) for alleged breach of the BR Offshore Services Limited (“BROS”) joint venture agreement entered into between the parties in March 2006.
The Court, upon hearing the appeal, ordered security for costs to be furnished at $50,000 which was provided by BRE on 12 March 2010 through a solicitor’s undertaking. Both parties also exchanged further and better particulars on 18 March 2010. At the pre-trial conference (“PTC”) on 19 March 2010, the Court gave directions on the time-lines going forward and fixed the next PTC for 30 April 2010.
Management has been advised by its external lawyers that there is sufficient evidence to support its defense against the alleged breach of the joint venture agreement with BRE, and accordingly, no provision for the contingent liability has been made at balance sheet date.
NOTES TO THE FINANCIAL STATEMENTS
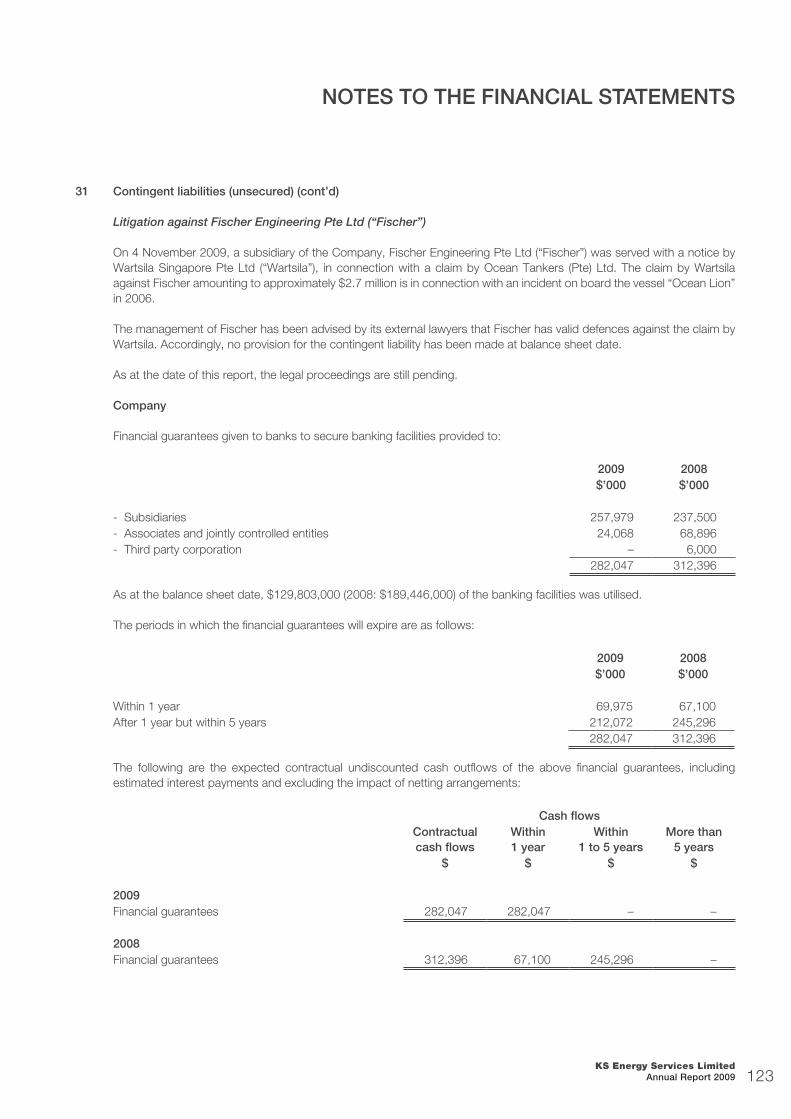
KS Energy Services Limited Annual Report 2009 123
31 Contingent liabilities (unsecured) (cont’d)
Litigation against Fischer Engineering Pte Ltd (“Fischer”)
On 4 November 2009, a subsidiary of the Company, Fischer Engineering Pte Ltd (“Fischer”) was served with a notice by Wartsila Singapore Pte Ltd (“Wartsila”), in connection with a claim by Ocean Tankers (Pte) Ltd. The claim by Wartsila against Fischer amounting to approximately $2.7 million is in connection with an incident on board the vessel “Ocean Lion” in 2006.
The management of Fischer has been advised by its external lawyers that Fischer has valid defences against the claim by Wartsila. Accordingly, no provision for the contingent liability has been made at balance sheet date.
As at the date of this report, the legal proceedings are still pending.
Company
Financial guarantees given to banks to secure banking facilities provided to:
2009 2008$’000 $’000
- Subsidiaries 257,979 237,500- Associates and jointly controlled entities 24,068 68,896- Third party corporation – 6,000
282,047 312,396
As at the balance sheet date, $129,803,000 (2008: $189,446,000) of the banking facilities was utilised.
The periods in which the financial guarantees will expire are as follows:
2009 2008$’000 $’000
Within 1 year 69,975 67,100After 1 year but within 5 years 212,072 245,296
282,047 312,396
The following are the expected contractual undiscounted cash outflows of the above financial guarantees, including estimated interest payments and excluding the impact of netting arrangements:
Cash flowsContractual cash flows
Within 1 year
Within 1 to 5 years
More than5 years
$ $ $ $
2009Financial guarantees 282,047 282,047 – –
2008Financial guarantees 312,396 67,100 245,296 –
NOTES TO THE FINANCIAL STATEMENTS
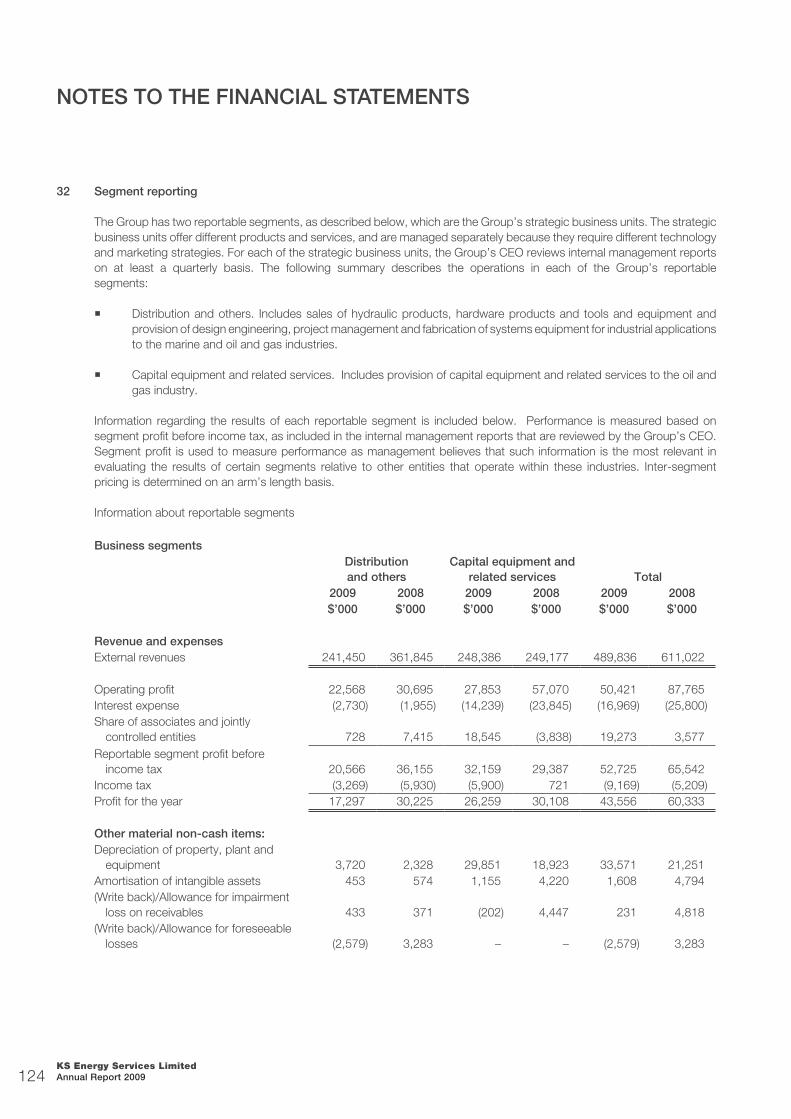
KS Energy Services Limited Annual Report 2009124
32 Segment reporting
The Group has two reportable segments, as described below, which are the Group’s strategic business units. The strategic business units offer different products and services, and are managed separately because they require different technology and marketing strategies. For each of the strategic business units, the Group’s CEO reviews internal management reports on at least a quarterly basis. The following summary describes the operations in each of the Group’s reportable segments:
Distribution and others. Includes sales of hydraulic products, hardware products and tools and equipment and provision of design engineering, project management and fabrication of systems equipment for industrial applications to the marine and oil and gas industries.
Capital equipment and related services. Includes provision of capital equipment and related services to the oil and gas industry.
Information regarding the results of each reportable segment is included below. Performance is measured based on segment profit before income tax, as included in the internal management reports that are reviewed by the Group’s CEO. Segment profit is used to measure performance as management believes that such information is the most relevant in evaluating the results of certain segments relative to other entities that operate within these industries. Inter-segment pricing is determined on an arm’s length basis.
Information about reportable segments
Business segmentsDistribution and others
Capital equipment and related services Total
2009 2008 2009 2008 2009 2008$’000 $’000 $’000 $’000 $’000 $’000
Revenue and expensesExternal revenues 241,450 361,845 248,386 249,177 489,836 611,022
Operating profit 22,568 30,695 27,853 57,070 50,421 87,765Interest expense (2,730) (1,955) (14,239) (23,845) (16,969) (25,800)Share of associates and jointly
controlled entities 728 7,415 18,545 (3,838) 19,273 3,577Reportable segment profit before
income tax 20,566 36,155 32,159 29,387 52,725 65,542Income tax (3,269) (5,930) (5,900) 721 (9,169) (5,209)Profit for the year 17,297 30,225 26,259 30,108 43,556 60,333
Other material non-cash items:Depreciation of property, plant and
equipment 3,720 2,328 29,851 18,923 33,571 21,251Amortisation of intangible assets 453 574 1,155 4,220 1,608 4,794(Write back)/Allowance for impairment
loss on receivables 433 371 (202) 4,447 231 4,818(Write back)/Allowance for foreseeable
losses (2,579) 3,283 – – (2,579) 3,283
NOTES TO THE FINANCIAL STATEMENTS

KS Energy Services Limited Annual Report 2009 125
32 Segment reporting (cont’d)
Distribution and others
Capital equipment and related services Total
2009 2008 2009 2008 2009 2008$’000 $’000 $’000 $’000 $’000 $’000
Inventory written off 325 1,916 – – 325 1,916Impairment losses on property, plant and
equipment and intangible assets 82 – 3,068 – 3,150 –Gain on disposal of interest in an
associate – – 1,996 – 1,996 –Gain on disposal of available-for-sale
equity securities – – 4,551 11,317 4,551 11,317
Assets and liabilitiesReportable segment assets 191,382 253,205 553,803 537,892 745,185 791,097Investment in associates and jointly
controlled entities 50,480 51,555 88,337 87,992 138,817 139,547884,002 930,644
Reportable segment liabilities 109,985 133,495 299,697 359,436 409,682 492,931Deferred tax liabilities 2,295 869Provision for tax 11,705 17,904
423,682 511,704
Other segment informationCapital expenditure 7,979 10,459 15,689 247,455 23,668 257,914
Geographical segments
The businesses of the Group operate mainly in five principal geographical areas, namely, Singapore, the People’s Republic of China, other Far East and ASEAN countries, Middle East and Europe. In presenting information on the basis of geographical segments, segment revenue is based on the geographical location of customers. Other non-current assets are based on the geographical location of the assets.
Revenue from external customers
Other non-current assets* Capital expenditure
2009 2008 2009 2008 2009 2008$’000 $’000 $’000 $’000 $’000 $’000
Singapore 143,980 219,682 105,180 115,930 4,655 10,700The People’s Republic of China 76,060 78,098 11,995 1,511 56 981Other Far East and ASEAN countries 54,243 76,983 194 193 3,376 1,397Middle East 128,680 132,792 267,368 240,970 14,327 204,967Europe 77,252 61,883 121,643 127,563 – 1,442Other regions 9,621 41,584 67,470 104,232 1,254 38,427Total 489,836 611,022 573,850 590,399 23,668 257,914
* Other non-current assets exclude derivative financial asset.
NOTES TO THE FINANCIAL STATEMENTS

KS Energy Services Limited Annual Report 2009126
32 Segment reporting (cont’d)
Major customers
During the financial year ended 31 December 2009, the Group has two customers in the capital equipment segment that individually contributed 10% or more of the Group’s revenue. Revenues from these two customers represent $63,084,000 (2008: $39,243,000) and $51,649,000 (2008: $64,623,000) respectively of the Group’s total revenues.
33 New accounting standards and interpretations issued but not yet effective for the financial year ended 31 December 2009
The Group has not applied the following accounting standards (including their consequential amendments) and interpretations that have been issued as of the balance sheet date but are not yet effective:
Amendment to FRS 32 Financial Instruments: Presentation – Classification of Rights Issues
Amendments to FRS 39 Financial Instruments: Recognition and Measurement – Eligible Hedged Items
Amendments to FRS 102 Share-based Payment - Group Cash-settled Share-based Payment Transactions
FRS 103 (revised) Business Combinations and FRS 27 (revised) Separate and Consolidated Financial Statements
Improvements to FRSs 2009
INT FRS 117 Distributions of Non-Cash Assets to Owners
Improvements to FRSs 2009 will become effective for the Group’s financial statements for the year ending 31 December 2010 for amendments relating to:
FRS 102 Share-based Payments
FRS 38 Intangible Assets
INT FRS 109 Reassessment of Embedded Derivatives
INT FRS 116 Hedges of a Net Investment in a Foreign Operation
Improvements to FRSs 2009 will become effective for the Group’s financial statements for the year ending 31 December 2011 for amendments relating to:
FRS 1 Presentation of Financial Statements
FRS 7 Statement of Cash Flows
FRS 17 Leases
FRS 36 Impairment of Assets
FRS 39 Financial Instruments: Recognition and Measurement
FRS 105 Non-current Assets Held for Sale and Discontinued Operations
FRS 108 Operating Segments
NOTES TO THE FINANCIAL STATEMENTS

KS Energy Services Limited Annual Report 2009 127
33 New accounting standards and interpretations issued but not yet effective for the financial year ended 31 December 2009 (cont’d)
The amendment to FRS 32 on classification of rights issues will become effective for the Group’s financial statements for the year ending 31 December 2011. This amendment addresses the accounting for rights issues (rights, options and warrants) that are denominated in a currency other than the functional currency of the issuer. Previously, such rights issues were accounted for as derivative liabilities. The amendment requires that rights issues to acquire a fixed number of the entity’s own equity instruments for a fixed amount of any currency are equity instruments if the entity offers the rights, options or warrants pro rata to all of it existing owners of the same class of its own non-derivative equity instruments. This is regardless of the currency in which the exercise price is denominated. The Group is in the process of assessing the impact of this amendment.
The amendments to FRS 39 on eligible hedged items will become effective for the Group’s financial statements for the year ending 31 December 2010. The amendments, which clarify how the principles that determine whether a hedged risk or portion of cash flows is eligible for designation, should be applied in two particular situations: (i) the designation of a one-sided risk in a hedged item; and (ii) the designation of inflation in particular situations. The application of these amendments is not expected to have any significant impact on the Group’s financial statements.
The amendments to FRS 102 on group cash-settled share-based payment transactions will become effective for the Group’s financial statements for the year ending 31 December 2011. The amendments require an entity receiving goods or services in either an equity-settled or a cash-settled share-based payment transaction to account for the transaction in its separate or individual financial statements. The application of these amendments is not expected to have any significant impact on the Group’s financial statements.
FRS 103 (revised 2009) and FRS 27 (amended) will become effective for the Group’s financial statements for the year ending 31 December 2010. FRS 103 (revised 2009) introduces significant changes to the accounting for business combinations, both at the acquisition date and post acquisition, and requires greater use of fair values. The amendments will mainly impact the accounting for transaction costs, step acquisitions, goodwill and non-controlling interests (NCI)(previously minority interests). The revised FRS 103 will be applied prospectively and therefore there will be no impact on prior periods in the Group’s financial statements for the year ending 31 December 2010.
The amended FRS 27 requires accounting for changes in ownership interests by the Group in a subsidiary, while maintaining control, to be recognised as an equity transaction. When the Group loses control of a subsidiary, any interest retained in the former subsidiary will be measured at fair value with the gain or loss recognised in profit or loss. The amendments will be applied prospectively to transactions with NCI and therefore there will be no impact on prior periods in the Group’s financial statements for the year ending 31 December 2010.
Improvements to FRSs 2009 will become effective for the Group’s financial statements for the year ending 31 December 2010. Improvements to FRSs 2009 contain amendments to numerous accounting standards that result in accounting changes for presentation, recognition or measurement and disclosure purposes. The Group is in the process of assessing the impact of these amendments.
INT FRS 117 will become effective for the Group’s financial statements for the year ending 31 December 2010. INT FRS 117 prescribes the accounting treatment of distributions of non-cash assets by an entity to owners. It clarifies that such distribution should be measured at the fair value of the non-cash assets and the difference between the carrying amount and the fair value of non-cash assets to be distributed should be recognised in profit or loss. INT FRS 117 will be applied prospectively.
Other than the changes relating to FRS 103 and FRS 27, the initial application of these standards (including their consequential amendments) and interpretations is not expected to have any material impact on the Group’s financial statements. The Group has not considered the impact of accounting standards issued after the balance sheet date.
NOTES TO THE FINANCIAL STATEMENTS
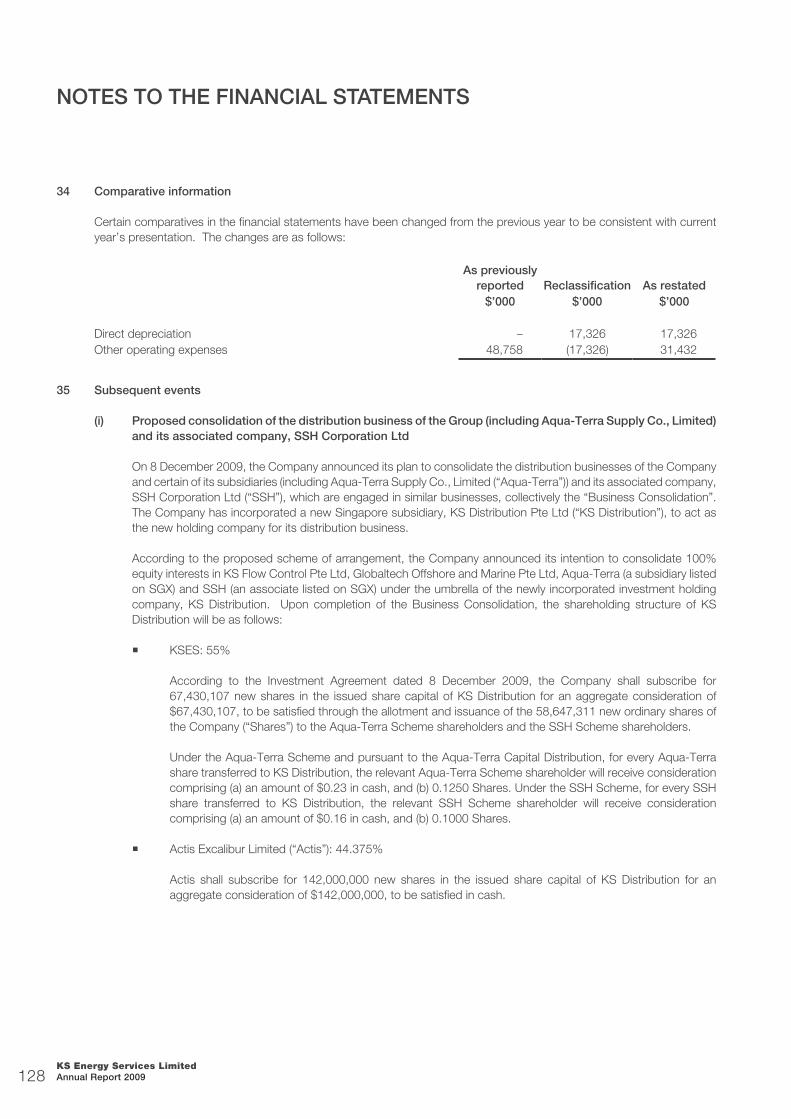
KS Energy Services Limited Annual Report 2009128
34 Comparative information
Certain comparatives in the financial statements have been changed from the previous year to be consistent with current year’s presentation. The changes are as follows:
As previously reported Reclassification As restated
$’000 $’000 $’000
Direct depreciation – 17,326 17,326Other operating expenses 48,758 (17,326) 31,432
35 Subsequent events
(i) Proposed consolidation of the distribution business of the Group (including Aqua-Terra Supply Co., Limited) and its associated company, SSH Corporation Ltd
On 8 December 2009, the Company announced its plan to consolidate the distribution businesses of the Company and certain of its subsidiaries (including Aqua-Terra Supply Co., Limited (“Aqua-Terra”)) and its associated company, SSH Corporation Ltd (“SSH”), which are engaged in similar businesses, collectively the “Business Consolidation”. The Company has incorporated a new Singapore subsidiary, KS Distribution Pte Ltd (“KS Distribution”), to act as the new holding company for its distribution business.
According to the proposed scheme of arrangement, the Company announced its intention to consolidate 100% equity interests in KS Flow Control Pte Ltd, Globaltech Offshore and Marine Pte Ltd, Aqua-Terra (a subsidiary listed on SGX) and SSH (an associate listed on SGX) under the umbrella of the newly incorporated investment holding company, KS Distribution. Upon completion of the Business Consolidation, the shareholding structure of KS Distribution will be as follows:
KSES: 55%
According to the Investment Agreement dated 8 December 2009, the Company shall subscribe for 67,430,107 new shares in the issued share capital of KS Distribution for an aggregate consideration of $67,430,107, to be satisfied through the allotment and issuance of the 58,647,311 new ordinary shares of the Company (“Shares”) to the Aqua-Terra Scheme shareholders and the SSH Scheme shareholders.
Under the Aqua-Terra Scheme and pursuant to the Aqua-Terra Capital Distribution, for every Aqua-Terra share transferred to KS Distribution, the relevant Aqua-Terra Scheme shareholder will receive consideration comprising (a) an amount of $0.23 in cash, and (b) 0.1250 Shares. Under the SSH Scheme, for every SSH share transferred to KS Distribution, the relevant SSH Scheme shareholder will receive consideration comprising (a) an amount of $0.16 in cash, and (b) 0.1000 Shares.
Actis Excalibur Limited (“Actis”): 44.375%
Actis shall subscribe for 142,000,000 new shares in the issued share capital of KS Distribution for an aggregate consideration of $142,000,000, to be satisfied in cash.
NOTES TO THE FINANCIAL STATEMENTS
KS Energy Services Limited Annual Report 2009 129
35 Subsequent events (cont’d)
(i) Proposed consolidation of the distribution business of the Group (including Aqua-Terra Supply Co., Limited) and its associated company, SSH Corporation Ltd (cont’d)
the proposed Chief Executive Officer (“CEO”) of KS Distribution: 0.625%.
The proposed CEO of KS Distribution, Koh Soo Keong, who is an Executive Director of the Company, will participate by subscribing for 2,000,000 new shares in the issued share capital of KS Distribution at a consideration of $2,000,000, to be satisfied in cash.
On 25 March 2010, the Company announced that it has received approvals from the shareholders of the Company, Aqua-Terra and SSH to consolidate the oil and gas and marine distribution and services business of the three companies. Subject to Court approval and other closing procedures, the Business Consolidation is expected to be completed in May 2010.
(ii) Proposed issue of new convertible bonds
On 25 January 2010, the Company entered into a purchase agreement (“Purchase Agreement”) with TAEL One Partners Ltd (“TAEL”) for the proposed issue of new convertible bonds to TAEL totalling $50 million of principal value (“New Convertible Bonds”), with an option to issue additional convertible bonds of up to $57 million of principal value to other investors (“Other Convertible Bonds”).
The New Convertible Bonds, which are issuable at an issue price of 89.34 per cent of the principal amount of the New Convertible Bonds, are due in 2015. Each New Convertible Bond will, at the option of the holder of the New Convertible Bond (“Bondholder”), be convertible (unless previously redeemed, converted or purchased and cancelled) into fully paid ordinary shares of the Company (“Shares”) at an initial conversion price of $1.60 per new Share (“Conversion Share”). The conversion price is subject to adjustment in the circumstances set out in the Conditions.
The issuance of the Other Convertible Bonds of $57 million is subject to the condition that the conversion price for any additional notes shall not be lower than $1.60 if issued within a four month period starting from the closing date of the $50 million placement.
On 17 February 2010, the Company received the in-principle approval of the SGX-ST for the listing and quotation of up to 31,250,000 new ordinary shares in the capital of the Company to be issued upon conversion of the New Convertible Bonds and such further conversion shares to be allotted and issued by the Company pursuant to any adjustments made to the conversion price of the New Convertible Bonds.
On 26 March 2010, the Company announced the successful closure of the issuance of the New Convertible Bonds.The Company utilised the net proceeds of $42.4 million for the purchase and cancellation of $36.8 million of the existing convertible notes (the “repurchased notes”). The repurchased notes were repurchased at a price equal to their par value plus accrued interest up to 26 March 2010.
NOTES TO THE FINANCIAL STATEMENTS

KS Energy Services Limited Annual Report 2009130
STATISTICS OF SHAREHOLDERSas at 19 March 2010
Share Capital : S$194,451,630No. of Shares : 336,682,535Class of Shares : Ordinary SharesVoting Rights : One Vote per share
DISTRIBUTION OF SHAREHOLDERS By SIZE OF SHAREHOLDINGS
SIZE OF HOLDINGSNO. OF
SHAREHOLDERS% OF
SHAREHOLDERSNO. OF
SHARES% OF
SHAREHOLDING
1 – 999 254 5.36 60,647 0.021,000 – 10,000 3,642 76.84 16,534,423 4.9110,001 – 1,000,000 831 17.53 31,109,326 9.241,000,001 and above 13 0.27 288,978,139 85.83TOTAL 4,740 100.00 336,682,535 100.00
SUBSTANTIAL SHAREHOLDERS(As shown in the Register of Substantial Shareholders as at 19 March 2010)
DIRECT INTEREST DEEMED INTERESTS
NO. NAMENO. OF SHARES
HELD % (1)
NO. OF SHARESHELD % (1)
1. PACIFIC ONE ENERGY LIMITED 131,310,691 39.002. DUBAI TRANSPORT COMPANY LLC 50,751,948 15.073. KIM SENG HOLDINGS PTE LTD 22,689,600 6.744. KRIS TAENAR WILUAN 131,310,691 (2) 39.005. RIJA HOLDINGS LIMITED 131,310,691 (2) 39.006. RICHARD JAMES WILUAN 131,310,691 (2) 39.007. ABDULLA MOHAMMED SALEH 50,751,948 (3) 15.078. AMSAF INVESTMENT LLC 50,751,948 (3) 15.079. AHMAD ABDULRAHIM BAKER 50,751,948 (3) 15.0710. TAN KIM SENG 22,689,600 (4) 6.7411. TAN HOO LANG 22,689,600 (4) 6.7412. TAN FUH GIH 22,689,600 (4) 6.7413. TAN WEI MIN 22,689,600 (4) 6.74
Notes:(1) Based on 336,682,535 issued shares (excluding treasury shares) as at 19 March 2010.(2) Mr. Kris Taenar Wiluan, Rija Holdings Limited and Mr. Richard James Wiluan are deemed interested in the 131,310,691
shares held by Pacific One Energy Limited.(3) Mr. Abdulla Mohammed Saleh, AMSAF Investment LLC and Mr. Ahmad Abdulrahim Baker are deemed interested in the
50,751,948 shares held by Dubai Transport Company LLC.(4) Mr. Tan Kim Seng, Mr. Tan Hoo Lang, Mr. Tan Fuh Gih and Mr. Tan Wei Min are deemed interested in the 22,689,600
shares held by Kim Seng Holdings Pte Ltd.

KS Energy Services Limited Annual Report 2009 131
STATISTICS OF SHAREHOLDERSas at 19 March 2010
LIST OF 20 LARGEST SHAREHOLDERS (As shown in the Depository Register as at 19 March 2010)
NAME OF SHAREHOLDERNO. OF
SHARES% OF
SHARES
1 PACIFIC ONE ENERGY LIMITED 131,310,691 39.002 DUBAI TRANSPORT COMPANY LLC 50,751,948 15.073 CITIBANK NOMINEES SINGAPORE PTE LTD 33,250,276 9.884 KIM SENG HOLDINGS PTE LTD 22,689,600 6.745 RAFFLES NOMINEES PTE LTD 14,785,478 4.396 UNITED OVERSEAS BANK NOMINEES (PRIVATE) LIMITED 13,271,276 3.947 DBS NOMINEES PTE LTD 7,611,336 2.268 HSBC (SINGAPORE) NOMINEES PTE LTD 7,098,800 2.119 SUNFIELD PTE LTD 2,500,000 0.7410 KWAN CHEE SENG 1,849,000 0.5511 KIM ENG SECURITIES PTE LTD 1,679,000 0.5012 PHILLIP SECURITIES PTE LTD 1,146,254 0.3413 UOB KAY HIAN PTE LTD 1,034,480 0.3114 DBSN SERVICES PTE LTD 976,615 0.2915 DBS VICKERS SECURITIES (SINGAPORE) PTE LTD 964,912 0.2916 SIM YONG TENG 921,000 0.2717 OCBC NOMINEES SINGAPORE 714,072 0.2118 OCBC SECURITIES PRIVATE LTD 658,267 0.2019 LUHUT BINSAR PANDJAITAN 359,000 0.1120 LEW MEOW FAH 341,000 0.10
TOTAL: 293,913,005 87.30
TREASURy SHARES
Ordinary Shares held in Treasury (“Treasury Shares”) as at 19 March 2010: 11,308,000Voting Rights – NoneSole Shareholder of 11,308,000 Treasury Shares: KS Energy Services LimitedPercentage of this holding against the total number of issued shares excluding Treasury Shares: 3.36%
COMPLIANCE WITH RULE 723 OF THE SGX-ST LISTING MANUAL
Based on information available and to the best knowledge of the Company as at 19 March 2010, approximately 39.19% of the ordinary shares of the Company are held by the public. The Company is therefore in compliance with Rule 723 of the SGX-ST Listing Manual.

KS Energy Services Limited Annual Report 2009132
DISTRIBUTION OF WARRANTHOLDINGS (W110805)
No. of Warrants : 84,170,634Conversion : 1 Warrant convertible to 1 Ordinary ShareExercise Period : 6 February 2010 to 5 August 2011Exercise Price : $1.40 per share
SIZE OF HOLDINGSNO. OF
WARRANTHOLDERS% OF
WARRANTHOLDERSNO. OF
WARRANTS% OF
WARRANTHOLDING
1 – 999 51 3.70 23,241 0.031,000 – 10,000 1,104 80.17 4,262,217 5.0610,001 – 1,000,000 216 15.69 16,853,669 20.021,000,001 and above 6 0.44 63,031,507 74.89TOTAL 1,377 100.00 84,170,634 100.00
SUBSTANTIAL WARRANTHOLDERS(As shown in the Register of Substantial Warrantholders as at 19 March 2010)
DIRECT INTEREST DEEMED INTERESTS
NO. NAMENO. OF SHARES
HELD % (1)
NO. OF SHARESHELD % (1)
1. PACIFIC ONE ENERGY LIMITED 32,827,672 39.002. DUBAI TRANSPORT COMPANY LLC 12,687,987 15.073. KIM SENG HOLDINGS PTE LTD 5,672,400 6.744. KRIS TAENAR WILUAN 32,827,672 (2) 39.005. RIJA HOLDINGS LIMITED 32,827,672 (2) 39.006. RICHARD JAMES WILUAN 32,827,672 (2) 39.007. ABDULLA MOHAMMED SALEH 12,687,987 (3) 15.078. AMSAF INVESTMENT LLC 12,687,987 (3) 15.079. AHMAD ABDULRAHIM BAKER 12,687,987 (3) 15.07
10. TAN KIM SENG 5,672,400 (4) 6.7411. TAN HOO LANG 5,672,400 (4) 6.7412. TAN FUH GIH 5,672,400 (4) 6.7413. TAN WEI MIN 5,672,400 (4) 6.74
Notes:(1) Based on 84,170,634 issued warrants as at 6 August 2009.(2) Mr. Kris Taenar Wiluan, Rija Holdings Limited and Mr. Richard James Wiluan are deemed interested in the 32,827,672
warrants held by Pacific One Energy Limited.(3) Mr. Abdulla Mohammed Saleh, AMSAF Investment LLC and Mr. Ahmad Abdulrahim Baker are deemed interested in the
12,687,987 warrants held by Dubai Transport Company LLC.(4) Mr. Tan Kim Seng, Mr. Tan Hoo Lang, Mr. Tan Fuh Gih and Mr. Tan Wei Min are deemed interested in the 5,672,400
warrants held by Kim Seng Holdings Pte Ltd.
STATISTICS OF WARRANTHOLDINGSas at 19 March 2010

KS Energy Services Limited Annual Report 2009 133
LIST OF 20 LARGEST WARRANTHOLDERS (W110805) (As shown in the Depository Register as at 19 March 2010)
NAME OF WARRANTHOLDERNO. OF
WARRANTS% OF
WARRANTS
1 PACIFIC ONE ENERGY LIMITED 32,827,672 39.002 DUBAI TRANSPORT COMPANY LLC 12,687,987 15.073 CITIBANK NOMINEES SINGAPORE PTE LTD 7,630,748 9.074 KIM SENG HOLDINGS PTE LTD 5,672,400 6.745 PHILLIP SECURITIES PTE LTD 2,746,000 3.266 HSBC (SINGAPORE) NOMINEES PTE LTD 1,466,700 1.747 UOB KAY HIAN PTE LTD 659,620 0.788 KIM ENG SECURITIES PTE LTD 658,000 0.789 RAFFLES NOMINEES PTE LTD 651,500 0.7710 TAN KOK LENG 647,000 0.7711 DBS NOMINEES PTE LTD 645,950 0.7712 SUNFIELD PTE LTD 625,000 0.7413 SIM YONG TENG 400,000 0.4814 TAN SIAH HWEE 400,000 0.4815 OCBC SECURITIES PRIVATE LIMITED 356,500 0.4216 TAN HUI TECK 350,000 0.4217 WONG LOY HING 329,000 0.3918 CHENG WA SING 320,000 0.3819 NG KOK POH 320,000 0.3820 LEOW SUN HUAT 275,000 0.33
TOTAL: 69,669,077 82.77
STATISTICS OF WARRANTHOLDERSas at 19 March 2010

KS Energy Services Limited Annual Report 2009134
NOTICE OF ANNUAL GENERAL MEETING
NOTICE IS HEREBY GIVEN that the Annual General Meeting of KS ENERGy SERVICES LIMITED (“the Company”) will be held at 19 Jurong Port Road, Singapore 619093 on Wednesday, 28 April 2010 at 2.00 pm for the purpose of transacting the following businesses:
ORDINARy BUSINESS
1. To receive and adopt the Directors’ Report and the Audited Financial Statements of the Company for the financial year ended 31 December 2009 together with the Auditors’ Report thereon. (Resolution 1)
2. To re-elect the following Directors retiring pursuant to Article 91 and 97 of the Company’s Articles of Association and who
have offered themselves for re-election: Mr Kris Taenar Wiluan (Retiring under Article 91) (Resolution 2) Mr Lee Beng Cheng (Retiring under Article 91) (Resolution 3) Mr Abdulla Mohammed Saleh (Retiring under Article 97) (Resolution 4)
Mr Lee Beng Cheng will upon re-election as Director of the Company, remain as Chairman of the Remuneration Committee and member of the Audit and Nominating Committee and will be considered independent for the purposes of Rule 704(8) of the Listing Manual of the Singapore Exchange Securities Trading Limited.
3. To approve the payment of Directors’ fees of S$273,000 for the year ended 31 December 2009 (FY2008: S$254,000). (Resolution 5)
4. To re-appoint KPMG LLP as the Company’s Auditors and to authorise the Directors to fix their remuneration. (Resolution 6)
5. To transact any other ordinary business which may properly be transacted at an Annual General Meeting.
SPECIAL BUSINESS
To consider and if thought fit, to pass the following resolutions as Ordinary Resolutions, with or without any modifications:
6. General Share Issue Mandate
That pursuant to Section 161 of the Companies Act, Cap. 50, Rule 806 of the Listing Manual of the Singapore Exchange Securities Trading Limited (“SGX”) and the measures introduced by SGX to facilitate fund raising dated 19 February 2009, authority be given to the Directors of the Company to issue shares (“Shares”) whether by way of rights, bonus or otherwise, and/or make or grant offers, agreements or options (collectively, “Instruments”) that might or would require Shares to be issued, including but not limited to the creation and issue of (as well as adjustments to) warrants, debentures or other instruments convertible into Shares at any time and upon such terms and conditions and to such persons as the Directors may, in their absolute discretion, deem fit provided that:
(a) the aggregate number of Shares (including Shares to be issued in pursuance of Instruments made or granted pursuant to this Resolution) does not exceed fifty per centum (50%) of the total number of issued shares (excluding treasury shares) in the capital of the Company at the time of the passing of this Resolution, of which the aggregate number of Shares and convertible securities to be issued other than on a pro rata basis to all shareholders of the Company shall not exceed twenty per centum (20%) of the total number of issued shares (excluding treasury shares) in the capital of the Company;
(b) for the purpose of determining the aggregate number of Shares that may be issued under sub-paragraph (a) above, the total number of issued shares (excluding treasury shares) shall be based on the total number of issued shares (excluding treasury shares) of the Company as at the date of the passing of this Resolution, after adjusting for:
KS Energy Services Limited Annual Report 2009 135
NOTICE OF ANNUAL GENERAL MEETING
(i) new shares arising from the conversion or exercise of convertible securities;(ii) new shares arising from exercising share options or vesting of Share awards outstanding or subsisting at
the time this Resolution is passed; and(iii) any subsequent bonus issue, consolidation or subdivision of shares
(c) And that such authority shall, unless revoked or varied by the Company in general meeting, continue in force (i) until the conclusion of the Company’s next Annual General Meeting or the date by which the next Annual General Meeting of the Company is required by law to be held, whichever is earlier or (ii) in the case of shares to be issued in accordance with the terms of convertible securities issued, made or granted pursuant to this Resolution, until the issuance of such shares in accordance with the terms of such convertible securities.
(d) the fifty per centum (50%) limit in sub-paragraph (a) above may be increased to one hundred per centum (100%) for issues of Shares and/or Instruments by way of a renounceable rights issue where shareholders of the Company are entitled to participate in the same on a pro-rata basis.
[See Explanatory Note (i)] (Resolution 7)
7. DISCOUNT FOR NON PRO-RATA SHARE ISSUE
(a) That subject to and conditional upon the passing of Ordinary Resolution 7 above, approval be and is hereby given to the Directors of the Company at any time to issue Shares (other than on a pro-rata basis to shareholders of the Company) at an issue price for each Share which shall be determined by the Directors of the Company in their absolute discretion provided that such price shall not represent a discount of more than twenty per centum (20%) to the weighted average price of a Share for trades done on the SGX-ST (as determined in accordance with the requirements of SGX-ST); and
(b) That (unless revoked or varied by the Company in general meeting) the authority conferred by this Resolution shall continue in force until the conclusion of the next annual general meeting of the Company or the date by which the next annual general meeting of the Company is required by law to be held, whichever is the earlier.
[See Explanatory Note (ii)] (Resolution 8)
8. SHARE ISSUE MANDATE UNDER THE KS ENERGy EMPLOyEE SHARE OPTION SCHEME AND KS ENERGy PERFORMANCE SHARE PLAN
That pursuant to Section 161 of the Companies’ Act, Cap. 50, authority be and is hereby given to the Directors of the Company to allot and issue from time to time such number of shares in the Company as may be required to be issued pursuant to the exercise of options under the KS Energy Employee Share Option Scheme and/or such number of fully paid shares in the Company as may be required to be issued pursuant to the vesting of awards under the KS Energy Performance Share Plan provided that the aggregate number of shares to be issued pursuant to the options granted under the KS Energy Employee Share Option Scheme and the vesting of awards granted or to be granted under the KS Energy Performance Share Plan shall not exceed fifteen per cent. (15%) of the total number of issued shares (excluding treasury shares) in the capital of the Company from time to time.
[See Explanatory Note (iii)] (Resolution 9)
By Order of the Board
Shirley Lim / Busarakham KohsikapornSecretariesSingapore, 12 April 2010
KS Energy Services Limited Annual Report 2009136
Explanatory Notes on Resolutions to be passed:
(i) Ordinary Resolution 7 proposed in item 6 above, if passed, will empower the Directors from the date of the above Meeting until the date of the next Annual General Meeting, to allot and issue Shares and convertible securities in the Company up to an amount not exceeding 50% of the total number of issued shares (excluding treasury shares) in the capital of the Company, of which up to 20% may be issued other than on a pro rata basis.
This increased limit of up to 100% (referred to in sub-paragraph (d)) for renounceable pro-rata rights issue will be effective up to 31 December 2010 pursuant to SGX-ST’s news release of 19 February 2009. The increased limit is subject to the condition that the Company makes periodic announcements on the use of the proceeds as and when the funds are materially disbursed and, provides a status report on the use of proceeds in the annual report.
(ii) Ordinary Resolution 8 proposed in item 7 above, if passed, will enable Directors to issue new Shares on a non pro-rata basis, at a discount of not more than 20% to the weighted average market price of the Company’s shares, determined in accordance with the requirements of SGX-ST. The discount in issue price of non pro-rata new Share issue is one of the interim measures announced by the SGX to accelerate and facilitate the Company’s fund-raising efforts in a volatile and difficult market condition.
(iii) Ordinary Resolution 9 proposed in item 8 above, if passed, will empower the Directors of the Company, to allot and issue shares pursuant to the exercise of options outstanding under the KS Energy Employee Share Option Scheme (“ESOS”) and/or the vesting of awards granted pursuant to the KS Energy Performance Share Plan (“PSP”), provided that the aggregate number of shares to be issued pursuant to the KS Energy ESOS and the KS Energy PSP does not exceed fifteen per cent. (15%) of the total number of shares (excluding treasury shares) in the capital of the Company from time to time.
Notes:
1. A Member entitled to attend and vote at the Annual General Meeting (the “Meeting”) is entitled to appoint a proxy to attend and vote in his/her stead. A proxy need not be a Member of the Company.
2. If the appointor is a corporation, the instrument appointing a proxy must be executed under seal or the hand of its duly authorised officer or attorney.
3. The instrument appointing a proxy must be deposited at the Registered Office of the Company at 19 Jurong Port Road
Singapore 619093 not less than forty-eight (48) hours before the time appointed for holding the Meeting.
NOTICE OF ANNUAL GENERAL MEETING

KS ENERGy SERVICES LIMITED(Incorporated In the Republic of Singapore with limited liability)(Company Registration No: 198300104G)
PROXy FORM(Please see notes overleaf before completing this Form)
*I/We, ________________________________________________________________________________________________________
of ___________________________________________________________________________________________________________
being a member/members of KS ENERGy SERVICES LIMITED (the “Company”), hereby appoint:
Name NRIC/Passport No. Proportion of Shareholdings
No. of Shares %
Address
and/or (delete as appropriate)
Name NRIC/Passport No. Proportion of Shareholdings
No. of Shares %
Address
or failing *him/her, the Chairman of the Meeting as *my/our *proxy/proxies to vote for *me/us on *my/our behalf at the Annual General Meeting (the “Meeting”) of the Company to be held at 19 Jurong Port Road Singapore 619093 on Thursday, 28 April 2010 at 2.00 pm and at any adjournment thereof. *I/We direct *my/our *proxy/proxies to vote for or against the Resolutions proposed at the Meeting as indicated hereunder. If no specific direction as to voting is given or in the event of any other matter arising at the Meeting and at any adjournment thereof, the *proxy/proxies will vote or abstain from voting at *his/her discretion. The authority herein includes the right to demand or to join in demanding a poll and to vote on a poll.
(Please indicate your vote “For” or “Against” with a tick [] within the box provided)
No. Resolutions relating to: For Against
1 Directors’ Report and the Audited Financial Statements of the Company for the financial year ended 31 December 2009 together with the Auditors’ Report
2 Re-election of Mr Kris Taener Wiluan as a Director
3 Re-election of Mr Lee Beng Cheng as a Director
4 Re-election of Mr Abdulla Mohammed Saleh as a Director
5 Approval of Directors’ fees of S$273,000
6 Re-appointment of KPMG LLP as Auditors
7 General Share Issue Mandate
8 Discount for Non-Pro Rata Share Issue
9 Share Issue Mandate under the KS Energy ESOS and KS Energy PSP
*Delete where inapplicable
Dated this ______________ day of ________________ 2010
Total number of Shares in: No. of Shares
(a) CDP Register
(b) Register of Members____________________________________________Signature of Shareholder(s)/and, Common Seal of Corporate Shareholder
IMPORTANT:1. For investors who have used their CPF monies to buy KS
Energy Services Limited’s shares, this Report is forwarded to them at the request of the CPF Approved Nominees and is sent solely FOR INFORMATION ONLY.
2. This Proxy Form is not valid for use by CPF investors and shall be ineffective for all intents and purposes if used or purported to be used by them.
3. CPF investors who wish to vote should contact their CPF Approved Nominees.

Notes:
1. Please insert the total number of Shares held by you. If you have Shares entered against your name in the Depository Register (as defined in Section 130A of the Companies Act, Chapter 50 of Singapore), you should insert that number of Shares. If you have Shares registered in your name in the Register of Members, you should insert that number of Shares. If you have Shares entered against your name in the Depository Register and Shares registered in your name in the Register of Members, you should insert the aggregate number of Shares entered against your name in the Depository Register and registered in your name in the Register of Members. If no number is inserted, the instrument appointing a proxy or proxies shall be deemed to relate to all the Shares held by you.
2. A member of the Company entitled to attend and vote at a meeting of the Company is entitled to appoint one or two proxies to attend and vote in his/her stead. A proxy need not be a member of the Company.
3. Where a member appoints two proxies, the appointments shall be invalid unless he/she specifies the proportion of his/her shareholding (expressed as a percentage of the whole) to be represented by each proxy.
4. The instrument appointing a proxy or proxies must be deposited at the registered office of the Company at 19 Jurong Port Road Singapore 619093 not less than 48 hours before the time appointed for the Meeting.
5. The instrument appointing a proxy or proxies must be under the hand of the appointor or of his attorney duly authorised in writing. Where the instrument appointing a proxy or proxies is executed by a corporation, it must be executed either under its seal or under the hand of an officer or attorney duly authorised. Where the instrument appointing a proxy or proxies is executed by an attorney on behalf of the appointor, the letter or power of attorney or a duly certified copy thereof must be lodged with the instrument.
6. A corporation which is a member may authorise by resolution of its directors or other governing body such person as it thinks fit to act as its representative at the Meeting, in accordance with Section 179 of the Companies Act, Chapter 50 of Singapore.
General:
The Company shall be entitled to reject the instrument appointing a proxy or proxies if it is incomplete, improperly completed or illegible or where the true intentions of the appointor are not ascertainable from the instructions of the appointor specified in the instrument appointing a proxy or proxies. In addition, in the case of Shares entered in the Depository Register, the Company may reject any instrument appointing a proxy or proxies lodged if the member, being the appointor, is not shown to have Shares entered against his name in the Depository Register as at 48 hours before the time appointed for holding the Meeting, as certified by The Central Depository (Pte) Limited to the Company.
The Company SecretaryKS ENERGy SERVICES LIMITED
19 Jurong Port RoadSingapore 619093
AFFIXSTAMP

No 19 Jurong Port RoadSingapore 619093Tel: +65 6577 4600Fax: +65 6577 4618
Email: [email protected]: www.ksenergy.com.sg
Co. Reg. No. 198300104G