
Experimental and numerical study of the separation angle ...

HEFAT2012
9th
International Conference on Heat Transfer, Fluid Mechanics and Thermodynamics
16 – 18 July 2012
Malta
AN EXPERIMENTAL STUDY OF SWEEP ANGLE EFFECTS ON THE
TRANSITION POINT ON A 2D WING BY USING HOT-FILM SENSOR Soltani M.R. and Davari A.R. and Hassanzadeh khakmardani M.*, M.Masdari
*Author for correspondence
Department of Aerospace Engineering,
Sharif University of Technology
Tehran,
Iran,
E-mail: [email protected]
ABSTRACT
Location of transition point over a 2-D swept wing
was investigated. A series of wind tunnel tests were
performed to predict the transition location over
three models of swept wing having same aspect
ratio, and at various angles of attack and sweep
angles by hot-film anemometer. Two flat plates were
used at the ends of the models to prevent the flow to
roll up and to reduce the boundary layer effect of the
test section on the models, but the flow field on the
model was still 3D because of the swept angle
effects that led to formation of cross flow over the
wing surface. Due to the complexity of the
calibration of the hot film sensors, as well as various
sources of errors in the calibration process, the hot
film sensors were not calibrated and their signal is
qualitatively investigated.
Data obtained from the hot film sensor signal
indicates that as the swept angle increases, the
position of transition moves toward the leading edge
of the wing due to strengthening of the cross flow
about the leading edge, and transition occurs at a
smaller angle of attack. Increasing the angle of attack
also moved the position of transition point closer to
the leading edge of the wing. The transition line is
approximately parallel to the x/c local line which
may indicate that the strength of cross flow is nearly
constant on each line parallel to the c/4 local line.
NOMENCLATURE [-] Sweep angle
[-] Angle of attack
b [m] Wing span
x [m] Length in chordwise direction y [m] Length in spanwise direction
c [m] Wing local chord
Subscripts
SD Standard deviation
Sk skewness
INTRODUCTION
Swept wings have been used in many airplanes at
different flight regimes. One advantage of these
wings is that they produce no significant increase in
the drag force. Aerodynamic study of wings having
swept angle in subsonic flow has special importance
due to obligation to pass to this flow on landing and
takeoff phase. Swept wing at high speed airflow has
not sufficient time to react so simply and directly the
flow is moving front to back over the wing, but at
low speeds airflow has opportunity to react and
compress in the spanwise direction by swept leading
edge toward the wing tip. The airflow at the wing
tips moves along the wing rather than moving over
it, that will introduce spanwise flow. Lift of wing is
produced by the air flow passing over it. With
increase of spanwise flow, boundary layer on the
wing is thicker and transition to turbulence or flow
separation on the wing are more likely to happen.
The aspect ratio of the wing decreases and with air
leakage around the wing tip its effectiveness
decreases. The spanwise flow increases toward the
wing tip; therefore the lift at the wing tip drops
earlier than that at the wing root.
Swept wing boundary layer has 4 major instability
modes; attachment line instability, stream wise
instability, spanwise instability and finally
centrifugal mode. These modes, either alone or in
combination, affect the transition on the swept wing.
Leading edge instabilities can be controlled by
controlling the radius of the leading edge. In models
having the low leading edge radiuses, this mode of
instability, leading edges is not dominated. Cross
flow instability is the main transition mechanism for
the swept wings. When the free flow get to the
1068

leading edge streamlines bends out because of swept
angle and suddenly its pressure decreases. The
Streamlines then curved inward and moved along the
chord wise direction to reach the lowest pressure.
Finally, near the leading edge they bend in because
of increasing the pressure again. Cross flow
instability may appear to be stationary or traveling
waves. Stationary cross flow disturbances
dependence on the surface roughness and appear in
the low turbulence environment. Travelling
disturbances of cross flow is not associated with
surface roughness, but it is influenced by the free
flow turbulence and appears in the high turbulence
environments.
EXPERIMENTAL APPARATUS
All experiments were conducted in a subsonic wind
tunnel of closed return type with a test section size of 32008080 cm , operating at speeds ranging from
10 to 100m/s. The inlet of the tunnel has a 7:1
contraction ratio with four large anti-turbulence
screens and a honeycomb in its settling chamber to
reduce tunnel turbulence to less than 0.1% in the test
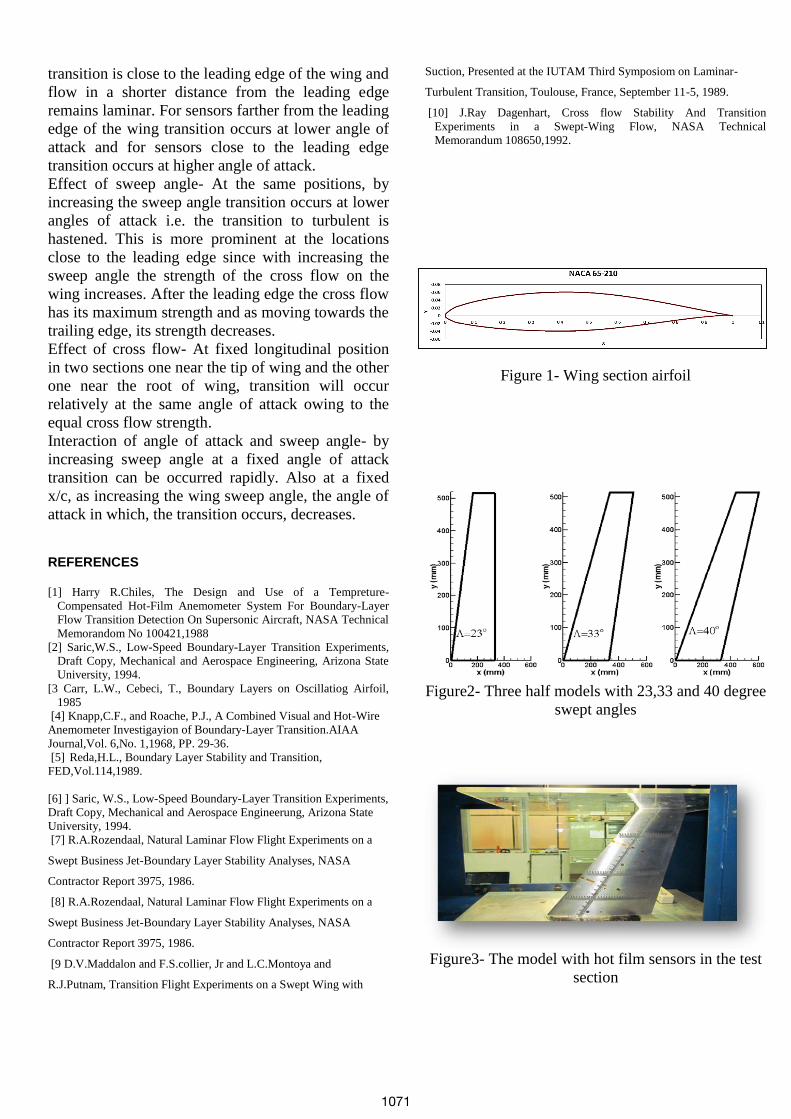
section. The models used in these tests are the scaled
models of a tapered wing whose sections similar to
the NACA 6 series airfoils (see figure1). A half
model is designed and fabricated to achieve higher
Reynolds numbers during the tests. Two flat plates
are used at the tip and root of the models to reduce
the boundary layer effect of the test section and
trailing edge vortices on the models. The baseline
configuration is a semi- span, 1:2.5 scale model of
the actual wing. The models have different sweep
angles of 23, 33 and 40 degree with the same aspect
ratio and a span of 516 mm (see figure 2).
For experimental study of boundary layer transition,
ten hot film sensors were used. The hot film system
used constant temperature hot film anemometer. The
frequency modulation for recording hot film data had
a frequency response of 10 KHz. The hot film
sensors were mounted with 30 degree relative to
each other to prevent their wake effects on each
other (see figure3).
RESULTS AND DISCUSSION
Duo to interference effects of sweep angle, stream
wise and spanwise instabilities, and interference
effects related to three dimensional flows on the
wing not can be used a general process to determine
the position of transition. The sudden increase in
voltage level that is associated with increased
fluctuation could represent the beginning or the
occurrence of transition. Voltage level in turbulent
flow reduced relatively in compared with the
transition mode. but duo to the random nature of
turbulent flow that tends to happen random
phenomenon, any random phenomenon that occur in
flow such as formation of travelling vortices or
breaking them into small vortices, can increase the
amount of fluctuation in the signal received from a
hot film sensors. By qualitative study of voltage
versus time the point of transition can be roughly
estimated. Increasing the voltage level associated
with the hot film sensor performance represents an
increase in the velocity and heat transfer rate in flow.
Since here not calibrated hot film sensors, for proper
comparison between data, graphs are drown in such
a way that the hot film sensor signals at different
locations and different angles of attack could be
compared with each other.
Error sources involve the error of the sensors and the
error due to the measurement method. Error of
measurement method is not important because data
analyses are qualitative, sensors are not calibrated.
To confirm the diagnosis of transition location of
boundary layer at different angles of attack,
statistical information output from the hot film
sensors are also to be used. - Standard deviation: represents diffusion of values
around the mean value.
- Skewness: represents the asymmetry of the
potential distribution.
For a perfectly symmetrical distribution, the value of
skewness is zero. For an asymmetric distribution
elongated toward higher values skewness is positive,
and for asymmetric distribution elongated toward
small amounts skewness is negative.
For each of the analysis, in this paper, only the data
of a few sensors are analyzed. The sensors are
selected in such a way the various effects such as
wing swept angle, angle of attack, etc. can be
distinguished. As the top of each graph, a schematic
of the wing along with location of ten sensors are
showed. The sensor under consideration is the one
with dark circle.
From Fig.4 it can be seen that with increasing the
angle of attack, voltage level and fluctuation of the
S1 sensor, dark circle, shown on the wing surface at
the top of Fig.4a, gradually increase up to 4 degrees
angle of attack.
1069

With increasing angle of attack to 5 degree, voltage
level almost remained constant. Fluctuation level has
been increased significantly at 6 degree angle of
attack that is an indication of the transition onset in
the flow. At 7 and 8 degree angles of attack with
increasing the fluctuation and dropping the output
voltage, the turbulent flow seems to be fully
established, Fig. 4a.
A remarkable difference in voltage level between
angles of attack -2,0 and 2 degree, can be observed
in this figure, Fig.4a. This difference in the voltage
level gradually decreases with increasing the angle
of attack. Sensor 5 is located at a farther position
relative to wing leading edge (see figure 5).
The sudden increase in the voltage level between
angels of attack of -2 and 0 degrees is not evident.
Cross flow at the leading edge has the highest
strength and as moving it towards the trailing edge,
the cross flow strength decreases. Effect of cross
flow at -2 degree angle of attack is dominant. This
sudden increase in the voltage level from -2 to 0
degrees angles of attack which gradually decreases
with increasing the angle of attack can be attributed
to the strengthening of cross flow mode.
Frome figures 5 it is seen that for the S5 sensor at 1
degree angle of attack, voltage level and fluctuation
has been increased which may indicate the occurance
of transition. Occurrence of transition at lower angle
of attack is logical because the sensor is located far
away from the leading edge. Thus comparing figures
4a and 5a, with increasing the angle of attack
transition position occurs closer to the leading edge
of the wing.
Figures 6a Shows that by increasing the angle of
attack fluctuation gradually increases and the
transition occurs at 6 degree angle of attack for
sensor 6, the S6. Comparing figures 4a and 6a
similar trend is observed, because both sensors are
almost located at a same location relative to the local
chord, near the leading edge.
Cross flow strength almost remains constant during
the local chord line. It can cause the same transition
line within the local chord of the wing. On the chart
of sensor 6, Fig. 6a, a voltage level difference
between -2 degree angle of attack and positive
angels is evident, that can associated with the
dominance of the cross flow mode at -2 degree angle
of attack.
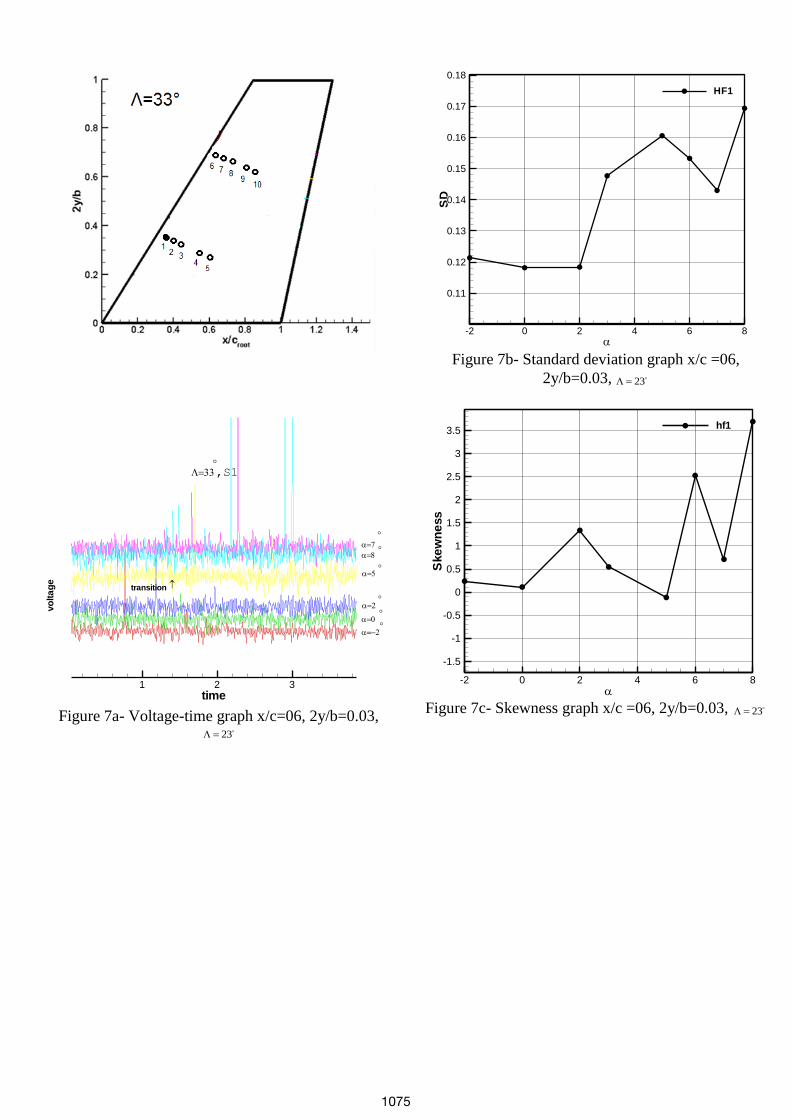
Data of sensor 1 for the swept angle of 33 degree is
shown in figure 7. It is seen that by away from the
leading edge an increase in the voltage level between
-2 degree angle of attack and positive angles is not
apparent. It can be seen that the fluctuation of -2, 0
and 2 degree angles of attack is almost constant and
with increasing the angle of attack to 5 degrees, the
fluctuation increases. Too thus the 5 degrees angle of
attack the flow transition is observed to be initiated.
At 8 degree angle of attack voltage level slightly
reduces that shows turbulence in the flow, figure 7a-
c.
For the largest wing swept angle, 40 , the data
of sensor number 1 is analysed, figure 8. It is seen
that for this sensor the voltage level gradually
increased with increasing the angle of attack, but at 4
degrees angle of attack a sudden rise in the voltage
level and in the fluctuation is occurred. Between 4 to
6 degrees angles of attack the voltage gradually
increases with increasing the angle of attack and at 7
degrees angle of attack the voltage remains almost
constant. Thus at 4 degrees angle of attack can be
considered as the transition angle of attack for his
wing at this situation. Voltage level slightly
decreases by increasing angle of attack to 8 degree
that can be shown flow transition. The striking
differences in the voltage level between positive and
negative angles of attack can be linked to the
dominant cross flow mode at negative angles where
the strength of this mode gradually decreases with
increasing angle of attack to positive ones.
Comparing figures 4a,7a and 8a it can be seen that
all of the cases have same location relative to the
leading edge. It further can be seen that the transition
for wings with 23, 33 and 40 sweep angles occurs
respectively at angles of attack of 6, 5, 4 degrees. It
shows that increasing the sweep angle reduces tnan
angle of attack at which transition occurs. This is due
to the dimensional effects of the flow.
CONCLUSION
Experiments were conducted to study qualitative
analysis of the transition phenomenon and the effects
of swept angle and angle of attack on its location.
Tests were conducted at a constant speed 50 m/s and
on that range between -2 to 0 degrees angles of
attack. The angle of attack range was chosen such
that the cross flow strength at different conditions
could be examined.
The following results include the effects of sweep
angle and angle of attack on the transition location of
the two dimensional swept wing.
Effect of angle of attack- Generally by increasing the
angle of attack, position of sensor which sense the
1070
transition is close to the leading edge of the wing and
flow in a shorter distance from the leading edge
remains laminar. For sensors farther from the leading
edge of the wing transition occurs at lower angle of
attack and for sensors close to the leading edge
transition occurs at higher angle of attack.
Effect of sweep angle- At the same positions, by
increasing the sweep angle transition occurs at lower
angles of attack i.e. the transition to turbulent is
hastened. This is more prominent at the locations
close to the leading edge since with increasing the
sweep angle the strength of the cross flow on the
wing increases. After the leading edge the cross flow
has its maximum strength and as moving towards the
trailing edge, its strength decreases.
Effect of cross flow- At fixed longitudinal position
in two sections one near the tip of wing and the other
one near the root of wing, transition will occur
relatively at the same angle of attack owing to the
equal cross flow strength.
Interaction of angle of attack and sweep angle- by
increasing sweep angle at a fixed angle of attack
transition can be occurred rapidly. Also at a fixed
x/c, as increasing the wing sweep angle, the angle of
attack in which, the transition occurs, decreases.
REFERENCES [1] Harry R.Chiles, The Design and Use of a Tempreture-
Compensated Hot-Film Anemometer System For Boundary-Layer
Flow Transition Detection On Supersonic Aircraft, NASA Technical
Memorandom No 100421,1988
[2] Saric,W.S., Low-Speed Boundary-Layer Transition Experiments,
Draft Copy, Mechanical and Aerospace Engineering, Arizona State
University, 1994.
[3 Carr, L.W., Cebeci, T., Boundary Layers on Oscillatiog Airfoil,
1985
[4] Knapp,C.F., and Roache, P.J., A Combined Visual and Hot-Wire
Anemometer Investigayion of Boundary-Layer Transition.AIAA
Journal,Vol. 6,No. 1,1968, PP. 29-36.
[5] Reda,H.L., Boundary Layer Stability and Transition,
FED,Vol.114,1989.
[6] ] Saric, W.S., Low-Speed Boundary-Layer Transition Experiments,
Draft Copy, Mechanical and Aerospace Engineerung, Arizona State
University, 1994.
[7] R.A.Rozendaal, Natural Laminar Flow Flight Experiments on a
Swept Business Jet-Boundary Layer Stability Analyses, NASA
Contractor Report 3975, 1986.
[8] R.A.Rozendaal, Natural Laminar Flow Flight Experiments on a
Swept Business Jet-Boundary Layer Stability Analyses, NASA
Contractor Report 3975, 1986.
[9 D.V.Maddalon and F.S.collier, Jr and L.C.Montoya and
R.J.Putnam, Transition Flight Experiments on a Swept Wing with
Suction, Presented at the IUTAM Third Symposiom on Laminar-
Turbulent Transition, Toulouse, France, September 11-5, 1989.
[10] J.Ray Dagenhart, Cross flow Stability And Transition
Experiments in a Swept-Wing Flow, NASA Technical
Memorandum 108650,1992.
Figure 1- Wing section airfoil
Figure2- Three half models with 23,33 and 40 degree
swept angles
Figure3- The model with hot film sensors in the test
section
1071

time0 1 2 3 4 5
,S1
transition
turbulent
Figure 4a- Voltage-time graph, x/c=0.03, 2y/b=0.36, 23
Sk
-2 0 2 4 6 8
-25
-20
-15
-10
-5
0
5
10 Sk-SW23-HF1
Figure 4b- Skewness graph, x/c =0.03, 2y/b=0.36, 23
Figure 4c- Standard deviation graph, x/c=0.03,
2y/b=0.36, 23
SD
-2 0 2 4 6 8 10
0.016
0.0165
0.017
0.0175
0.018
0.0185
0.019
0.0195
0.02
0.0205SD-SW23-HF1
1072

Figure 5a- Voltage-time graph, x/c=0.49, 2y/b =0.25, 23
SD
-2 0 2 4 6 8
0.07
0.08
0.09
0.1
0.11
0.12
SD-SW23-HF5
Figure5b- Standard deviation graph, x/c =0.49,
2y/b=0.25, sweep angle = 23 degree
Sk
-2 0 2 4 6 8
-0.4
-0.2
0
0.2
0.4
SKW-SW23-HF5
Figure 5c- Skewness graph, x/c=0.49, 2y/b=0.25,
23
time0 1 2 3 4 5
,S5
transition
turbulent
1073

time1 2 3 4
,S6
Figure 6a- Voltage-time graph, x/c =0.04, 2y/b=0.71,
23
SD
-2 0 2 4 6 8
-0.15
-0.1
-0.05
0
0.05
0.1
0.15
0.2
0.25
SD-SW23-HF6
Figure 6b- Standard deviation graph, x/c =0.04,
2y/b=0.71, sweep angle = 23 degree
SK
-2 0 2 4 6 8
0
2
4
6
8
SKW-SW23-HF6
Figure 6c- Skewness graph, x/c =0.04, 2y/b=0.71,
23
1074
time1 2 3
transition
vo
lta
ge
,S1
Figure 7a- Voltage-time graph x/c=06, 2y/b=0.03,
23
SD
-2 0 2 4 6 8
0.11
0.12
0.13
0.14
0.15
0.16
0.17
0.18
HF1
Figure 7b- Standard deviation graph x/c =06,
2y/b=0.03, 23
Ske
wn
ess
-2 0 2 4 6 8
-1.5
-1
-0.5
0
0.5
1
1.5
2
2.5
3
3.5hf1
Figure 7c- Skewness graph x/c =06, 2y/b=0.03, 23
1075

time1 2 3 4
,S1
vo
ltag
e
transition
Figure 8a- Voltage-time graph x/c=0.63, 2y/b=0.34,
23
SD
-2 0 2 4 6 80.01
0.02
0.03
0.04
0.05
0.06 HF1
Figure 8b- Standard deviation graph x/c=0.63,
2y/b=0.34, 23
Ske
wn
ess
-2 0 2 4 6 8
-20
-10
0
10
20
30
HF1
Figure 8c- Skewness graph x/c=0.63, 2y/b=0.34,
23
1076

![DSP BASED EXCITATION CONTROL SYSTEM FOR SYNCHRONOUS GENERATOR · angle controller, phase angle and speed controller [2] and self synchronization unit. Fig. 8. shows experimental responses](https://static.fdocuments.us/doc/165x107/5e135d886b3f113cca76e5fd/dsp-based-excitation-control-system-for-synchronous-generator-angle-controller.jpg)