Experiment 12 Non-Inverting Amplifier. Experimental Procedure Clarification in Step 3 (Modeling) –...
21
Experiment 12 Non-Inverting Amplifier
-
Upload
shawn-adams -
Category
Documents
-
view
226 -
download
2
Transcript of Experiment 12 Non-Inverting Amplifier. Experimental Procedure Clarification in Step 3 (Modeling) –...
Experiment 12
Non-Inverting Amplifier

Experimental Procedure
• Clarification in Step 3 (Modeling)– To perform the DC Sweep in the sinusoidal voltage
source in the circuit must be replaced with a dc voltage source, Vdc.
• Typo in Step 4 (Modeling)– Gain of the VCVS should be set to 100,000. – The gain of the amplifier circuit should be 4, set by
the values for R1 and Rf.

Op Amp Equivalent Circuitvd = v2 – v1
A is the open-loop voltage gain
v2
v1

Typical Op Amp ParametersParameter Variable Typical Ranges Ideal ValuesOpen-Loop
Voltage GainA 105 to 108 ∞
Input Resistance
Ri 105 to 1013 W ∞ W
Output Resistance
Ro 10 to 100 W 0 W
Supply Voltage Vcc/V+
-Vcc/V- 5 to 30 V
-30V to 0VN/AN/A

Voltage Transfer CharacteristicPositive Saturation Voltage
Negative Saturation Voltage

PSpice Circuit for Non-Inverting Amplifier

Voltage Controlled Voltage Source
• An ideal op amp can be modeled as a voltage controlled voltage source.– The difference in voltage between the positive and
negative inputs of the op amp (vd = v2 – v1) is the reference voltage for the VCVS.
– The output voltage of the VCVS should be the open-loop gain times vd.• Ideally, A is infinite.

Circuit with Voltage Controlled Voltage Source (Part E): Schematics
Note: Resistor values shown do not produce a gain of 4.

Set Open Loop Gain
• Double click on symbol and set GAIN to at least 100,000– Typical open loop gain of an op amp is 105-108 V/V
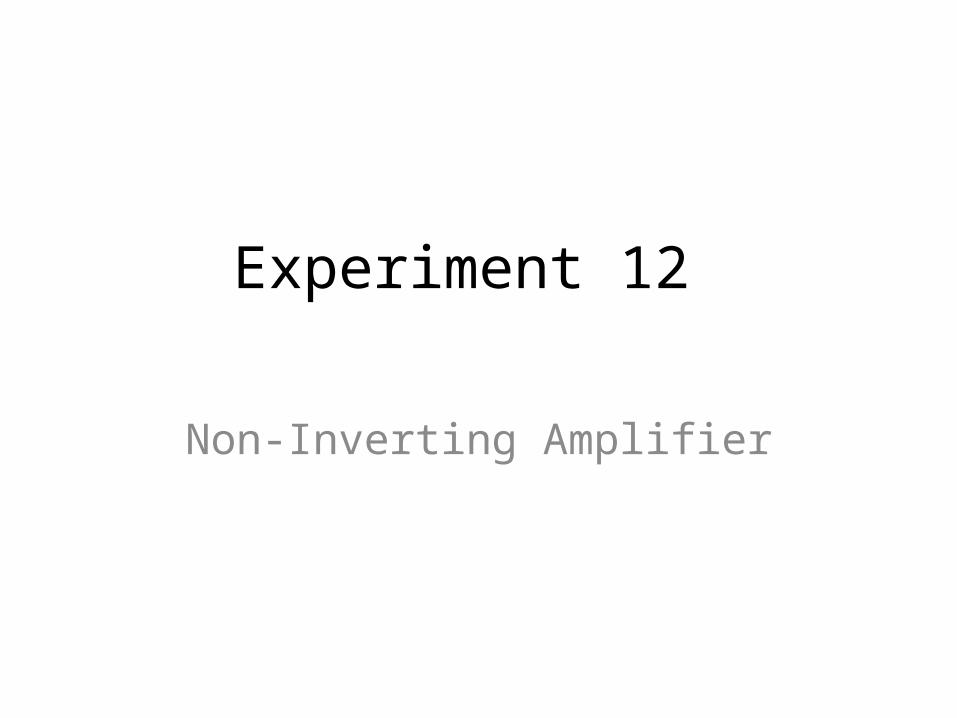
Circuit with Voltage Controlled Voltage Source (Part E): Capture
Note: Resistor values shown do not produce a gain of 4.
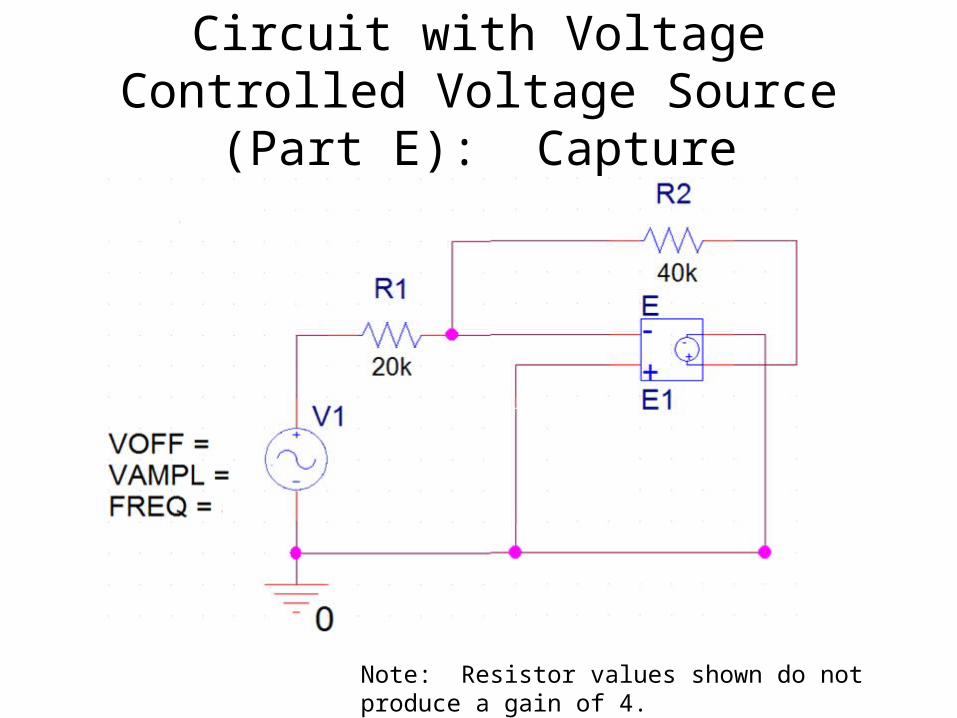
Open Loop Gain
• Double click on symbol for Part E.• Set GAIN in Property Editor pop-up window to
at least 100,000.

Circuit to be constructed

Cables
• The connections to the Velleman scope are BNC (Bayonet Neill-Concelman) connectors.– You will need to use 3 BNC cables with either the
alligator clips or the IC clips to make your connections between the scope and your circuit.
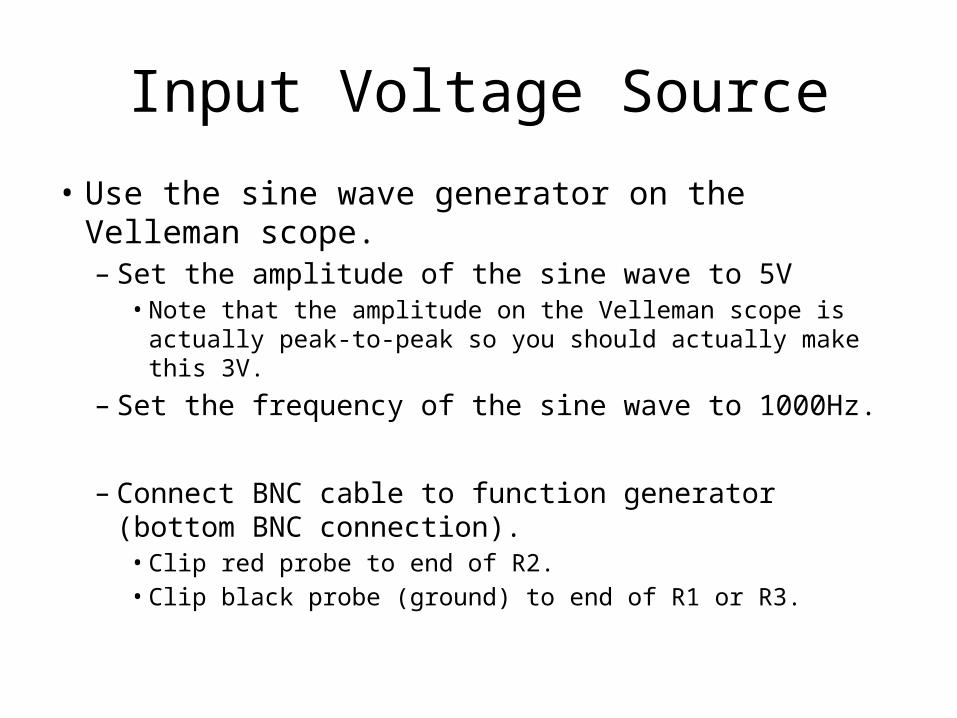
Input Voltage Source
• Use the sine wave generator on the Velleman scope.– Set the amplitude of the sine wave to 5V
• Note that the amplitude on the Velleman scope is actually peak-to-peak so you should actually make this 3V.
– Set the frequency of the sine wave to 1000Hz.
– Connect BNC cable to function generator (bottom BNC connection). • Clip red probe to end of R2. • Clip black probe (ground) to end of R1 or R3.

Voltage Measurements using Oscilloscope
• Channel 1:– Red probe placed between function generator and R2.– Black probe connected to same point as the black
wire from the function generator.• Channel 2:– Red probe placed between output of the LM 324 and
the feedback resistor, Rf, or or between output of the LM 324 and R3.
– Black probe connected to same point as the black wire from the function generator.
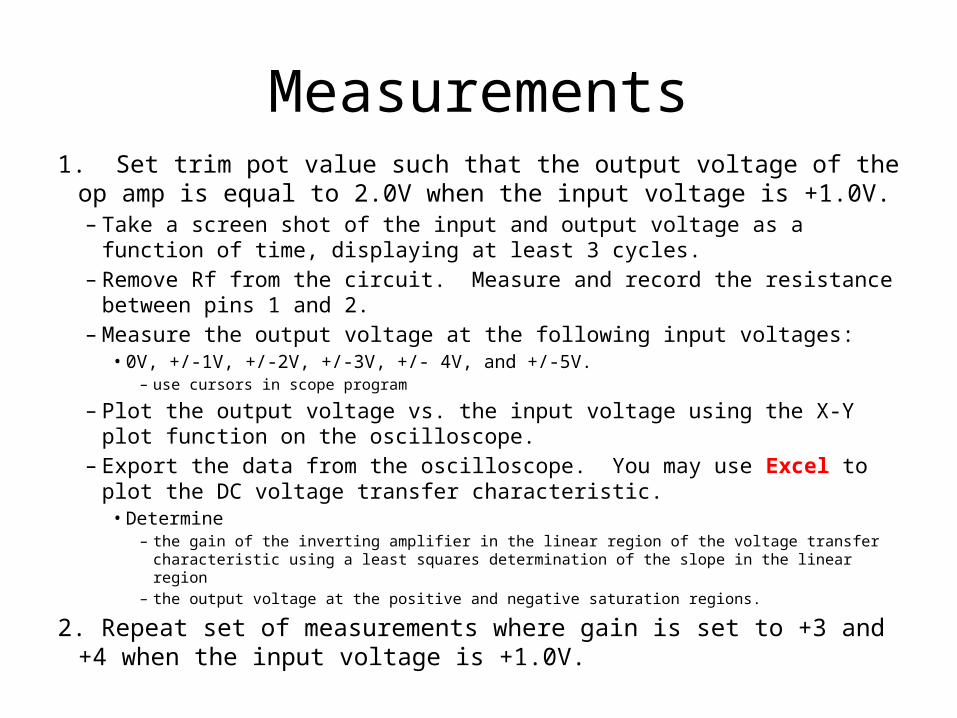
Measurements1. Set trim pot value such that the output voltage of the op amp is equal to
2.0V when the input voltage is +1.0V.– Take a screen shot of the input and output voltage as a function of time,
displaying at least 3 cycles.– Remove Rf from the circuit. Measure and record the resistance between pins 1
and 2.– Measure the output voltage at the following input voltages:
• 0V, +/-1V, +/-2V, +/-3V, +/- 4V, and +/-5V.– use cursors in scope program
– Plot the output voltage vs. the input voltage using the X-Y plot function on the oscilloscope.
– Export the data from the oscilloscope. You may use Excel to plot the DC voltage transfer characteristic.• Determine
– the gain of the inverting amplifier in the linear region of the voltage transfer characteristic using a least squares determination of the slope in the linear region
– the output voltage at the positive and negative saturation regions.
2. Repeat set of measurements where gain is set to +3 and +4 when the input voltage is +1.0V.
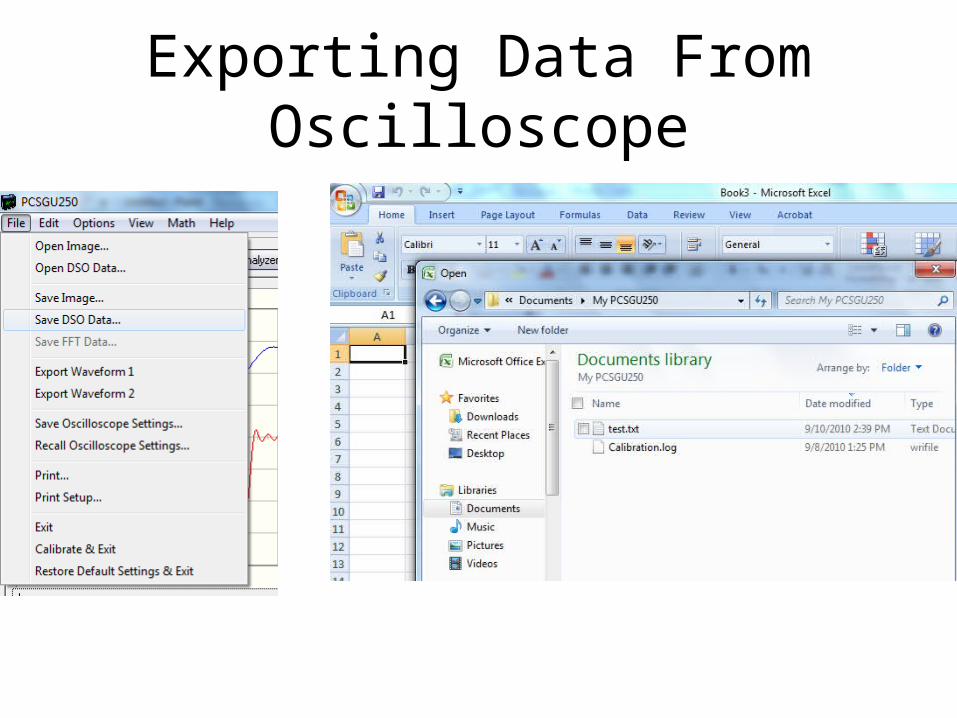
Exporting Data From Oscilloscope

Scaling Required: Time
To determine the time to print on the x-axis:
Look at TIME STEP: for the number of points (125) that are equal to a time increment (1ms).
This means that the time for each point in the column under N should be divided by 125 and then multipled by 1ms to determine the time at which each voltage data point was taken.
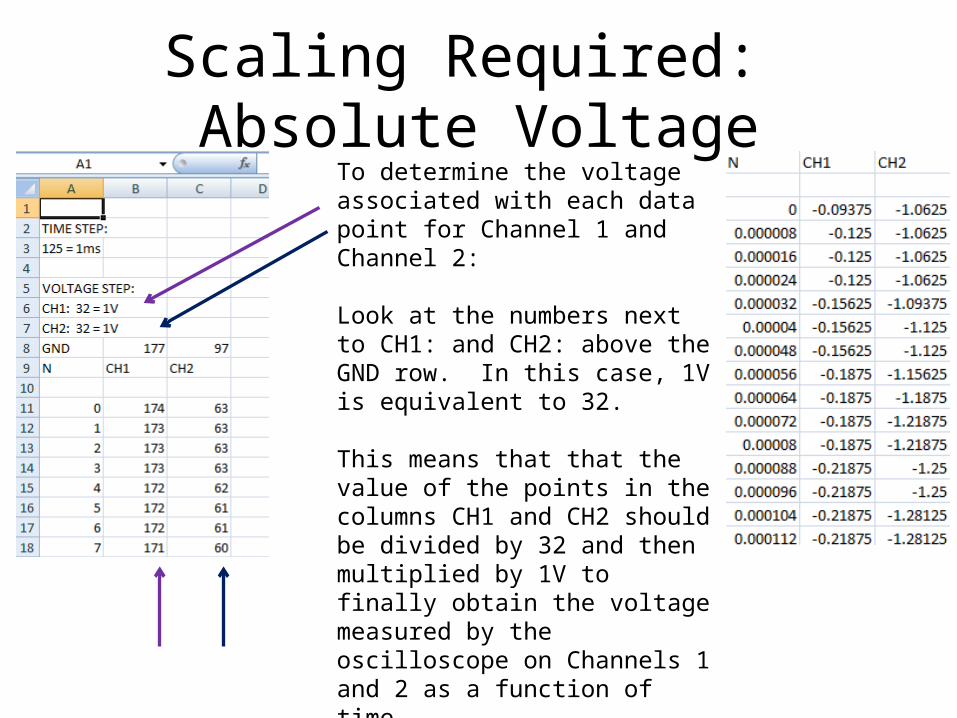
Scaling Required: Absolute VoltageTo determine the voltage associated with each data point for Channel 1 and Channel 2:
Look at the numbers next to CH1: and CH2: above the GND row. In this case, 1V is equivalent to 32.
This means that that the value of the points in the columns CH1 and CH2 should be divided by 32 and then multiplied by 1V to finally obtain the voltage measured by the oscilloscope on Channels 1 and 2 as a function of time.

Measurements
• Measure exact values of V+ and V- powering the LM 324 op amp.– Note that there is a statement about maximum
and minimum output voltages that can be obtained from the LM 324 in the datasheet.• Datasheet can easily be found by entering LM324 and
datasheet into Google or other internet search engine.– Find it and read the first page.


![NASA Standards Mechanical tests – Strength – Sinusoidal sweep vibration (5 to 50 hertz [Hz]) ELV and STS payloads – Random vibration and acoustics – Shock.](https://static.fdocuments.us/doc/165x107/56649cff5503460f949cfe0b/nasa-standards-mechanical-tests-strength-sinusoidal-sweep-vibration.jpg)