An Experimental Evaluation of Low Calorific Value...
46
An Experimental Evaluation of Low Calorific Value Gaseous Fuels as a Heat Source for Stirling Engines Master’s thesis in Sustainable Energy Systems JOHAN WESTERBERG Department of Applied Mechanics Division of Combustion CHALMERS UNIVERSITY OF TECHNOLOGY G¨ oteborg, Sweden 2014 Master’s thesis 2014:03
Transcript of An Experimental Evaluation of Low Calorific Value...

An Experimental Evaluation of Low Calorific Value GaseousFuels as a Heat Source for Stirling EnginesMaster’s thesis in Sustainable Energy Systems
JOHAN WESTERBERG
Department of Applied MechanicsDivision of CombustionCHALMERS UNIVERSITY OF TECHNOLOGYGoteborg, Sweden 2014Master’s thesis 2014:03


MASTER’S THESIS IN SUSTAINABLE ENERGY SYSTEMS
An Experimental Evaluation of Low Calorific Value Gaseous Fuels as a HeatSource for Stirling Engines
JOHAN WESTERBERG
Department of Applied MechanicsDivision of Combustion
CHALMERS UNIVERSITY OF TECHNOLOGY
Goteborg, Sweden 2014

An Experimental Evaluation of Low Calorific Value Gaseous Fuels as a Heat Source for Stirling EnginesJOHAN WESTERBERG
c© JOHAN WESTERBERG, 2014
Master’s thesis 2014:03ISSN 1652-8557Department of Applied MechanicsDivision of CombustionChalmers University of TechnologySE-412 96 GoteborgSwedenTelephone: +46 (0)31-772 1000
Cover:Cleanergy’s C9G Stirling engine.
Chalmers ReproserviceGoteborg, Sweden 2014

An Experimental Evaluation of Low Calorific Value Gaseous Fuels as a Heat Source for Stirling EnginesMaster’s thesis in Sustainable Energy SystemsJOHAN WESTERBERGDepartment of Applied MechanicsDivision of CombustionChalmers University of Technology
Abstract
This report, An Experimental Evaluation of Low Calorific Value Gaseous Fuels as a Heat Source for StirlingEngines, was written by Johan Westerberg as a Master’s thesis at Chalmers University of Technology. It coversthe topic of MILD combustion of liquid propane gas, G25 natural gas, synthesis gas and landfill gas, of whichthe latter two represents low calorific gaseous fuels. The investigated engine was a C9G Stirling engine fromCleanergy.
The primary incentive to this study was to determine if steady and reliable operation of the C9G Stirlingengine could be maintained while using low calorific gaseous fuels. Another incentive to this project was toachieve further understanding of the combustion device, which purpose is to supply the Stirling engine withheat. Thus, an understanding of the changed characteristics caused by varying the air to fuel ratio was targeted.
Engine operation by use of landfill gas, made up by 20 percent methane in carbon dioxide and nitrogen, wassuccessful at the lowest load setting allowed by the C9G engine, generating 1.5 kW of shaft power. For liquidpropane gas and G25 natural gas, up to 10.9 kW of shaft power was generated. Combustion of synthesis gaswas not attempted due to the hazard of carbon monoxide poisoning, caused by insufficient ventilation in thetest cell.
Apparent changes in energy flows and temperatures within the combustion device at varied air to fuel ratiossuggest that incomplete combustion prior to the heat sink of the Stirling engine was an issue, especially at lowto moderate air to fuel ratios. Further, a reversed flow direction through the flue gas recirculation cavities wasobserved when high flow rates of fuel, which primarily occurs for high load settings and low air to fuel ratios,was supplied to the engine. Consequently, a higher air to fuel ratio resulted in a higher system efficiency for alltested fuels and load settings. Thus, the system efficiency was concluded to be heavily impacted by the air tofuel ratio.
Keywords: Stirling, biogas, landfill gas, synthesis gas, combustion, MILD, FLOX, C9G
ii
Preface
The reader of this report should have basic knowledge in thermodynamics, especially the fundamentals ofenergy balances. Further, some understanding of combustion kinetics and the various modes of heat transfer isalso beneficial.
If the reader is already familiar with the principles of the Stirling engine, Chapter 2 may be omitted. Further,Chapter 3 may be superseded if the characteristics of low calorific fuels and the principles of MILD combustionis known to the reader. However, the author suggest that the reader studies the definition of the gaseous fuels,Chapter 3.1, before commencing to later Chapters in this report.
Acknowledgements
The author of this report would like to thank people within the academy and the industry who made thisproject possible. The objectives would never have been fulfilled without proper support.
Anders Mattsson and Patrik Wahlin, technical support staff of the department of Applied mechanicsat Chalmers University of Technology, made extensive contributions in solving technical issues during theinstallation of several mechanical systems in the test cell. Both had prior experience in setting up the C9GStirling engine for operation. Calibration of the various measurement systems was aided by Daniel Harensten,also a member of the technical support staff. Alf Magnusson coordinated the support staff to ensure propertime management.
From within the industry, Gustav Bos and Thomas Kroll, research engineers at Cleanergy, gave support insolving technical issues with the engine. Martin Nilsson and Pontus Wettrell, also from Cleanergy, contributedby supplying the author with calculations and information on expected output values.
Finally, Professor Ingemar Denbratt was the supervisor of this project. Together with Martin Nilsson,Ingemar drew the outlines of the study and served as an official link between Chalmers University of Technologyand Cleanergy.
iii

Nomenclature
ε Effectiveness of the preheaterηC Efficiency of the ideal Carnot engineηc Efficiency of the combustion deviceηc+s Combined efficiency of the combustion device and the Stirling engineηs Efficiency of the Stirling engineλ Air to fuel ratioρc Density of the coolant [kg m−3]ρf Density of the fuel [kg m−3]τ Torque [N m ]ω Angular velocity [rad s−1]cp,air Specific heat of the air [J kg−1 K−1]cp,c Specific heat of the coolant [J kg−1 K−1]cp,fg Specific heat of the flue gases [J kg−1 K−1]GS Specific density of the fuel [ ]
Hp Enthalpy flow of the product gases [W]
Hr Enthalpy flow of the reactant gases [W]hair,amb Enthalpy of the air at ambient conditions [J kg−1]hair,ph Enthalpy of the air at the preheater’s exit [J kg−1]hc,i Enthalpy of the coolant the engine’s inlet [J kg−1]hc,o Enthalpy of the coolant the engine’s outlet [J kg−1]hf,p Heat of formation of the product gases [J mol−1]hf,r Heat of formation of the reactant gases [J mol−1]hfg,ahh Enthalpy of the flue gases after the heater head [J kg−1]hfg,amb Enthalpy of the flue gases at ambient conditions [J kg−1]hfg,e Enthalpy of the flue gases at the exhaust pipe [J kg−1]hfg,fgr Enthalpy of the flue gases at the preheater’s inlet/flue gas recirculation’s inlet [J kg−1]hfg,phh Enthalpy of the flue gases prior to the heater head [J kg−1]hfg,ref Enthalpy of the flue gases at the reference state [J kg−1]IW,HHV Wobbe index based on the higher heating value of the fuel [J m−3]IW,LHV Wobbe index based on the lower heating value of the fuel [J m−3]mair Mass flow rate of the air [kg s−1]mc Mass flow rate of the coolant [kg s−1]mfg Mass flow rate of the flue gases [kg s−1]np Molar flow rate of the product gases [mol s−1]nr Molar flow rate of the reactant gases [mol s−1]nrev Revolutions per minute [rpm]Pi Indicated power [W]Ps Shaft power [W]p Cylinder pressure [Pa]Tair,amb Air temperature at ambient conditions [K]Tair,ph Air temperature at the preheater’s exit [K]TC Heat sink temperature [K]Tc,i Coolant temperature at the engine’s inlet [K]Tc,o Coolant temperature at the engine’s outlet [K]Tc,e,i External coolant temperature at the heat exchanger’s inlet [K]Tc,e,o External coolant temperature at the heat exchanger’s outlet [K]Tfg,ahh Flue gas temperature after the heater head [K]Tfg,e Flue gas temperature at the exhaust pipe [K]Tfg,fgr Flue gas temperature at the preheater’s inlet/flue gas recirculation’s inlet [K]Tfg,phh Flue gas temperature prior to the heater head [K]TH Heat source temperature [K]Tref Reference temperature [K]V Cylinder volume [m3]VC Calorific value of the fuel [J m−3]
iv

Vc Volume flow rate of the coolant [m3 s−1]
Vf Volume flow rate of the fuel [m3 s−1]
Vfg Volume flow rate of the flue gases [m3 s−1]
Wcomp Compression work [J]
Wi Indicated work [J]
Wexp Expansion work [J]
Qc Heat rejected by the internal cooling system [W]
Qe Heat rejected by the exiting exhaust gases [W]
Qf Heat rejected by friction [W]
Qi Heat added by the fuel [W]
Qo,c Heat rejected by other sources in the combustion device [W]
Qo,s Heat rejected by other sources in the Stirling engine [W]
Qp,air Heat accepted by the air in the preheater [W]
Qp,fg Heat rejected by the flue gases in the preheater [W]
Qp,max Maximum heat transfer through the preheater [W]
Qcomb,prompt Combustion heat released prior to the heater head [W]
Qu Useful heat accepted by the heater head [W]
v

Contents
Abstract ii
Preface iii
Acknowledgements iii
Nomenclature iv
Contents vi
1 Introduction 11.1 Purpose . . . . . . . . . . . . . . . . . . . . . . . . . . . . . . . . . . . . . . . . . . . . . . . . . . . 11.2 Limitations . . . . . . . . . . . . . . . . . . . . . . . . . . . . . . . . . . . . . . . . . . . . . . . . . 1
2 The Stirling engine 32.1 Thermodynamic cycles . . . . . . . . . . . . . . . . . . . . . . . . . . . . . . . . . . . . . . . . . . . 32.1.1 The Carnot cycle . . . . . . . . . . . . . . . . . . . . . . . . . . . . . . . . . . . . . . . . . . . . . 32.1.2 The Stirling cycle . . . . . . . . . . . . . . . . . . . . . . . . . . . . . . . . . . . . . . . . . . . . 42.2 Mechanical concepts . . . . . . . . . . . . . . . . . . . . . . . . . . . . . . . . . . . . . . . . . . . . 42.2.1 The Alpha engine . . . . . . . . . . . . . . . . . . . . . . . . . . . . . . . . . . . . . . . . . . . . 42.2.2 The Beta engine . . . . . . . . . . . . . . . . . . . . . . . . . . . . . . . . . . . . . . . . . . . . . 52.2.3 The Gamma engine . . . . . . . . . . . . . . . . . . . . . . . . . . . . . . . . . . . . . . . . . . . 62.3 Aspects of power generation . . . . . . . . . . . . . . . . . . . . . . . . . . . . . . . . . . . . . . . . 6
3 Combustion of gaseous fuels 93.1 Definition of the selected fuels . . . . . . . . . . . . . . . . . . . . . . . . . . . . . . . . . . . . . . . 93.2 Low calorific gaseous fuels . . . . . . . . . . . . . . . . . . . . . . . . . . . . . . . . . . . . . . . . . 93.2.1 Characteristics . . . . . . . . . . . . . . . . . . . . . . . . . . . . . . . . . . . . . . . . . . . . . . 103.2.2 Applications . . . . . . . . . . . . . . . . . . . . . . . . . . . . . . . . . . . . . . . . . . . . . . . 103.3 MILD combustion . . . . . . . . . . . . . . . . . . . . . . . . . . . . . . . . . . . . . . . . . . . . . 10
4 Method 134.1 Performance evaluation of the combustion device . . . . . . . . . . . . . . . . . . . . . . . . . . . . 134.1.1 Heat addition . . . . . . . . . . . . . . . . . . . . . . . . . . . . . . . . . . . . . . . . . . . . . . . 134.1.2 Heat rejection . . . . . . . . . . . . . . . . . . . . . . . . . . . . . . . . . . . . . . . . . . . . . . 144.1.3 Other losses . . . . . . . . . . . . . . . . . . . . . . . . . . . . . . . . . . . . . . . . . . . . . . . . 144.1.4 Combustion efficiency . . . . . . . . . . . . . . . . . . . . . . . . . . . . . . . . . . . . . . . . . . 144.1.5 Internal heat balance . . . . . . . . . . . . . . . . . . . . . . . . . . . . . . . . . . . . . . . . . . 144.1.6 Additional remarks . . . . . . . . . . . . . . . . . . . . . . . . . . . . . . . . . . . . . . . . . . . . 154.2 Performance evaluation of the Stirling engine . . . . . . . . . . . . . . . . . . . . . . . . . . . . . . 154.2.1 Heat rejection . . . . . . . . . . . . . . . . . . . . . . . . . . . . . . . . . . . . . . . . . . . . . . 154.2.2 Expansion and compression work . . . . . . . . . . . . . . . . . . . . . . . . . . . . . . . . . . . . 164.2.3 Other losses . . . . . . . . . . . . . . . . . . . . . . . . . . . . . . . . . . . . . . . . . . . . . . . . 164.2.4 Thermal efficiency . . . . . . . . . . . . . . . . . . . . . . . . . . . . . . . . . . . . . . . . . . . . 174.3 Interchangeability of the selected fuels . . . . . . . . . . . . . . . . . . . . . . . . . . . . . . . . . . 174.4 The engine installation . . . . . . . . . . . . . . . . . . . . . . . . . . . . . . . . . . . . . . . . . . . 184.4.1 The air supply . . . . . . . . . . . . . . . . . . . . . . . . . . . . . . . . . . . . . . . . . . . . . . 184.4.2 The combustion system . . . . . . . . . . . . . . . . . . . . . . . . . . . . . . . . . . . . . . . . . 184.4.3 The cooling system . . . . . . . . . . . . . . . . . . . . . . . . . . . . . . . . . . . . . . . . . . . . 184.4.4 The external cooling system . . . . . . . . . . . . . . . . . . . . . . . . . . . . . . . . . . . . . . . 184.4.5 Verification of thermal equilibrium . . . . . . . . . . . . . . . . . . . . . . . . . . . . . . . . . . . 194.4.6 Limitations . . . . . . . . . . . . . . . . . . . . . . . . . . . . . . . . . . . . . . . . . . . . . . . . 194.5 Equipment for data acquisition . . . . . . . . . . . . . . . . . . . . . . . . . . . . . . . . . . . . . . 19
vi

5 Results 215.1 Completion of the test schedule . . . . . . . . . . . . . . . . . . . . . . . . . . . . . . . . . . . . . . 215.2 Energy flows . . . . . . . . . . . . . . . . . . . . . . . . . . . . . . . . . . . . . . . . . . . . . . . . 225.3 Influence of the air to fuel ratio . . . . . . . . . . . . . . . . . . . . . . . . . . . . . . . . . . . . . . 225.4 Stability of operation . . . . . . . . . . . . . . . . . . . . . . . . . . . . . . . . . . . . . . . . . . . . 24
6 Discussion 256.1 Consistency of the measurement data . . . . . . . . . . . . . . . . . . . . . . . . . . . . . . . . . . 256.2 Influence of the air to fuel ratio . . . . . . . . . . . . . . . . . . . . . . . . . . . . . . . . . . . . . . 256.3 Stability of operation . . . . . . . . . . . . . . . . . . . . . . . . . . . . . . . . . . . . . . . . . . . . 26
7 Conclusions 29
References 31
A The test schedule 33
B A list of measurement data and equipment 35
C Energy analysis of the combustion device using liquid propane gas as the fuel source 37
D Energy analysis of the combustion device using natural gas as the fuel source 37
E Energy analysis of the combustion device using landfill gas as the fuel source 38
vii

1 Introduction
In the year 1816, Robert Stirling registered a patent for the Stirling engine [6]. It was intended to be analternative to the steam engine, not only providing a higher efficiency but also eliminating the hazard of aboiler explosion. Following the development of the combustion engine in the late 19th century, the commercialinterest in the Stirling engine disappeared [26]. Even though research and development was resumed in the late1930s, the technology has only been applied in a few engineering applications. Current applications includepropulsion of submarines of the Royal Swedish Navy and electricity generation from solar energy, but theinterest in this newborn heat engine is growing [19]. Cleanergy, founded in 2008, is a company providing energysolutions based on Stirling engine technology.
Stirling engines have the advantage of being supplied by an external heat source. Hence, Cleanergy is ableto utilise Stirling engine technology in both solar and combined heat and power production, where the latter isbased on combustion of biogas or natural gas.
At present, biological energy sources provides 10 percent of the global primary energy supply [35]. However,this figure is significantly higher in rural areas, in which biomass is primarily used for cooking and heatingpurposes. The use of primitive equipment results in low conversion efficiencies, thus resulting in enhanceddeforestation.
Due to the possibility to reduce greenhouse gas emissions, the International Energy Agency identifiedbioenergy as an important tool for dealing with the climate crisis [18]. One identified pathway for bioenergyutilisation is the conversion of biomass into biogas, which is then either combusted directly in a combined heatand power application or upgraded to a methane concentration equivalent to natural gas.
Current applications to burn biogases include various types of engines adapted to the Otto principle.However, these engines requires a methane concentration in excess of 45 percent [31]. In order to facilitatefurther development within this area, Cleanergy intends to gather additional knowledge in operating Stirlingengines with biogases containing even less combustibles.
1.1 Purpose
This thesis was intended to investigate the running conditions of a C9G Stirling engine using four differentfuels. The fuels of interest were liquid propane gas, G25 natural gas, a methane based low grade gas fromlandfill sites and synthesis gas produced by biomass gasification. The two former fuels served as a reference fortesting the latter two. Hence, the main ambition was to investigate the operational conditions of the enginewhile fuelled by landfill gas or synthesis gas. The engine system was set up in order to determine some keyoperational characteristics;
• The maximum possible work output of the Stirling engine when operated by low calorific gaseous fuelsand while maintaining a shaft speed of 1500 rpm
• A quantification of important energy flows
• The efficiency of the combustion device and the Stirling engine
• The effectiveness of the air preheater
• The influence on engine performance caused by the air to fuel ratio
• The overall stability of operation
1.2 Limitations
The main focus was directed towards investigating the operational characteristics of the Stirling engine and thecombustion device using four gaseous fuels. Hence, only fuel properties related to combustion heat release isthoroughly discussed. No regard was taken to other fuel properties, including;
• Availability, cost and security of supply
• Corrosiveness and foulness to the combustion equipment
1

• Emissions forming and potential flue gas cleaning
• Legislation or prohibitions
The three main Stirling engine configurations are briefly presented. However, since the C9G engine is ofalpha configuration, the principal point was to investigate the mechanical function and calculation methodsapplicable to this engine type.
This thesis, proposed by Cleanergy, was performed in one of the on site testing cells located at ChalmersUniversity of Technology, department of Applied Mechanics, division of Combustion. It should be stressed thatthe amount of fuel available for engine testing was limited not only by price, but also due to the extensivevolume of fuel required for low calorific fuel combustion. Further, the amount of hours available in the test cellwas also limited, thus forming additional constraints to the extent of the test schedule.
2

2 The Stirling engine
In order to provide an understanding of the fundamental principle of the Stirling engine, an explanation of thethermodynamic process of this heat engine is presented, as well as its similarities with the Carnot cycle. Latersections of this chapter present the different mechanical configurations of the Stirling engine as well as some ofits key characteristics.
2.1 Thermodynamic cycles
The thermodynamic cycle undergone by a heat engine often implies a system using a fluid as the workingsubstance [8]. The system can be either open or closed, and the working fluid is carried through four differentstates. In a closed system, the working fluid will return to the initial state when the cycle is completed. AStirling engine operates as a closed system. An opened system holds the same basic states, but the workingfluid is disposed as the last state of the cycle is reached. Additional working fluid is then added at the initialstate, forming the characteristics of an open cycle. While carried through the different states, the working fluidin a heat engine may change phases.
2.1.1 The Carnot cycle
The Carnot cycle is a reversible thermodynamic cycle, proposed by Nicolas Leonard Sadi Carnot in 1824 todemonstrate the theoretically most efficient energy conversion cycle between two heat reservoirs [8]. Consequently,the Carnot efficiency is the maximum energy conversion efficiency to be obtained between a heat source anda heat sink at finite temperatures. Hence, it is used to evaluate the efficiency of a real process. To properlydescribe the Carnot cycle, four different steps are defined, Figure 2.1.
T
SV
P 1
2
3
4
1 2
34
Figure 2.1: The P-V and T-S diagram of the Carnot cycle.
1-2) Reversible, isothermal expansion of the working fluid at high temperature. The working fluid isexpanded, allowing heat to be accepted from the high temperature reservoir at constant temperature.
2-3) Isentropic (reversible and adiabatic) expansion of the working fluid. During this step, in whichenergy is extracted from the system through boundary work, the piston and the cylinder is assumed tobe insulated, preventing any heat exchange with the environment. The expansion is carried out until theworking fluid has reached the temperature of the low temperature reservoir.
3-4) Reversible, isothermal compression of the working fluid at low temperature. The working fluid iscompressed, allowing heat to be discharged to the low temperature reservoir at constant temperature.
4-1) Isentropic (reversible and adiabatic) compression of the working fluid. Again, the piston and thecylinder is assumed to be insulated. The compression is carried out until the working fluid has reachedthe temperature of the high temperature reservoir.
In reality, it is impossible to achieve complete Carnot efficiency. However, trying to construct a heat enginethat closely resembles the Carnot cycle will result in a more efficient engine. The factors that rule out thepossibilities of complete Carnot efficiency can be directly linked to the different steps of the process.
3

Difficulties associated with accepting and discharging heat at a constant temperature during step (1-2) and(3-4) exists. This would require a heat transfer process that is rapid enough to ensure that the temperatureof the working fluid does not decrease or increase during the expansion and compression respectively. If thetemperature of the working fluid deviates from the temperature of the reservoir, heat transfer over a finitetemperature difference follows as a result, thus allowing losses to occur due to increased entropy.The quality ofthe insulation in terms of preventing heat transfer to the environment during step (2-3) and (4-1) also influencesthe efficiency of the cycle.
Furthermore, the Carnot cycle does not account for any friction losses within the heat engine and additionallosses may also occur following non-quasi-steady expansion or compression at high speed of revolution. Theabove described factors are irreversibilities, directly corresponding to efficiency losses as part of the energyassociated with the process become non-retrievable [37].
2.1.2 The Stirling cycle
The fundamental principle of the Stirling cycle is based upon a constant quantity of gas being contained by awarm and a cold compartment. In a closed cycle, the gas is heated and cooled in turns, giving rise to volumechanges and boundary work. The fact that the Stirling cycle resembles the Carnot cycle provides the Stirlingengine with the possibility to reach high efficiencies compared to other types of engines [40].
The P-V and T-S characteristics of the Stirling cycle and Carnot cycle are almost similar. The differencesare due to deviations from the Carnot cycle, leaving the real Stirling cycle with a smoother P-V and T-Sappearance as it fails to complete the different steps of the Carnot cycle in a completely reversible manner. Inother words, an ideal Stirling engine entirely resembles the Carnot cycle. Further, in the Stirling cycle, step(1-4) and (2-3) are isochoric processes.
In order to explain the fundamental principle further, two important components needs to be defined;the piston that converts boundary work into shaft work and seals the working fluid from the surroundingenvironment, and the displacer, whose main purpose is to transport the fluid. The piston and the displacermay be operating in the same cylinder, or in separate cylinders, depending on the considered type of Stirlingengine. Since a part of the work output of the Stirling engine is used to compress the working fluid, the network is defined as the difference between the boundary work gained when the working fluid is expanded andthe boundary work consumed when the gas is compressed.
Stirling engines often use a regenerator in order to store a part of the rejected heat as the working fluid istransported from the warmer side of the engine to the colder side. When transported in the opposite direction,the working fluid will accept heat, partly from the high temperature reservoir and partly from the regenerator,thus decreasing the demand for heat addition from the reservoir.
2.2 Mechanical concepts
Stirling engines are typically divided into three different basic concepts or types; alpha, beta and gamma [6].The thermodynamic principle is the same for each type of engine. These three basic concepts are forming abasis, from which other configurations of the Stirling engine have been developed.
One example of these sub-configurations is the double-acting alpha Stirling engine, where several pistonsand cylinders co-operate by using the upper surface of every piston for expansion and the lower surface forcompression [22]. Another example is the beta configured rhombic drive Stirling engine, in which two gears areforced to rotate in opposite directions [11]. As a result, the piston and the displacer is completing the cycle ina perfectly coaxial manner.
2.2.1 The Alpha engine
The alpha engine consists of two pistons in separate cylinders, connected by a pipe allowing the working fluidto flow between the cylinders [40], Figure 2.2. There is no dedicated displacer in the alpha engine as bothpistons are contributing to the movement of the working fluid. A phase shift between the two pistons resultsin the working fluid being compressed and expanded in turns and forced to flow between the cylinders. Theexpansion occurs while accepting heat from the high temperature reservoir (red), whereas compression occurswhile heat is rejected at the low temperature reservoir (blue).
4

Figure 2.2: The schematics of an alpha engine. Components include a crankshaft, two pistons and two cylinders.A Heater and a cooler is attached to the warm and cold cylinder respectively. A regenerator is used to conservesome of the heat within the system as the working fluid is passing through the channel between the cylinders.
1. The piston in the cold cylinder is at its upper dead state and the piston in the warm cylinder is descending.Most of the working fluid is located in the warm cylinder, except the amount located in the regenerator(green) and the dead volume of the cold cylinder. Heat addition causes the working fluid to expand,generating boundary work as the gas forces the piston in the warm cylinder to descend.
2. The piston in the warm cylinder is at its lower dead state and the piston in the cold cylinder is descending.The working fluid is expanded and will shortly reach maximum volume.
3. The piston in the cold cylinder is at its lower dead state and the piston in the warm cylinder is ascending.The majority of the working fluid is transported from the warm to the cold cylinder where it is compressedduring heat rejection to the low temperature reservoir. Work is consumed during the compression, aidedby the momentum stored in the flywheel.
4. The piston in the warm cylinder is at is upper dead state and the piston in the cold cylinder is ascending.The working fluid is compressed and will shortly reach minimum volume.
The basic components in the alpha engine do not differentiate principally from those in an internal combustionengine as the design of the engine block, the crankshaft, the cylinders and the pistons are similar. The majordisadvantage of the alpha engine compared to the other configurations of the Stirling engine is the difficultyassociated with sealing the warm cylinder, especially in high temperature applications [40]. High temperaturesenhance the challenge of designing well sealed piston rings, since a gas at high temperature has more internalenergy and therefore contains atoms at greater velocities than a gas at lower temperature. Added to this, theworking fluid often consists of highly diffusive gases such as helium or hydrogen.
2.2.2 The Beta engine
The most significant difference between the beta engine and the alpha engine is the design of the pistons andthe fact that they operate within the same cylinder [40], Figure 2.3. This results in the possibility of designingan engine with a lower total volume.
In contrast to the alpha engine, in which both pistons contribute to the transportation of the working fluid,the beta engine uses a displacer for this purpose. The displacer transports the working fluid between thecold and the warm end of the cylinder through a pipe, often located in the cylinder wall, and is thereby notincreasing the pressure of working fluid. The piston’s location on the crankshaft is shifted to the displacer’s.Throughout the cycle, the same piston is collecting the boundary work from the working fluid during theexpansion as well as performing boundary work on the working fluid during the compression.
In the following description of the beta cycle, using steps of crank angle, the working fluid refers to the fluidabove the piston and the crankshaft is rotating counter-clockwise.
1. The displacer is at its lower dead state and the piston is descending. The working fluid, except theamount of fluid located in the regenerator (green), is located in the warm end of the cylinder. Heat isaccepted from the high temperature reservoir and causes the working fluid to expand, pushing the pistondown to generate boundary work.
5

Figure 2.3: The schematics of a beta engine. Components include a crankshaft, a cylinder and two pistons. Aheater and a cooler is attached to the warm and cold ends of the cylinder respectively. A regenerator is used toconserve some of the heat within the system as the working fluid is passing through the channel between the twoends of the cylinder. The upper piston, called displacer, is used for transporting the working fluid between thecompartments.
2. The piston is at its lower dead state and the displacer is ascending. The working fluid has been completelyexpanded and has reached its maximum volume.
3. The displacer is at its upper dead state and the piston is ascending. The working fluid is compressed asit flows from the warm to the cold end of the cylinder, rejecting heat to the cold temperature reservoirsimultaneously. Work is consumed during the compression, aided by the momentum stored in the flywheel.
4. The piston is at its upper dead state and the displacer is descending. The working fluid has been fullycompressed and has reached its minimum volume.
The beta engine has the advantage of having only one piston, thus reducing the total contact surface betweenpistons and cylinders. Further, the difficulties associated with designing well sealed piston rings are aided bythe fact that the engine is sealed by the piston at the cold part of the engine only.
2.2.3 The Gamma engine
The gamma engine can be described as a mixture of the alpha engine and the beta engine, Figure 2.4. Like thebeta engine, the gamma engine uses a displacer and a piston. However, they are located in separate cylinders,as is the case in the alpha engine. The cylinders are linked with a pipe to allow the working fluid to flowbetween the cylinders. Another pipe is used to lead the working fluid around the displacer, from the cold tothe warm end of the cylinder. The latter pipe, a feature shared with the beta engine, holds the regenerator.The four step definition of the cycle is similar to the beta engine’s.
One disadvantage of the gamma engine compared to the beta engine is the increased volume associated withlinking the two cylinders together. The added volume is not contributing to the compression of the workingfluid, resulting in a decreased compression ratio and thereby a lower thermal efficiency [40]. Hence, the gammaengine becomes a suitable alternative when the advantages of using two separate cylinders surpass the requestfor a high efficiency.
2.3 Aspects of power generation
Some of the qualities of Stirling engines make them particularly appropriate for electricity generation. Onepositive feature is the possibility to use the same type of engine in different applications, without majormodifications. The external heat source may vary from solar and geothermal energy extraction to combustionheat release.
Another positive attribute that comes with an external heat source is that no combustion occurs insidethe cylinders. Hence, soot and other combustion products are not mixed with the working fluid. As a result,Stirling engines generally have longer maintenance intervals than internal combustion engines, in which soot
6
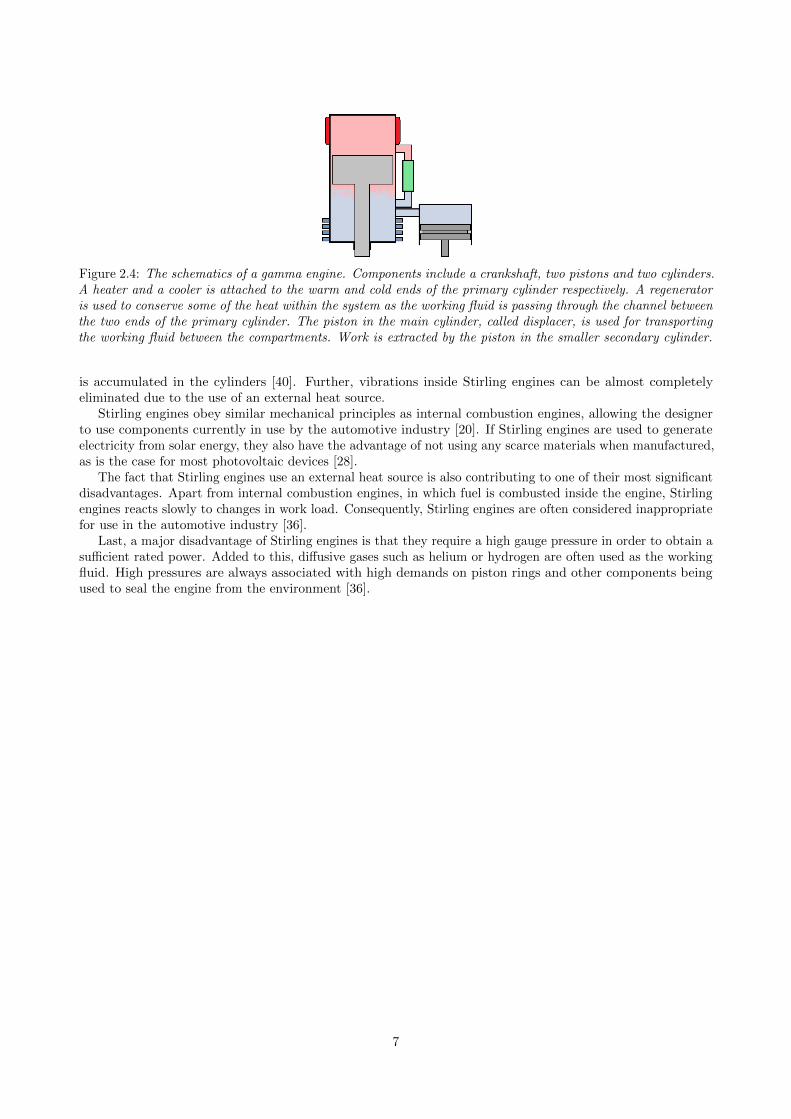
Figure 2.4: The schematics of a gamma engine. Components include a crankshaft, two pistons and two cylinders.A heater and a cooler is attached to the warm and cold ends of the primary cylinder respectively. A regeneratoris used to conserve some of the heat within the system as the working fluid is passing through the channel betweenthe two ends of the primary cylinder. The piston in the main cylinder, called displacer, is used for transportingthe working fluid between the compartments. Work is extracted by the piston in the smaller secondary cylinder.
is accumulated in the cylinders [40]. Further, vibrations inside Stirling engines can be almost completelyeliminated due to the use of an external heat source.
Stirling engines obey similar mechanical principles as internal combustion engines, allowing the designerto use components currently in use by the automotive industry [20]. If Stirling engines are used to generateelectricity from solar energy, they also have the advantage of not using any scarce materials when manufactured,as is the case for most photovoltaic devices [28].
The fact that Stirling engines use an external heat source is also contributing to one of their most significantdisadvantages. Apart from internal combustion engines, in which fuel is combusted inside the engine, Stirlingengines reacts slowly to changes in work load. Consequently, Stirling engines are often considered inappropriatefor use in the automotive industry [36].
Last, a major disadvantage of Stirling engines is that they require a high gauge pressure in order to obtain asufficient rated power. Added to this, diffusive gases such as helium or hydrogen are often used as the workingfluid. High pressures are always associated with high demands on piston rings and other components beingused to seal the engine from the environment [36].
7


3 Combustion of gaseous fuels
This chapter will serve as an introduction to combustion of gaseous fuels. First, the four fuels used in thisinvestigation will be defined. Special attention is directed towards the complications and benefits provided byusing fuels having a low calorific value. Further, a brief summary of previous research on low calorific fuel as aheat source will be provided. Last, a description of MILD combustion technology is presented.
3.1 Definition of the selected fuels
Four different gaseous fuels were chosen to be a part of this study, Table 3.1.
Table 3.1: Gas composition of selected fuels [molar%]
Liquid propane gas Natural gas Synthesis gas Landfill gasCH4 - 86.0 1.5 20.0C2H6 0.7 - - -C3H8 98.1 - - -C4H10 ≤ 1.2 - - -H2 - - 18.0 -CO - - 23.5 -CO2 - - 9.0 20.0N2 - 14.0 48.0 60.0
One representation of a fuel with high calorific value was provided in liquid propane gas, LPG in short.However, small quantities of other carbon chained molecules also occurred in this compound. Another secondrepresentation of a high calorific fuel was made by G25 natural gas. By definition, G25 natural gas, herebydenoted natural gas, has a methane concentration of 86 molar percent in nitrogen [4].
Wood producer gas served as a representation of a fuel with a low calorific value. Being primarily comprisedof hydrogen, carbon monoxide and carbon dioxide it may also be referred to as a synthesis gas [27]. Further,this gas included some traces of methane and a large share of nitrogen.
A second representation of a fuel with low calorific value was provided in landfill gas, which was comprisedof methane and carbon dioxide in nitrogen. It should be stressed that the amount of carbon dioxide in thestudied gas was lower than that of conventional landfill gas. This modification was made due to problems withgas condensation in gases with high content of carbon dioxide at elevated pressures. However, the calorificvalue of the gas remained representative for landfill gas.
3.2 Low calorific gaseous fuels
Wood producer gas is derived from biomass in a process called pyrolysis, in which part of the biomass iscombusted in an environment with a restricted oxygen supply [1]. Pyrolysis products include gases, vapours,liquids, oils, solid char and ash. The process output depends on the temperature, the oxygen environmentand the characteristics of the input material. In cases where a combustible gas is the desired output, one mayinstead refer to gasification, which is essentially pyrolysis adapted for optimal secondary gas production. Theefficiency of the process is calculated by dividing the heat of combustion of the secondary fuel by the heat ofcombustion of the primary fuel. The efficiency of producer gas generation from biomass may be as high as 80percent, since a significant part of the initial energy from biomass is in the form of combustible hydrogen andcarbon monoxide [35].
Anaerobic digestion is the process that governs the production of landfill gas. In an oxygen depletedenvironment, micro-organisms meet their need for energy by reacting with carbonaceous compounds to formmethane and carbon dioxide [23]. The efficiency of biogas generation from landfill is ranging from 60 to 90percent [35]. Still, one has to keep in mind that landfill or sewage gas is generally obtained from slurries with asignificant water content. Thus, no energy could be conveniently extracted without anaerobic digestion. Inother words, the volume of waste requiring disposal is reduced while transforming waste material into a flexibleenergy carrier [31].
9

3.2.1 Characteristics
Fuels having a low calorific value generally have similar features. Even though they are made up of differentcompounds, they all share the feature of having a low percentage of combustibles.
Problems may arise when low calorific fuels are used in conventional combustion devices. A low heatingvalue directly translates into a low flame temperature, thus resulting in slower combustion kinetics within thecombustion device [25]. Further, gases with a high nitrogen content generate combustion products with a highnitrogen content, thus producing a product gas with lower thermal emissivity [12]. Consequently, a smalleramount of the released heat is accepted by the combustion device. Last, combustion of low calorific fuels resultin a higher volume of combustion products. Thus, insufficient residence time may not only lead to incompletecombustion, but also decreased heat transfer due to a decreased residence time adjacent to the heat acceptingareas in the combustion device.
During combustion of fuels with low calorific value, supplementary firing may be required should thetemperature drop lower than what is necessary to sustain combustion [3]. If the flame temperature of the fuelis sufficient in order to sustain combustion, a supplementary fuel source may still be required initially. Becauseof the low temperature in the combustion device before thermal equilibrium has been reached, unwanted flamequenching may result if the heat supply is insufficient.
Another lineament is the variability of fuel constituents. Variations in the processes producing these gasesoccur, namely variations in biomass composition supplied to the gasifier or varying conditions at the landfill site.Further, the fact that wood producer gas is made up by five main substances of different characteristics makesit inconvenient to compress [35]. This is also true for landfill gas due to the high content of carbon dioxide.
Apart from the primary constituents of a low calorific gaseous fuel such as wood producer gas or landfillgas, there are several trace compounds to consider [2, 14]. Monitoring trace compounds is important not onlybecause of the existence of legislative restrictions on emissions of these compounds, but also because of possiblethreats to the integrity of the combustion device.
3.2.2 Applications
Information on the application of low calorific gaseous fuels as a heat source for Stirling engines is scarce.Unsurprisingly, the application of low calorific fuels is primarily restricted to more commercially maturetechnologies on the energy market. For example, successful operation has been accomplished while using lowcalorific fuels in gas turbines and internal combustion engines [2, 9, 21, 24, 25, 32, 34].
3.3 MILD combustion
The technology used for fuel oxidation in these experiments is a combustion technology referred to as moderateor intense low-oxygen dilution, MILD. Other denotations for this technology is flameless oxidation, FLOX [41],or high temperature air combustion, HTAC [43]. A. Cavaliere and M. de Joannon defined MILD combustion asa process in which both the inlet temperature of the reactant mixture and the maximum allowable temperatureincrease during combustion do not exceed the self ignition temperature of the mixture [7]. The self-ignitiontemperature is defined as the inlet temperature at which any additional temperature increase makes thechemical process self-sustaining. This occurs since a higher branch in the S-shaped curve governing ignitioncharacteristics is reached [13].
In order to obtain MILD combustion, flue gases are recycled, intending to dilute the supplied oxidiser.The oxygen concentration of the oxidiser is decreased as combustion products are mixed into the oxidiser,thus resulting in slower combustion kinetics, which in turns limit the rapid characteristics of conventionalflame propagation [3]. Further, the recycled flue gases add heat capacity to the compound, thus limiting themaximum temperature increase.
One key difference between MILD combustion and conventional combustion, which is associated with asignificant heat release under chaotic conditions, is that the former requires preheating of the reactants in orderto sustain combustion. Further, apart from conventional combustion being characterised by flame propagation,a combustion system operating at MILD conditions lacks a distinct shift between unoxidised and oxidisedconditions [7].
Advantages of MILD combustion include an enlarged reaction zone as combustion is spread over a largervolume, thus resulting in lower peaks in flame temperature. Reduced flame temperature translates to reducedformation of nitric oxides and nitrogen dioxide, whereas a larger volume is equivalent to more complete
10

combustion, thus reducing the formation of carbon monoxide [38]. A combustion device operating at MILDconditions, which lacks peaks in flame temperatures due to a larger combustion zone, has a more uniformtemperature profile. Thus, fluxes in radiative heat transfer are more uniform, which simplifies the predictionof heat transfer performance [39]. Further, the larger volume of combustion enables greater mixing and thushigher thermal efficiency [5, 42, 44]
Despite the obvious advantages connected to MILD combustion, one substantial problem is present. Giventhe fact that the reactants are mixed at an elevated temperature, there is a potential risk of spontaneouscombustion of the reactant mixture prior to reaching the primary combustion zone [5]. The result may bea flashback and flame stabilisation at the injector, thus deviating from the desired performance due to theoccurrence of a flame. A flashback may also result in hazardous physical damage to the combustion device [3].The gas composition is a decisive factor in determining the temperature at which spontaneous combustionoccur. Thus, information on auto-ignition temperatures for the selected fuels is essential in order to guaranteea process with MILD combustion characteristics.
Further, the auto-ignition time for a fuel in a MILD combustion device is significantly dependent on theconcentration of carbon dioxide in the reactants. Carbon dioxide inhibits the chemical reaction rate due to thedecreased amount of the free radicals O, H and OH, thus decreasing the oxidation rate of methane and othercombustibles [5]. Landfill gas and synthesis gas are both comprised of considerable amounts of carbon dioxide.Thus, complications to obtain complete combustion may occur if the flue gas recirculation is not compensatedproperly.
The oxidisation of biogas using MILD combustion technology has been experimentally tested in a lab-scalefurnace by S. Hosseini and M. Wahid. Conclusions include reduction in pollutant formation compared toconventional combustion and increased durability of exposed equipment due to decreased thermal stress [16].M. Sanchez, F. Cadavid and A. Amell concluded that flameless characteristics can be obtained for methanecombustion at enriched oxygen concentrations, thus enabling oxy-fuel combustion [30]. The effect of hydrogenblending to increase the calorific value of the fuel has been investigated by S. Chen and C. Zheng, concludingthat only minor fuel alterations appear necessary for a counterflow diffusion flame operating at MILD conditions[10]. A. Colorado, B. Herrera and A. Amell discovered that efficiencies where similar for combustion of naturalgas and biogas in a furnace operated at MILD conditions. Thus, the interchangeability of these fuels appearedto be eased when operating at MILD conditions [12]. However, great differences in heat transfer patterns wherenoticed due to differences in flue gas composition.
11


4 Method
This chapter presents the methodology used for testing the four gaseous fuels. First, the thermodynamicrelationships required for calculating the performance of the combustion device and the Stirling engine arepresented. Second, the interchangeability of the four fuels is discussed, coupled with a description of theconstraints to engine operation. Last, information about the test installation is laid out.
4.1 Performance evaluation of the combustion device
A combustion device operating at MILD conditions requires preheating of the oxidiser, Chapter 3.3. Thus,in a C9G Stirling engine, the supplied air is heat exchanged with the flue gas stream before the flue gasesare released to the exhaust pipe. The heated air stream is then mixed with the fuel as it is ejected into themixing tube. Here, the gas mixture is diluted with recirculated flue gases in order to decrease the oxygenconcentration of the mixture, as well as to increase the mixture’s heat capacity. As a result, the pattern ofchaotic temperature increase following combustion is reduced. After oxidisation, useful heat is extracted fromthe combustion device as the gases passes through a heat exchanger, which is the heater head of the Stirlingengine. A schematic description of the combustion device is presented in Figure 4.1.
Preheater
Insulation
Mixing tube
ExhaustTfg,e
Air supplyTair,amb
Fuel supply
Heater head
Thermocouple
Figure 4.1: The schematics of the combustion device and the position of the installed equipment for temperaturemeasurements.
The control volume for evaluating engine performance was drawn around the entire combustion device.From a system perspective, energy is entering the system in the form of thermal energy in the fuel and airstreams, as well as chemical bond energy in the fuel stream. The exiting energy flows are associated with theuseful heat extracted by the heater head, the heat losses through the insulation of the combustion device andthe exhaust gas losses. Further, all reactants enter the system at the ambient conditions of the test cell. Thus,the heat flow associated with the thermal energy of the fuel and air streams was eliminated by using ambientconditions as the reference state. Heat transfer through the preheater was considered to be occurring withinthe system boundaries.
4.1.1 Heat addition
Heat addition was calculated based on the energy released by combustion, Qi. Under the assumption ofcomplete combustion, Equation (4.1), the mass flow of combustion products, mfg, can be determined by
measuring the volume flow rate of fuel, Vf . Then, by considering the heat of formation, hf , this allows forcalculating the heat release, Equation (4.2). This calculation was carried out for all species of combustionproduct, np. In order to verify the accuracy of the calculated flue gas composition, the calculated heat releasewas compared to the expected heat release based on the lower heating value of the fuel. Additional verification
13

was obtained by determining conservation of mass.
CaHbOcNd+(a+b
4− c
2)λ(O2+3.773N2) =⇒ aCO2+
b
2H2O+3.773λ(a+
b
4+d
2)N2+(λ−1)(a+
b
4− c
2))O2+Qi
(4.1)
Qi =
n∑j=1
(Hr,j − Hp,j
)=
n∑j=1
nr,jhf,r,j −n∑
j=1
np,jhf,p,j [W] (4.2)
4.1.2 Heat rejection
Determining the molar fractions of the combustion products further allows for calculating the heat rejected bythe exhaust gases leaving the combustion device, Qe. Proper evaluation of the specific heat, cp,fg, coupledwith measurements of the exhaust gas temperature, Tfg,e, and the reference temperature, Tref , were used todetermine the heat rejection through the exhaust pipe, Equation (4.3).
Qe =
n∑j=1
mfg,j (hfg,e,j − hfg,ref,j) =
n∑j=1
mfg,jcp,fg,j (Tfg,e − Tref ) [W] (4.3)
In a similar manner, the useful heat recovery was calculated from an energy balance over the heater head ofthe Stirling engine, Equation (4.4). To facilitate this, the flue gas temperature was measured prior to, Tfg,phh,and after, Tfg,ahh, passing through the heater head of the Stirling engine.
Qu =
n∑j=1
mfg,j (hfg,phh,j − hfg,ahh,j) =
n∑j=1
mfg,jcp,fg,j (Tfg,phh − Tfg,ahh) [W] (4.4)
4.1.3 Other losses
A summation of all energy flows, Figure 4.1, did not completely equal the total heat input. The remainder ofthe expected heat supply which remained unaccounted for was due to heat losses through the insulation of thecombustion device and possible losses due to incomplete combustion of the fuel. These additional heat losses,Qo,c, were determined by subtracting the useful heat and the heat rejected by the exhaust gases from the heatinput, Equation (4.5).
Qo,c = Qi − Qu − Qe [W] (4.5)
4.1.4 Combustion efficiency
A principal step in evaluating the performance of the combustion device is to determine the combustionefficiency, being defined as the ratio of the useful heat extraction, Qu, and the total potential heat release basedon the chemically bond energy available in the fuel, Qi, Equation (4.6), [3].
ηc =Qu
Qi
(4.6)
4.1.5 Internal heat balance
The indirect effect of preheating in MILD combustion will result in a higher combustion efficiency, Chapter 3.3.Thus, in the C9G Stirling engine, heat is transferred from the flue gas stream to the air supply stream withinthe system boundaries of the combustion device. The amount of heat transferred from the flue gas streamthrough the preheater, Qp,fg, was calculated by setting up an energy balance over the preheater, Equation(4.7), thus applying the same procedure as for calculating the heat rejection, Chapter 4.1.2. In order to evaluate
14

this, the flue gas temperature was measured prior to the preheater, Tfg,fgr, as well as after, Tfg,e. The lattertemperature is the exhaust gas temperature of the combustion device.
Qp,fg =
n∑j=1
mfg,j (hfg,fgr,j − hfg,e,j) =
n∑j=1
mfg,jcp,fg,j (Tfg,fgr − Tfg,e) [W] (4.7)
Further, conservation of energy concludes that the air supply will accept any heat being rejected by the fluegases, Equation (4.8).
Qp,fg = Qp,air (4.8)
Thus, the outlet temperature of the preheated air stream, Tair,ph, can be calculated by interpolation,Equation (4.9). The mass flow of air, mair, was calculated using the assumption of complete combustioncoupled with a measurement of the air to fuel ratio, Equation (4.1). The enthalpy of the air supplied to thepreheater was denoted as the ambient temperature, Tair,amb.
Qp,air =
n∑j=1
mair,j (hair,ph,j − hair,amb,j) =
n∑j=1
mair,jcp,air,j (Tair,ph − Tair,amb) [W] (4.9)
The fluid having the lowest heat capacity will have the highest temperature increase or decrease. Hence,the maximum amount of heat transfer possible between the two streams was calculated by letting the fluidwith the lowest heat capacity operate between the inlet temperatures of both streams, Equation (4.10).
Qp,max =
n∑j=1
(mjcp,j)min (Tinlet,fg − Tinlet,air) =
n∑j=1
(mjcp,j)min (Tfg,fgr − Tair,amb) [W] (4.10)
The preheater performance can then be fully assessed by calculating the effectiveness of the heat transfer,Equation (4.11) [15]. The effectiveness is the ratio of the actual heat transfer, Qp,air, and the maximum heat
transfer possible between the two streams, Qp,max.
ε =Qp,air
Qp,max
(4.11)
Finally, in order to verify the accuracy of these calculations, a separate calculation of the effectiveness wascarried out using the NTU-method [17, 15].
4.1.6 Additional remarks
In addition to the above, mapping the temperature patterns of the entire combustion process would proveinteresting. If a uniform temperature profile throughout the entire primary combustion zone was discovered,this would confirm that the combustion device operates at MILD conditions. However, the thermocouplesavailable for engine testing were considered insufficient for this task due to the expected heat release.
4.2 Performance evaluation of the Stirling engine
In evaluating a Stirling engine, four energy flows of primary interest were identified. These flows are related tothe four steps in the Stirling cycle, namely heat addition, heat rejection, expansion work and compression work,Figure 4.2. The heat addition is the useful heat extracted from the combustion device, Qu, Chapter 4.1.2.
4.2.1 Heat rejection
Heat rejection from the internal cooling system, Qc, was calculated based on the difference in enthalpy flowof the inlet and the outlet stream, Equation (4.12). The inlet and outlet temperatures, Tc,i, Tc,o, of the heat
exchanger were continuously measured. In addition to this, the volume flow rate of the cooling fluid, Vc, thespecific heat, cp,c, and density, ρc, of the cooling fluid was determined.
Qc = mc (hc,o − hc,i) = mccp,c (Tc,o − Tc,i) = ρcVccp,c (Tc,o − Tc,i) [W] (4.12)
15

Figure 4.2: The energy flows of a Stirling engine.
4.2.2 Expansion and compression work
The time derivative of the shaft work, Ps, which is the net difference of the time derivatives of the expansionand the compression work, Wexp, Wcomp, was evaluated by measuring the break moment, or torque, τ , androtational speed, nrev, Equation (4.13).
Ps = Wexp − Wcomp = ωτ =2πnrevτ
60[W] (4.13)
The indicated work was calculated by combining the work of the buffer gas channel and the cylinder volumes.In order to achieve this, pressure data, p, was extracted from locations within the engine and converted intoa cycle average spanning the complete angular revolution. However, due to the low impact of the buffer gaschannel on the indicated work, found in previous test series on the engine, pressure data was not extracted forthis volume. Hence, pressure data was only obtained from the two cylinders. Further, the geometry of theengine coupled with the sinusoidal appearance of revolution determines the volume of each of these locations,V , at each point of revolution. With this obtained, the volumetric work per unit time can be calculated for thetwo pistons, Equation (4.14).
Pi =
n∑j=1
Wi,j =
n∑j=1
∫ V
V0pj dVj
dt[W] (4.14)
The heat rejected through friction losses, Qf , can be determined by calculating the difference betweenthe indicated power and the shaft power, Equation (4.15). However, most of the heat losses by friction wasincluded in the heat rejected by the internal cooling system, Qc .
Qf = Pi − Ps [W] (4.15)
4.2.3 Other losses
As was the case with the combustion device, a summation of all energy flows, Figure 4.2, will not completelyequal the heat input. In a similar manner, all energy flows were subtracted from the useful heat extracted fromthe combustion device in order to determine the additional heat losses, Qo,s, Equation (4.16).
Qo,s = Qu − Qc − Ps [W] (4.16)
16

4.2.4 Thermal efficiency
Thermal efficiency was calculated based on two perspectives. First, the system boundary was restricted to thatof the Stirling engine, Figure 4.2. In this case, the thermal efficiency of the Stirling engine, ηs, was defined asthe ratio of useful power generated, Ps, over the supplied heat, Qu, Equation (4.17).
ηs =Ps
Qu
(4.17)
Another interpretation is to consider the global system, including both Stirling engine and combustion device.Thus, the thermal efficiency of the entire system, ηc+s, was defined by ratio of the useful power generated, Ps,over the chemically bond energy in the fuel, Qi, Equation (4.18).
ηc+s =Ps
Qi
(4.18)
The Carnot efficiency is the maximum efficiency obtainable between two temperature reservoirs of finitetemperature, Equation (4.19) [8]. The finite temperature of the heat source was approximated by the averagetemperature over the heater head. Similarly, the finite temperature of the heat sink was approximated by theaverage temperature over the external cooling stream.
ηC = 1− TCTH
= 1− (Tc,e,i, Tc,e,o)mean
(Tfg,phh, Tfg,ahh)mean(4.19)
4.3 Interchangeability of the selected fuels
The Wobbe index, IW , compares the calorific value, VC , of a fuel with respect to the specific density, GS ,Equation (4.20) [29]. For a combustion device operating at the same pressure and valve setting, only smallvariations in heat output can be expected for two fuels having similar Wobbe indices [33]. Additional fuelproperties required for calculation of the Wobbe Index is presented in Table 4.1.
IW =VC√GS
[MJ m−3] (4.20)
Table 4.1: Characteristics of selected fuels at atmospheric pressure, 298.15 [K].
Liquid propane gas Natural gas Synthesis gas Landfill gasLHV 46.34 38.94 4.96 5.57 [MJ kg−1]
91.26 30.78 5.45 7.16 [MJ m−3]HHV 50.32 43.22 5.34 6.18 [MJ kg−1]
99.13 34.16 5.86 7.95 [MJ m−3]ρf 1.80 0.72 1.01 1.18 [kg m−3]GS 1.52 0.61 0.85 0.99 [ ]IW,LHV 73.93 39.36 5.91 7.18 [MJ m−3]IW,HHV 80.30 43.68 6.36 7.97 [MJ m−3]
The synthesis gas and the landfill gas had significantly lower Wobbe indices than the primarily propane andmethane based fuels. Thus, a significant increase in fuel input was required, when using low calorific fuels,to produce the same thermal input compared to high calorific fuels. Hence, the fuel flow rate was adjustedaccordingly in order to ensure that suitable temperatures were obtained within the Stirling engine. However,the combustion device sets an upper limit for both volume flow through the fuel nozzles, Vf , and total volume
flow through the combustion device, Vfg.Indirectly, even the latter constraint sets the limit of how much fuel the engine can accept. A large volume
flow rate of fuel would result in a large volume flow of combustion products passing through the engine. Further,this constraints also affects the maximum allowable air to fuel ratio. However, the air to fuel ratio was alsolimited due to the fact that a high oxygen concentration will put the engine outside the MILD combustionregion. Flue gas flows in the region of 60 m3 h−1 have been recorded during a previous test schedule. Hence,
17

this constraint was regarded as less critical to engine operation. An additional constraint to engine operationwet set by the minimum and maximum allowable engine charge pressure of 30 bar and 150 bar respectively.
Given the above constraints, a lower maximum thermal input was expected for the two low calorific fuels.Consequently, the engine charge pressure had to be reduced to make sure that the heat extraction from theheat accepting surface did not exceed the heat released by the fuel. The maximum heat input for the fuels withhigh calorific value was limited by the maximum allowable charge pressure, 150 bar, whereas the governingconstraint for low calorific fuels was the limitation of the fuel flow through the preheater nozzles, as well as theminimum allowable charge pressure of 30 bar.
4.4 The engine installation
During engine testing, the gases were tested at different charge pressures. Further, the impact of changing theair to fuel ratio on engine performance was measured for all fuels at these charge pressures, thus resulting inadditional data points. The complete test schedule is presented in Appendix A. No variations in engine speedwere made since the engine should operate at 1500 rpm in order to facilitate electricity generation at 50 Hz.The shaft of the Stirling engine was mounted onto a break, which controlled the rotational speed of the engine.The fuel system was supplied by liquid propane gas during the warm-up period of the engine. Then, when theengine had reached sufficient temperature, a manual valve was used to switch fuels.
4.4.1 The air supply
A thermocouple adjacent to the air filter was used to determine the temperature at the air inlet. Thistemperature was also assumed for the fuel inlet. Further, this measurement also served as the thermodynamicreference temperature.
4.4.2 The combustion system
The fuel flow of liquid propane gas was measured by a flow rate monitor supplying 10 L of fuel per pulse.However, the fuel flow rate was expected to be higher than the maximum allowable flow rate for this monitordevice during operation with low calorific fuels. Hence, a pulse monitor supplying 100 L of fuel per pulse wasused for all fuels other than liquid propane gas. Further, a substantial pressure regulation was provided toreduce the pressure in the fuel bottles to pressures between 15 mbar to 200 mbar, where the former is associatedwith high calorific fuels and the latter with low calorific fuels respectively.
Three categories of temperature measurements were carried out in the flue gas chain of the combustiondevice. First, continuous temperature measurements were carried out prior to and after the heater head of theStirling engine in order to determine the combustion efficiency. Second, the temperature difference over theflue gas side of the preheater was determined in order to calculate the effectiveness of the preheater. Last, thetemperature of the exiting flue gas stream was used to determine the heat losses to the environment.
4.4.3 The cooling system
The volume flow rate of the cooling fluid was not measured continuously. This decision was based on the factthat for this particular engine, the flow rate of the coolant remains constant, regardless of heat input. However,it is important to note that the composition of ethylene glycol and water affects the fluid properties of thecoolant, which in turns affects the volume flow rate. By using the same concentration as was used duringprevious tests, an equal volume concentration of water and ethylene glycol, the flow rate of the coolant wasdetermined to be 1.5 m3 h−1. Further, by converting the volume concentration into mass fraction, a density of1061 m3 kg−1 and a specific heat of 3241 J kg−1 K−1 was determined. At last, thermocouples were mounted tothe inlet and the outlet pipes of the heat exchanger of the internal cooling system for continuous temperaturemeasurements.
4.4.4 The external cooling system
The constraint set on the external cooling system was based on the volume flow rate and the temperatureof the process water. Throughout all test series, 5 m3 h−1 of process water, at a temperature of 17 ◦C, wascontinuously supplied to the heat exchanger. This decision was based on the fact that a high flow rate of
18

process water ensured a relatively constant temperature of the coolant in the internal cooling system, regardlessof engine charge pressure. Thus, no major changes in Carnot efficiency occurred. As a result, a fair comparisonof the system efficiencies at various engine charge pressure could be made.
4.4.5 Verification of thermal equilibrium
The thermocouple located in the exhaust pipe was used to ensure that the engine reached thermal equilibriumbefore any data was extracted. This decision was based on the fact that flue gas temperature in the exhaustpipe proved to have a slow reaction to system changes. Thermal equilibrium was confirmed when the arithmeticmean of the collected temperature data deviated less than one degree Kelvin over five minutes.
4.4.6 Limitations
The thermocouples used for temperature measurements was not rated for temperatures exceeding 1200 ◦C.Since temperature measurements immediately after combustion was considered impossible, measurements wereinstead attempted further downstream in the flow direction of the combustion device, at the point after whichthe flue gases has been diverted by the back wall. Still, the uncertainty of the integrity of the thermocoupleslocated at this position was high, since the flue gases had not yet been allowed any substantial temperaturereduction.
4.5 Equipment for data acquisition
Temperature measurements were obtained using type K thermocouples, connected to a cDAQ-9188 dataacquisition unit by National Instruments. The thermocouples were tested in glass filled with a mixture of iceand water at 0 ◦C to confirm their accuracy. The same data acquisition unit was also used to collect continuousmeasurements of the break moment and the flow rate of fuel.
The cylinder pressure was obtained by pressure sensors of two different brands. A Kistler Model 701AQuartz pressure sensor was used in the cold cylinder, where temperatures are moderate. In the warm cylinder,where temperatures are elevated, a Kulite Model WCT-312M-210BARA pressure transducer was used. TheKulite pressure transducer and the Kistler pressure sensor was calibrated with a HBM RM4220 amplifier and aKistler charge amplifier type 5011 respectively. Finally, these signals were acquired via IndiCom through anIndiMaster.
The engine was controlled by a MODBUS protocol, which extracts further pressure and temperature data.This protocol also acquires the speed of revolution and the air to fuel ratio of the engine. A list of all data tobe collected as well as the data acquisition system used is presented in Appendix B.
19


5 Results
This chapter presents the results obtained from this study. First, notes are made about the completion of thetest schedule. Second, the energy flows of the combustion device and the Stirling engine are characterised andquantified. In later sections, the air to fuel ratio’s impact on the energy flows is presented. Last, commentsabout the overall stability of operation are made.
5.1 Completion of the test schedule
Tests were successfully completed for liquid propane gas and natural gas. A fuel pressure in the region of 15 mbarand 45 mbar was supplied to the engine while operated by liquid propane gas and natural gas respectively. Themaximum charge pressure of the engine, while operated by natural gas, was set to 130 bar bar due to vibrationscaused by the measurement equipment attached to the shaft. Further, the flow meter used to measure the fuelflow rate of liquid propane gas delivered inconsistent data at low flow rates. Thus, in order to ensure consistentdata extraction, the lowest engine charge pressure was set to 55 bar while the engine was operated by liquidpropane gas.
Fuel switching from liquid propane gas to a low calorific gaseous fuel during engine operation was attemptedfor an engine charge pressure of 30 bar, which is the lowest set point allowed by the engine. Engine operationwas successfully maintained while using landfill gas as the fuel source. However, operation failed when the airto fuel ratio was taken below 1.93. At lower air to fuel ratios, the exhaust gas temperature rose to a level atwhich an error code was generated by the engine. This error code activation triggered an automatic procedureto shut down the engine.
The increased exhaust gas temperature was the result of the increased fuel flow rate associated withcombustion of low calorific gaseous fuels. The high flow rate through the fuel nozzles, 5.5 m3 h−1, generated afuel stream of high velocity, which was not completely affiliated by the air stream. As a result, part of thefuel was transported backwards through the flue gas recirculation cavities and combusted just adjacent to theinlet of the preheater. Since the flow rate of the air supply remained virtually constant, the increased amountof energy prior to the preheater could not be transferred to the inlet air at much greater extent. Thus, theexhaust temperature increased, resulting in increased flue gas losses and eventually an error code activation.
Combustion of the synthesis gas was not attempted because of the hazard of carbon monoxide poisoning. Itwas determined that testing of this gaseous fuel could not be made since leakage of liquid propane gas from thesystem had been observed during earlier test series. This leakage was primarily noticed during the start up ofthe engine, thus presumably originating from the outflow of non combusted fuel in the exhaust pipe due toinadequate suction pressure.
1 1.2 1.4 1.6 1.8 2 2.20.2
0.4
0.6
0.8
1
1.2
1.4
1.6
1.8
Air to f ue l rat io, λ [ ]
Norm
alise
dfu
elin
put,
Qi[]
LPG P = 150 [bar]
LPG P = 100 [bar]
LPG P = 55 [bar]
G25 P = 130 [bar]
G25 P = 100 [bar]
G25 P = 50 [bar]
Landfill gas P = 30 [bar]
(a)
1 1.2 1.4 1.6 1.8 2 2.21000
2000
3000
4000
5000
6000
7000
8000
9000
10000
11000
Air to f ue l rat io, λ [ ]
Shaft
work
,P
s[W
]
LPG P = 150 [bar]
LPG P = 100 [bar]
LPG P = 55 [bar]
G25 P = 130 [bar]
G25 P = 100 [bar]
G25 P = 50 [bar]
Landfill gas P = 30 [bar]
(b)
1 1.2 1.4 1.6 1.8 2 2.20.6
0.8
1
1.2
1.4
1.6
1.8
2
2.2x 10
4
Air to f ue l rat io, λ [ ]
Heatre
jecte
dby
thecoolingsy
stem,Q
c[W
]
LPG P = 150 [bar]
LPG P = 100 [bar]
LPG P = 55 [bar]
G25 P = 130 [bar]
G25 P = 100 [bar]
G25 P = 50 [bar]
Landfill gas P = 30 [bar]
(c)
Figure 5.1: Fuel input(a), shaft power(b) and heat rejected by the cooling system(c) as a function of air to fuelratio. Each curve represents a specific fuel and pressure setting. (a) is normalised with respect to the propertyobtained while operating the engine by liquid propane gas at a charge pressure of 100 bar and an air to fuelratio of 1.32.
21

5.2 Energy flows
The heat input from the fuel, Qi, the heat rejected by the exhaust gases, Qe, the useful heat accepted by theheater head, Qu, the heat transfer through the preheater, Qp, the heat rejected by the cooling system, Qc, andthe shaft power, Ps, were determined from the data extracted by the acquisition systems. All but one energyflow, the useful heat accepted by the heater head, Qu, where within expected ranges. The useful heat acceptedby the heater head was much smaller than anticipated, indicating a value of only half the combined energyflows of the cooling system and the shaft of the Stirling engine. Clearly, more heat was transferred through theheater head compared to what was estimated by use of Equation (4.4). Hence, Qu, is from now on referred toas the heat transfer through the preheater originating from combustion occurring prior to the heater head only,or prompt combustion, Qcomb,prompt. An explanation of the remaining part of the heat transfer through theheater head is attempted in Chapter 6. Consequently, given the uncertainties regarding the heat extracted bythe heater head, the combustion efficiency, Equation (4.6), could not be determined.
The energy flows of the combustion device and the Stirling engine is presented by Sankey charts. The energyflows of the combustion device for all successful test points are presented in Appendices C, D and E.
5.3 Influence of the air to fuel ratio
There was a visible trend of reduced system efficiency for reduced air to fuel ratios. The reduced fuel input as afunction of air to fuel ratio for all tested fuels is presented in Figure 5.1a. A decreasing fuel input at higher airto fuel ratios appeared for all fuels and pressure settings. However, the effect appeared to be less predominantat low charge pressures. At the same time as the air to fuel ratio was reduced, only small changes in shaftpower were noted, Figure 5.1b. Further, these variations were not following any distinct pattern. In consistencywith the low correlation between air to fuel ratio and shaft power, changes in the heat rejected by the coolingsystem are slight, Figure 5.1c.
1 1.2 1.4 1.6 1.8 2 2.2500
1000
1500
2000
2500
3000
3500
Air to f ue l rat io, λ [ ]
Heatre
jecte
dby
theexhaust
gase
s,Q
e[W
]
LPG P = 150 [bar]
LPG P = 100 [bar]
LPG P = 55 [bar]
G25 P = 130 [bar]
G25 P = 100 [bar]
G25 P = 50 [bar]
Landfill gas P = 30 [bar]
(a)
1 1.2 1.4 1.6 1.8 2 2.22000
4000
6000
8000
10000
12000
14000
16000
Air to f ue l rat io, λ [ ]
Heattransferth
rough
thepre
heate
r,Q
p[W
]
LPG P = 150 [bar]
LPG P = 100 [bar]
LPG P = 55 [bar]
G25 P = 130 [bar]
G25 P = 100 [bar]
G25 P = 50 [bar]
Landfill gas P = 30 [bar]
(b)
1 1.2 1.4 1.6 1.8 2 2.21300
1350
1400
1450
1500
1550
1600
Air to f ue l rat io, λ [ ]
Tempera
ture
priorto
theheate
rhead,Tfg,p
hh[K
]
LPG P = 150 [bar]
LPG P = 100 [bar]
LPG P = 55 [bar]
G25 P = 130 [bar]
G25 P = 100 [bar]
G25 P = 50 [bar]
Landfill gas P = 30 [bar]
(c)
Figure 5.2: Heat rejected by the exhaust gases(a), heat transferred through the preheater(b) and temperatureprior to the heater head(c) as a function of air to fuel ratio. Each curve represents a specific fuel and pressuresetting.
The shaft power and the heat rejected by the cooling system remained virtually unchanged. Thus, theincreased fuel input at low air to fuel ratios only contributed to increasing losses. The losses within the Stirlingengine itself were assumed to be mostly unchanged, given that the Stirling engine remained at a constantspeed and almost at the same power output, regardless of fuel input. Hence, most of the difference in overallperformance caused by a varied air to fuel ratio was presumed to be due to changes in the performance of thecombustion device, rather than changes in the Stirling engine.
In the combustion device, the heat rejected by the exhaust gases showed a decreasing trend for increasing airto fuel ratios at high engine pressures, Figure 5.2a. However, no consistent behaviour was discovered. Further,the heat transfer through the preheater, occurring within the system boundaries of the combustion device,seems to be unaffected by the air to fuel ratio, Figure 5.2b.
The change in temperature prior to the heater head of the Stirling engine with respect to air to fuel ratio ispresented in Figure 5.2c. Most of the regulation of air to fuel ratio in a C9G Stirling engine is due to changesin the amount of fuel being supplied to the engine, rather than changes in the air supply. Hence, an increased
22

combustion temperature was discovered at the same time as the amount of fuel was decreased. However, whenthe engine was operated by natural gas at a low engine charge pressure, 50 bar, a decrease in the temperatureprior to the heater head was noted at high air to fuel ratios.
The fraction of fuel combusted prior to the heater head increased at high air to fuel ratios, although theamount of fuel combusted prior to the heater head remained virtually unchanged. This characteristic held forall tested fuels and engine charge pressures, Figure 5.3a. The part of the fuel that was not combusted prior tothe heater head is either combusted during its residence time adjacent to the heater head or after leaving theheater head. In the latter case, the released heat was either recirculated to the heater head, transferred to thecombustion air through the preheater, transferred to the surroundings through the insulation or dischargedthrough the exhaust pipe.
The impact of the air to fuel ratio on the system efficiency is demonstrated in Figure 5.3b. The trend ofincreasing system efficiency at high air to fuel ratio held for both liquid propane gas and natural gas. However,this correlation appeared to be smaller when the engine was operated by natural gas at low charge pressures.
1 1.2 1.4 1.6 1.8 2 2.20.8
0.9
1
1.1
1.2
1.3
1.4
1.5
Air to f ue l rat io, λ [ ]
Norm
alise
dpro
mptcombustion
efficiency,Q
u/Q
i[]
LPG P = 150 [bar]
LPG P = 100 [bar]
LPG P = 55 [bar]
G25 P = 130 [bar]
G25 P = 100 [bar]
G25 P = 50 [bar]
Landfill gas P = 30 [bar]
(a)
1 1.2 1.4 1.6 1.8 2 2.20.5
0.6
0.7
0.8
0.9
1
1.1
1.2
1.3
Air to f ue l rat io, λ [ ]
Norm
alise
dsy
stem
efficiency,ηtot[]
LPG P = 150 [bar]
LPG P = 100 [bar]
LPG P = 55 [bar]
G25 P = 130 [bar]
G25 P = 100 [bar]
G25 P = 50 [bar]
Landfill gas P = 30 [bar]
(b)
Figure 5.3: Ratio of the useful heat combusted prior to the heater head versus fuel input(a) and systemefficiency(b) as a function of air to fuel ratio. Each curve represents a specific fuel and pressure setting. (a)and (b) are normalised with respect to the property obtained while operating the engine by liquid propane gas ata charge pressure of 100 bar and an air to fuel ratio of 1.32.
0 50 100 1501.1
1.15
1.2
1.25
1.3
1.35
1.4
1.45
1.5
1.55
1.6
T ime , t [ s ]
Air
tofu
elra
tio,λ
[]
λ = 1.17λ = 1.33λ = 1.55
Figure 5.4: Observed air to fuel ratio while operated by liquid propane gas at a charge pressure of 100 bar atdiffering air to fuel ratios.
23

5.4 Stability of operation
The engine had difficulties to maintain a steady air to fuel ratio when forced to operate outside the predeterminedair to fuel ratio schedule. The measured air to fuel ratio while operated at a charge pressure of 100 bar ispresented in Figure 5.4. The air to fuel ratio set point of the smoothest curve is 1.33, which is also thepredetermined air to fuel ratio at a charge pressure of 100 bar.
Considerable fluctuations in air to fuel ratio was observed when the air to fuel ratio set point was changedfrom its predetermined set point value. For example, the fluctuations increased when the engine was operated ata high air to fuel ratio, but the air to fuel ratio was primarily fluctuating around the set point value. However,at a low air to fuel ratio, the fluctuations were even more significant and the engine was primarily operating ata higher air to fuel ratio than the set point value.
The effectiveness of the preheater was very high for all test points, regardless of fuel type, charge pressuresetting or air to fuel ratio. Calculations based on the temperature and the flow rate measurements suggest thatthe heat transfer through the preheater was well above 95 percent of the maximum possible heat transfer. Thissuggest a high robustness of the air preheating.
The Carnot efficiency exceeded 80 percent during engine operation by liquid propane gas and natural gas,Equation (4.19). However, due to the reduced combustion temperature, the Carnot efficiency was reduced by afew percent while operated by landfill gas. Further, the actual power produced by the engine shaft was in theregion of 65 to 70 percent of the indicated power, Equation (4.14).
24

6 Discussion
This chapter attempts to answer and discuss the results obtained in this study. Topics include issues regardingthe consistency of the extracted measurement data and comments about the influence of the air to fuel ratio onengine operation. Last, some issues regarding the stability of operation is targeted.
6.1 Consistency of the measurement data
The relationship between the prompt combustion, Qcomb,prompt and the total heat transfer through the heaterhead could not be fully established by this study. However, from combustion theory, it is suggested that someof the heat transfer through the heater head could have originated from combustion occurring adjacent to theheat transfer surfaces of the heater head. Thus, this amount of heat transfer could not be detected by thetemperature measurement placed prior to the heater head, Tfg,phh. Additional heat transfer may have beencaused by surface radiation from surfaces having a configuration factor of significant importance with respectto the heater head.
Additional contingencies were added as a result of the uncertainty of the various modes of heat transferwithin the combustion device. Since the amount of fuel combusted prior to, and after, the heater head wasunknown, the mass fractions, mfg, required for calculating the heat transfer trough the heater head, Equation(4.4), remained undecided. In other words, since the assumption of complete combustion could not be verified,no assertive conclusions could be drawn from this data alone.
The thermocouples used in the combustion device may also have added to the misrepresentation of the heattransfer through the heater head. At the position prior to the heater head, the temperature was expected to begreater than the rated maximum temperature of the thermocouples. As a result, the temperature measurementat this position may have been flawed.
Added to this, inconsistency was observed regarding the energy flows of the entire system for somecombinations of charge pressure and air to fuel ratio while the engine was operated by natural gas and landfillgas. The summation of the outgoing energy flows, namely the shaft power, the heat rejected by the coolingsystem and the heat rejected by the exhaust gases exceeded the fuel input by a minor fraction. Hence, the firstlaw of thermodynamics appeared to be violated in these calculations.
One of the flow rate monitors may have been the reason for this inconsistency. There were two fuel flow ratemonitors installed in the system, in which the first monitored the flow rate of liquid propane gas whereas thesecond monitored the flow rate of natural gas and landfill gas. If losses in the same ranges as for liquid propanegas source were to be expected, the fuel flow rate of natural gas and landfill gas should be about ten percenthigher than the measured value. Hence, for natural gas, the true system efficiency may have been up to fivepercent lower than what is presented in Figure 5.3b. If this was the case, the system efficiencies were almostidentical for liquid propane gas and natural gas at the same engine charge pressure. On the other hand, in thecase in which landfill gas was used as the fuel source, the true system efficiency may have been just about onepercent lower than what is presented in Figure 5.3b.
Another possible source of error could be due to failure to achieve thermal equilibrium in the engine prior todata extraction. If large quantities of energy was stored in the engine block during the start-up schedule fuelledby liquid propane gas, that energy would have been observed as heat rejection through the cooling system for along period of time. Further, failure to reach thermal equilibrium would result in a slightly non representativeexhaust gas temperature. In other words, if energy was stored in the system during the start-up schedule, thiswould cancel any calculative violations of the first law of thermodynamics.
Finally, the cause of the slight changes in shaft power at varied air to fuel ratios, Figure 5.1b, were mostlylikely linked to a disability to maintain a fixed charge pressure level within the C9G Stirling engine. Thispressure fluctuation originated from small sources of leakage from the mounting adapters of the installedpressure sensors, rather than changes in the air to fuel ratio. Pressure deviations up to six percent were notedbefore the engine automatically refilled the engine to the set point value.
6.2 Influence of the air to fuel ratio
The increased losses while operating the engine at low air to fuel ratio were possibly the result of incompletecombustion prior to and during the residence time at the heater head of the Stirling engine. This theory was
25

supported by the fact no changes in power output was observed despite the increased fuel input, Figure 5.1a-b.Further, the temperature prior to the heater head of the Stirling engine was increased following a reductionin fuel input, Figure 5.2c. This suggests an increased reaction rate, which would be a direct response to anincreased oxygen concentration.
The increased reaction rate should allow for a larger percentage of the energy content in the fuel to bereleased prior to the heater head, which is in conjunction with what is presented in Figure 5.3a. Further, astrong correlation exists, suggesting that a larger heat release prior to the heater head supports a higher systemefficiency, Figure 5.3b. The trend of increasing system efficiency at high air to fuel ratio held for both liquidpropane gas and natural gas. However, this correlation appeared to be smaller when the engine was operatedby natural gas at low charge pressures.
The same line of reasoning can be used to explain the decreasing temperature prior to the heater head forair to fuel ratios above 1.45 for an engine charge pressure of 50 bar, Figure 5.2c. If the temperature decreased,at a measurement point soon after the mixing of the oxidiser and the fuel, following the addition of more excessair, this suggest that less additional heat was released per unit of increase in excess air. In other words, furtherincreasing the air to fuel ratio did no longer significantly aid combustion. Thus, the derivative of the heatrelease prior to the heater head as a function air to fuel ratio was decreasing at high air to fuel ratios, Figure5.3a. Consequently, there was no significant gain in system efficiency at air to fuel ratios above 1.45, Figure5.3b.
Last, soot was observed to have accumulated on surfaces located soon after the flue gases has passed throughthe heater head. As soot is a direct sign of flame quenching, this may also be proving the occurrence ofincomplete combustion. However, the soot may also have been accumulated during the start-up period of theengine, when surface temperatures within the combustion device were far below the temperatures of normaloperation.
Another reason for the decreased system efficiency at low air to fuel ratios, apart from incomplete combustion,was that a part of the fuel stream took a reversed flow direction through the flue gas recirculation cavitiesat high flow rates of fuel, Chapter 5.1. Since the correlation of decreased system efficiency held for all fuelsand charge pressures, a reversed flow direction may have been observed even at relatively low flow rates, forexample those required while the engine was operated with liquid propane gas as the fuel source. As a higherair to fuel ratio directly correlates to a lower flow rate of fuel, which translates into a lower flow velocity of fuelat the nozzle, a larger part of the fuel stream may have been engulfed by the air stream at high air to fuelratios. Hence, the pattern of reduced flow direction may have been reduced at high flow rates of fuel.
6.3 Stability of operation
Caution should be taken while operating the engine by natural gas at high charge pressures. Increased chargepressures coincides with increased fuel flow rates. Thus, there is a risk of an error code activation for highexhaust gas temperature as the fuel flow rate approaches the region around 5.5 m3 h−1. At this flow rate, duringoperation with landfill gas as the fuel source, the flow direction was reversed through the flue gas recirculationcavities, thus increasing the risk of severely increased exhaust gas temperatures. However, an error code forhigh exhaust gas temperature was not generated at a charge pressure of 130 bar during operation with naturalgas as the fuel source.
The system barely managed to operate with landfill gas as the fuel source. By increasing the engine chargepressure from 30 bar to 32 bar, the air to fuel ratio rose above 2.3 which after a short period of time triggeredan error code and an automatic termination of operation. Decreasing the air to fuel ratio below 1.93 alsoresulted in the generation of an error code due to a heavily increased exhaust gas temperature. Thus, successfuloperation was only maintained for an air to fuel ratio ranging between 1.93 to 2.3. Thus, at such an elevatedair to fuel ratio, the system could not be considered as stable for operation. Again, it should be stressed thatthe content of carbon dioxide and nitrogen was shifted in the researched gas in order to facilitate compressionto high pressures, Table 3.1.
In order to operate the engine by landfill gas, the lowest possible engine charge pressure, which translatesinto the lowest possible shaft power, as well as a high air to fuel ratio, was required. Even though synthesis gaswas not tested as a fuel sources, it was determined to be very unlikely for the system to operate successfullywith this fuel, which energy content was just two thirds of the energy content of landfill gas. Thus, in order toincrease the fuel flow into the engine, an alternative placement of the fuel nozzles is needed in order to avoid areversed flow direction through the flue gas recirculation cavities. Alternatively, a changed nozzle diameter
26

would be required to facilitate higher flow rates of fuel at the same time as the flow velocity is reduced.It should also be mentioned that a higher charge pressure setting have been previously obtained while using
landfill gas. However, these tests were set up by research engineers at Cleanergy. Thus, differences in thecharacteristics of the surrounding systems may be of great impact to engine operation. For example, a higherflow rate of the external cooling fluid was used at Chalmers, thus allowing the engine to reject more heat.Further, the exhaust gas suction pressure was inadequate, thus resulting in more resistance while injecting airand fuel into the engine. At last, different piping structures in the fuel supply chain may have resulted in alower fuel injection pressure.
It appears that the engine operates at a higher system efficiency at an increased air to fuel ratio, Figure 5.3b.However, an increased air to fuel ratio results in higher temperatures within the combustion device, Figure 5.2,which in turns may contradict MILD combustion characteristics, Chapter 3.3.
27

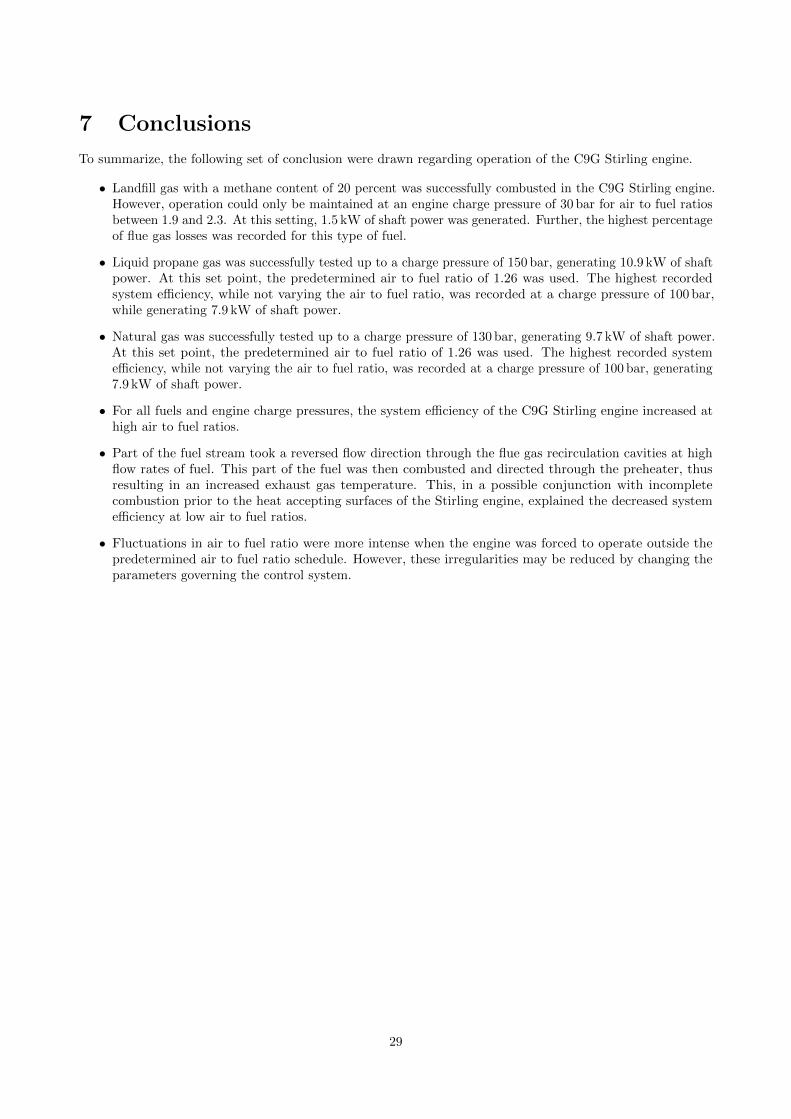
7 Conclusions
To summarize, the following set of conclusion were drawn regarding operation of the C9G Stirling engine.
• Landfill gas with a methane content of 20 percent was successfully combusted in the C9G Stirling engine.However, operation could only be maintained at an engine charge pressure of 30 bar for air to fuel ratiosbetween 1.9 and 2.3. At this setting, 1.5 kW of shaft power was generated. Further, the highest percentageof flue gas losses was recorded for this type of fuel.
• Liquid propane gas was successfully tested up to a charge pressure of 150 bar, generating 10.9 kW of shaftpower. At this set point, the predetermined air to fuel ratio of 1.26 was used. The highest recordedsystem efficiency, while not varying the air to fuel ratio, was recorded at a charge pressure of 100 bar,while generating 7.9 kW of shaft power.
• Natural gas was successfully tested up to a charge pressure of 130 bar, generating 9.7 kW of shaft power.At this set point, the predetermined air to fuel ratio of 1.26 was used. The highest recorded systemefficiency, while not varying the air to fuel ratio, was recorded at a charge pressure of 100 bar, generating7.9 kW of shaft power.
• For all fuels and engine charge pressures, the system efficiency of the C9G Stirling engine increased athigh air to fuel ratios.
• Part of the fuel stream took a reversed flow direction through the flue gas recirculation cavities at highflow rates of fuel. This part of the fuel was then combusted and directed through the preheater, thusresulting in an increased exhaust gas temperature. This, in a possible conjunction with incompletecombustion prior to the heat accepting surfaces of the Stirling engine, explained the decreased systemefficiency at low air to fuel ratios.
• Fluctuations in air to fuel ratio were more intense when the engine was forced to operate outside thepredetermined air to fuel ratio schedule. However, these irregularities may be reduced by changing theparameters governing the control system.
29


References
[1] P. Basu. Biomass Gasification and Pyrolysis: Practical Design and Theory. Elsevier Science, 2010. isbn:9780080961620.
[2] M. Berg, E. M. Johansson, and S. G. Jaras. Catalytic combustion of low heating value gas mixtures:comparison between laboratory and pilot scale tests. Catalysis Today 59.1–2 (2000), 117–130. issn:0920-5861.
[3] G. Borman and K. Ragland. Combustion engineering. Mechanical engineering series. McGraw-Hill, 1998.isbn: 9780070065673.
[4] British Standards Institute Staff. Tests Gases - Test Pressures - Appliance Categories EN 437:2003. ICS27.060.20; 91.140.40. B S I Standards, 2003. isbn: 9780580679896.
[5] Z. Cao and T. Zhu. Effects of CO2 Dilution on Methane Ignition in Moderate or Intense Low-oxygenDilution (MILD) Combustion: A Numerical Study. Chinese Journal of Chemical Engineering 20.4 (2012),701–709. issn: 1004-9541.
[6] S. Carlqvist. Motorer med kontinuerlig forbranning. Chalmers tekniska hogskola, 1984.[7] A. Cavaliere and M. de Joannon. Mild Combustion. Progress in Energy and Combustion Science 30.4
(2004), 329–366. issn: 0360-1285.[8] Y. Cengel and M. Boles. Thermodynamics: An Engineering Approach, SI Version. McGraw-Hill Series in
Mechanical Engineering. McGraw-Hill Higher Education, 2007. isbn: 9780071257718.[9] R. Chandra et al. Performance evaluation of a constant speed {IC} engine on CNG, methane enriched
biogas and biogas. Applied Energy 88.11 (2011), 3969–3977. issn: 0306-2619.[10] S. Chen and C. Zheng. Counterflow diffusion flame of hydrogen-enriched biogas under {MILD} oxy-fuel
condition. International Journal of Hydrogen Energy 36.23 (2011), 15403–15413. issn: 0360-3199.[11] C.-H. Cheng and Y.-J. Yu. Combining dynamic and thermodynamic models for dynamic simulation of a
beta-type Stirling engine with rhombic-drive mechanism. Renewable Energy 37.1 (2012), 161–173. issn:0960-1481.
[12] A. Colorado, B. Herrera, and A. Amell. Performance of a Flameless combustion furnace using biogas andnatural gas. Bioresource Technology 101.7 (2010), 2443–2449. issn: 0960-8524.
[13] H. Fogler. Elements of chemical reaction engineering. Prentice-Hall international series in the physicaland chemical engineering sciences. Prentice-Hall, 1986. isbn: 9780132634762.
[14] Great Britain Environment Agency. Guidance for Monitoring Trace Components in Landfill Gas. Envi-ronment Agency, 2010.
[15] J. Holman. Heat Transfer. McGraw-Hill series in mechanical engineering. McGraw Hill Higher Education,2010. isbn: 9780071267694.
[16] S. E. Hosseini and M. A. Wahid. Biogas utilization: Experimental investigation on biogas flamelesscombustion in lab-scale furnace. Energy Conversion and Management 74 (2013), 426–432. issn: 0196-8904.
[17] F. Incropera. Fundamentals of heat and mass transfer. Fundamentals of Heat and Mass Transfer v. 1.John Wiley, 2007. isbn: 9780471457282.
[18] International Energy Agency. Technology Roadmap Bioenergy for Heat and Power. Corlet, 2012.[19] L. Karlberg. Genombrott for Stirlingmotorn. Ny Teknik (2008).[20] L. Karlberg. Stirlingmotorn ater till Sverige. Ny Teknik (2008).[21] J. D. Martınez et al. Syngas production in downdraft biomass gasifiers and its application using internal
combustion engines. Renewable Energy 38.1 (2012), 1–9. issn: 0960-1481.[22] W. Martini et al. Stirling Engine Design Manual. NASA contractor report. The Office, 1983. isbn:
9781410216045.[23] A. Mudhoo. Biogas Production: Pretreatment Methods in Anaerobic Digestion. Wiley, 2012. isbn:
9781118062852.[24] M. Munoz et al. Low heating value gas on spark ignition engines. Biomass and Bioenergy 18.5 (2000),
431–439. issn: 0961-9534.[25] S. Purwono, P. Silveston, and R. Hudgins. “Catalytic Combustion of Low-Heating-Value Gases Using Flow
Reversal”. Progress in Catalysis Proceedings of the 12th Canadian Symposium on Catalysis. Ed. by K. J.Smith and E. C. Sanford. Vol. 73. Studies in Surface Science and Catalysis. Elsevier, 1992, pp. 227–229.
[26] A. Ross. Stirling cycle engines. Solar Engines, 1977. isbn: 9990353905.
31

[27] J. Rostrup-Nielsen and L. Christiansen. Concepts in Syngas Manufacture. Catalytic science series. ImperialCollege Press, 2011. isbn: 9781848165687.
[28] Royal Swedish Academy of Engineering Sciences. El och varme fran solen. Tech. rep. 2003.[29] J. Russell and R. Cohn. Wobbe Index. Book on Demand, 2012. isbn: 9785511207155.[30] M. Sanchez, F. Cadavid, and A. Amell. Experimental evaluation of a 20 kW oxygen enhanced self-
regenerative burner operated in flameless combustion mode. Applied Energy 111 (2013), 240–246. issn:0306-2619.
[31] T. Seadi et al. Biogas Handbook. University of Southern Denmark Esbjerg, 2008. isbn: 9788799296200.[32] G. Sridhar, P. Paul, and H. Mukunda. Biomass derived producer gas as a reciprocating engine fuel—an
experimental analysis. Biomass and Bioenergy 21.1 (2001), 61–72. issn: 0961-9534.[33] L. Surhone, M. Timpledon, and S. Marseken. Wobbe Index. Betascript Publishing, 2010. isbn: 9786130371678.[34] F. V. Tinaut et al. Method for predicting the performance of an internal combustion engine fuelled by pro-
ducer gas and other low heating value gases. Fuel Processing Technology 87.2 (2006). ¡ce:title¿InternationalCongress on Energy and Environment Engineering and Management¡/ce:title¿, 135–142. issn: 0378-3820.
[35] J. Twidell and A. Weir. Renewable Energy Resources. Taylor & Francis, 2006. isbn: 9780419253303.[36] G. Walker. Stirling engines. Oxford science publications. Clarendon Press, 1980. isbn: 9780198562092.[37] K. Wark. Advanced Thermodynamics for Engineers. Mac Graw-Hill series in mechanical engineering.
McGraw-Hill Higher Education, 1995. isbn: 9780070682924.[38] J. Warnatz, U. Maas, and R. Dibble. Combustion: Physical and Chemical Fundamentals, Modeling and
Simulation, Experiments, Pollutant Formation. Springer, 2006. isbn: 9783540259923.[39] R. Weber, J. P. Smart, and W. vd Kamp. On the (MILD) combustion of gaseous, liquid, and solid fuels
in high temperature preheated air. Proceedings of the Combustion Institute 30.2 (2005), 2623–2629. issn:1540-7489.
[40] C. West. Principles and applications of Stirling engines. Van Nostrand Reinhold, 1986. isbn: 9780442292737.[41] J. Wunning and J. Wunning. Flameless oxidation to reduce thermal no-formation. Progress in Energy
and Combustion Science 23.1 (1997). cited By (since 1996)335, 81–94.[42] W. Yang and W. Blasiak. Numerical simulation of properties of a LPG flame with high-temperature air.
International Journal of Thermal Sciences 44.10 (2005). cited By (since 1996)34, 973–985.[43] W. Yang and W. Blasiak. Numerical study of fuel temperature influence on single gas jet combustion in
highly preheated and oxygen deficient air. Energy 30.2-4 SPEC. ISS. (2005). cited By (since 1996)42,385–398.
[44] W. Yang and W. Blasiak. Flame Entrainments Induced by a Turbulent Reacting Jet Using High-Temperature and Oxygen-Deficient Oxidizers. Energy & Fuels 19.4 (2005), 1473–1483.
32

A The test schedule
Table A.1: Liquid propane gas
Test period Pressure set. [bar] Speed set. [rpm] λ Duration [min] Data acquisition
Warm-up 50 1500 - 45 None1.1 Test 150 1500 1.23 15 Full transient1.2 Test 150 1500 1.26 7 Full transient1.3 Test 150 1500 1.47 7 Full transient1.4 Test 100 1500 1.22 15 Full transient1.5 Test 100 1500 1.32 7 Full transient1.6 Test 100 1500 1.54 7 Full transient1.7 Test 50 1500 1.18 15 Full transient1.8 Test 50 1500 1.34 7 Full transient1.9 Test 50 1500 1.38 7 Full transient
Table A.2: Natural gas
Test period Pressure set. [bar] Speed set. [rpm] λ Duration [min] Data acquisition
Warm-up 50 1500 - 45 None2.1 Test 130 1500 1.16 15 Full transient2.2 Test 130 1500 1.25 7 Full transient2.3 Test 130 1500 1.53 7 Full transient2.10 Test 130 1500 1.73 7 Full transient2.4 Test 100 1500 1.18 15 Full transient2.5 Test 100 1500 1.32 7 Full transient2.6 Test 100 1500 1.54 7 Full transient2.7 Test 50 1500 1.17 15 Full transient2.8 Test 50 1500 1.36 7 Full transient2.14 Test 50 1500 1.45 7 Full transient2.9 Test 50 1500 1.53 7 Full transient2.13 Test 50 1500 1.64 7 Full transient2.11 Test 50 1500 1.68 7 Full transient2.12 Test 50 1500 1.76 7 Full transient
Table A.3: Synthesis gas
Test period Pressure set. [bar] Speed set. [rpm] λ Duration [min] Data acquisition
Warm-up 50 1500 - Not Attempted None
33

Table A.4: Landfill gas
Test period Pressure set. [bar] Speed set. [rpm] λ Duration [min] Data acquisition
Warm-up 50 1500 - 45 None3.1 Test 30 1500 2.10 15 No equilibrium reached3.2 Test 30 1500 1.93 15 No equilibrium reached3.3 Test 30 1500 1.81 15 Error code3.4 Test 30 1500 2.14 15 Full transient
34

B A list of measurement data and equipment
Table B.1: Measurement, unit, instrument and data acquisition system
Measurement Unit Data acquisition system
Coolant temperature at the engine inlet ◦C LabViewCoolant temperature at the engine outlet ◦C LabViewFlue gas temperature at the exhaust pipe ◦C LabViewAir temperature at ambient conditions ◦C LabViewFlue gas temperature prior to the heater head 1 ◦C LabViewFlue gas temperature prior to the heater head 2 ◦C LabViewFlue gas temperature after the heater head 1 ◦C LabViewFlue gas temperature after the heater head 2 ◦C LabViewFlue gas temperature at the preheater’s inlet/flue gas recirculation’s inlet 1 ◦C LabViewFlue gas temperature at the preheater’s inlet/flue gas recirculation’s inlet 2 ◦C LabViewSurface temperature of the heater head ◦C LabViewWorking gas temperature at the regenerator ◦C LabViewBreak moment N m LabViewFuel flow rate m3 h−1 LabView
Shaft speed min−1 MODBUS ProtocolAir to fuel ratio MODBUS ProtocolMean average working pressure kPa MODBUS ProtocolWorking gas temperature at the front end of the heater head ◦C MODBUS ProtocolWorking gas temperature at the center of the heater head ◦C MODBUS ProtocolWorking gas temperature at the back end of the heater head ◦C MODBUS ProtocolFlue gas temperature FLOX 1 ◦C MODBUS ProtocolFlue gas temperature FLOX 2 ◦C MODBUS ProtocolWorking gas temperature at cylinder top ◦C MODBUS Protocol
Pressure in heated cylinder bar IndiComPressure in cooled cylinder bar IndiCom
35