An experimental and constitutive ... - Willkommen am IFM
28
An experimental and constitutive modeling study on the large strain deformation and fracture behavior of PC/ABS blends J. Hund, J. Naumann, Th. Seelig 1 Institute of Mechanics, Karlsruhe Institute of Technology, Kaiserstrasse 12, 76131 Karlsruhe, Germany Abstract Two rubber-toughened thermoplastic polymer blends with different volume fractions of polycarbonate (PC) and acrylonitrile-butadiene-styrene (ABS) are analyzed experimen- tally as well as by constitutive models and finite element simulations with regard to their large strain deformation and fracture behavior. Special emphasis thereby is devoted to the overall plastically dilatant behavior of these materials which results from microscale damage mechanisms. Not considering the latter in detail, it is shown that several ma- terial models of different complexity may well capture the macroscopic true stress-strain response and the plastic dilatancy of PC/ABS blends under uniaxial loading. The suit- ability of these models to describe the behavior of the blends under more complex loading conditions, however, turns out to be ambivalent and depends on the material compo- sition, i.e. the PC vs. ABS content. This issue is analyzed by means of finite element simulations of fracture tests where numerical predictions in terms of the overall force- displacement response and the local evolution of the crack-tip plastic zone are compared with experimenral findings. Keywords Rubber-toughened polymers, PC/ABS blends, constitutive modeling, plastic dilatancy, fracture simulation 1 Corresponding author: Tel.: +49-721-608-43714; Fax.: +49-721-608-47990, Email: [email protected] 1
Transcript of An experimental and constitutive ... - Willkommen am IFM

An experimental and constitutive modeling
study on the large strain deformation and
fracture behavior of PC/ABS blends
J. Hund, J. Naumann, Th. Seelig1
Institute of Mechanics, Karlsruhe Institute of Technology, Kaiserstrasse 12, 76131
Karlsruhe, Germany
Abstract
Two rubber-toughened thermoplastic polymer blends with different volume fractions of
polycarbonate (PC) and acrylonitrile-butadiene-styrene (ABS) are analyzed experimen-
tally as well as by constitutive models and finite element simulations with regard to their
large strain deformation and fracture behavior. Special emphasis thereby is devoted to
the overall plastically dilatant behavior of these materials which results from microscale
damage mechanisms. Not considering the latter in detail, it is shown that several ma-
terial models of different complexity may well capture the macroscopic true stress-strain
response and the plastic dilatancy of PC/ABS blends under uniaxial loading. The suit-
ability of these models to describe the behavior of the blends under more complex loading
conditions, however, turns out to be ambivalent and depends on the material compo-
sition, i.e. the PC vs. ABS content. This issue is analyzed by means of finite element
simulations of fracture tests where numerical predictions in terms of the overall force-
displacement response and the local evolution of the crack-tip plastic zone are compared
with experimenral findings.
Keywords
Rubber-toughened polymers, PC/ABS blends, constitutive modeling, plastic dilatancy,
fracture simulation
1Corresponding author: Tel.: +49-721-608-43714; Fax.: +49-721-608-47990, Email:
1
1 Introduction
PC/ABS blends, i.e. mixtures of the glassy thermoplastic polycarbonate (PC) and acrylo-
nitrile-butadiene-styrene (ABS) are used in many technical applications, for instance,
because of their ductility as well as enhanced fracture toughness. Since the ABS phase is
itself a mixture of the glassy thermoplastic styrene-acrylonitrile (SAN) and finely dispersed
rubber (butadiene) particles, PC/ABS is referred to as a ternary blend. From a mechanics
point of view, commercial grades differ essentially by their composition (e.g. amount
of PC, amount of rubber in ABS) and – consequently – their mechanical properties,
e.g. [3, 8, 15, 16, 17, 21, 22, 28, 29, 32]. Further influences on the latter are ascribed
to the molecular weight of the individual constituents and the processing induced blend
morphology.
Owing to their practical importance, PC/ABS blends have been analyzed in many
experimental studies (see above), yet theoretical investigations concerning the constitutive
modeling of their mechanical behavior so far are rare. For instance, the large strain rate-
dependent behavior under uniaxial tension has been fitted by a phenomenological 1D
model in [7], and the (plastically incompressible) response under compressive loading was
described by a rate-dependent J2-plasticity model in [31]. The dilative behavior under
tensile loading is very seldomly reported, e.g. [14], and so far not adequately considered
in constitutive modeling. Qualitative micromechanical studies concerning the influence
of the blend composition on the macroscopic response were carried out in [25, 26], yet
without relating these effects quantitatively to the true (experimental) behavior. In fact,
multiscale approaches of this kind typically suffer from a lack of reliable data about
the constituent behavior within the composite. For practical applications, e.g. involving
structural finite element (FE) analyses, however, efficient macroscopic models are needed
which quantitatively capture the material behavior under complex loading states up to
failure.
In the present work, two commercial PC/ABS grades with different composition in
terms of PC and ABS content are analyzed experimentally regarding their large strain
response under uniaxial tension as well as fracture conditions. Of particular importance
thereby is the macroscopic plastic dilatancy which is known to originate from various
micromechanisms such as rubber particle cavitation, plastic void growth and crazing (oc-
curing in the ABS phase) as well as debonding along the interface between PC and ABS,
e.g. [2, 8, 15, 16, 17]. The focus of the present work, however, is merely on the overall
effect of these mechanisms. Their contribution to the macroscopic behaviour of PC/ABS
depends on the different PC and ABS contents in the blend material, with overall dilation
2
originating mainly from the ABS phase. In order to identify and analyze an appropriate
macroscopic description of PC/ABS blends, three material models of different structure
– all accounting for plastic dilatancy – are compared with regard to their capability to
capture the experimentally observed behavior. These models are the classical Drucker-
Prager model, e.g. [6], and the Raghava model, e.g. [23, 24], which differ by the shape of
the yield surface, as well as a Green/Gurson-like model [9, 12] which in contrast to the
aforementioned two accounts for an evolution of porosity with plastic flow. The mod-
els, when calibrated to the uniaxial tensile response (often solely available for material
parameter identification) all prove to well capture the rate-dependent true stress-strain
behavior including the evolution of volumetric strain of the two tested PC/ABS materials
over large strains. Once this agreement given, the questions of primary interest in this
work is in how far either of these models is suited to describe the experimentally observed
behavior in case of more complex loading situations such as notched specimens and crack
propagation, i.e. at higher stress triaxialities which are typically not as often considered
in the calibration of constitutive models. The present work thus appears to be a first
systematic study towards the constitutive modeling and a sound calibration of the large
strain (visco)-plastically dilatant behavior of PC/ABS blends.
The paper is organized as follows: In Sect. 2 the experimental study is described
where digital image correlation (DIC) is used to analyze the local strain distribution
in unnotched and notched specimens. This allows to determine the true stress-strain
response as well as the evolution of volume strain under uniaxial tension. Section 3 is
devoted to the presentation of the constitutive models, while their calibration to the
experimental data is specified in Sect. 4. In Sect. 5 the different material models are
employed in 3D finite element studies of the fracture behavior of the two PC/ABS blends
in case of single-edge-notch-tension (SENT) specimens. Numerical results are compared
to experimental findings and are analyzed with regard to the crack-tip plastic zone as well
as the overall force-displacement response during specimen failure. A summary of this
study and conclusions are provided in Sect. 6.
Throughout the paper, symbolic notation of tensors is used, with second order tensors
written in bold face A and fourth order tensors as A. The symbol ” : ” thereby means
a double contraction (e.g. scalar product of second order tensors) and ”⊗” denotes the
dyadic product.
3
2 Experimental study
The experimental study in this work comprises monotonic uniaxial tensile tests with
large strains up to failure as well as fracture tests on single-edge-notch-tension (SENT)
specimens. Two commercial PC/ABS blends BayblendTM T45 and BayblendTM T85 by
Covestro are examined. BayblendTM T45 features a PC content of about 45 % whereas
the amount of PC in BayblendTM T85 is about 70 % [27]. For clarity, BayblendTM T45 is
in the following referred to as PC/ABS(45/55) and BayblendTM T85 as PC/ABS(70/30),
respectively. The experiments were carried out on a servo-hydraulic testing machine
(Instron) at room temperature. Every test was performed with at least three replicates for
averaging purposes. Mechanical clamps were used to attach the specimens to the testing
machine. The strain field on the plane specimen surface was determined via 2D digital
image correlation (DIC, Limess Q-400-2D [20]) with a camera resolution of 2 MPixel and
a maximum frame rate of 20 sec−1.
2.1 Uniaxial tensile tests
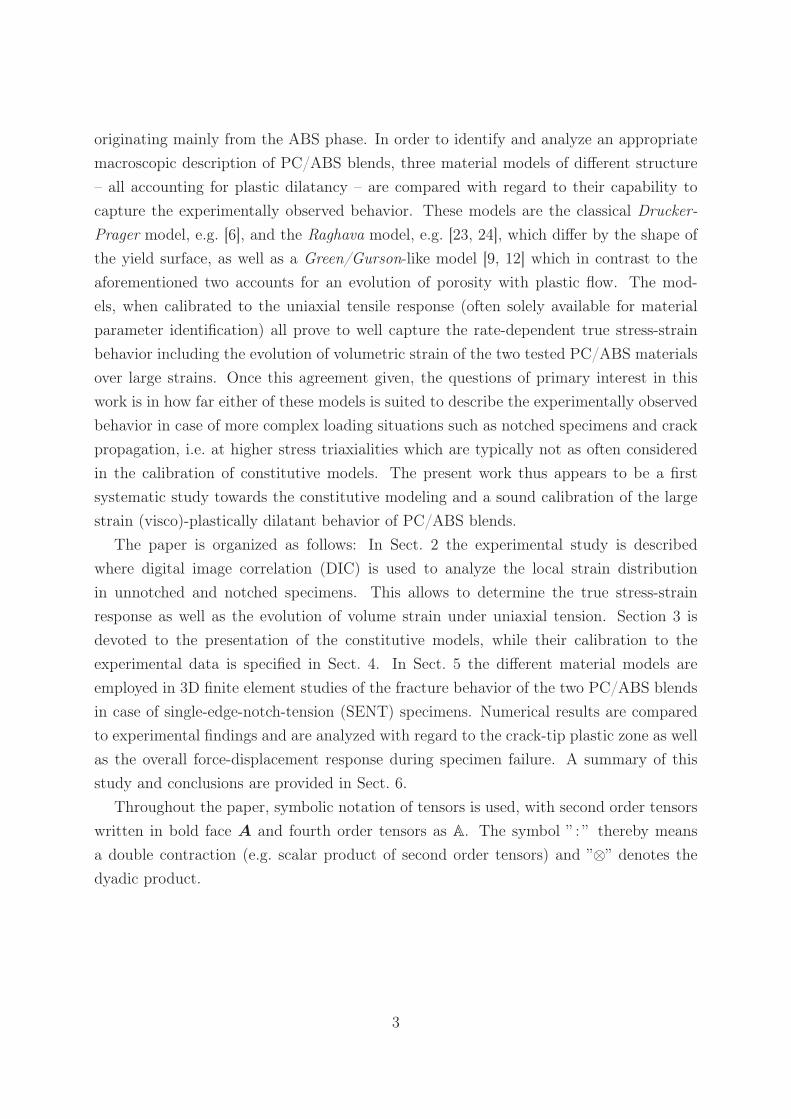
The uniaxial tensile tests on specimens as sketched in Fig. 1 were performed at two
different values of the nominal strain rate, ε=0.01 sec−1 and ε=0.1 sec−1, defined as the
rate of overall specimen elongation divided by the gauge length of 12mm. Since only
12
12
22R20
80
region ofstrain
measurement
Figure 1: Geometry of plane tensile test specimen in mm (thickness 3mm).
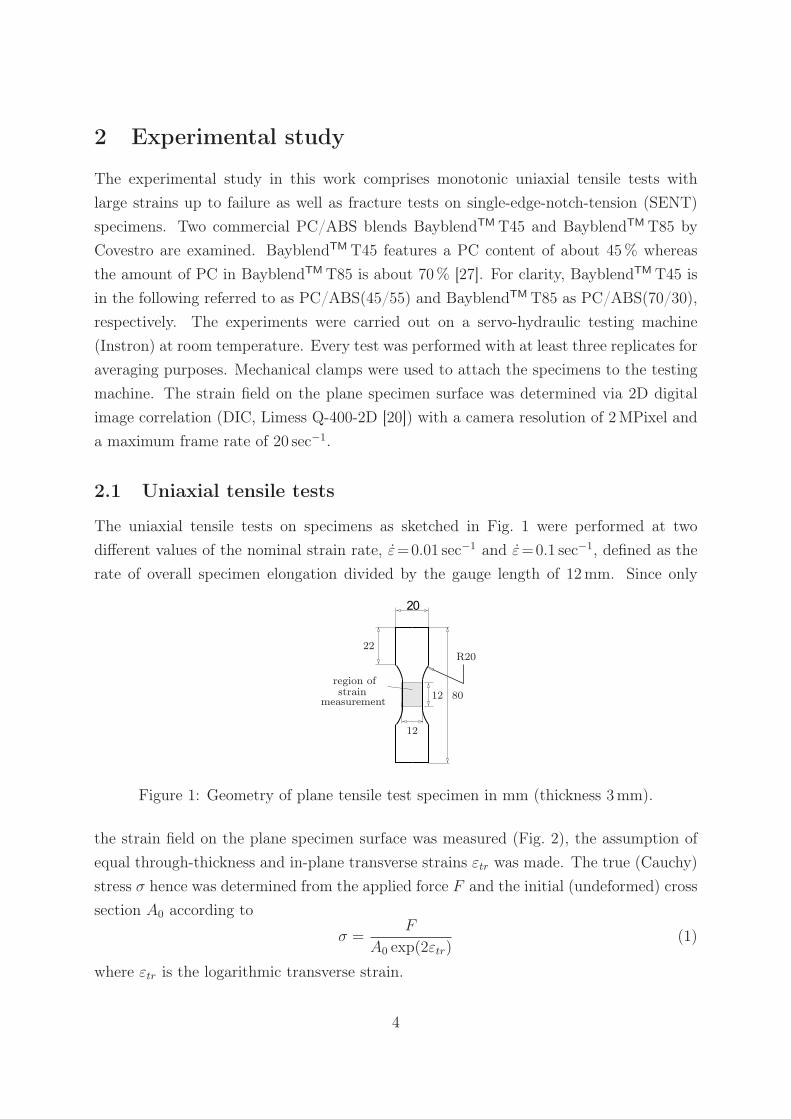
the strain field on the plane specimen surface was measured (Fig. 2), the assumption of
equal through-thickness and in-plane transverse strains εtr was made. The true (Cauchy)
stress σ hence was determined from the applied force F and the initial (undeformed) cross
section A0 according to
σ =F
A0 exp(2εtr)(1)
where εtr is the logarithmic transverse strain.
4
log. axial strain
0.80
0.76
0.71
0.67
0.61
0.55
0.47
0.39
0.29
0.16
Figure 2: Contours of logarithmic axial strain in PC/ABS(45/55) specimen obtained from
DIC.
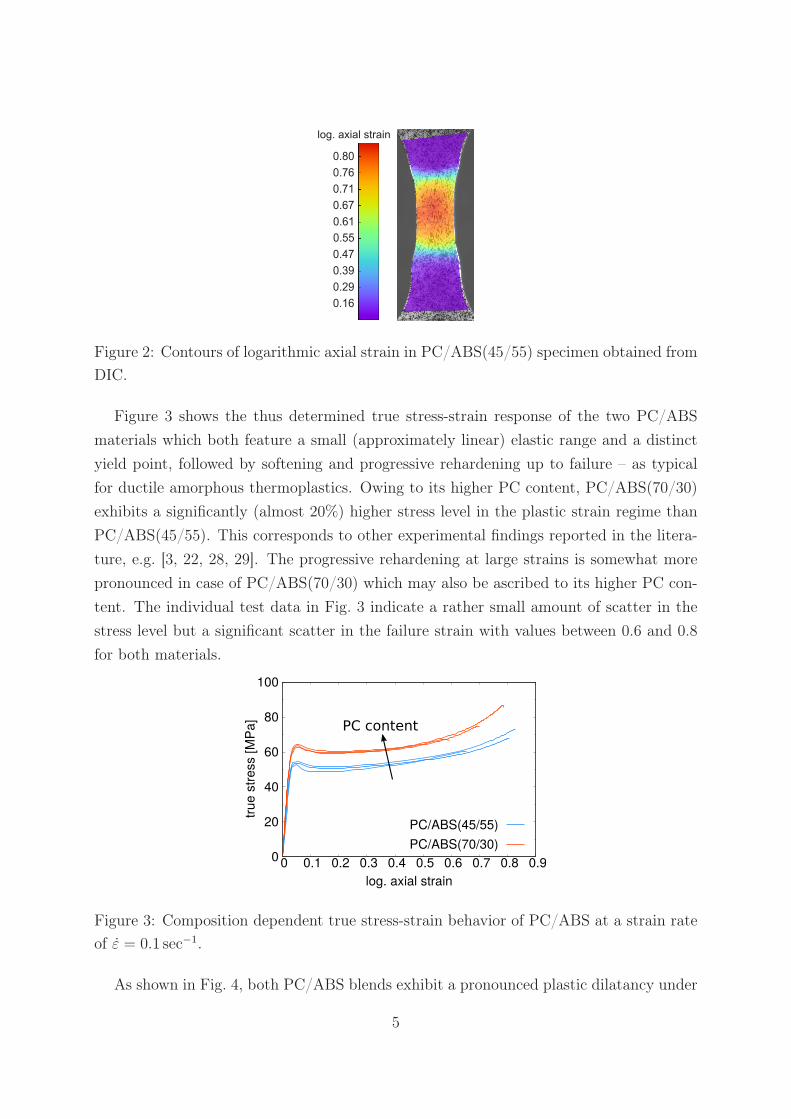
Figure 3 shows the thus determined true stress-strain response of the two PC/ABS
materials which both feature a small (approximately linear) elastic range and a distinct
yield point, followed by softening and progressive rehardening up to failure – as typical
for ductile amorphous thermoplastics. Owing to its higher PC content, PC/ABS(70/30)
exhibits a significantly (almost 20%) higher stress level in the plastic strain regime than
PC/ABS(45/55). This corresponds to other experimental findings reported in the litera-
ture, e.g. [3, 22, 28, 29]. The progressive rehardening at large strains is somewhat more
pronounced in case of PC/ABS(70/30) which may also be ascribed to its higher PC con-
tent. The individual test data in Fig. 3 indicate a rather small amount of scatter in the
stress level but a significant scatter in the failure strain with values between 0.6 and 0.8
for both materials.
0
20
40
60
80
100
0 0.1 0.2 0.3 0.4 0.5 0.6 0.7 0.8 0.9
true s
tress [M
Pa]
log. axial strain
PC/ABS(45/55)
PC/ABS(70/30)
PC content
Figure 3: Composition dependent true stress-strain behavior of PC/ABS at a strain rate
of ε = 0.1 sec−1.
As shown in Fig. 4, both PC/ABS blends exhibit a pronounced plastic dilatancy under
5
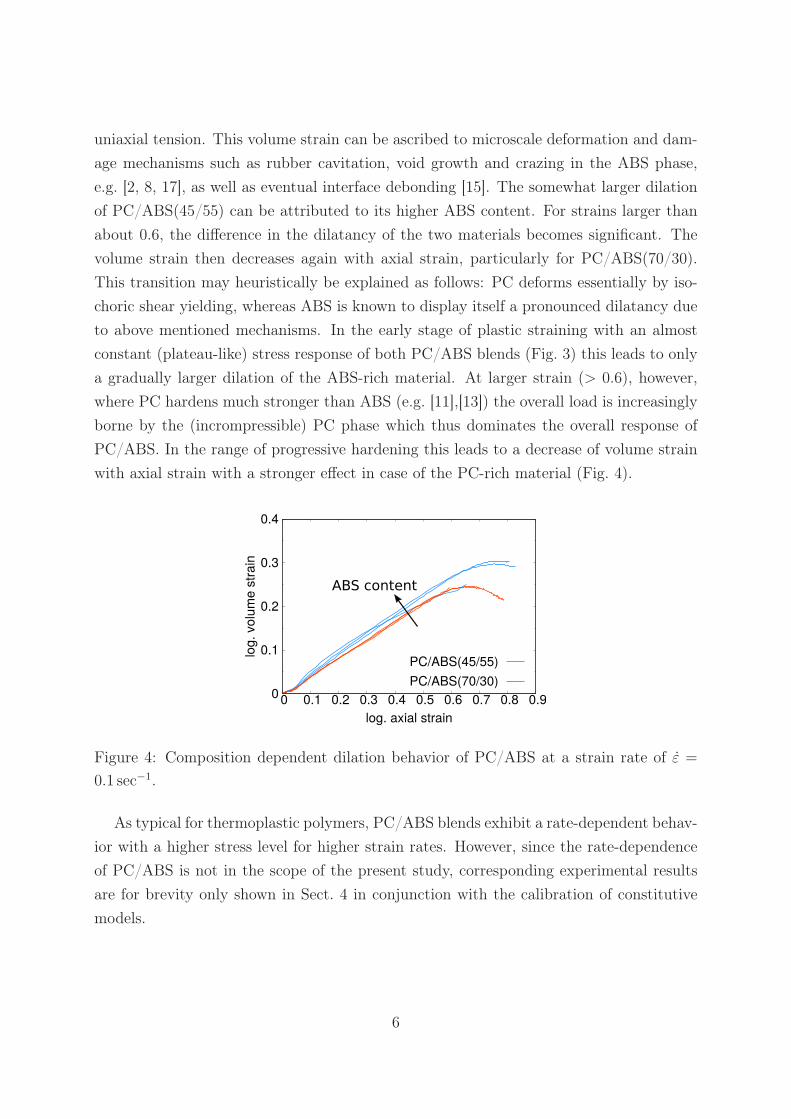
uniaxial tension. This volume strain can be ascribed to microscale deformation and dam-
age mechanisms such as rubber cavitation, void growth and crazing in the ABS phase,
e.g. [2, 8, 17], as well as eventual interface debonding [15]. The somewhat larger dilation
of PC/ABS(45/55) can be attributed to its higher ABS content. For strains larger than
about 0.6, the difference in the dilatancy of the two materials becomes significant. The
volume strain then decreases again with axial strain, particularly for PC/ABS(70/30).
This transition may heuristically be explained as follows: PC deforms essentially by iso-
choric shear yielding, whereas ABS is known to display itself a pronounced dilatancy due
to above mentioned mechanisms. In the early stage of plastic straining with an almost
constant (plateau-like) stress response of both PC/ABS blends (Fig. 3) this leads to only
a gradually larger dilation of the ABS-rich material. At larger strain (> 0.6), however,
where PC hardens much stronger than ABS (e.g. [11],[13]) the overall load is increasingly
borne by the (incrompressible) PC phase which thus dominates the overall response of
PC/ABS. In the range of progressive hardening this leads to a decrease of volume strain
with axial strain with a stronger effect in case of the PC-rich material (Fig. 4).
0
0.1
0.2
0.3
0.4
0 0.1 0.2 0.3 0.4 0.5 0.6 0.7 0.8 0.9
log. volu
me s
train
log. axial strain
PC/ABS(45/55)
PC/ABS(70/30)
ABS content
Figure 4: Composition dependent dilation behavior of PC/ABS at a strain rate of ε =
0.1 sec−1.
As typical for thermoplastic polymers, PC/ABS blends exhibit a rate-dependent behav-
ior with a higher stress level for higher strain rates. However, since the rate-dependence
of PC/ABS is not in the scope of the present study, corresponding experimental results
are for brevity only shown in Sect. 4 in conjunction with the calibration of constitutive
models.
6

2.2 Fracture tests
Fracture tests were carried out on single-edge-notch-tension (SENT) specimens (Fig. 5)
with a cross head speed of 1mm/sec. The notch radius in these tests was 1mm while the
specimen thickness was 3mm.
00
2
2
4
4
u
Figure 5: SENT specimen geometry (in mm, thickness 3 mm) used in fracture tests.
The distribution of the strain in the tensile direction obtained from digital image corre-
lation (DIC) at the specimen surface is shown in Fig. 6 for both materials at two successive
loading stages (overall specimen elongation u). As characteristic for rubber-toughened
0.62
0.55
0.48
0.40
0.30
0.17
0.00
0.67
-0.25
(a) PC/ABS(45/55), u = 2.5 mm
log.
str
ain
(b) PC/ABS(70/30), u = 2.5 mm
(c) PC/ABS(45/55), u = 3.0 mm
(d) PC/ABS(70/30), u = 3.0 mm
Figure 6: Contours of log. strain in tensile direction (horizontal) obtained from DIC
showing plastic zone formation at notch in SENT specimen for PC/ABS(45/55) and
PC/ABS(70/30) at two different values of overall specimen elongation u.
polymers, an elongated zone of intense deformation develops ahead of the notch; this in
7

fact represents the plastic deformation zone since strains there are much larger than the
elastic strains (cf. Fig. 3). Owing to the lower yield strength of PC/ABS(45/55) the plastic
zone in this material (Fig. 6a and c, top) is somewhat larger than that in PC/ABS(70/30)
shown in Fig. 6b and d (bottom). An interesting observation is that the plastic zone in
the PC-rich material PC/ABS(70/30) splits up into two branches at some distance ahead
of the notch (Fig. 6b and d) which might be indicative of a through-thickness slip mech-
anism. In the ABS-rich material PC/ABS(45/55) this effect is not visible (Fig. 6a and
c).
The recorded force displacement curves (Fig. 7) show a higher peak load and a slightly
larger overall displacement at complete specimen failure in case of PC/ABS(70/30). The
earlier onset of crack propagation in PC/ABS(45/55) seen in Fig. 6c at a specimen elon-
gation of 3mm is also reflected in the force displacement behavior (Fig. 7) where at
this loading stage the curve of PC/ABS(45/55) is already declining whereas the curve of
PC/ABS(70/30) has not yet reached its peak value.
0
0.5
1
1.5
2
2.5
3
3.5
0 0.5 1 1.5 2 2.5 3 3.5 4 4.5
forc
e [k
N]
displacement [mm]
PC/ABS(45/55)
PC/ABS(70/30)
Figure 7: Force displacement curves of SENT specimen for both materials. Dashed
vertical lines correspond to snap-shots in Fig. 6.
3 Constitutive modeling
3.1 Elastic-viscoplastic behavior - general structure
In the following, the general structure of the constitutive models employed in this work
is presented. In accordance with the experimental findings (Fig. 3), it accounts for small
elastic and large viscoplastic strains. Formulating the constitutive equations in rate form
8
is convenient in view of the subsequent numerical implementation. The total rate-of-
deformation tensor is hence additively split into its elastic and viscoplastic part as D =
De +D
p. The elastic part enters the hypo-elastic relation
▽
σ= C : (D −Dp) (2)
where▽
σ denotes the Jaumann rate of the Cauchy stress tensor σ and C is the isotropic
fourth order elasticity tensor
C =E
1 + ν
(
I+ν
1 + 2νI ⊗ I
)
(3)
with Young’s modulus E, Poisson’s ratio ν and the fourth and second order identity
tensors I and I, respectively. The inelastic part of the rate-of-deformation tensor is taken
to be governed by the normality flow rule
Dp = εpN with N =
∂Φ/∂σ√
∂Φ
∂σ:∂Φ
∂σ
(4)
determined from an isotropic yield function of the general structure
Φ (σ, εp) ≡ Φ (σe, σm)− k (εp) . (5)
The latter is taken to depend on the equivalent von Mises stress σe =√
3
2σ′ :σ′ and the
hydrostatic stress σm = 1
3σ :I, where σ
′ denotes the deviatoric part of the stress tensor.
Through the dependence of the yield function on the hydrostatic stress in conjunction
with the associated flow rule (4), the model features plastic dilatancy as necessary to
appropriately represent the behavior of PC/ABS blends shown in Fig. 4. Despite the
well known fact that thermoplastic polymers exhibit a pronounced kinematic hardening
(Bauschinger effect) due to molecular alignment, e.g. [4, 30], yet in view of the essentially
monotonic loading situations considered in the present work, hardening (as well as intrinsic
softening, Fig. 3) is here simply modeled in an isotropic fashion through the evolution of
the yield strength k(εp) in (5) with the accumulated plastic strain εp =∫ t
0
√D
p :Dp dt.
This dependence is approximated by the relation
k(εp) = β1 + β2 exp (−β3εp) + β4 (ε
p)β5 (6)
with material parameters β1 to β5, which features exponential softening at small plastic
strains and subsequent power-law rehardening. It should be mentioned that a much more
sophisticated model for rubber-toughened (porous) glassy polymers accounting, e.g., for
kinematic hardening has been developed in [4].
9
Rate-dependence is described by an Eyring-type relation for the inelastic strain rate
εp = ε0 exp (AΦ) (7)
with a reference strain rate ε0 and a further material parameter A. The latter might be
taken to depend on temperature which, however, is not an issue here.
3.2 Yield functions
Three different well established isotropic yield functions accounting for a dependence on
hydrostatic stress σm – which in conjunction with the assumed associated flow rule give
rise to plastic volume strain – are considered here to describe the inelastic behavior of the
PC/ABS blends:
Drucker-Prager [6] ΦDP ≡ σe + αDP σm − kDP(εp) , (8)
Raghava [23, 24] ΦR ≡√
σ2e + αR σm − kR(ε
p) , (9)
Green/Gurson-like [9, 12] ΦG ≡1
1− f
√
σ2e + αGfσ2
m − kG(εp) . (10)
The material parameter α individually controls the dependence of the yield functions
on hydrostatic stress. The interrelation between the von Mises and the hydrostatic stress
is linear in case of the Drucker-Prager (DP) model while it is parabolic in the Raghava
(R) model. Following Green [9] or simplifying slightly the Gurson model [12], a quadratic
dependence on both σe and σm is considered in the third yield function (G). In addition,
the latter explicitly depends on the porosity f which according the conservation of mass
is taken to evolve as f = (1− f) tr(Dp). Hence, the Drucker-Prager and the Raghava
model differ only by the (fixed) shape of the ”yield surface”, the size of which varies with
k(εp), whereas in case of the Green/Gurson-like model both the shape and size of the
”yield surface” change with the evolving porosity.
Figures 8 and 9 show the initial yield loci calibrated to the experimental data for
PC/ABS(45/55) and PC/ABS(70/30) under uniaxial tension, i.e. at a stress triaxiality of
η := σm/σe = 1/3. The fact that the different yield surfaces are not perfectly tangential
for uniaxial tension is attributed to fitting the evolution of volume strain (see Figs. 11 and
12 below) as good as possible not only at the onset of yield but over the entire range of
axial strains up to failure. The different slopes of the initial yield surfaces in Figs. 8 and 9
for uniaxial tension (η = 1/3) correspond to the different slopes of the curves in Figs. 11
and 12 at the onset of yield, i.e. at an axial strain of approximately 0.05. Also indicated
as straight diagonal lines in Figs. 8 and 9 are elevated stress triaxialities of η = 1 and
η = 3 as encountered in simulations of notched tensile specimens below (Sect. 5).
10

0
10
20
30
40
50
60
0 20 40 60 80 100 120
Drucker-PragerRaghava
Green/Gurson-like
von
Mis
esst
ress
σe
[MPa]
hydrostatic stress σm [MPa]
η=1/3
η=1
η=3
Figure 8: Initial yield loci in σm-σe-plane calibrated for PC/ABS(45/55) under uniaxial
tension (η = 1/3).
0
10
20
30
40
50
60
70
0 20 40 60 80 100 120 140 160
Drucker-PragerRaghava
Green/Gurson-like
von
Mis
esst
ress
σe
[MPa]
hydrostatic stress σm [MPa]
η=1/3
η=1
η=3
Figure 9: Initial yield loci in σe-σm-plane calibrated for PC/ABS(70/30) under uniaxial
tension (η = 1/3).
4 Parameter calibration
The different constitutive models considered here are chosen as simple as possible (e.g. each
with a constant value of the parameter α in the yield functions (8), (9) and (10)). They
are calibrated for both materials to match the experimental data of the uniaxial ten-
sile tests in terms of the true stress-strain response (Fig. 10) as well as the evolution of
volume strain (Figs. 11 and 12) as good as possible over a large range of deformation,
i.e. up to failure at a logarithmic strain of about 0.8. Figure 10 shows that the uniaxial
stress-strain response of both materials is captured quite well by all three models with
individual parameter values listed in the Appendix.
11

0
20
40
60
80
100
0 0.1 0.2 0.3 0.4 0.5 0.6 0.7 0.8
PC/ABS(45/55)
PC/ABS(70/30)
true
str
ess
[MP
a]
log. axial strain
Drucker-Prager (DP)Raghava (R)
Green/Gurson-like (G)exp. data
ε = 0.1sec−1
Figure 10: Uniaxial stress-strain responses of all models compared to experimental data
for PC/ABS(45/55) and PC/ABS(70/30) at a strain rate of ε = 0.1 sec−1.
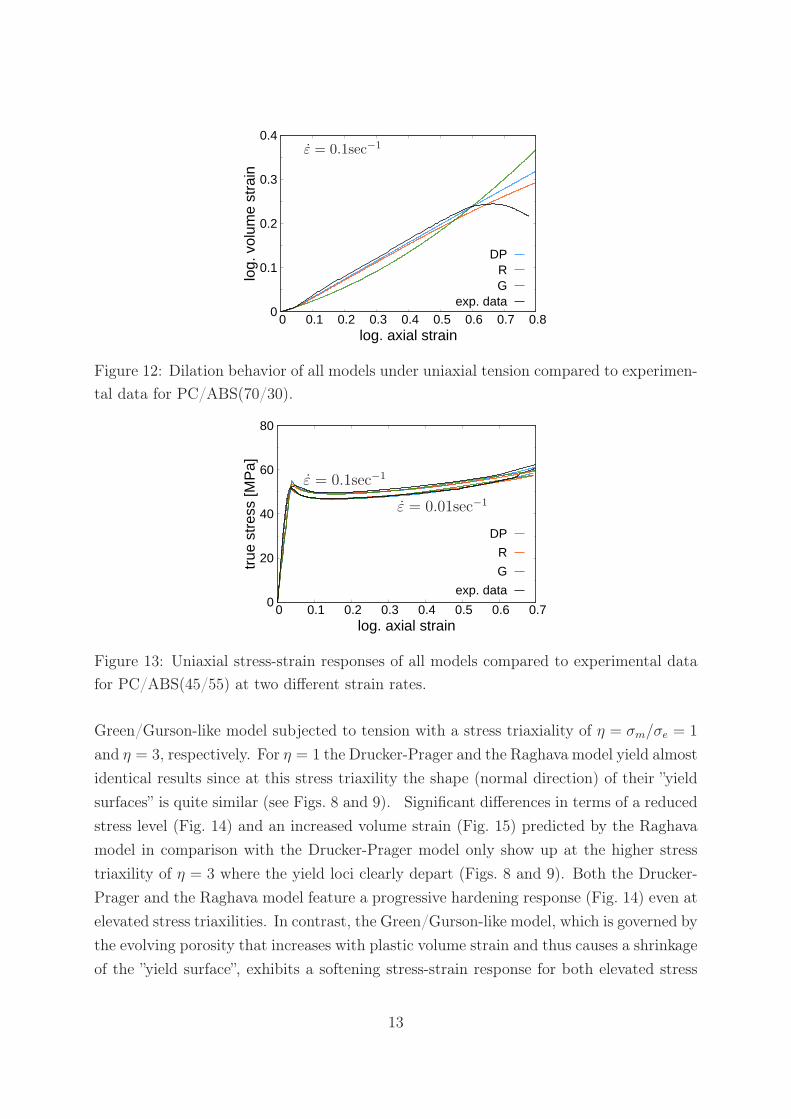
Also reasonably well captured is the accompanying evolution of volume strain (Figs. 11
and 12). Only the saturation or even decrease of volume strain between an axial strain of
0.6 and 0.8 is not accounted for in the constitutive models.
0
0.1
0.2
0.3
0.4
0 0.1 0.2 0.3 0.4 0.5 0.6 0.7 0.8
log.
vol
ume
stra
in
log. axial strain
DPRG
exp. data
ε = 0.1sec−1
Figure 11: Dilation behavior of all models under uniaxial tension compared to experimen-
tal data for PC/ABS(45/55).
Finally, the experimental data for two different strain rates allowed to calibrate the
rate-dependence of the material models in terms of the parameters ε0 and A in (7) as
shown exemplarily for PC/ABS(45/55) in Fig. 13. The complete sets of parameters for
each model is given in Tables 1 and 2 in the Appendix.
As the three different material models have all proven to reasonably well capture the
mechanical behavior of PC/ABS blends under uniaxial tension, it is instructive to look
at their performance under higher stress triaxialities. Figures 14 and 15 therefore depict
the true stress-strain and volumetric strain response of the Drucker-Prager, Raghava and
12
0
0.1
0.2
0.3
0.4
0 0.1 0.2 0.3 0.4 0.5 0.6 0.7 0.8
log.
vol
ume
stra
in
log. axial strain
DPRG
exp. data
ε = 0.1sec−1
Figure 12: Dilation behavior of all models under uniaxial tension compared to experimen-
tal data for PC/ABS(70/30).
0
20
40
60
80
0 0.1 0.2 0.3 0.4 0.5 0.6 0.7
true
str
ess
[MP
a]
log. axial strain
DP
R
G
exp. data
ε = 0.01sec−1
ε = 0.1sec−1
Figure 13: Uniaxial stress-strain responses of all models compared to experimental data
for PC/ABS(45/55) at two different strain rates.
Green/Gurson-like model subjected to tension with a stress triaxiality of η = σm/σe = 1
and η = 3, respectively. For η = 1 the Drucker-Prager and the Raghava model yield almost
identical results since at this stress triaxility the shape (normal direction) of their ”yield
surfaces” is quite similar (see Figs. 8 and 9). Significant differences in terms of a reduced
stress level (Fig. 14) and an increased volume strain (Fig. 15) predicted by the Raghava
model in comparison with the Drucker-Prager model only show up at the higher stress
triaxility of η = 3 where the yield loci clearly depart (Figs. 8 and 9). Both the Drucker-
Prager and the Raghava model feature a progressive hardening response (Fig. 14) even at
elevated stress triaxilities. In contrast, the Green/Gurson-like model, which is governed by
the evolving porosity that increases with plastic volume strain and thus causes a shrinkage
of the ”yield surface”, exhibits a softening stress-strain response for both elevated stress
13

0 0.2 0.4 0.6 0.8
40
80
120
0
true
str
ess
[MP
a]
DPRG
log. axial strain
31
η =η =
Figure 14: Tensile true stress-strain response of the Drucker-Prager, the Raghava and the
Green/Gurson-like model under elevated stress triaxialities η.
DPRG
31
η =η =
0 0.2 0.4 0.6 0.8 0
0.5
1.5
2
1
log.
vol
ume
stra
in
log. axial strain
Figure 15: Evolution of volume strain with axial strain predicted by the three models
under elevated stress triaxialities η.
triaxialities (Fig. 14). That means that in case of the Green/Gurson-like model the plastic
volume strain (increasing porosity) counteracts and, in fact, dominates strain hardening
exhibited (Fig. 10) under uniaxial tension (η = 1/3). The effect of the different models’
response at elevated stress triaxialities emerges in the following numerical simulations of
plastic zones in notched tensile specimens.
5 Numerical studies
Though available, more or less, in commercial finite element codes, the material models
considered here have for consistency all been implemented as user material routines in the
14

finite element (FE) package Abaqus/Explicit [5]. Thereby, an efficient semi-implicit time
integration of the constitutive equations is employed where only the scalar quantity εp is
updated implicitly whereas the tensorial direction N of plastic flow (see (4)) is updated
in an explicit manner, as suggested e.g. in [1].
FE simulations of the SENT tests presented in Sect. 2.2 are carried out in order to
analyze the performance of the different material models in complex loading situations.
Employing symmetry with respect to the center plane, only half of the SENT specimen
was modeled and corresponding boundary conditions of zero normal displacements and
zero shear stresses were applied throughout the specimen center plane. The FE mesh used
(if not indicated otherwise) consists of 85824 8-node linear displacement brick elements
with reduced integration (C3D8R, see [5]) and is partly shown in Fig. 16.
X
Y
Z
Step: Step−1Increment 1260001: Step Time = 2.5200E−02
X
Y
Z
Figure 16: Finite element model of half the SENT specimen exploiting symmetry with
respect to center plane.
The three-dimensionality of the stress state throughout the specimen is illustrated in
Fig. 17 in terms of the distribution of hydrostatic stress σm which attains significantly
higher values in the specimen center plane than on the free surface.
5.1 Plastic zone formation at a notch
The zone of intense inelastic deformation that develops at a notch or crack tip prior to and
during fracture is generally of great interest as it is directly related to the amount of energy
dissipation and hence the fracture toughness of a material. Much work, hence, has been
devoted to its numerical analysis in case of neat (e.g. [19],[18]) as well as rubber-toughened
thermoplastics (see, e.g., [30] for a review). For instance, addressing in particular PC/ABS
blends, their two-phase microstructure has been explicitely resolved in a 2D plane strain
model considering a crack tip under mode I small scale yielding conditions in [26]. Since
15

44
40
��32
2�24
20
���2�4
0
��
s���e
ec�e� �ce
σm[MPa]
Figure 17: Contours of hydrostatic stress σm on SENT specimen surface (top) and in
center plane (bottom) at a specimen elongation of u = 2.5mm (prior to fracture) simulated
for PC/ABS(70/30) using the Raghava model.
such a micromechanical (”bottom up”) approach significantly suffers from the lack of
knowledge about the individual constituent behavior on the blend microscale as well
as from idealizations in modeling the microstructure, here a macroscopic (”top down”)
approach towards analyzing the plastic zone at a notch is pursued.
In the following, the evolution of the plastic zone ahead of the SENT specimen notch
is simulated utilizing the different models discussed above. For both PC/ABS materi-
als, numerical results are compared to the experimental findings in Sect. 2.2. As it has
turned out that the plastic zone shapes predicted using the Drucker-Prager and Raghava
model are very similar prior to fracture, only results from the Raghava model and the
Green/Gurson-like model are shown in the present section. For a direct comparability
with the experimental results in Fig. 6 the deformation zones are presented in the follow-
ing in terms of the total strain in the tensile direction, which corresponds to plastic strain
in view of only small elastic strains. Contours of the logarithmic strain in the tensile di-
rection at the specimen center plane and at the free surface computed from the Raghava
model are shown for PC/ABS(45/55) in Fig. 18 and for PC/ABS(70/30) in Fig. 19, re-
spectively. The graphs refer to the same two successive loading stages (in terms of overall
specimen elongation u) as the experimental data in Fig. 6.
Generally, the elongated shape of the plastic zone (being typical for rubber-toughened
thermoplastics, e.g. [30]) appears to be reasonably captured by the simulations for both
materials in comparison with the experiments in Fig. 6. Also, its larger extension in case
of PC/ABS(45/55) in Fig. 18 compared to PC/ABS(70/30) in Fig. 19 corresponds to the
experimental findings (Fig. 6). The view into the notch root (center of Figs. 18 and 19)
indicates necking at the specimen surface which was also observed in the experiments.
16

u = 2.5 mm
u = 3.0 mm
center ���� ������e
0.0
0.1
0.2
0.3
0.4
0.5
0.6
0.7
0.8
ε
Figure 18: Zone of intense (∼ plastic) strain in loading direction at notch in
PC/ABS(45/55) simulated using the Raghava model at two successive stages of speci-
men elongation u.
u = 2.5 mm
u = 3.0 mm
center ����� �����!e
0.0
0.1
0.2
0.3
0.4
0.5
0.6
0.7
0.8
ε
Figure 19: Zone of intense (∼ plastic) strain in loading direction at notch in
PC/ABS(70/30) simulated using the Raghava model at two successive stages of speci-
men elongation u.
It should be noted that these findings hold for all experimental tests (with only one
per material shown in Fig. 6); this corresponds to the rather small amount of scatter in
the experimental load-displacement curves in Fig. 7. For both materials, the simulated
deformation zone clearly changes from the interior of the specimen (center plane) to the
free surface, which can be attributed to the differences in hydrostatic stress (see Fig. 17)
that promotes volumetric plastic flow. In case of PC/ABS(45/55), however, the predicted
17

splitting of the deformation zone at the specimen surface, particularly in the earlier loading
stage (u = 2.5mm, see Fig. 18 top right), does not agree with experimental observations
(Fig. 6a and c). The simulated transition from a single localized deformation zone in the
specimen interior to two branches at the free surface indicates plastic flow by a through-
thickness-slip mode (well known from plastically incompressible materials under plane
stress). In the real PC/ABS(45/55), however, such a deformation pattern appears to be
not present (Fig. 6a and c).
Contrarily, in case of PC/ABS(70/30) – the behavior of which is dominated by the
larger amount of the plastically incompressible PC – the computed splitting of the de-
formation zone at the specimen surface (Fig. 19 right) is in fact also visible (though not
very clear) in the experiments (Fig. 6b and d). This might indicate that the suitability of
dilatant plasticity models of the Raghava (or Drucker-Prager) type to capture the defor-
mation behavior of PC/ABS blends under complex loading states with an elevated stress
triaxiality is limited to grades with only a moderate amount of ABS.
Figure 20 shows the deformation zone computed using the Green/Gurson-like model
in case of PC/ABS(45/55); pretty similar results (not shown for brevity) are obtained
from this material model also for PC/ABS(70/30). These numerical results illustrate
center plane "#$%&'e
0.0
0.1
0.2
0.3
0.4
0.5
0.6
0.7
0.8
ε
Figure 20: Zone of intense (∼ plastic) strain in loading direction at notch in
PC/ABS(45/55) simulated using the Green/Gurson-like model at specimen elongation
of u = 2.5mm.
(analogous to earlier studies, see e.g. [30]) that this type of model which is governed by
an evolving porosity, overemphasizes the localization of inelastic deformation and hence
predicts unrealistic narrow deformation zones at a notch. This is despite the fact that
the calibrated Green/Gurson-like model well captures the response of PC/ABS under
uniaxial tension including the progressive hardening at large strains (Fig. 10). Yet, the
shady behavior of this model, giving rise to the results in Fig. 20, could already be
anticipated from its response under elevated stress triaxialities depicted in Fig. 14. Owing
to the large volume strain predicted by the Green/Gurson-like model in such a situation
18

(Fig. 15), necking at the specimen surface did not occur in the finite element simulation
(see Fig. 20, center). Because of its failure to realistically reproduce the deformation zone
at a notch, the Green/Gurson-like model is not further considered in the simulation of
crack propagation in PC/ABS in Sect. 5.2.
The above observations made by comparing the performance of the Raghava, the
Drucker-Prager and the Green/Gurson-like model suggest that an evolving porosity has
a much stronger influence on the plastic zone formation at a notch than the shape of the
yield surface. This was confirmed by simulations carried out using the Green/Gurson-like
model with the evolution of the porosity switched off, which led to plastic zone shapes
rather similar to those obtained using the Raghava or the Drucker-Prager model.
The finding within the present study that the Drucker-Prager and the Raghava model
– despite their different yield surface shapes – lead to almost identical results, has to be
taken with some caution. In case of the considered specimen geometry (with a notch
radius comparable to the specimen thickness) and the coarse modeling of crack advance
by the elimination of (not very small) finite elements (see Sect. 5.2), the simulated local
stress triaxiality ahead of the crack did not exceed a value of 1.5 for which the response
of the two models in terms of their yield surface shape (Figs. 8 and 9) is still pretty close.
A deviation of the models’ responses may, however, be expected for specimens with a
significantly sharper notch giving rise to higher local stress triaxialities.
5.2 Simulation of fracture behavior
As a further inspection of the suitability of the different material models to capture the
behavior of PC/ABS blends, the fracture tests reported in Fig. 7 are simulated. The
Green/Gurson-like model thereby is discarded because of its failure to reproduce the
plastic zone already prior to fracture (Fig. 20). While the Raghava and the Drucker-
Prager model yield almost identical results in terms of the pre-fracture deformation zone
at the SENT specimen notch, it is of interest whether the different shape of their yield
loci at elevated stress triaxiality (see Figs. 8 and 9) becomes noticeable in the situation
of an advancing crack front being much sharper than the initial notch.
Crack propagation in the present work is modeled numerically in a rather coarse manner
by the deletion of finite elements (see Fig. 21) upon fulfillment of a local failure criterion.
Two common criteria (among various others available in the literature; see, e.g., [10])
are considered here which state that ductile failure takes place at a critical value of
accumulated plastic strain
εp =
∫ t
0
√D
p : Dpdt ≥ εpcrit (11)
19
or, alternatively, at a critical value of plastic work per unit volume
wp =
∫ t
0
σ : Dpdt ≥ wpcrit . (12)
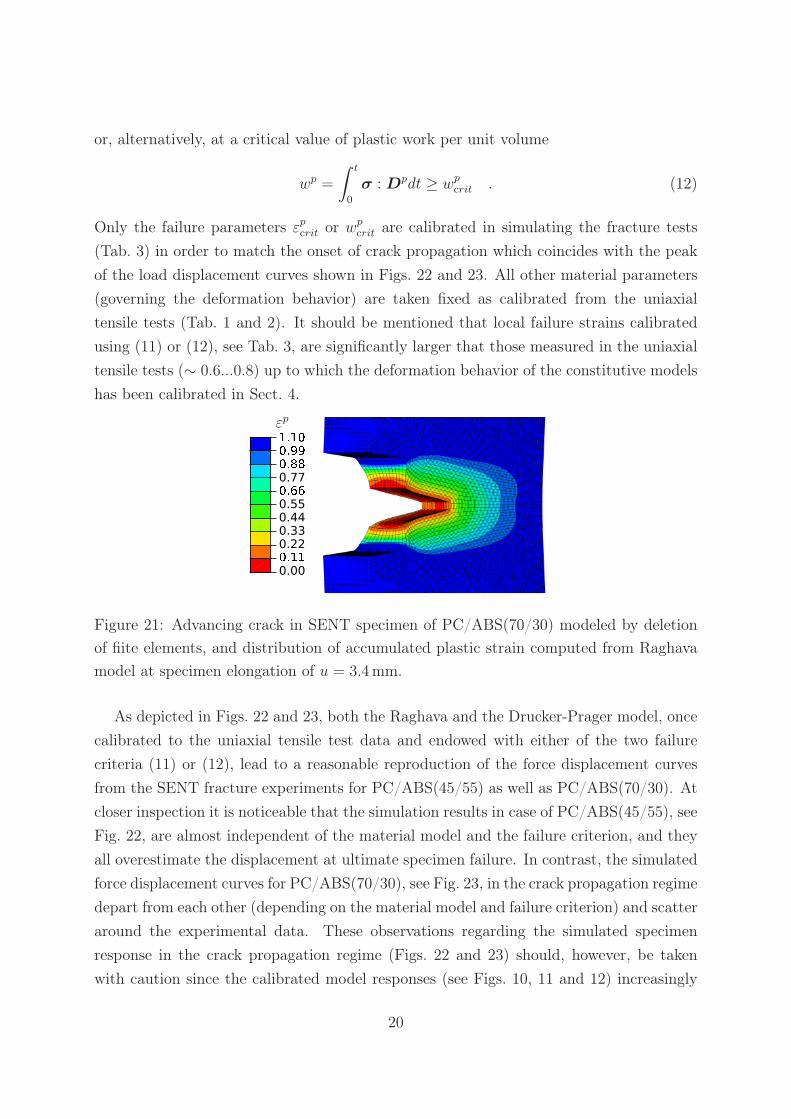
Only the failure parameters εpcrit or wpcrit are calibrated in simulating the fracture tests
(Tab. 3) in order to match the onset of crack propagation which coincides with the peak
of the load displacement curves shown in Figs. 22 and 23. All other material parameters
(governing the deformation behavior) are taken fixed as calibrated from the uniaxial
tensile tests (Tab. 1 and 2). It should be mentioned that local failure strains calibrated
using (11) or (12), see Tab. 3, are significantly larger that those measured in the uniaxial
tensile tests (∼ 0.6...0.8) up to which the deformation behavior of the constitutive models
has been calibrated in Sect. 4.
0.000())
0.220.330.440.550(**
0.770(++
0(,,
)()0
εp
Figure 21: Advancing crack in SENT specimen of PC/ABS(70/30) modeled by deletion
of fiite elements, and distribution of accumulated plastic strain computed from Raghava
model at specimen elongation of u = 3.4mm.
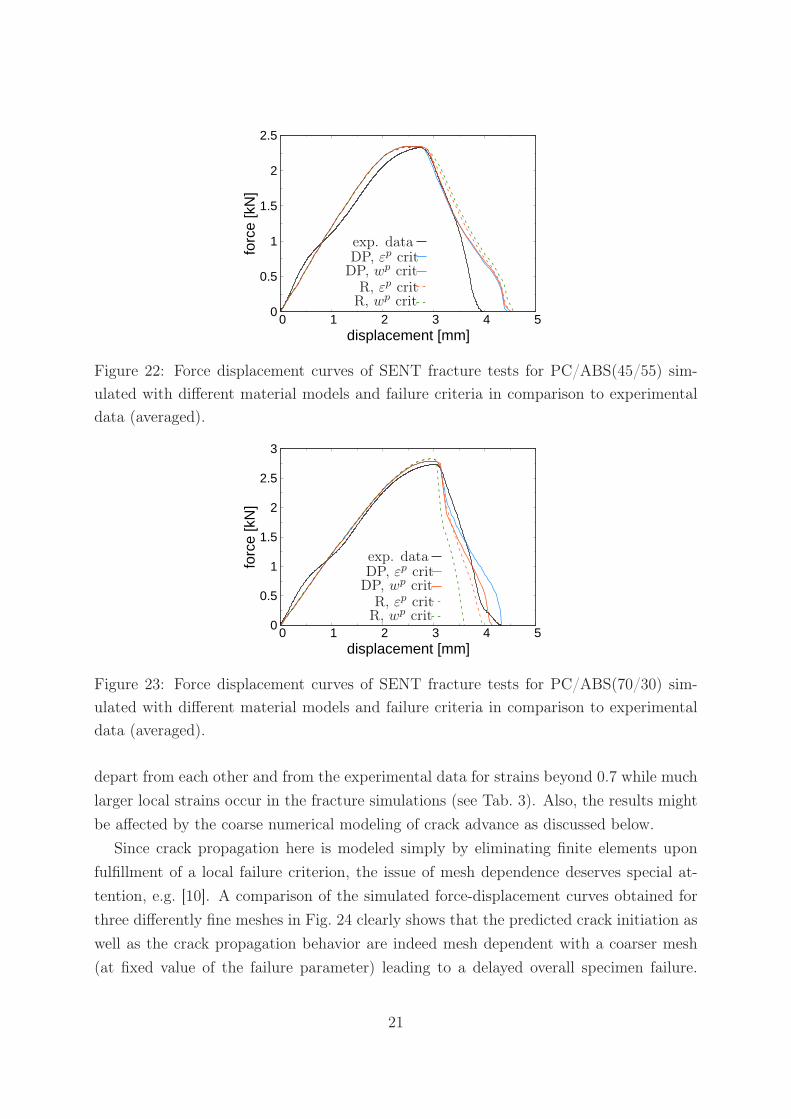
As depicted in Figs. 22 and 23, both the Raghava and the Drucker-Prager model, once
calibrated to the uniaxial tensile test data and endowed with either of the two failure
criteria (11) or (12), lead to a reasonable reproduction of the force displacement curves
from the SENT fracture experiments for PC/ABS(45/55) as well as PC/ABS(70/30). At
closer inspection it is noticeable that the simulation results in case of PC/ABS(45/55), see
Fig. 22, are almost independent of the material model and the failure criterion, and they
all overestimate the displacement at ultimate specimen failure. In contrast, the simulated
force displacement curves for PC/ABS(70/30), see Fig. 23, in the crack propagation regime
depart from each other (depending on the material model and failure criterion) and scatter
around the experimental data. These observations regarding the simulated specimen
response in the crack propagation regime (Figs. 22 and 23) should, however, be taken
with caution since the calibrated model responses (see Figs. 10, 11 and 12) increasingly
20
0
0.5
1
1.5
2
2.5
0 1 2 3 4 5
forc
e [k
N]
displacement [mm]
exp. dataDP, εp crit
DP, wp crit
R, εp critR, wp crit
Figure 22: Force displacement curves of SENT fracture tests for PC/ABS(45/55) sim-
ulated with different material models and failure criteria in comparison to experimental
data (averaged).
0
0.5
1
1.5
2
2.5
3
0 1 2 3 4 5
forc
e [k
N]
displacement [mm]
exp. dataDP, εp crit
DP, wp crit
R, εp critR, wp crit
Figure 23: Force displacement curves of SENT fracture tests for PC/ABS(70/30) sim-
ulated with different material models and failure criteria in comparison to experimental
data (averaged).
depart from each other and from the experimental data for strains beyond 0.7 while much
larger local strains occur in the fracture simulations (see Tab. 3). Also, the results might
be affected by the coarse numerical modeling of crack advance as discussed below.
Since crack propagation here is modeled simply by eliminating finite elements upon
fulfillment of a local failure criterion, the issue of mesh dependence deserves special at-
tention, e.g. [10]. A comparison of the simulated force-displacement curves obtained for
three differently fine meshes in Fig. 24 clearly shows that the predicted crack initiation as
well as the crack propagation behavior are indeed mesh dependent with a coarser mesh
(at fixed value of the failure parameter) leading to a delayed overall specimen failure.
21

Since only the crack propagation regime suffers from mesh dependence, this effect could
be overcome by calibrating the local failure parameters εp or wpcrit to the size of the finite
elements. What is here referred to as the “fine” mesh is the standard mesh with 85824
elements used throughout this work. The “medium” and the “coarse” mesh consist of
26520 and 14544 finite elements, respectively. The relative minimum element lengths are
given in Table 4 in the Appendix.
0
0.5
1
1.5
2
2.5
3
0 1 2 3 4 5 6 7
forc
e [k
N]
displacement [mm]
exp. datafine
mediumcoarse
Figure 24: SENT fracture test for PC/ABS(70/30) simulated using the Raghava model
with the εpcrit failure criterion calibrated to the fine mesh.
6 Summary and conclusions
The motivation of this work was twofold: On the one hand side, it presents an experimen-
tal investigation of the large strain deformation and fracture behavior of rubber-toughened
PC/ABS blends with a focus on the effect of blend composition. In doing so, the local
measurement of strain fields through digital image correlation (DIC) enabled the determi-
nation of the true stress and volumetric strain response in uniaxial tensile tests as well as
the evolution of the plastic zone in notched SENT specimens prior to and during fracture.
On the other hand, different material models – all featuring a plastically dilatant behavior
under tension – are systematically analyzed with regard to their capability to describe the
mechanical response of the considered PC/ABS materials. These models are chosen as
simple as possible to be useful for practical applications such as structural finite element
analyses of technical components. The focus thereby was not on a perfect fit but rather
on the investigation of the effect of basic features such as yield surface shape and porosity
evolution.
The experimental results on two commercial PC/ABS blends with fairly different com-
22

positions (PC vs. ABS content) show a clear influence of the composition on the deforma-
tion and fracture behavior, which is in line with various earlier studies in the literature.
The latter, however, are typically less complete in presenting data on the true stress-strain
response along with the accompanying evolution of volume strain, which are both needed
for an adequate calibration of constitutive models.
The three ”classical” isotropic constitutive models investigated here are the Drucker-
Prager and the Raghava model, which differ only by the shape of the yield surface,
and a Green/Gurson-like model, which additionally displays a dependence of the yield
surface on the evolving porosity (representing microscale damage mechanisms). These
models all proved to well capture the true stress-strain response as well as the evolution
of volume strain of the two PC/ABS blends in uniaxial tensile tests, yet they show a
rather ambivalent performance in finite element simulations of the SENT fracture tests.
Key findings and conclusions from this study are itemized in the following.
• The zone of intense (plastic) deformation that develops at a notch or crack tip in
the course of loading (including crack propagation) is experimentally found to vary
in shape with the blend composition. In particular, in PC/ABS blends with a large
amount of the plastically incompressible PC the crack-tip plastic zone exhibits fea-
tures such as splitting at the specimen surface (likely due to through-thickness-slip)
which is reminiscent of plastically incompressible materials. In ABS-rich blends, in
contrast, a single highly elongated plastic zone similar to that in neat ABS, e.g. [13],
is observed.
• In simulations of the SENT fracture tests on both materials it turned out that
(Green/Gurson-like) models which account for an increasing porosity and thus fea-
ture a shrinkage of the yield surface under high stress triaxiality (as prevailing at a
notch) severly overestimate the localization of plastic strain and hence are not suited
to describe the behavior PC/ABS blends. This corresponds to findings from other
studies applying such a type of model to rubber-toughened polymers as discussed,
e.g., in [30].
• In contrast, plastically dilatant material models which do not feature a shrinkage
of the yield surface with plastic volume strain, such as the Drucker-Prager and the
Raghava model appear to be quite successful in simulations of the overall response
of PC/ABS in SENT fracture tests.
• A closer inspection, however, indicates that the suitability of the simple isotropic
models of Drucker-Prager or Raghava type is limited to PC/ABS grades with a
23

relatively small amount of ABS. In case of the ABS-rich material, these models
showed larger deficiencies in reproducing the plastic zone shape as well as the frac-
ture behavior (overall force-displacement response). One may hence conclude that
the complex behavior of ABS – e.g. its overall anisotropy due to the effect of dis-
tributed crazing [13] – needs to be also accounted for in modeling the mechanical
behavior of ABS-rich PC/ABS blends.
• Through these findings, the present study provides some indication of the range of
applicability of established (i.e. easy to use) material models for numerical structural
analyzes of technical components made of PC/ABS – which is of practical value.
• On the other hand, the revealed limitations of the above discussed models indicate
needs for further fundamental research on the improved constitutive modeling of
PC/ABS, possibly supported by multiscale modeling.
Acknowledgement
Financial support of this work by the German Science Foundation (DFG) under grant
no. SE 872/6-1 is gratefully acknowledged. Also, the authors gratefully acknowledge the
laboratory assistance by W. Wendler as well as the kind supply of the analyzed materials
by Dr. S. Hobeika (Covestro).
References
[1] Belytschko, T., Liu, W. K., Moran, B., and Elkhodary, K. (2013). Nonlinear finite
elements for continua and structures. Wiley.
[2] Bubeck, R. A., Buckley, D. J., Kramer, E. J., and Brown, H. R. (1991). Modes of
deformation in rubber-modified thermoplastics during tensile impact. J. Mat. Sci.,
26(23):6249–6259.
[3] Chiang, W.-Y. and Hwung, D.-S. (1987). Properties of polycarbonate/acrylonitrile-
butadiene-styrene blends. Pol. Eng. Sci., 27(9):632–639.
[4] Danielsson, M., Parks, D. M., and Boyce, M. C. (2007). Micromechanics, macrome-
chanics and constitutive modeling of the elasto-viscoplastic deformation of rubber-
toughened glassy polymers. J. Mech. Phys. Solids, 55:533–561.
24
[5] Dassault Systèmes (2013). Abaqus Analysis User’s Guide, Abaqus 6.13. Vélizy-
Villacoublay.
[6] De Souza Neto, E. A., Peric, D., and Owen, D. R. J. (2011). Computational methods
for plasticity: theory and applications. Wiley.
[7] Fang, Q.-Z., Wang, T. J., Beom, H. G., and Zhao, H. P. (2009). Rate-dependent large
deformation behavior of PC/ABS. Polymer, 50(1):296–304.
[8] Greco, R. (1996). Polycarbonate toughening by ABS. In: Martuscelli, E. et al. (Eds),
Advanced Routes for Polymer Toughening., pages 469–526.
[9] Green, R. J. (1972). A plasticity theory for porous solids. Int. J. Mech. Sci., 14(4):215–
224.
[10] Gross, A. and Ravi-Chandar, K. (2014). Prediction of ductile failure using a local
strain-to-failure criterion. Int. J. Fract., 186:69–91.
[11] G’Sell, C., Hiver, J., Dahoun, A., and Souahi, A. (1992). Video-controlled tensile
testing of polymers and metals beyond the nacking point. J. Mat. Sci., 27:5031–5039.
[12] Gurson, A. L. (1977). Continuum theory of ductile rupture by void nucleation and
growth. J. Eng. Mat. Technol., 99:2–15.
[13] Helbig, M., Van der Giessen, E., Clausen, A. H., and Seelig, T. (2016). Continuum-
micromechanical modeling of distributed crazing in rubber-toughened polymers.
Eur. J. Mech. A/Solids, 57:108–120.
[14] Hiermaier, S. and Huberth, F. (2012). Volume dilation in a polycarbonate blend at
varying strain rates. Eur. Phys. J. Special Topics, 206:173–181.
[15] Inberg, J. (2001). Fracture of polycarbonate/ABS blends. PhD thesis, University of
Twente.
[16] Inberg, J. and Gaymans, R. (2002). Co-continuous polycarbonate/ABS blends. Poly-
mer, 43:2425–2434.
[17] Ishikawa, M. (1995). Stability of plastic deformation and toughness of polycarbonate
blended with poly(acrylonitrile-butadiene-styrene) copolymer. Polymer, 36(11):2203–
2210.
25

[18] Kattekola, B., Ranjan, A., and Basu, S. (2013). Three dimensional finite element
investigations into the effects of thickness and notch radius on the fracture toughness
of polycarbonate. Int. J. Frac., 181:1–12.
[19] Lai, J. and Van der Giessen, E. (1997). A numerical study of crack-tip plasticity in
glassy polymers. Mech. Mater., 25:183–197.
[20] LIMESS GmbH (2009). Digital Image Correlation. Q-400 Operation Manual. Krefeld.
[21] Lombardo, B. S., Keskkula, H., and Paul, D. R. (1994). Influence of ABS type on mor-
phology and mechanical properties of PC/ABS blends. J. Appl. Pol. Sci., 54(11):1697–
1720.
[22] Nigam, I., Nigam, D., and Mathur, G. N. (2005). Effect of rubber content in ABS
on properties of PC/ABS blends. Pol.-Plast. Tech. Eng., 44:815–832.
[23] Polanco-Loria, M., Clausen, A. H., Berstad, T., and Hopperstad, O. S. (2010). Con-
stitutive model for thermoplastics with structural applications. Int. J. Impact Eng.,
37(12):1207–1219.
[24] Raghava, R., Caddell, R. M., and Yeh, G. S. Y. (1973). The macroscopic yield
behaviour of polymers. J. Mat. Sci., 8:225–232.
[25] Seelig, T. and Van der Giessen, E. (2002). Localized plastic deformation in ternary
polymer blends. Int. J. Solids Structures, 39:3505–3522.
[26] Seelig, T. and Van der Giessen, E. (2007). Effects of microstructure on crack tip
fields and fracture toughness in PC/ABS polymer blends. Int. J. Fract., 145:205–222.
[27] Seidler, S. and Grellmann, W. (1993). Fracture behaviour and morphology of
PC/ABS blends. J. Mat. Sci., 28(15):4078–4084.
[28] Suarez, H., Barlow, J. W., and Paul, D. R. (1984). Mechanical properties of
ABS/polycarbonate blends. J. Appl. Pol. Sci., 29(11):3253–3259.
[29] Tan, Z. Y., Xu, X. F., Sun, S. L., Zhou, C., Ao, Y. H., Zhang, H. X., and Han,
Y. (2006). Influence of rubber content in ABS in wide range on the mechanical prop-
erties and morphology of PC/ABS blends with different composition. Pol. Eng. Sci.,
46(10):1476–1484.
26
[30] Van der Giessen, E. and Seelig, T. (2015). Computational modeling of rubber-
toughening in amorphous thermoplastic polymers: a review. Int. J. Fract., 196(1):207–
222.
[31] Wang, H., Zhou, H., Huang, Z., Zhang, Y., Qiao, H., and Yu, Z. (2016). Experimental
investigation and modeling of the mechanical behavior of PC/ABS during monotonic
and cyclic loading. Polymer Testing, 50:216–223.
[32] Wildes, G., Keskkula, H., and Paul, D. R. (1999). Fracture characterization of
PC/ABS blends: effect of reactive compatibilization, ABS type and rubber concentra-
tion. Polymer, 40(25):7089–7107.
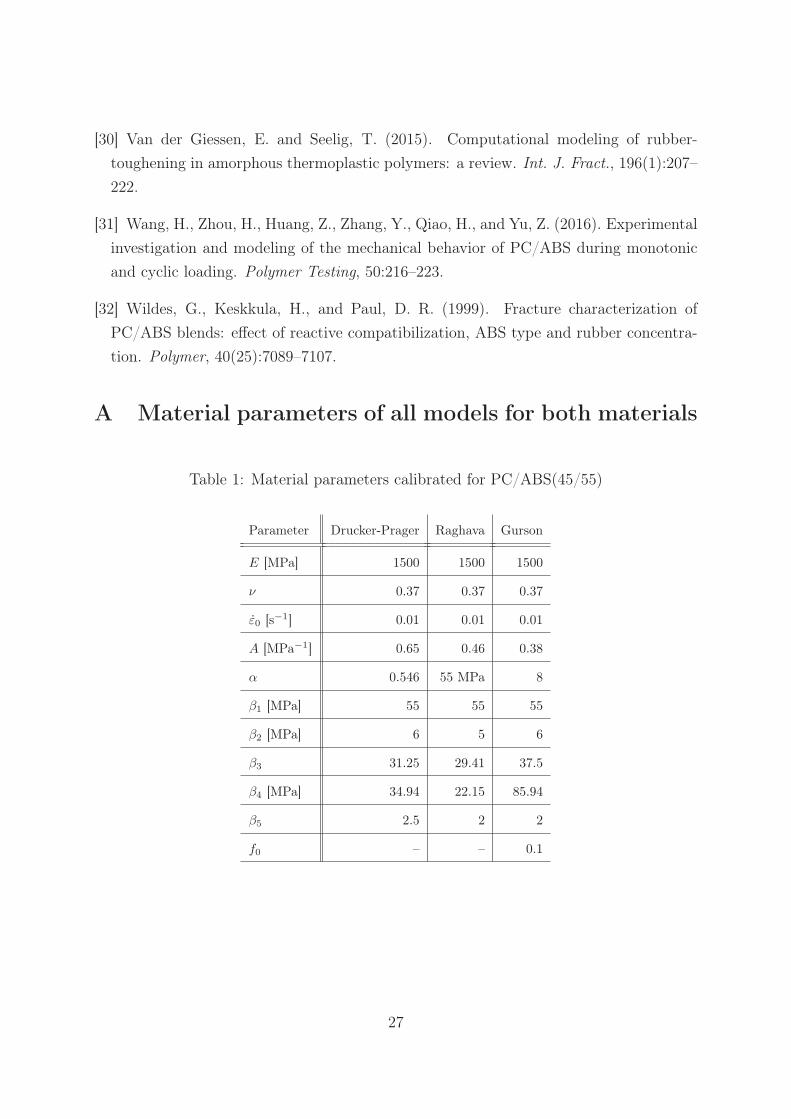
A Material parameters of all models for both materials
Table 1: Material parameters calibrated for PC/ABS(45/55)
Parameter Drucker-Prager Raghava Gurson
E [MPa] 1500 1500 1500
ν 0.37 0.37 0.37
ε0 [s−1] 0.01 0.01 0.01
A [MPa−1] 0.65 0.46 0.38
α 0.546 55 MPa 8
β1 [MPa] 55 55 55
β2 [MPa] 6 5 6
β3 31.25 29.41 37.5
β4 [MPa] 34.94 22.15 85.94
β5 2.5 2 2
f0 – – 0.1
27
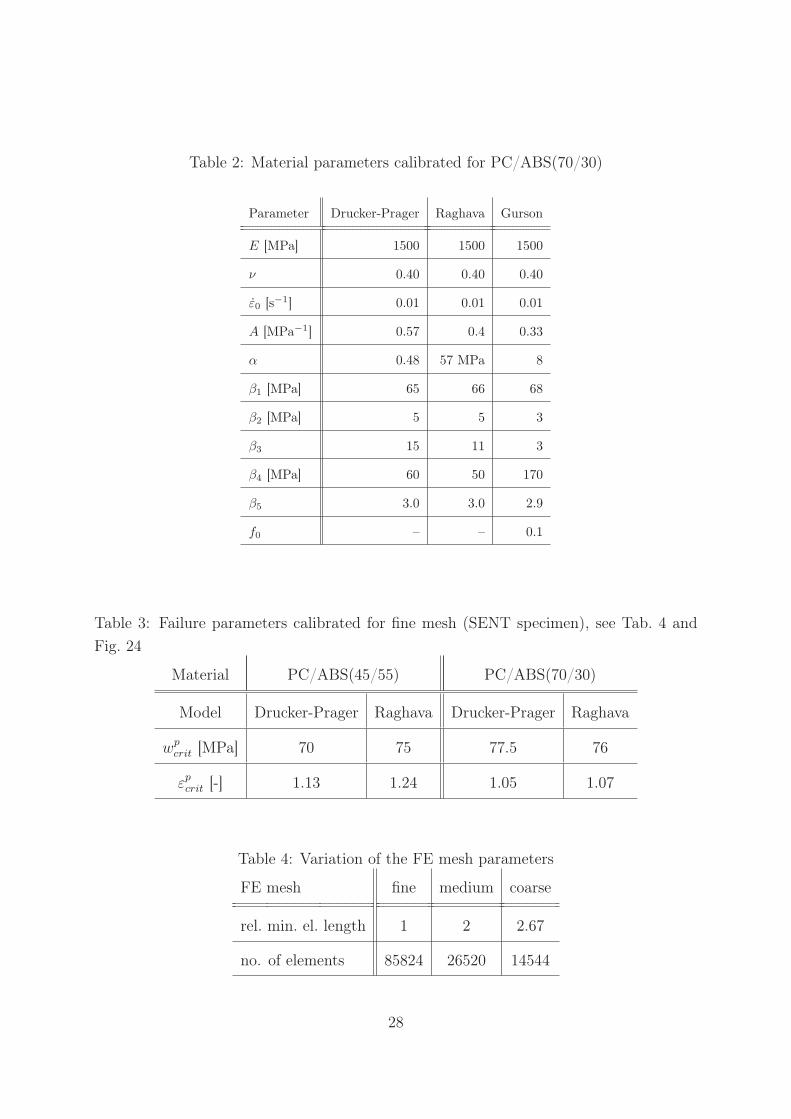
Table 2: Material parameters calibrated for PC/ABS(70/30)
Parameter Drucker-Prager Raghava Gurson
E [MPa] 1500 1500 1500
ν 0.40 0.40 0.40
ε0 [s−1] 0.01 0.01 0.01
A [MPa−1] 0.57 0.4 0.33
α 0.48 57 MPa 8
β1 [MPa] 65 66 68
β2 [MPa] 5 5 3
β3 15 11 3
β4 [MPa] 60 50 170
β5 3.0 3.0 2.9
f0 – – 0.1
Table 3: Failure parameters calibrated for fine mesh (SENT specimen), see Tab. 4 and
Fig. 24
Material PC/ABS(45/55) PC/ABS(70/30)
Model Drucker-Prager Raghava Drucker-Prager Raghava
wpcrit [MPa] 70 75 77.5 76
εpcrit [-] 1.13 1.24 1.05 1.07
Table 4: Variation of the FE mesh parameters
FE mesh fine medium coarse
rel. min. el. length 1 2 2.67
no. of elements 85824 26520 14544
28