An Examination of Interfering Factors in the ASTM D-1838 ... Interfering... · ASRL # 888-2005-2006...
47
GPA Research Report RR-190 GPA RESEARCH PROJECT No. 982-2 An Examination of Interfering Factors in the ASTM D-1838 Copper Strip Test ASRL # 888-2005-2006 P.D. Clark and K.L. Lesage, Alberta Sulphur Research Ltd., c/o Department of Chemistry, The University of Calgary, Calgary, Alberta, Canada March 2006
Transcript of An Examination of Interfering Factors in the ASTM D-1838 ... Interfering... · ASRL # 888-2005-2006...

GPA Research Report
RR-190
GPA RESEARCH PROJECT No. 982-2
An Examination of Interfering Factors in the ASTM D-1838 Copper Strip Test
ASRL # 888-2005-2006
P.D. Clark and K.L. Lesage, Alberta Sulphur Research Ltd., c/o Department of
Chemistry, The University of Calgary, Calgary, Alberta, Canada
March 2006

i
II. FOREWORD This project continues GPA’s research program on trace specie impact on the Copper Strip Test (ASTM D-1838). This continuation of Project 982 and was designed to verify and validate the Copper Strip Test for LP Gas. This work was supported with funding from the Propane Education and Research Council. Based on the results presented in this report and the previous work on this project, the following conclusions can be made:
The Copper Strip Test accurately detects corrosion for several containments commonly found in LP Gas.
Even with the addition of water as required by ASTM D-1838, Carbonyl Sulfide
does not reliably produce a corrosive test coupon.
Use of the Copper Strip Test requires that one rigorously follow the test procedure, including the use of the proper apparatus and methods. The findings of previous studies which did not precisely follow ASTM D-1838 are therefore suspect.
______________________ ________________________ Dan McCartney, Coordinator Arild Wilson, GPA Project 982 Sub-group #1 Chairman ______________________ David Bergman, Section F Chairman

i i
III. DISCLAIMER AND COPYRIGHT NOTICE GPA publications necessarily address problems of a general nature and may be used by anyone desiring to do so. Every effort has been made by GPA to assure accuracy and reliability of the information contained in its publications. With respect to particular circumstances, local, state, and federal laws and regulations should be reviewed. It is not the intent of GPA to assume the duties of employers, manufacturers, or suppliers to warn and properly train employees, or others exposed, concerning health and safety risks or precautions. GPA makes no representation, warranty, or guarantee in connection with this publication and hereby expressly disclaims any liability or responsibility for loss or damage resulting from its use or for the violation of any federal, state, or municipal regulation with which this publication may conflict, or any infringement of letters of patent regarding apparatus, equipment, or method so covered. Entire contents Copyright © 2006 by Gas Processor’s Association, all rights reserved.

i i i
IV. TABLE OF CONTENTS II. FOREWORD ………………………………………………………………… i
III. DISCLAIMER AND COPYRIGHT NOTICE ………………………………ii
IV. TABLE OF CONTENTS ……………………………………………………iii
V. LIST OF TABLES …………………………………………………………... iv
VI. LIST OF FIGURES ………………………………………………………… iv
VII. INTRODUCTION ………………………………………………………….. 1
VIII. OVERALL RESULTS AND CONCLUSIONS ……………………………1
IX. DISCUSSION OF RESULTS ………….…………………………………….2
Test Matrix and Results ………………………………………………….2
Interpretation and Conclusions from Individual Sets of Tests …………..4
Blank tests ……………………………………………………….4
Test with Hydrogen Sulfide (H2S) ………………………………4
Tests with Elemental Sulfur (S8) ………………………………...4
Tests with Carbonyl Sulfide (COS) ………………………….…..5
Tests with Oxygen (O2) ………………………………………….5
Tests with carbon dioxide (CO2)…………………………………5
Test with a Combination of H2S and O2 …………………………5
Test with a Combination of H2S and CO2 ……………………….6
Test with a Combination of COS and O2 ………………………..6
X. EXPERIMENTAL DETAIL …………………………………………………..7
XI. REFERENCES…..……………………………………………………………9
XII. APPENDIX
A-1. Data tables …………………………………………………………10
A-2. Figures ……………………………………………………………..14
A-3. Reaction Schemes for Interaction of Trace Contaminants
with Copper Surfaces …………………………………………….41

i v
V. LIST OF TABLES Table 1. Matrix of Tests ……………………………………………….…………….….3 Table 2. Results of Copper Strip Tests…………………………………………………..3 Appendix A1: Gas composition of propane mixtures pre and post copper strip testing
Table A1-1. Propane + H2S …………………………………………...10 Table A1-2. Propane + COS …………………………………….….....10 Table A1-3. Propane + O2 ……………………………………….….…11 Table A1-4. Propane + CO2 ………………………………………..….11 Table A1-5. Propane + H2S and O2 …………………………………...12 Table A1-6. Propane + H2S and CO2. .………………………………...12 Table A1-7. Propane + COS and O2 … …………………………….....13
VII. LIST OF FIGURES Figure 1. Reproduction of the ASTM Copper Strip Corrosion Standards Plaque ….….14 Figure 2. Instrument Propane Blank …………………………………………………...15 Figure 3. H2S – 5 ppmw in Propane …………………………………………………...16 Figure 4. H2S – 10 ppmw in Propane ……………………………………………….…17 Figure 5. H2S – 20 ppmw in Propane ……………………………………………….…18 Figure 6. S8 – 5 ppmw in Propane ………………………………………………….….19 Figure 7. S8 – 10 ppmw in Propane ……………………………………………………20 Figure 8. S8 – 20 ppmw in Propane ……………………………………………………21 Figure 9. COS – 5 ppmw in Propane …………………………………………………..22 Figure 10. COS – 10 ppmw in Propane ………………………………………………..23 Figure 11. COS – 20 ppmw in Propane ………………………………………………..24 Figure 12. COS – 100 ppmw in Propane ………………………………………………25 Figure 13. O2 – 50 ppmw in Propane ………………………………………………….26 Figure 14. O2 – 100 ppmw in Propane ………………………………………………...27 Figure 15. O2 – 1000 ppmw in Propane ……………………………………………….28 Figure 16. CO2 – 10 ppmw in Propane ………………………………………………..29 Figure 17. CO2 – 100 ppmw in Propane ………………………………………………30 Figure 18. CO2 – 1000 ppmw in Propane ……………………………………………..31 Figure 19. H2S – 5 ppmw + O2 – 100 ppmw in Propane ……………………………...32 Figure 20. H2S – 5 ppmw + O2 – 1000 ppmw in Propane …………………………….33 Figure 21. H2S – 10 ppmw + O2 – 1000 ppmw in Propane …………………………...34 Figure 22. H2S – 5 ppmw + CO2 – 10 ppmw in Propane ……………………………...35 Figure 23. H2S – 5 ppmw + CO2 – 100 ppmw in Propane …………………………….36 Figure 24. H2S – 10 ppmw + CO2 – 10 ppmw in Propane …………………………….37 Figure 25. COS – 10 ppmw + O2 – 100 ppmw in Propane ……………………………38 Figure 26. COS – 10 ppmw + O2 – 1000 ppmw in Propane …………………………..39 Figure 27. COS – 100 ppmw + O2 – 1000 ppmw in Propane …………………………40

1
VII. INTRODUCTION ASTM D 1838 is a test procedure used to evaluate the potential corrosiveness of liquefied petroleum gas containing trace impurity components towards copper. In summary, the test involves immersion of a polished copper strip in the LPG in question at 100ºF (37.8ºC) for 1 hour and then comparison of the appearance of the strip to a set of commercial standards prepared for use as part of the ASTM procedure. The standards are differentiated into four categories (1 – 4) with sub-classifications of 1a - 1b, 2a – 2e, 3a – 3b and 4a – 4c. The categories 1 – 4 represent slight tarnish, moderate tarnish, dark tarnish and corrosion respectively and the visual appearance of the categories ranges from an off-color copper metal for 1, a range of pinks, green/lavender and brassy gold colors for 2, magenta with over-casts of red and green for 3 and generally dark grays and blacks for 4. The D-ASTM 1838 procedure recognizes the general difficulty of differentiating some of the possible test results by not offering definitive guidelines for absolute assignment of a particular classification within each class.
A review of the literature (refs.) shows that it is generally accepted that hydrogen sulfide (H2S) and elemental sulfur (S8), even at low levels (1 – 20 ppmw), result in corrosion of the copper such that LPG containing these materials will result in 2c – 4c results. Carbonyl sulfide (COS) has been shown not to tarnish copper within the framework of ASTM D-1838, even up to concentrations of 100 ppmw. However, hydrolysis or oxidation of COS may result in production of H2S and S8 respectively, thus leading to field observations that LPG containing COS can fail the copper strip test if air or water contaminants are introduced at a later date.
VIII. OVERALL RESULTS AND CONCLUSIONS A series of ASTM D-1838 copper strip corrosion tests was performed using propane as the base hydrocarbon containing various contaminant species, namely H2S, S8, COS, CO2 and O2. In some cases, a combination of these contaminants was investigated. The concentrations of these components were chosen to meet the levels expected in commercial situations.
H2S and S8 were found to result in test failures at lower levels of 5 and 10 ppmw respectively. H2S resulted in multi-colored green-pink-lavender copper strips at 5 ppmw and dark grey-black strips > 10 ppmw. S8 produced a grey-black copper strip at 10 ppmw or greater concentration. Possibly, a very thin grayish film may have been present using 5 ppmw S8 but, overall, these tests were judged to be 1(a). The very weak dark film using 5 ppmw S8 was not visible in the photographic records made for this project (see Appendix A-2).

2
COS, CO2 and O2 did not produce discoloration of the copper strips at < 100 ppmw concentration, but some discoloration (patchy orange) was observed for COS at 100 ppmw. A greenish tinge was observed for CO2 at high levels but this discoloration was observer dependent and, again, was not visible in photographs (Appendix A-2).
A combination of H2S and O2` results in consumption of the H2S producing copper strips similar in appearance to tests with S8 alone. This observation was made when only 10 ppmw H2S was present in the combined contaminant mixture. In general, a combined test using H2S and CO2 resulted in copper strips similar in appearance to those obtained without CO2. The exception to these observations was when ca. 1000 ppmw CO2 was present in combination with H2S. In this case the multi-color strips produced by H2S alone were replaced by an even dark layer on copper strip.
Tests using a combination of COS and O2 gave results very similar to those without O2 until 1250 ppmw of O2 was present. In this case, the test strips could clearly be designated as “fails” at the 3(a – b) category.
IX. DISCUSSION AND RESULTS Test Matrix and Results The proposed matrix of tests is given in Table 1 and the actual test conditions and result classification for each test are given in Table 2. Note that the very small quantities of sulfur compounds and trace contaminants shown as target concentrations in Table 1 were not achieved precisely because of the experimental limitations in introducing ppm quantities of sulfur compounds and contaminants to liquid propane.
Classification of the test results according to the ASTM standards is subjective and open to observer bias. Thus, the determinations given in Table 2 contain the element of observer judgment. The reader can make his/her own evaluation by consulting the electronic files and photographic records provided with this report.
3
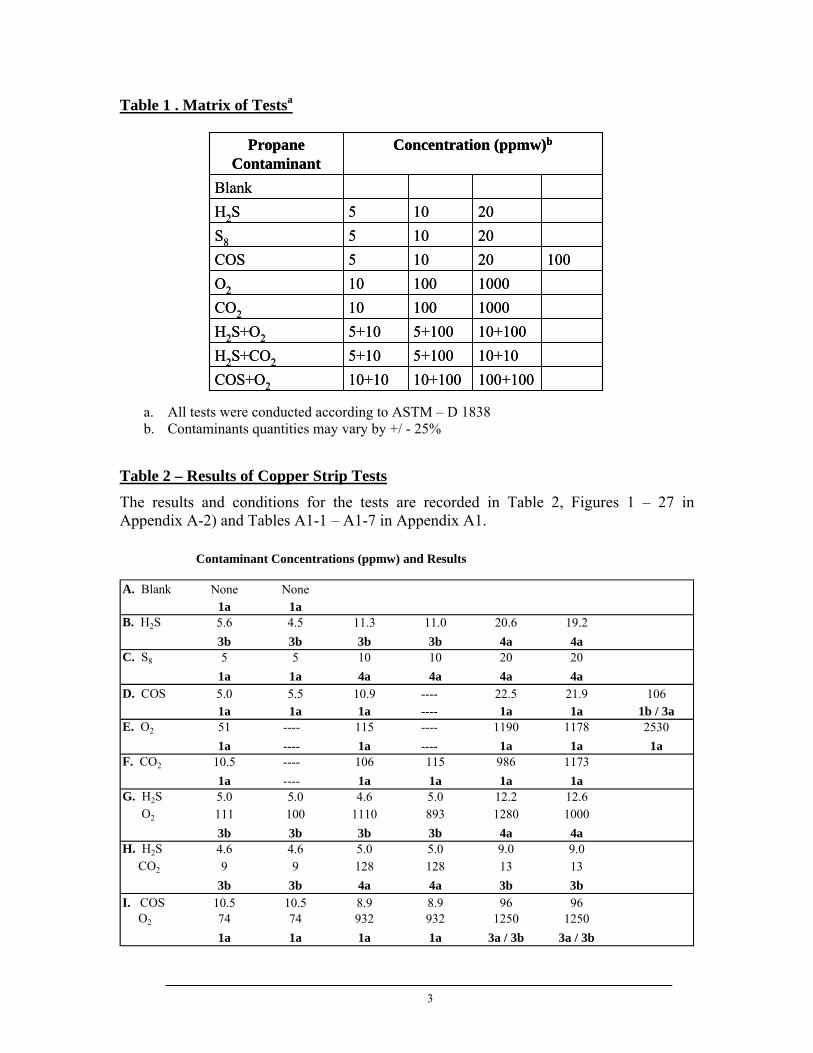
Table 1 . Matrix of Testsa
a. All tests were conducted according to ASTM – D 1838 b. Contaminants quantities may vary by +/ - 25%
Table 2 – Results of Copper Strip Tests The results and conditions for the tests are recorded in Table 2, Figures 1 – 27 in Appendix A-2) and Tables A1-1 – A1-7 in Appendix A1.
Contaminant Concentrations (ppmw) and Results
A. Blank None None1a 1a
B. H2S 5.6 4.5 11.3 11.0 20.6 19.23b 3b 3b 3b 4a 4a
C. S8 5 5 10 10 20 201a 1a 4a 4a 4a 4a
D. COS 5.0 5.5 10.9 ---- 22.5 21.9 1061a 1a 1a ---- 1a 1a 1b / 3a
E. O2 51 ---- 115 ---- 1190 1178 25301a ---- 1a ---- 1a 1a 1a
F. CO2 10.5 ---- 106 115 986 11731a ---- 1a 1a 1a 1a
G. H2S 5.0 5.0 4.6 5.0 12.2 12.6 O2 111 100 1110 893 1280 1000
3b 3b 3b 3b 4a 4aH. H2S 4.6 4.6 5.0 5.0 9.0 9.0 CO2 9 9 128 128 13 13
3b 3b 4a 4a 3b 3bI. COS 10.5 10.5 8.9 8.9 96 96 O2 74 74 932 932 1250 1250
1a 1a 1a 1a 3a / 3b 3a / 3b
100+10010+10010+10COS+O2
10+105+1005+10H2S+CO2
10+1005+1005+10H2S+O2
100010010CO2
100010010O2
10020105COS20105S8
20105H2SBlank
Concentration (ppmw)bPropane Contaminant
100+10010+10010+10COS+O2
10+105+1005+10H2S+CO2
10+1005+1005+10H2S+O2
100010010CO2
100010010O2
10020105COS20105S8
20105H2SBlank
Concentration (ppmw)bPropane Contaminant

4
Interpretation and Conclusions from Individual Sets of Tests As already stated, the reader may wish to consult the electronic files and photographic records provided with this report as assignment of the actual copper strips from each test condition is subject to observer bias.
Blank tests.
Observation of 1(a) results for tests with no contaminants validates that the experimental procedures of ASTM D-1838 were followed successfully and that any small amounts O2 or CO2 that are not purged from the apparatus do not cause a fail result. This result confirms that ASTM D-1838 does give a null result when its procedures are followed.
Tests with hydrogen sulfide (H2S)
A nominal concentration of 5 ppmw H2S in propane results in a 3(b) appearance and 4(a) when the H2S concentration was increased to 20 ppmw. The blue, green, lavender and pink striations of the 3(b) results are likely due to films of copper (I) and copper (II) sulfides lain over the metallic sheen of the copper surface. The darker coloration typical of the 4(a) result could be the product of copper corrosion by a combination of reactions involving S8 as S8 can be formed by the oxidation of H2S by the primary corrosion product copper (II) sulfide (see Appendix A-3) for schemes summarizing the overall chemistry).
Gas analyses from these tests (Table A1-1)showed that with < 20 ppmw H2S in the initial charge, all of it was consumed by reaction with either the copper strip or was adsorbed on the walls of the apparatus. Some residual H2S was observed when the initial amount was 20 ppmw. The detection of small amounts of O2 at the conclusion of the test, when none had been present at the beginning of a test, may stem from O2 being desorbed from the walls of the apparatus into the propane during the test or by contamination with air during sampling.
Tests with Elemental Sulfur (S8)
A 4(a) result was obtained with 10 ppmw or greater amount of S8 dissolved in propane but interpretation of the 5 ppmw tests is more difficult. A very slight darkening of the copper strip was observed with 5 ppmw but it was difficult to assign the strips to any of the standards. S8 appears to form black copper (II) sulfide as the only product thus the degree of darkening of the strip is homogeneous and dependent on the amount of S8 in the system. 5 ppmw of S8 appears to be near the level at which a fail copper strip test is produced by ASTM D-1838 but it seems that the strip appearances step from 1(a) directly to 4(a) as the concentration of S8 increases.

5
Tests with Carbonyl Sulfide (COS)
COS had no tarnish effect on copper up to concentration of 20 ppmw but a slight discoloration was observed for tests conducted with 100 ppmw. The 100 ppmw tests might be interpreted as either 1(b) or 3(a). These results show that COS does not hydrolyze to H2S under the conditions of ASTM D-1838 despite the presence of free water in the test. Even if the 100 ppmw test is judged to be 3(a) (an orange discoloration), the absence of the classic multicolor striations observed with small amounts of H2S offers further evidence that COS is not hydrolyzed rapidly to H2S under the conditions employed with ASTM-D1838.
The gas analysis data (Table A1-2) show that little or no COS was consumed when the initial quantity was 20 ppmw or less, but the reduction in COS noted for the 100 ppmw experiment is in agreement with the copper strip appearance change observed at this level of COS.
Tests with Oxygen (O2)
The background effect of O2 is of interest because copper (II) oxide is black. However, incorporation of O2 in the 50 – 2500 ppmw range did not produce a positive test illustrating that O2 does not corrode copper over the time-frame of the test.
It is unclear from the gas analysis data (Table A1-3) whether O2 was consumed in any of the experiments with added O2. Thus, the reductions observed at the highest added level could simply be due to adsorption onto the test cylinder surfaces.
Tests with Carbon Dioxide
Tests using a CO2 range of 10 – ca. 1000 ppmw yielded 1(a) tests in all cases although at the highest level a general “greening” of the copper may have been apparent (observer dependent, but not recorded on the photographs). Since it is well known that exposure of copper to the atmosphere will lead to a green color over prolonged periods, it is concluded that the timeframe and conditions of ASTM D-1838 do not duplicate long term environmental exposure of copper to the atmosphere.
The gas analysis data (Table A1-4) reveal that some CO2 was consumed when the propane was charged with ca. 1000 ppmw thus offering an explanation for the “eye-only” observation of a green tinge.
Tests with a Combination of H2S and O2
Since it is well known that O2 converts H2S to S8, a copper strip test with a combination of the two materials may yield corrosion patterns more reminiscent of sulfur. Examination of Table 2 shows that, as expected, the combination of H2S and O2 results in

6
failing tests [3(b)] for low H2S concentrations (4 - 5 ppmw) and 4(a) for 12 ppmw H2S. Interestingly, the 12 ppmw test was more similar in appearance to the corresponding 10 ppmw S8 test than to the 10 ppmw H2S test (with no added O2) in that a generally even, dark discoloration was observed. Inspection of the gas data collected from these tests (Table A1-5) show that all of the H2S was consumed during the one hour period as was the case for H2S tests with up to 10 ppmw H2S (no air) . However, since O2 levels also decrease, this observation is in accord with its consumption by reaction with H2S. H2S can also be moved from the propane by reaction with copper or adsorption onto the test apparatus surfaces.
Tests with a combination of H2S and CO2
A test with 4.6 ppmw H2S and 9 ppmw CO2 resulted in a 3(b) result with similar appearance to the equivalent test without CO2. Likewise tests with 9 and 13 ppmw H2S and CO2 yielded 3(b) results with similar appearances to the test without CO2. However, the test employing 5 and 128 ppmw H2S and CO2 respectively yielded a 4(a) result. In particular, the appearance of these strips was quite different to the 3(b) multi-colored appearances of the 5 ppmw H2S tests without CO2. These results lead to the conclusion that CO2 at > 100 ppmw will result in a change in appearance of the copper strip, most probably as a result of formation of a carbonate film at the copper surface.
Gas analysis data (Table A1-6) show that all H2S was consumed and CO2 is also absorbed on copper surfaces.
Tests with a Combination of COS and O2
One possible outcome of these tests was that COS would be oxidized to S8 thus causing a fail test. With ca. 10 ppmw COS and either 74 or ca. 1000 ppmw O2 only minimal discoloration of the test strip was observed such that the result might be classified as 1(a), possibly 1(b). However, when 100 ppmw COS was present with 1250 ppmw O2, the strips were discolored with classification as 3(a –b). Oxidation of COS would yield both CO2 and S8 suggesting, perhaps, that a dark coloration would have been observed. Since this is not the case, it can be concluded that the oxidation of COS is slow and, most likely, follows a complex pathway which does yield S8 as a prime product.
Interestingly, the gas analysis data (Table A1-7) indicate that very little of the COS was reacted, even when quite high levels of O2 were present. However, it appears that a considerable quantity of O2 was absorbed onto the Copper Strip Vessel (CSV) and copper surfaces. Thus, the fail test observed with 100 ppmw COS may result from a complex combination of species arising from co-absorption of both COS and O2.

7
X. EXPERIMENTAL DETAIL Overall Procedure: The basic procedures outlined in ASTM D-1838 were followed rigorously with deviations described below being employed to add the required contaminants.
Apparatus and Materials: All experiments were conducted in a copper strip vessel using copper strips which met the specifications for the ASTM D-1838 procedure (Koehler Instruments). Sulfur free, liquid propane (Instrument Grade) was supplied by Praxair. The propane purity was validated by gas chromatography fitted with a thermal conductivity detector (detection limits: O2 < 3 ppmw ; CO2 < 4 ppmw) and with a pulsed flame photometric detector for sulfur compounds (COS, H2S, CS2, MeSH, detection limit < 1 ppmw). In most experiments, trace contaminates were added to propane contained in a 500 mL SS charge cylinder. The exact composition of the propane was analyzed by GC prior to purging and filling a CSV. For the binary contaminate experiments (e.g. H2S and O2), one contaminate was added to the charge cylinder and the other was introduced separately into the CSV just prior to propane introduction. In this manner the binary composition was created at the start of the test. In the case of the experiments utilizing S8, the required amount of sulfur was added as a hexane solution to each individual CSV which was then charged with propane. The specific details relating to each experiment will be discussed separately. A GC sampling system was utilized that allowed for removal of a liquid propane sample into a 250 μL sampling loop at 212ºF (100oC). A pneumatic valve then injected the contents of the sample loop into the gas chromatograph. Gas analysis was performed on the propane in the charge cylinder prior to the start of the test as well as on the propane in the CSV at the conclusion of the test. The wetted parts of the test system were 316 SS with fused silica and nylon transfer lines.
Blank Tests: Blank tests were necessary to verify the purity of the propane, the cleanliness of the apparatus and the analytical methodology. The blank test consisted of filling the charge cylinder with propane and performing the ASTM D-1838 test as a propane sample. Gas analyses were performed on the propane that was loaded into the charge cylinder as well the propane in the CSV’s at the conclusion of the test.
Tests with H2S: In these tests the charge cylinder was flushed with pure H2S gas. Liquid propane was then introduced and the charge cylinder to fill it to capacity. Due to the high solubility of H2S in liquid propane the resulting mixture had an H2S concentration > 100 ppmw. The required concentration was prepared by venting a given weight from the charge cylinder and then re-filling with more propane. The exact concentration was verified by gas chromatography prior to the start of the copper strip test.
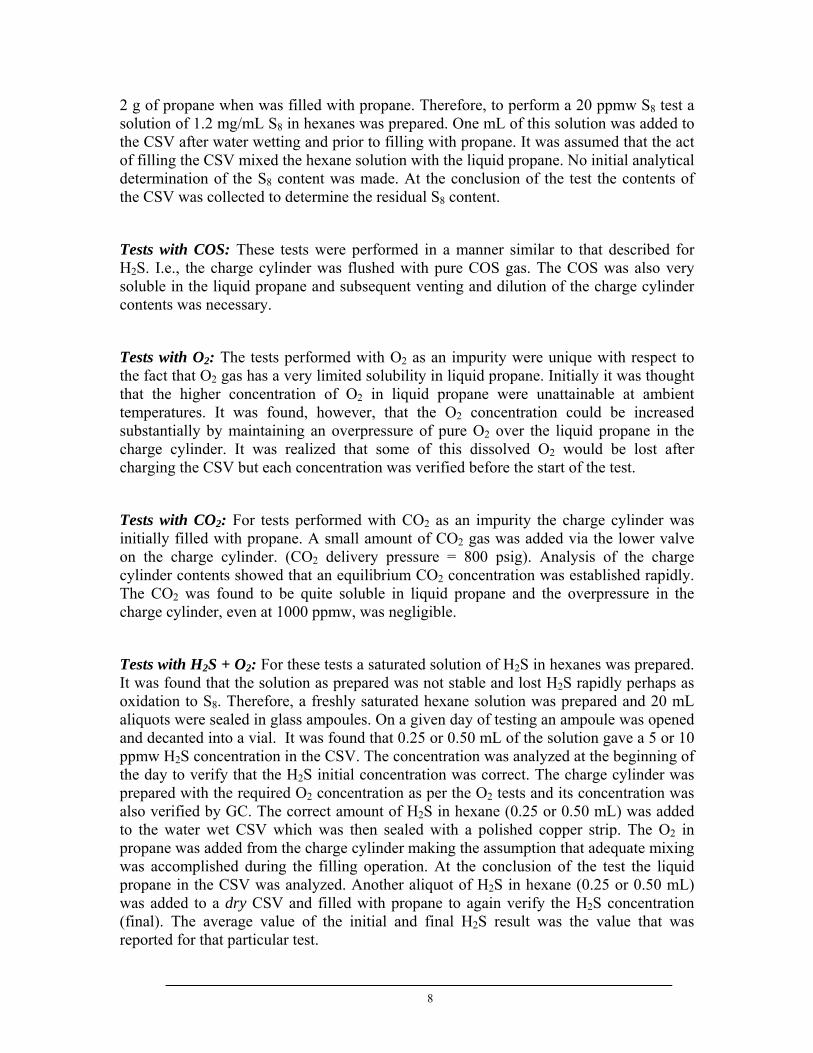
Tests with S8: In these tests a solution of S8 (re-crystallized from toluene) in hexanes was prepared and added to the individual CSV’s. Each CSV was determined to contain 60 +/-
8
2 g of propane when was filled with propane. Therefore, to perform a 20 ppmw S8 test a solution of 1.2 mg/mL S8 in hexanes was prepared. One mL of this solution was added to the CSV after water wetting and prior to filling with propane. It was assumed that the act of filling the CSV mixed the hexane solution with the liquid propane. No initial analytical determination of the S8 content was made. At the conclusion of the test the contents of the CSV was collected to determine the residual S8 content.
Tests with COS: These tests were performed in a manner similar to that described for H2S. I.e., the charge cylinder was flushed with pure COS gas. The COS was also very soluble in the liquid propane and subsequent venting and dilution of the charge cylinder contents was necessary.
Tests with O2: The tests performed with O2 as an impurity were unique with respect to the fact that O2 gas has a very limited solubility in liquid propane. Initially it was thought that the higher concentration of O2 in liquid propane were unattainable at ambient temperatures. It was found, however, that the O2 concentration could be increased substantially by maintaining an overpressure of pure O2 over the liquid propane in the charge cylinder. It was realized that some of this dissolved O2 would be lost after charging the CSV but each concentration was verified before the start of the test.
Tests with CO2: For tests performed with CO2 as an impurity the charge cylinder was initially filled with propane. A small amount of CO2 gas was added via the lower valve on the charge cylinder. (CO2 delivery pressure = 800 psig). Analysis of the charge cylinder contents showed that an equilibrium CO2 concentration was established rapidly. The CO2 was found to be quite soluble in liquid propane and the overpressure in the charge cylinder, even at 1000 ppmw, was negligible.
Tests with H2S + O2: For these tests a saturated solution of H2S in hexanes was prepared. It was found that the solution as prepared was not stable and lost H2S rapidly perhaps as oxidation to S8. Therefore, a freshly saturated hexane solution was prepared and 20 mL aliquots were sealed in glass ampoules. On a given day of testing an ampoule was opened and decanted into a vial. It was found that 0.25 or 0.50 mL of the solution gave a 5 or 10 ppmw H2S concentration in the CSV. The concentration was analyzed at the beginning of the day to verify that the H2S initial concentration was correct. The charge cylinder was prepared with the required O2 concentration as per the O2 tests and its concentration was also verified by GC. The correct amount of H2S in hexane (0.25 or 0.50 mL) was added to the water wet CSV which was then sealed with a polished copper strip. The O2 in propane was added from the charge cylinder making the assumption that adequate mixing was accomplished during the filling operation. At the conclusion of the test the liquid propane in the CSV was analyzed. Another aliquot of H2S in hexane (0.25 or 0.50 mL) was added to a dry CSV and filled with propane to again verify the H2S concentration (final). The average value of the initial and final H2S result was the value that was reported for that particular test.

9
Tests with H2S + CO2: These tests were performed in an analogous manner to the H2S-O2 tests with CO2 being substituted for O2 in the charge cylinder. The same ampoules of H2S in hexanes were used for these tests.
Tests with COS + O2: For these tests a solution of COS in hexanes was prepared and sealed in ampoules. A fresh ampoule was used daily in a manner similar to that described for H2S. It was found that COS was very soluble in the hexanes. One hundred microliters or 1 mL of solution gave COS concentrations of 10 or 100 ppmw respectively in the CSV’s. Again the COS concentration was checked at the beginning (initial) and at the end (final) of the actual copper strip test as separate determinations. A significant portion of the initial COS remained in the CSV’s at the conclusion of the tests. This result indicates that the rate of COS oxidation is slow, relative to the time scale of the ASTM D1838 copper strip test.
XI. REFERENCES • Ferm, R.J. The Chemistry of Carbonyl Sulfide. Chem Rev. 1957, 57, 621.
• Svoronos, P.D.N.; Bruno T.J. Carbonyl Sulfide: A Review of the Chemistry and Properties. Ind. Eng.Chem. Res. 2002, 41, 5321-5336.
• Chalk, G. MetroGas, Inc., Denver, CO. Personal Communication, 2001.
• Andersen, W. C.; Bruno, T.J. Kinetics of Carbonyl Sulfide Hydrolisis. 1. Catalyzed and Uncatalyzed Reactions in Mixtures of Water + Propane. Ind. Eng. Chem. Res. 2003, 42, 963-970.
• Thompson, H.W.; Kearton, C.F.; Lamb, S.A. The Kinetics of the Reaction between Carbonyl Sulphide and Water. J. Chem. Soc. 1935, 1033.

10
XII. APPENDIX A-1. Data Tables (Note: all CSV data were obtained at the conclusion of the tests)
TABLE A 1-1: Propane + H2S
Gas Composition (ppmw in Propane)Nominal
PPMW H2S Sample O2 CO2 COS H2S
5 Charge Cylinder(1) < 3 < 4 < 1 5.4
CSV-1 31 < 4 < 1 < 1
CSV-2 35 < 4 < 1 < 1
10 Charge Cylinder(1) < 3 < 4 < 1 11
CSV-1 25 6 < 1 < 1
CSV-2 20 < 4 < 1 < 1
20 Charge Cylinder(1) < 3 < 4 < 1 19.2
CSV-1 20 < 4 < 1 12.1
CSV-2 15 < 4 < 1 3.5
(1) - Average of 3 or more Determinations
TABLE A 1-2: Propane + COS
Gas Composition (ppmw in Propane)Nominal
PPMW COS Sample O2 CO2 COS H2S
5 Charge Cylinder(1) < 3 < 4 5.5 < 1
CSV-1 3 < 4 4.3 < 1
CSV-2 111 < 4 4.5 < 1
10 Charge Cylinder(1) < 3 < 4 10.9 < 1
CSV-1 < 3 < 4 7.5 < 1
CSV-2 41 < 4 9.5 < 1
20 Charge Cylinder(1) < 3 < 4 21.9 < 1
CSV-1 < 3 < 4 16.0 < 1
CSV-2 3 < 4 15.2 < 1
100 Charge Cylinder(1) < 3 < 4 106 < 1
CSV-1 4 < 4 83 < 1
CSV-2 < 3 < 4 87 < 1
(1) - Average of 3 or more Determinations

11
TABLE A 1-3: Propane + O2
Gas Composition (ppmw in Propane)Nominal
PPMW O2 Sample O2 CO2 COS H2S
50 Charge Cylinder(1) 51 < 4 < 1 < 1
CSV-1 151 < 4 < 1 < 1
CSV-2 237 < 4 < 1 < 1
100 Charge Cylinder(1) 115 < 4 < 1 < 1
CSV-1 20 < 4 < 1 < 1
CSV-2 109 < 4 < 1 < 1
1000 Charge Cylinder(1) 1189 < 4 < 1 < 1
CSV-1 635 < 4 < 1 < 1
CSV-2 598 < 4 < 1 < 1
2500 Charge Cylinder(1) 2530 < 4 < 1 < 1
CSV-1 990 10 < 1 < 1
CSV-2 502 7 < 1 < 1
(1) - Average of 3 or more Determinations
TABLE A 1-4: Propane + CO2
Gas Composition (ppmw in Propane)Nominal
PPMW CO2 Sample O2 CO2 COS H2S
10 Charge Cylinder(1) < 3 10.5 < 1 < 1
CSV-1 7 11 < 1 < 1
CSV-2 10 16 < 1 < 1
100 Charge Cylinder(1) < 3 115 < 1 < 1
CSV-1 3 98 < 1 < 1
CSV-2 6 373 < 1 < 1
1000 Charge Cylinder(1) < 3 986 < 1 < 1
CSV-1 3 696 < 1 < 1
CSV-2 3 448 < 1 < 1
(1) - Average of 3 or more Determinations

12
TABLE A 1-5: Propane + H2S and O2
Gas Composition (ppmw in Propane)Nominal
PPMW H2S Sample O2 CO2 COS H2S- PPMW O2
5 Charge Cylinder(1,2) 100 < 4 < 1 5.0-100
CSV-1 115 29 < 1 < 1
CSV-2 68 < 4 < 1 < 1
5 Charge Cylinder(1,2) 1110 < 4 < 1 4.6-1000
CSV-1 329 < 4 < 1 < 1
CSV-2 225 < 4 < 1 < 1
10 Charge Cylinder(1,2) 1280 < 4 < 1 12.2-1000
CSV-1 131 < 4 < 1 < 1
CSV-2 225 < 4 < 1 < 1
(1) - Average of 3 or more Determinations(2) - H2S added separately to CSV's as a C6 solution
TABLE A 1-6: Propane + H2S and CO2
Gas Composition (ppmw in Propane)Nominal
PPMW H2S Sample O2 CO2 COS H2S- PPMW CO2
5 Charge Cylinder(1,2) < 3 9 < 1 4.6-10
CSV-1 16 < 4 < 1 < 1
CSV-2 9 < 4 < 1 < 1
5 Charge Cylinder(1,2) < 3 128 < 1 5.0-100
CSV-1 15 27 < 1 < 1
CSV-2 < 3 25 < 1 < 1
10 Charge Cylinder(1,2) < 3 13 < 1 9.0-10
CSV-1 < 3 < 4 < 1 < 1
CSV-2 9 < 4 < 1 < 1
(1) - Average of 3 or more Determinations(2) - H2S added separately to CSV's as a C6 solution

13
TABLE A 1-7: Propane + COS and O2
Gas Composition (ppmw in Propane)Nominal
PPMW COS Sample O2 CO2 COS H2S- PPMW O2
10 Charge Cylinder(1,2) 74 < 4 10.5 < 1-100
CSV-1 5 < 4 7.9 < 1
CSV-2 25 < 4 7.0 < 1
10 Charge Cylinder(1,2) 932 < 4 8.9 < 1-1000
CSV-1 100 < 4 9.0 < 1
CSV-2 26 < 4 10.5 < 1
100 Charge Cylinder(1,2) 1250 < 4 96 < 1-1000
CSV-1 3 < 4 86 < 1
CSV-2 12 < 4 95 < 1
(1) - Average of 3 or more Determinations(2) - COS added separately to CSV's as a C6 solution

14
XII. APPENDIX A-2. Figures
Figure 1. Reproduction of the ASTM Copper Strip Corrosion Standards Plaque

15
Figure 2. Instrument Propane Blank

16
Figure 3. H2S – 5 ppmw in Propane

17
Figure 4. H2S – 10 ppmw in Propane

18
Figure 5. H2S – 20 ppmw in Propane

19
Figure 6. S8 – 5 ppmw in Propane

20
Figure 7. S8 – 10 ppmw in Propane

21
Figure 8. S8 – 20 ppmw in Propane

22
Figure 9. COS – 5 ppmw in Propane

23
Figure 10. COS – 10 ppmw in Propane

24
Figure 11. COS – 20 ppmw in Propane

25
Figure 12. COS – 100 ppmw in Propane

26
Figure 13. O2 – 50 ppmw in Propane

27
Figure 14. O2 – 100 ppmw in Propane

28
Figure 15. O2 – 1000 ppmw in Propane

29
Figure 16. CO2 – 10 ppmw in Propane

30
Figure 17. CO2 – 100 ppmw in Propane

31
Figure 18. CO2 – 1000 ppmw in Propane

32
Figure 19. H2S – 5 ppmw + O2 – 100 ppmw in Propane

33
Figure 20. H2S – 5 ppmw + O2 – 1000 ppmw in Propane

34
Figure 21. H2S – 10 ppmw + O2 – 1000 ppmw in Propane

35
Figure 22. H2S – 5 ppmw + CO2 – 10 ppmw in Propane

36
Figure 23. H2S – 5 ppmw + CO2 – 100 ppmw in Propane

37
Figure 24. H2S – 10 ppmw + CO2 – 10 ppmw in Propane

38
Figure 25. COS – 10 ppmw + O2 – 100 ppmw in Propane

39
Figure 26. COS – 10 ppmw + O2 – 1000 ppmw in Propane

40
Figure 27. COS – 100 ppmw + O2 – 1000 ppmw in Propane
Note: The top part of the middle strip was exposed to propane vapor due to leakage of some propane

41
XII. APPENDIX A-3. Reaction Schemes for Interaction of Trace Contaminants with Copper
Scheme 1
Copper Strip Chemistry in the Presence of H2S and Sulfur (Simplified)
H2S + Cu Cu S + H2(surface) (black)
IIH2O
2 Cu S + H2S 2 Cu S + 2 H+ + 1/8 S8(primary corrosion (green/red)
product)
II IH2O
Cu + 1/8 S8 Cu S(black)
IIH2O
Key points
• Colors will be dependent of corrosion film thickness
• Cu S overlain on a copper surface may produce multi-color test
• Reaction with S8 to form Cu S could be the reason for even black discoloration
I
II
Scheme 2
Copper Strip Chemistry in the Presence of CO2 and H2S
Cu + CO2 CuCO3 + H2
(surface) (blue-green)
CuCO3 + H2O Cu (OH)2 + CO2
(blue-green)
Cu (OH)2 + H2S Cu S + 2 H2O
H2O
II
(black)
Key points
• An initial carbonate and hydroxide corrosion film may result in an even black
discoloration when H2S is present

42
Scheme 3
Copper Strip Chemistry in the Presence of COS
COS + Cu No immediate chemistry
COS + ½ O2 CO2 + 1/8 S8 (very slow)
COS + H2O CO2 + H2S (very slow)
Key points
• None of these reactions take place at a significant rate, although the reaction
with O2 may occur to small degree over the time frame of the test
H2O
H2O
100ºF