An evaluation of the skill of ENSO forecasts during 20022009 · seasons, drawn from random years...
37
An evaluation of the skill of ENSO forecasts during 20022009 Tony Barnston and Mike Tippett IRI Lead: 1 2 3 4 5 6 7 8 9
Transcript of An evaluation of the skill of ENSO forecasts during 20022009 · seasons, drawn from random years...
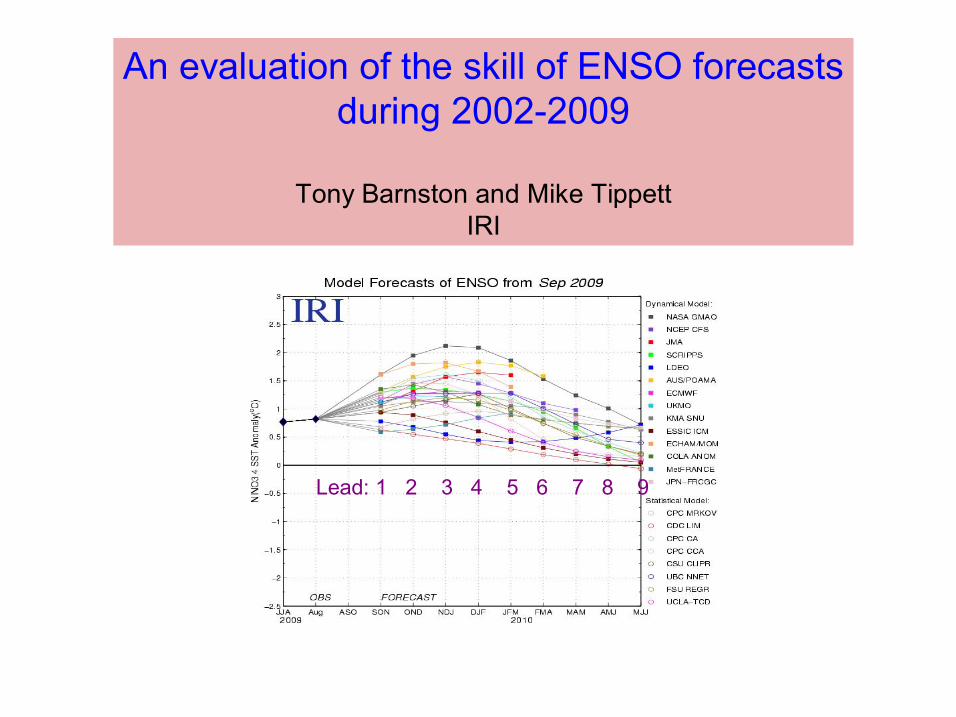
An evaluation of the skill of ENSO forecasts during 20022009
Tony Barnston and Mike Tippett IRI
Lead: 1 2 3 4 5 6 7 8 9

2002 03 04 05 06 07 08 09 10
2002 03 04 05 06 07 08 09 10
2002 03 04 05 06 07 08 09 10
All Models
Dynamical
Statistical
forecasts at 4 leads
Nino3.4 anomaly
Nino3.4 anomaly
Nino3.4 anomaly

3
2
1
0
1
2
3
MME Mean by Model Type, 1month lead
2002 2003 2004 2005 2006 2007 2008 2009
OBS
ALL
DYN STAT
.
DYN models called for 2007/08 La Nina onset too early

3
2
1
0
1
2
3
MME Mean by Model Type, 5month lead
2002 2003 2004 2005 2006 2007 2008 2009
OBS
DYN
STAT
ALL
DYN models did well for the 2007/08 La Nina
.

3
2
1
0
1
2
3
Selected Dynamical Models, 1month lead
2002 2003 2004 2005 2006 2007 2008 2009
OBS
CFS
ECMWF
GMAO
GMAO
ECMWF
CFS
3
2
1
0
1
2
3
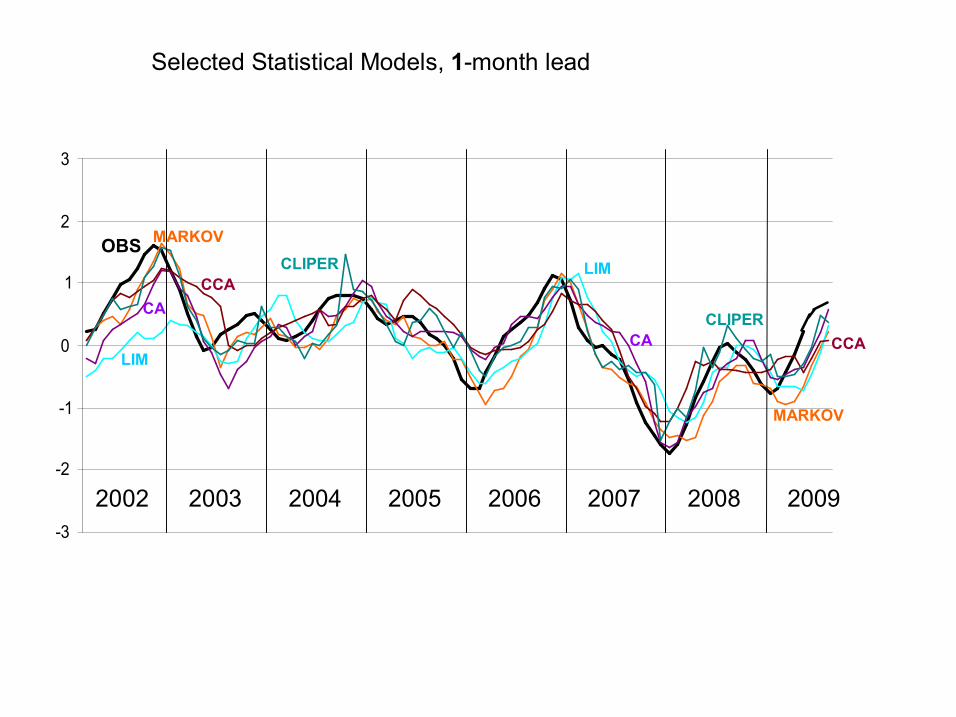
Selected Statistical Models, 1month lead
2002 2003 2004 2005 2006 2007 2008 2009
OBS MARKOV
CCA
LIM
CA
CLIPER
MARKOV
CLIPER
LIM
CCA CA

3
2
1
0
1
2
3
Selected Dynamical Models, 5month lead
2002 2003 2004 2005 2006 2007 2008 2009
OBS GMAO
CFS LDEO
CFS
GMAO
LDEO
.
.
. .
.
.
3
2
1
0
1
2
3
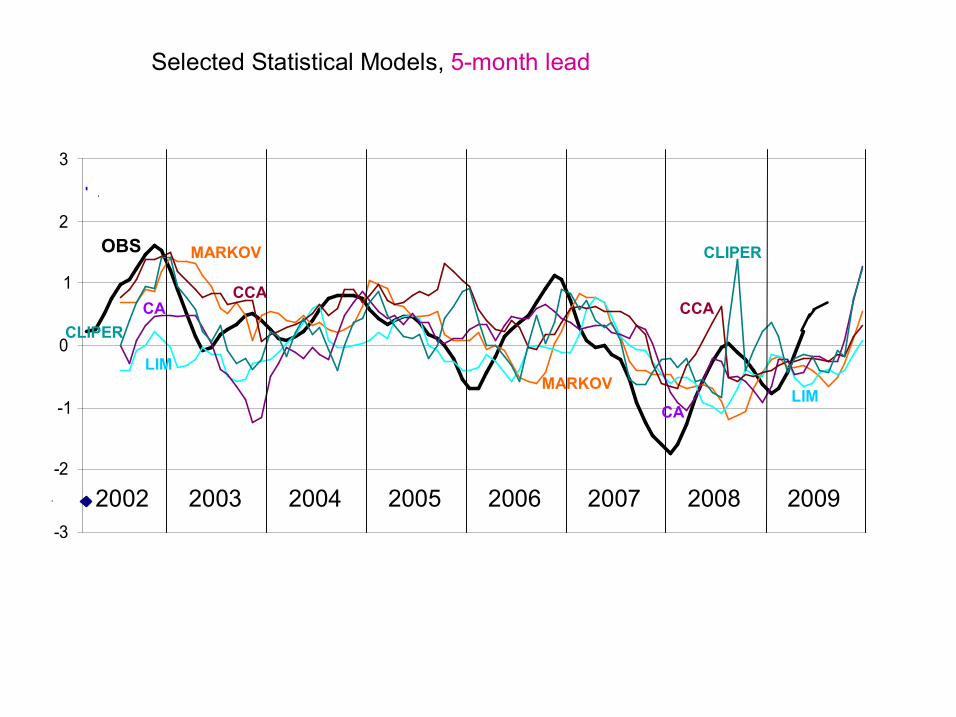
Selected Statistical Models, 5month lead
2002 2003 2004 2005 2006 2007 2008 2009
OBS MARKOV
CCA
LIM
CA CLIPER
.
.
CLIPER
LIM CA
CCA
MARKOV
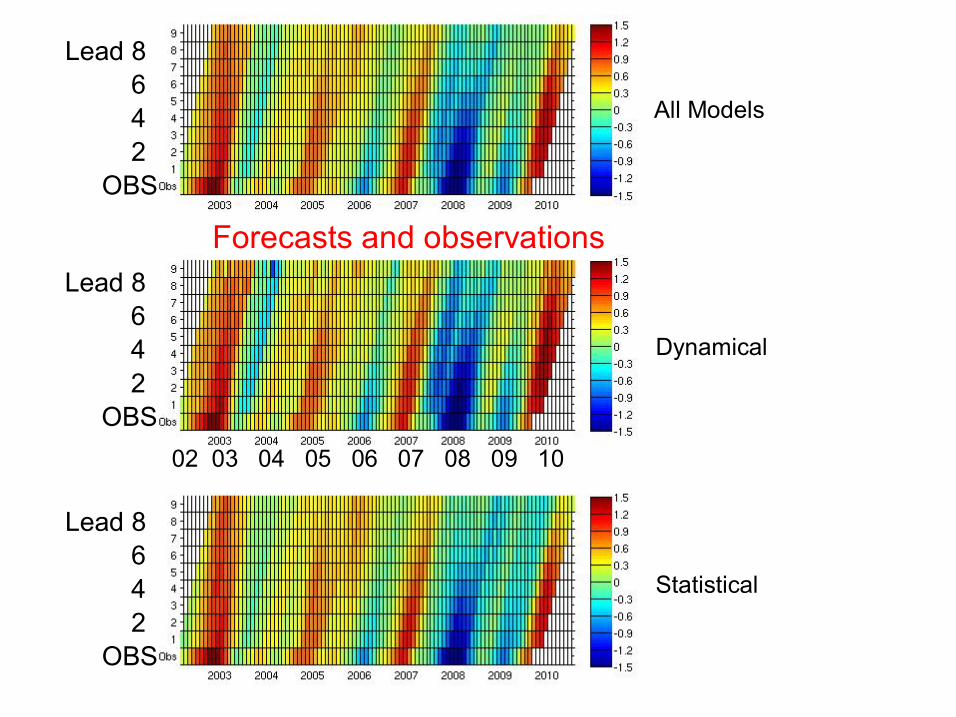
All Models
Dynamical
Statistical
02 03 04 05 06 07 08 09 10
Forecasts and observations
Lead 8 6 4 2
OBS
Lead 8 6 4 2
OBS
Lead 8 6 4 2
OBS
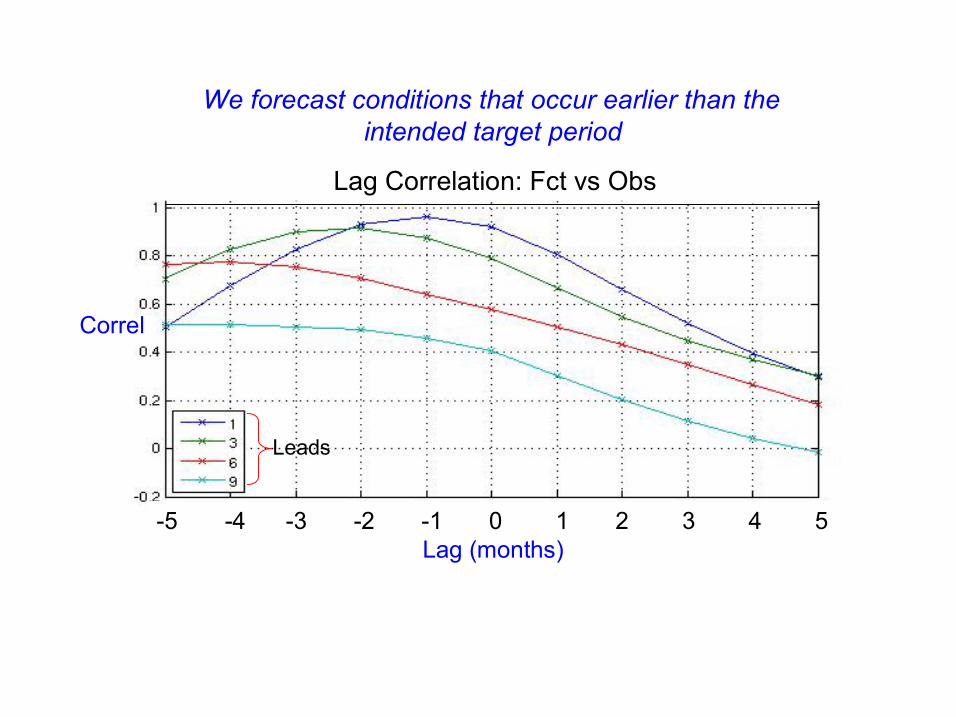
Lag Correlation: Fct vs Obs
5 4 3 2 1 0 1 2 3 4 5 Lag (months)
Correl
We forecast conditions that occur earlier than the intended target period
Leads
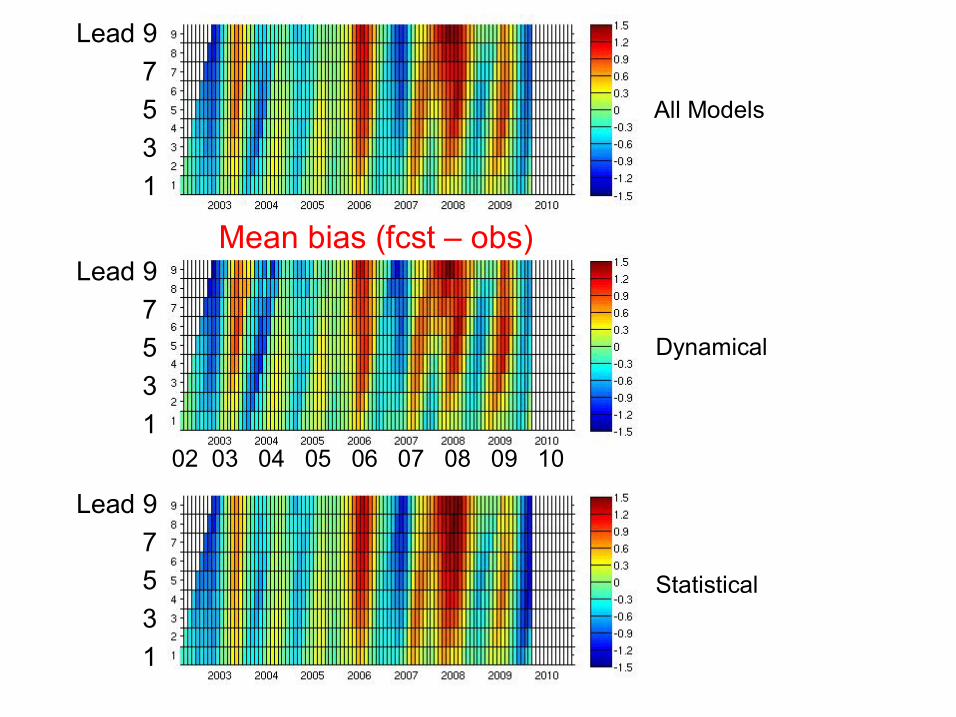
All Models
Dynamical
Statistical
Mean bias (fcst – obs)
02 03 04 05 06 07 08 09 10
Lead 9 7 5 3 1
Lead 9 7 5 3 1
Lead 9 7 5 3 1

All Models
Dynamical
Statistical
Seasonality of mean bias (fcst – obs)
Lead 9 7 5 3 1
Lead 9 7 5 3 1
Lead 9 7 5 3 1

Statistical significance of skill is defined using the null hypothesis:
“The forecast is a sample of 9 running forecasts drawn from a sequence of 9 running observations spanning the same seasons, drawn from random years from the period 19502002.”
The covariance of the forecasts spanning 9 running 3month periods is taken into account by using the observations for the same seasons.
We generate 7 years of climatological forecasts (same length as our time series of realtime forecasts), score them and repeat many times. Then we determine percentiles of the actual score against this noskill background distribution. We use ≥95%ile to qualify for significance.
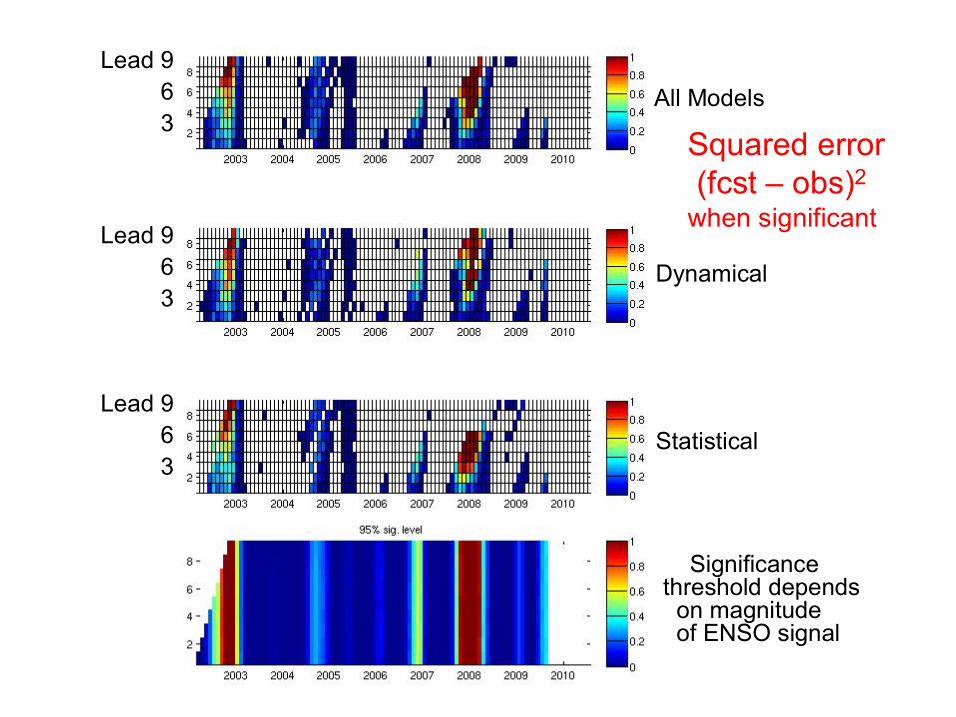
All Models
Dynamical
Statistical
Significance threshold depends on magnitude of ENSO signal
Squared error (fcst – obs) 2 when significant
Lead 9 6 3
Lead 9 6 3
Lead 9 6 3
All Models
Dynamical
Statistical
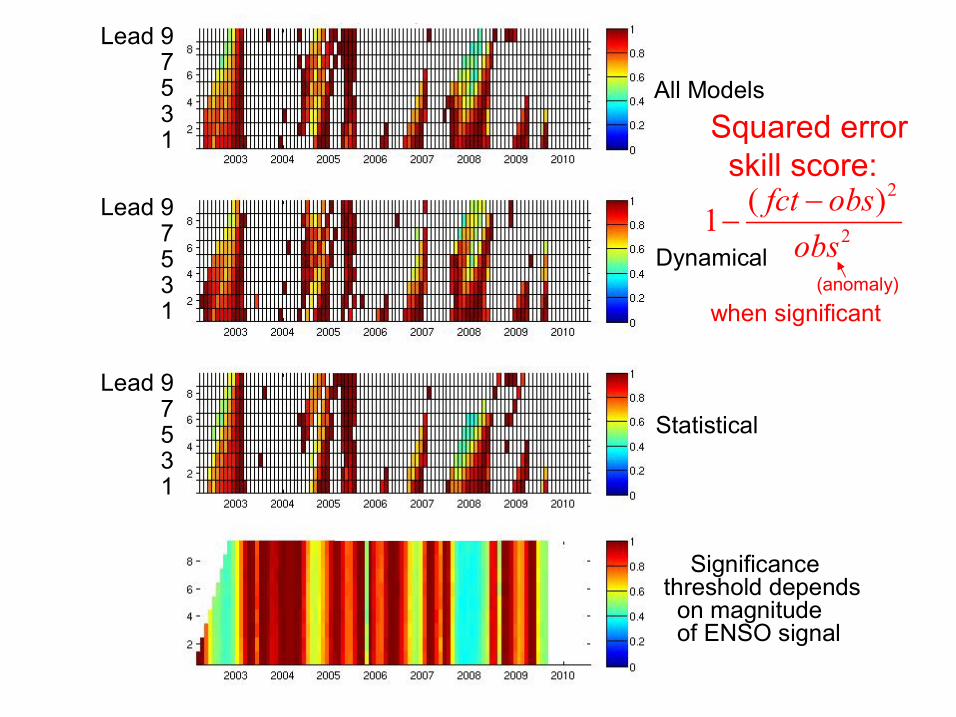
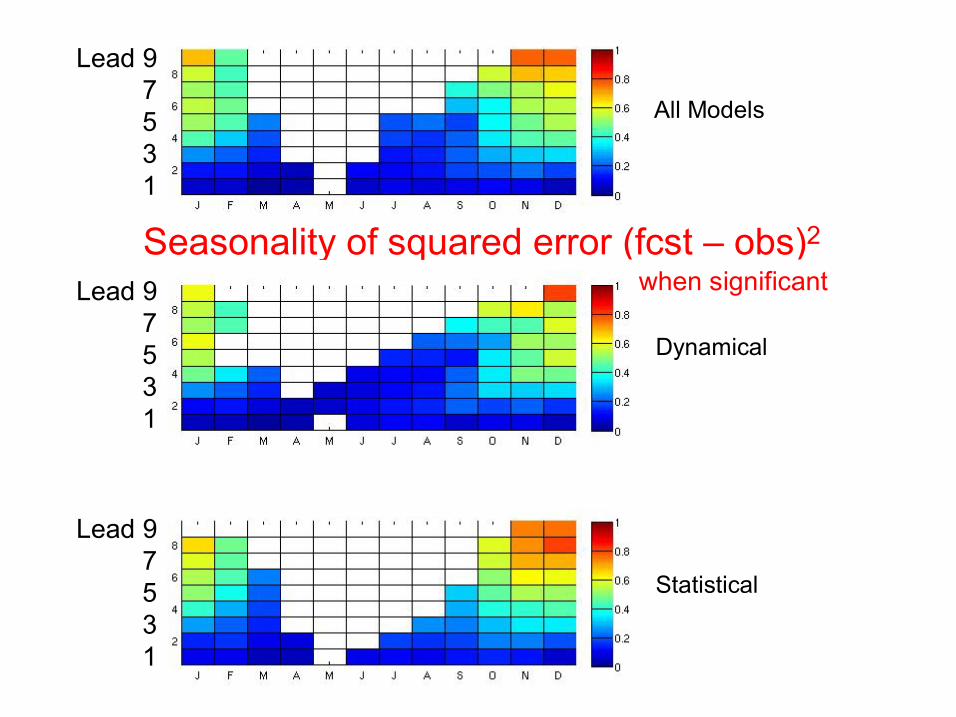
Significance threshold depends on magnitude of ENSO signal
Lead 9 7 5 3 1
Lead 9 7 5 3 1
Lead 9 7 5 3 1
Squared error skill score:
(anomaly) when significant
2
2
( ) 1 fct obs obs −
−
All Models
Dynamical
Statistical
Lead 9 7 5 3 1
Lead 9 7 5 3 1
Lead 9 7 5 3 1
Seasonality of squared error (fcst – obs) 2 when significant

All Models
Dynamical
Statistical
Lead 9 7 5 3 1
Lead 9 7 5 3 1
Lead 9 7 5 3 1
Seasonality of squared error skill score when significant anomaly
2
2
( ) 1 fct obs obs −
−

All Models
Dynamical
Statistical
Lead 9 7 5 3 1
Lead 9 7 5 3 1
Lead 9 7 5 3 1
Seasonality of correlation (fcst,obs) when significant
All Models
Dynamical
Statistical
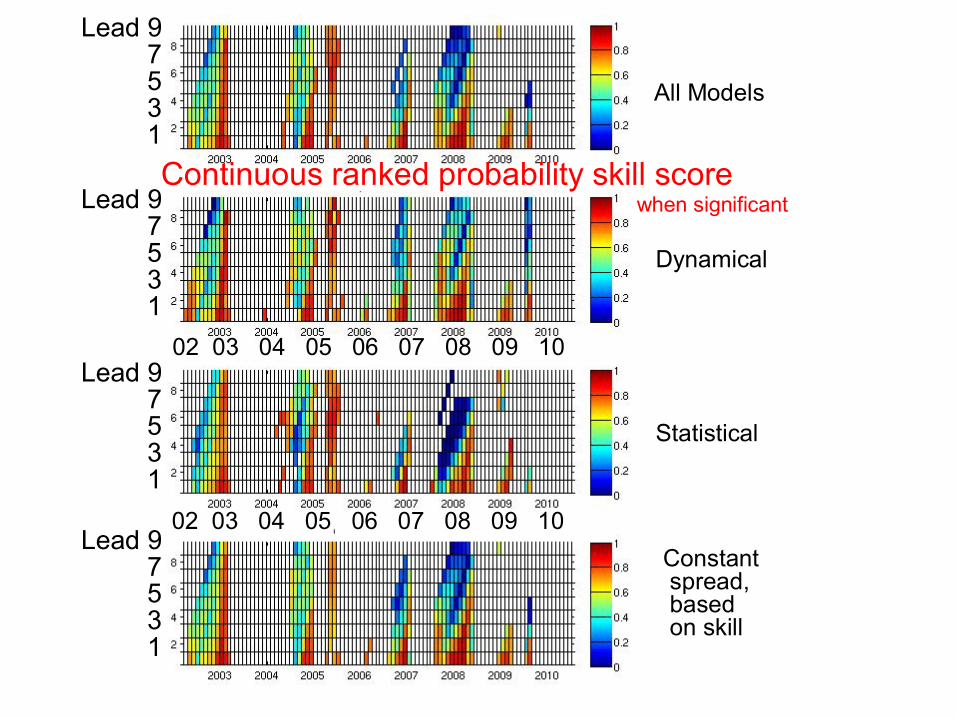
Constant spread, based on skill
Continuous ranked probability skill score when significant
02 03 04 05 06 07 08 09 10
02 03 04 05 06 07 08 09 10
Lead 9 7 5 3 1
Lead 9 7 5 3 1
Lead 9 7 5 3 1
Lead 9 7 5 3 1
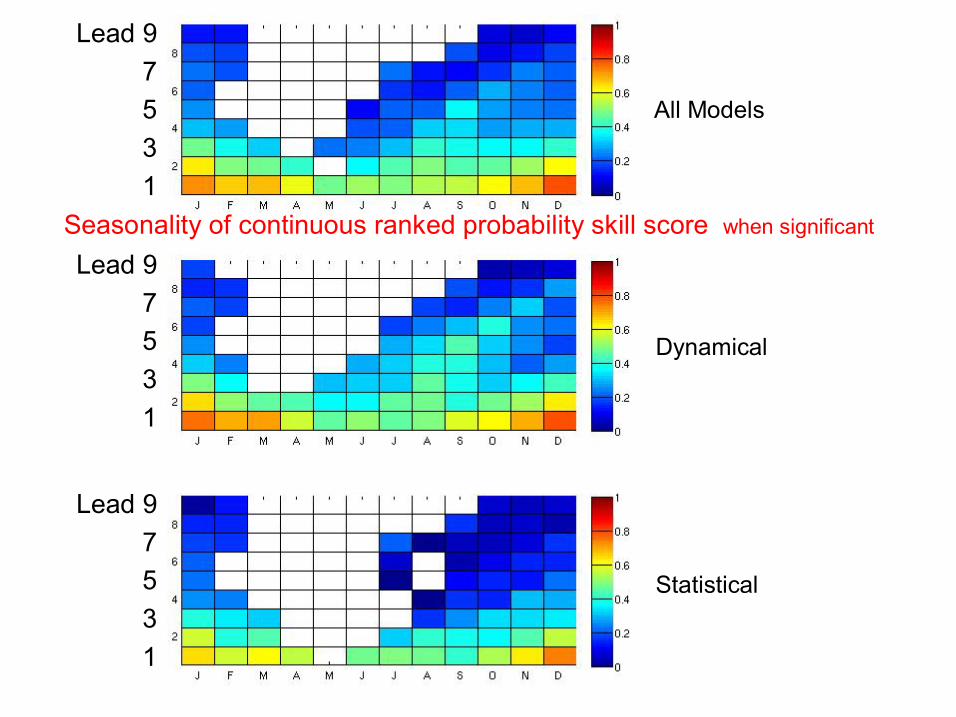
All Models
Dynamical
Statistical
Lead 9 7 5 3 1
Lead 9 7 5 3 1
Lead 9 7 5 3 1
Seasonality of continuous ranked probability skill score when significant

Squared error (f – o) 2
Ensemble variance
Ensemble variance Climo of ensemble variance
Squared error
Squared error
02 03 04 05 06 07 08 09 10

dynamical dynamical errors
statistical errors
statistical
Statistical vs. dynamical forecast and forecast error scatterplots
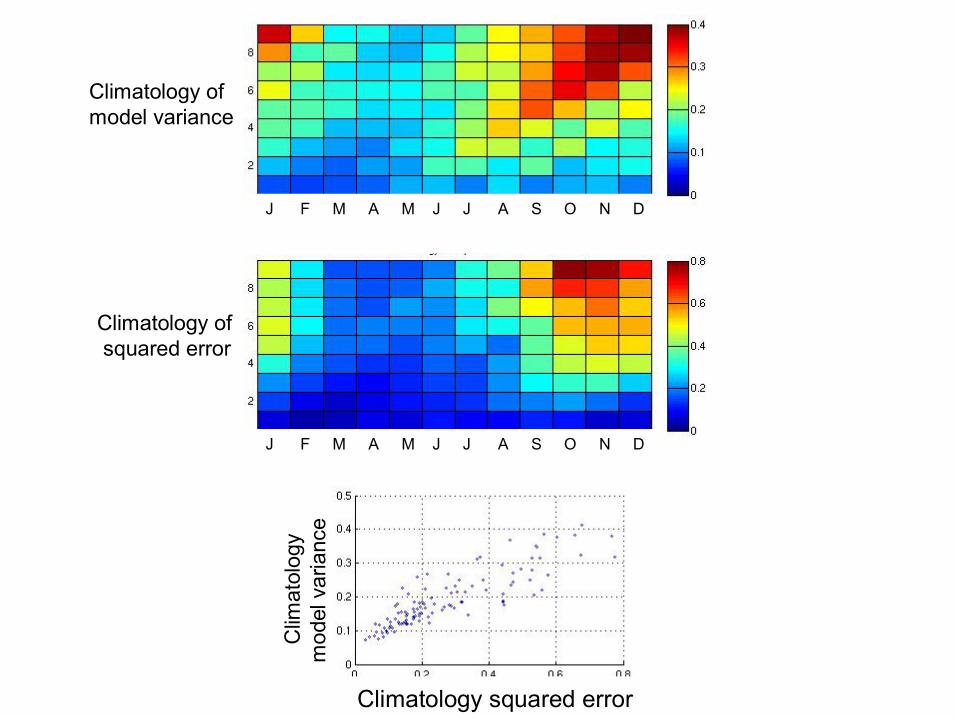
Clim
atology
model variance
Climatology squared error
Climatology of squared error
Climatology of model variance
J F M A M J J A S O N D
J F M A M J J A S O N D

0
0.1
0.2
0.3
0.4
0.5
0.6
0.7
0.8
0.9
1
1 2 3 4 5 6 7 8 9
Correlation Skill, all seasons, by lead time 2002 2009
ALL DYN
STAT
Lead (months) 1 2 3 4 5 6 7 8 9
x
x x x x
o
o o
o
19851993
19751993
1975 1990 2005
0
0.2
0.4
0.6
0.8
1
1.2
1.4
1.6
1.8
2
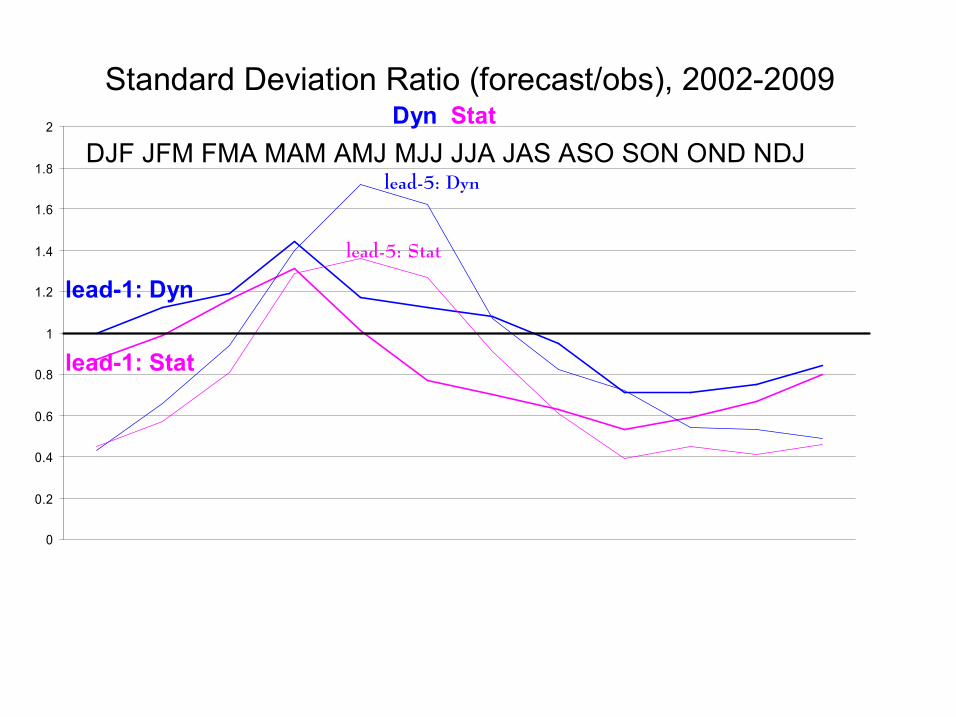
DJF JFM FMA MAM AMJ MJJ JJA JAS ASO SON OND NDJ
Standard Deviation Ratio (forecast/obs), 20022009
lead1: Dyn
lead1: Stat
lead-5: Stat
lead-5: Dyn
Dyn Stat
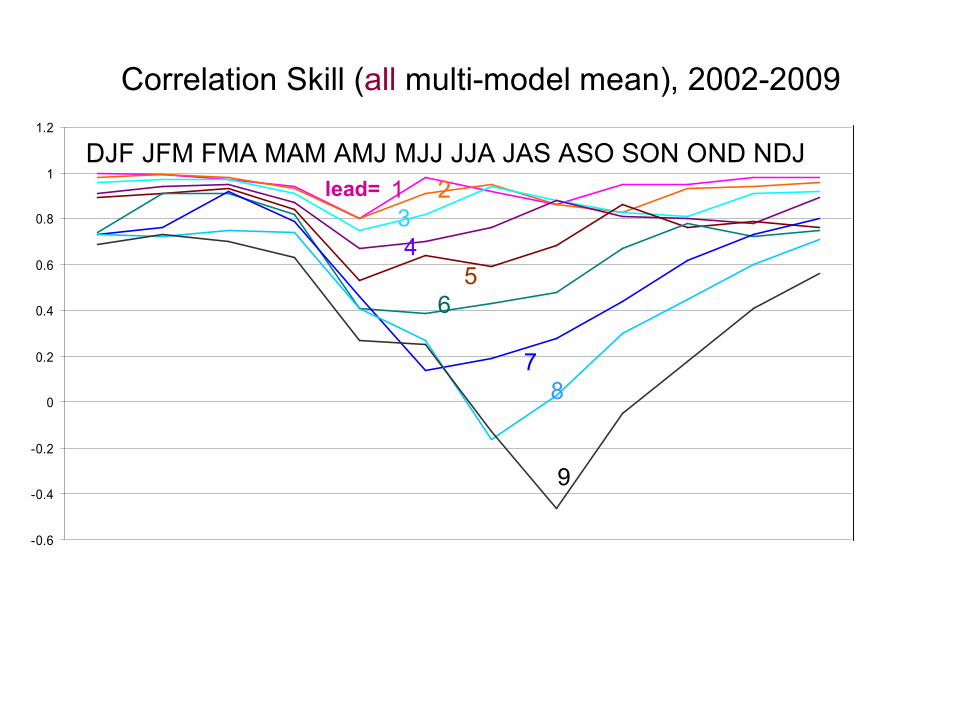
Correlation Skill (all multimodel mean), 20022009
0.6
0.4
0.2
0
0.2
0.4
0.6
0.8
1
1.2
DJF JFM FMA MAM AMJ MJJ JJA JAS ASO SON OND NDJ 1 2 3 4
5 6
7 8
9
lead=
0.6
0.4
0.2
0
0.2
0.4
0.6
0.8
1
1.2
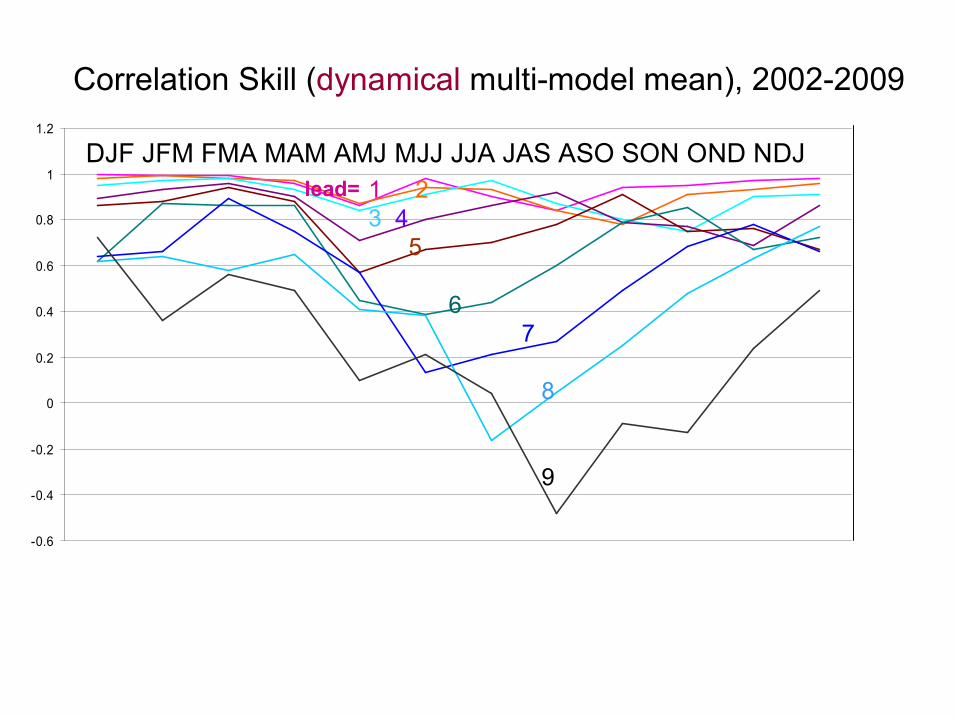
Correlation Skill (dynamical multimodel mean), 20022009
DJF JFM FMA MAM AMJ MJJ JJA JAS ASO SON OND NDJ 1 2 3 4
5
6 7
8
9
lead=
0.6
0.4
0.2
0
0.2
0.4
0.6
0.8
1
1.2
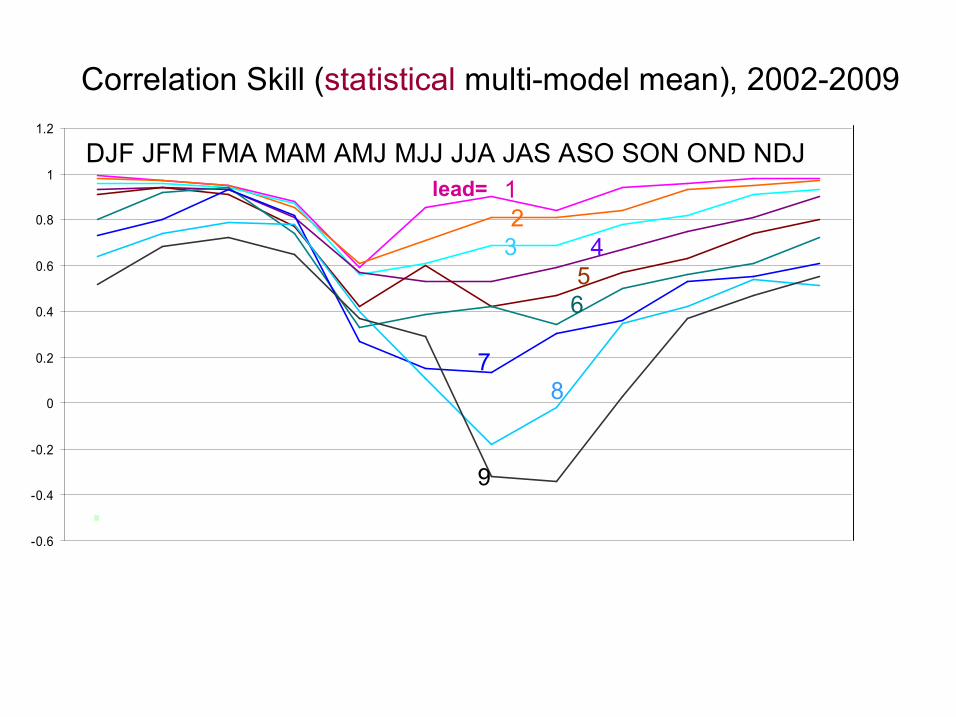
Correlation Skill (statistical multimodel mean), 20022009
DJF JFM FMA MAM AMJ MJJ JJA JAS ASO SON OND NDJ 1 2 3 4
5 6
7 8
9
lead=

0
0.2
0.4
0.6
0.8
1
1.2
1 2 3 4 5 6 7 8 9
RMSE (SDs), all seasons, by lead time 2002 2009
STAT
ALL
DYN
Lead (months) 1 2 3 4 5 6 7 8 9
o o
o o x x x
x x
19851993
19751993
1975 1990 2005

0
0.2
0.4
0.6
0.8
1
1.2
1.4
1.6
1.8
RMSE Skill (SDs), all multimodel mean, 20022009
DJF JFM FMA MAM AMJ MJJ JJA JAS ASO SON OND NDJ
9 8
7 5 6 4 3
2 1 lead=
0
0.2
0.4
0.6
0.8
1
1.2
1.4
1.6
1.8
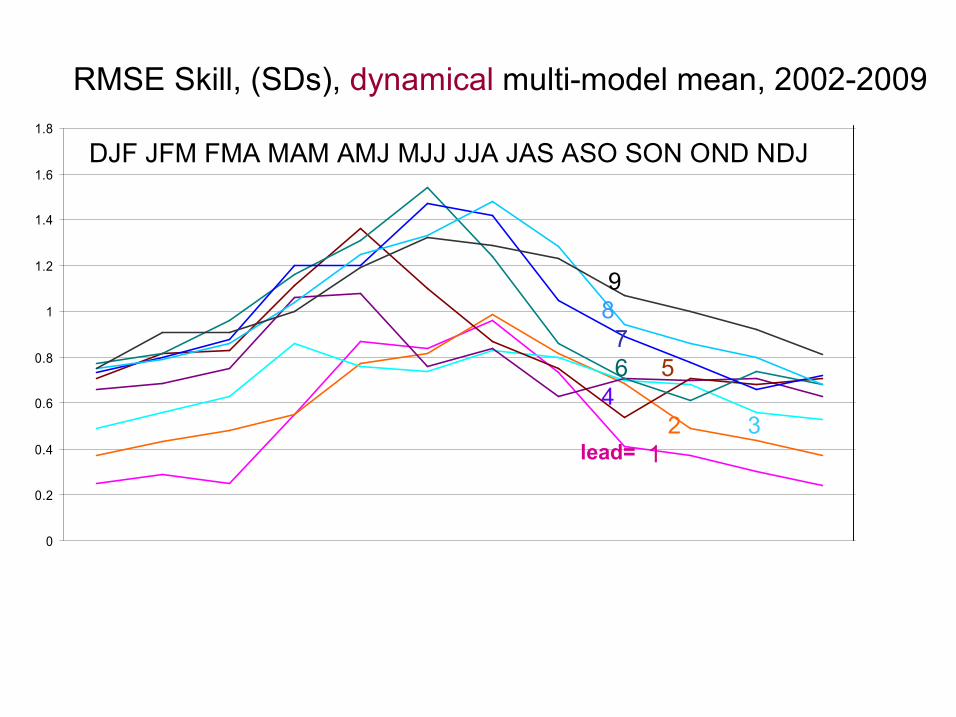
RMSE Skill, (SDs), dynamical multimodel mean, 20022009
DJF JFM FMA MAM AMJ MJJ JJA JAS ASO SON OND NDJ
9 8 7 6 5 4
2 3 1 lead=
0
0.2
0.4
0.6
0.8
1
1.2
1.4
1.6
1.8
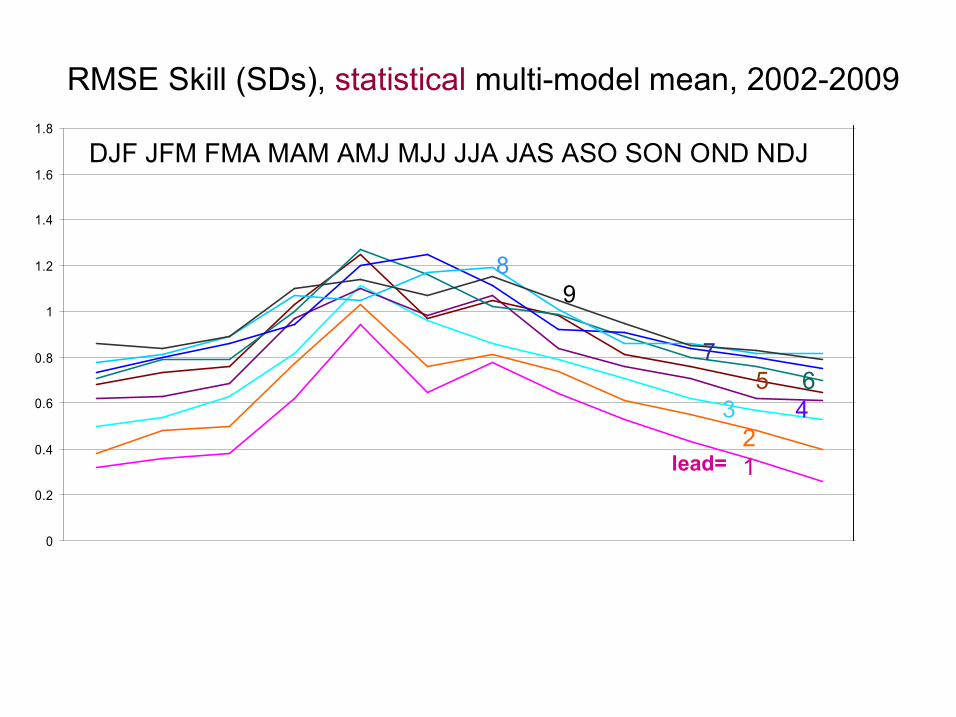
RMSE Skill (SDs), statistical multimodel mean, 20022009
DJF JFM FMA MAM AMJ MJJ JJA JAS ASO SON OND NDJ
8 9
7 5 6
3 4 2 1 lead=
0
0.1
0.2
0.3
0.4
0.5
0.6
0.7
0.8
0.9
1
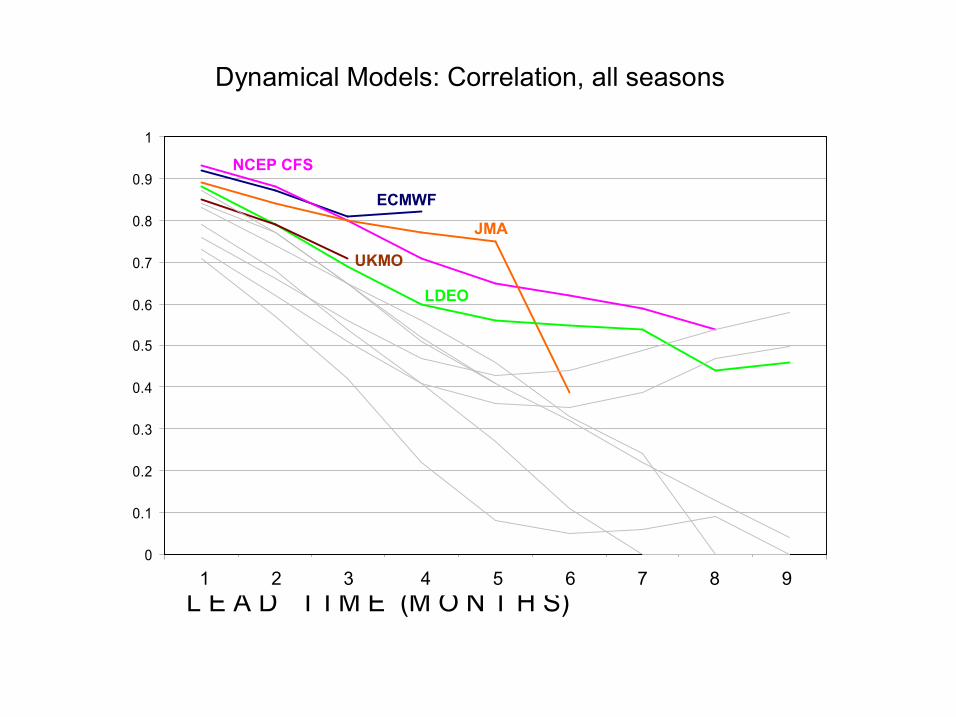
1 2 3 4 5 6 7 8 9
L E A D T I M E (M O N T H S)
Dynamical Models: Correlation, all seasons
JMA
NCEP CFS
LDEO
UKMO
ECMWF
1 2 3 4 5 6 7 8 9

0
0.1
0.2
0.3
0.4
0.5
0.6
0.7
0.8
0.9
1
1 2 3 4 5 6 7 8 9
L E A D T I M E (M O N T H S)
Statistical Models: Correlation, all seasons
UCLATCD
FSU REGR
CLIPER
CCA
MARKOV
MARKOV
UCLATCD
CCA
FSU REGR
1 2 3 4 5 6 7 8 9

0
0.2
0.4
0.6
0.8
1
1.2
1.4
l1 l2 l3 l4 l5 l6 l7 l8 l9
Dynamical Models: RMSE (SDs), all seasons
L E A D T I M E (M O N T H S) 1 2 3 4 5 6 7 8 9
ECMWF
LDEO NCEP CFS
NCEP CFS
JMA
JMA UKMO
0
0.2
0.4
0.6
0.8
1
1.2
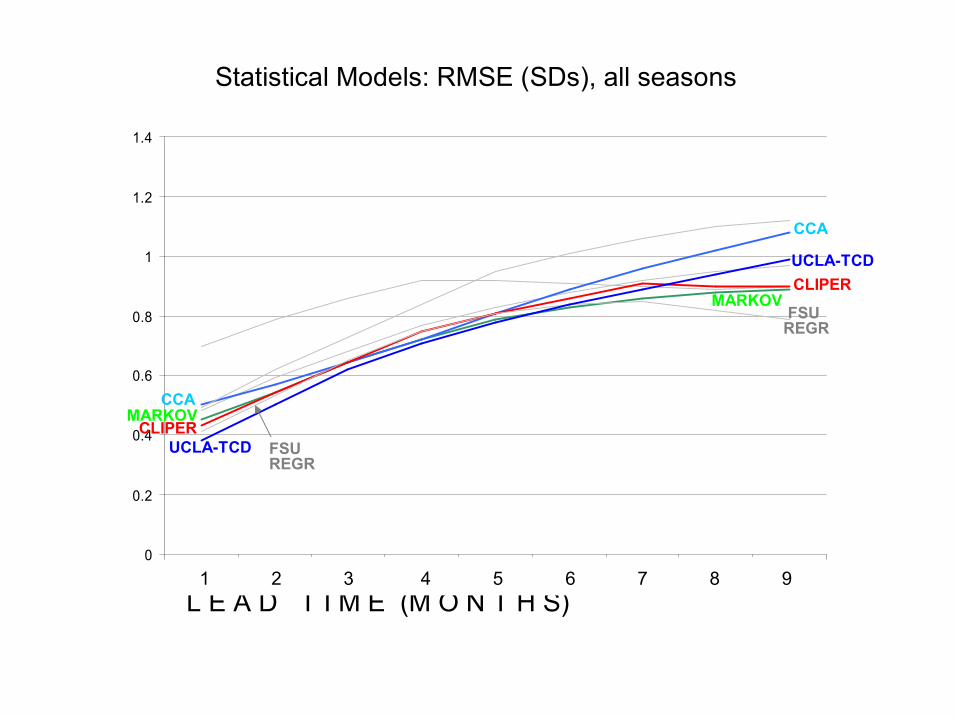
1.4
1 2 3 4 5 6 7 8 9
L E A D T I M E (M O N T H S)
Statistical Models: RMSE (SDs), all seasons
UCLATCD
MARKOV CCA
CLIPER
UCLATCD CLIPER
MARKOV
CCA
FSU REGR
FSU REGR
1 2 3 4 5 6 7 8 9

Conclusions
Our ENSO prediction skill is not much different this decade from how it was in the previous two decades.
Decadal variations in ENSO prediction skill appears to be a stronger function of decadal variability of ENSO amplitude than of improvements in our models and/or prediction methodologies.
For the first time, we see dynamical models delivering slightly more skillful ENSO predictions than statistical models, in the mean. This comes largely because of better performance in predicting the onset of the La Nina of 200708, even though onset was predicted earlier than observed.