An epidemiological study of cervical ... - BMC Women's Health
15
RESEARCH ARTICLE Open Access An epidemiological study of cervical and breast screening in India: district-level analysis Monica and Raman Mishra * Abstract Background: Breast cancer and cervical cancer, the most common forms of cancer in women worldwide, are on a fast and steady rise, accounting for more deaths in women than any other cancer in the developing world. Cancer screening tests are an important tool to combat cancer-related morbidity and mortality. World Health Organization aims to accelerate action to achieve Goal 3.4 of the Sustainable Development Goals (SDG 3.4) in order to reduce premature mortality from non-communicable disease, including cancer by one-third by 2030. This study aims to examine the geospatial variation of cervical and breast screening across districts and to identify factors that contribute to the utilization of screening among women in India. Methods: Until recently, there was no evidence pertaining to screening for cervical and breast cancers at the national level. Information on examination of the breast and cervix from over 699,000 women aged 15–49 years was collected for the first time in the fourth round of National Family Health Survey, 2015–16 (NFHS-4). For the present study, the data were aggregated for all 640 districts in India. Moran’s Index was calculated to check for spatial autocorrelation. Univariate Local Indicators of Spatial Association (LISA) maps were plotted to look for spatial dependence associated with the uptake of screening practices. The spatial error model was employed to check for spatial magnitude and direction. Results: The common factors associated with uptake of both cervical and breast screening at the district level were; women belonging to a general caste, residing in rural areas, being currently married, and being well-off economically. Being insured was positively associated with the uptake of cervical screening only. This study provides spatial inference by showing geographical variations in screening of cervix and breast across districts of India. Conclusions: By showing geographical disparities in screening practices across districts of India, this study highlights the importance of ensuring a region-specific and organ-specific approach towards control and prevention of cancer. The identified factors responsible for the uptake of screening could be a guiding force to decide how and where tailored interventions may be best targeted. Keywords: Cervical screening, Breast screening, Spatial analysis, India © The Author(s). 2020 Open Access This article is licensed under a Creative Commons Attribution 4.0 International License, which permits use, sharing, adaptation, distribution and reproduction in any medium or format, as long as you give appropriate credit to the original author(s) and the source, provide a link to the Creative Commons licence, and indicate if changes were made. The images or other third party material in this article are included in the article's Creative Commons licence, unless indicated otherwise in a credit line to the material. If material is not included in the article's Creative Commons licence and your intended use is not permitted by statutory regulation or exceeds the permitted use, you will need to obtain permission directly from the copyright holder. To view a copy of this licence, visit http://creativecommons.org/licenses/by/4.0/. The Creative Commons Public Domain Dedication waiver (http://creativecommons.org/publicdomain/zero/1.0/) applies to the data made available in this article, unless otherwise stated in a credit line to the data. * Correspondence: [email protected] International Institute for Population Sciences, Mumbai, India Monica and Mishra BMC Women's Health (2020) 20:225 https://doi.org/10.1186/s12905-020-01083-6
Transcript of An epidemiological study of cervical ... - BMC Women's Health

RESEARCH ARTICLE Open Access
An epidemiological study of cervical andbreast screening in India: district-levelanalysisMonica and Raman Mishra*
Abstract
Background: Breast cancer and cervical cancer, the most common forms of cancer in women worldwide, are on afast and steady rise, accounting for more deaths in women than any other cancer in the developing world. Cancerscreening tests are an important tool to combat cancer-related morbidity and mortality. World Health Organizationaims to accelerate action to achieve Goal 3.4 of the Sustainable Development Goals (SDG 3.4) in order to reducepremature mortality from non-communicable disease, including cancer by one-third by 2030. This study aims toexamine the geospatial variation of cervical and breast screening across districts and to identify factors thatcontribute to the utilization of screening among women in India.
Methods: Until recently, there was no evidence pertaining to screening for cervical and breast cancers at thenational level. Information on examination of the breast and cervix from over 699,000 women aged 15–49 yearswas collected for the first time in the fourth round of National Family Health Survey, 2015–16 (NFHS-4). For thepresent study, the data were aggregated for all 640 districts in India. Moran’s Index was calculated to check forspatial autocorrelation. Univariate Local Indicators of Spatial Association (LISA) maps were plotted to look for spatialdependence associated with the uptake of screening practices. The spatial error model was employed to check forspatial magnitude and direction.
Results: The common factors associated with uptake of both cervical and breast screening at the district level were;women belonging to a general caste, residing in rural areas, being currently married, and being well-off economically.Being insured was positively associated with the uptake of cervical screening only. This study provides spatial inferenceby showing geographical variations in screening of cervix and breast across districts of India.
Conclusions: By showing geographical disparities in screening practices across districts of India, this study highlightsthe importance of ensuring a region-specific and organ-specific approach towards control and prevention of cancer.The identified factors responsible for the uptake of screening could be a guiding force to decide how and wheretailored interventions may be best targeted.
Keywords: Cervical screening, Breast screening, Spatial analysis, India
© The Author(s). 2020 Open Access This article is licensed under a Creative Commons Attribution 4.0 International License,which permits use, sharing, adaptation, distribution and reproduction in any medium or format, as long as you giveappropriate credit to the original author(s) and the source, provide a link to the Creative Commons licence, and indicate ifchanges were made. The images or other third party material in this article are included in the article's Creative Commonslicence, unless indicated otherwise in a credit line to the material. If material is not included in the article's Creative Commonslicence and your intended use is not permitted by statutory regulation or exceeds the permitted use, you will need to obtainpermission directly from the copyright holder. To view a copy of this licence, visit http://creativecommons.org/licenses/by/4.0/.The Creative Commons Public Domain Dedication waiver (http://creativecommons.org/publicdomain/zero/1.0/) applies to thedata made available in this article, unless otherwise stated in a credit line to the data.
* Correspondence: [email protected] Institute for Population Sciences, Mumbai, India
Monica and Mishra BMC Women's Health (2020) 20:225 https://doi.org/10.1186/s12905-020-01083-6

BackgroundCancer is increasingly being recognized as a major causeof mortality and morbidity, with approximately 18.1million new cases reported in 2018 [1]. The WorldHealth Organization (WHO) projects that the numberof global cancer deaths will rise by 45% between 2008and 2030 [2]. The rising burden of the mortality fromcancer is likely to be fivefold greater in the low-incomecountries compared to established market economies[3]. The economic burden of cancer is significant andrising. In 2010, the total annual economic cost of cancerwas estimated at approximately US$ 1.6 trillion [4], thusthreatening health budgets at all income levels and caus-ing financial distress for individuals and families.Breast cancer and cervical cancer, the most common
forms of cancer in women worldwide, too are on a fastand steady rise, accounting for more deaths in womenthan any other cancer in the developing world [1].Statistics suggest that about 527,624 and 1,671,149 newcases of cervical and breast cancers are added every year.To this, India contributes about 122,844 cervical cancerand 144,937 breast cancer cases every year [5]. India ac-counts for nearly one-third of the global cervical cancerdeaths, with women facing a 1.6% cumulative risk ofdeveloping cervical cancer and 1.0% cumulative deathrisk from cervical cancer. Similarly, the cumulative riskof developing breast cancer is 2.7%, and cumulativedeath risk is 1.5% [6]. Earlier, cervical cancer was themost common cancer throughout the nation, but nowthe incidence of breast cancer has surpassed it and is theleading cause of death [7]. A vital observation here isthat breast and cervical cancers are curable if diagnosedat an early stage. These cancers are preventable withaccess to high-quality care, periodic screening tests, andregular follow-up [8].The World Health Assembly (WHA 70.12), in its
agenda for cancer prevention and control in the contextof an integrated approach, urges governments and theWHO to accelerate action to achieve Goal 3.4 of theSustainable Development Goals (SDG 3.4) in order toreduce premature mortality from non-communicablediseases including cancer by one-third by 2030 [8]. Thestrategies to reduce the high burden of cervical andbreast cancers include risk factor intervention, vaccin-ation, screening, and early diagnosis [9]. Effective screen-ing is the first step toward reducing the burden ofcervical and breast cancers. Screening is defined as “thesystematic application of a test or an inquiry to identifyindividuals at sufficient risk of a specific disorder towarrant further investigation or direct preventive actionamong persons who have not sought medical attentionon account of symptoms of that disorder [10]. On theother hand, screening uptake refers to the proportion ofpersons eligible to be screened within a population who
have been both invited for screening and have receivedan adequate screening during a specified period [11].Experience from the developed world shows that effectivepopulation-based screening programmes can easily reducethe incidence of cervical and breast cancers. Mortalityrates from cervical and breast cancers can also be reducedby such interventions [12, 13]. Despite the clear andproven benefits of population-based screening programs,screening for cervical and breast cancers in low-incomecountries, including India, remains a challenge.Until recently, there was no evidence pertaining to
screening for cervical and breast cancers in India. Infor-mation on examination of the breast and cervix fromover 699,000 women aged 15–49 years was collected forthe first time in the fourth round of National FamilyHealth Survey, 2015–16 (NFHS-4) [14]. The availabilityof such information in NFHS-4 provided us with a greatopportunity to analyze the levels and patterns in thescreening for cervical and breast cancers in India at thestate and district levels.Some past studies, mostly conducted in developed
country settings, have identified several socio-economic,demographic, bio-medical, and residence-related charac-teristics that are associated with the screening of thecervix and breast. The likelihood of a woman receiving aPap test, or a clinical breast examination, depends onmany aspects such as age, marital status, income level,education, and health status. Women with higher educa-tion, higher incomes, and greater insurance coverage aremore likely to undergo cervical and breast cancerscreening services [15]. Employed females are moreinclined to go for screening because of their higheropportunity cost, higher incomes, and ability to affordout-of-pocket expenditure [16]. On the other hand, ruralwomen are less likely than urban women to go for cer-vical and breast screening [11, 17, 18]. Studies of breastand cervical screening show that women with greater ac-cess to health care, such as those with health insurance,are opting to have screening tests [16, 19]. The risk ofinfection with Human papillomavirus (HPV) and alsothe risk of cervical cancer depends on the number ofsexual partners, age at first intercourse, and sexualbehavior of the woman’s male partner [20]. Additional riskindicators for cervical cancer are number of live births,long-term use of oral contraceptives, and cigarettesmoking [21]. Risk factors, other than socio-economic anddemographic characteristics, accountable for breast cancerare alcohol, obesity, longer use of oral contraceptives, earlyonset of menstrual periods, etc. [22]. Studies also suggestthat health policies and quality of the health caresystem influence cervical and breast cancer screeningbehaviors [23, 24].Even though there has been an increase in the prevalence
of cancer among the female population, most of the
Monica and Mishra BMC Women's Health (2020) 20:225 Page 2 of 15

research on cancers in females is concentrated only on theincidence and mortality rates of cervical and breast cancers.A review of cancer screening-related literature in Indiareveals that the spatial perspective of cancer screening hasnot been explored yet. The present study attempts toaddress some of these research gaps.
MethodsAim and rationale for spatial dependenceThis study aims to identify factors affecting uptake of cer-vical and breast screening and to develop a comprehensiveassessment of the geographical distribution of screeningto capture the precise hotspots of the screening practicesat the district level. It is crucial to note that any aggrega-tion of socioeconomic, demographic or health variablesover a geographic space tends to manifest a spatial patternor spatial clustering. In such a case, spatial autocorrelationcreates a problem for statistical testing as the autocorre-lated data violates the assumptions of classical statistics,one of them being the independence of the observations[25]. Such regression analyses, which ignore the spatialcorrelations, lead to incorrect inference of the estimatedregression coefficients by narrowing the confidence inter-vals [26]. This limitation can, however, be overcome usinggeospatial models [27, 28].
Data sourceThis study analyzed data from the fourth round ofthe National Family Health Survey (NFHS, 2015–16).NFHS was conducted under the supervision of theMinistry of Health & Family Welfare, Government ofIndia and harmonized by the International Institutefor Population Sciences (IIPS), Mumbai. A two-stagesampling design was adopted in the survey for bothrural and urban areas. In the first stage, villages wereselected by using the probability proportional to sizescheme (PPS) for the rural areas. At the secondstage, households were then chosen from the desig-nated villages by using systematic sampling. For theurban areas, first stage of sampling involved selectionof census enumeration blocks (CEBs) by using PPS,followed by selection of households using systematicsampling at the second stage. NFHS-4 collected datain all the 29 states and 6 union territories of India,divided administratively into 640 districts. The surveycollected information from all eligible women aged15–49 years, who were asked questions on a largevariety of topics, including background characteris-tics, family planning, fertility preferences and otherhealth issues (tuberculosis, current morbidity- dia-betes, asthma, goiter, heart disease, cancer). Districtsare the smallest administrative unit in India. Analysisat this level yield meaningful insights.
Study populationThe self-reported information on medical examination(screening) of cervix and breast by the women aged15–49 years was used in this study. Precisely, thedistrict-level data for all the states and union territor-ies were aggregated for the present study.
Study variablesThe outcome variables used in the analysis were cervicaland breast screening. The data of women undergoingcervical and breast screening in the age group 15–49years was aggregated at the district level. The studyassessed the variations in cervical and breast screeningthrough a set of independent factors.We assessed the following predictors influencing the
uptake of cervical screening: covered by insurance,having multiple sexual partners, consuming tobacco inany form, using oral contraceptives, and having paritygreater than three. The determinants influencing theuptake of breast screening included: being obese, usingoral contraceptives, consuming tobacco in any form,covered by insurance, and consuming alcohol.Other common socio-demographic factors included in
the analysis were: status of literacy (literate), maritalstatus (currently married), religion (Hindu), caste (general),area of residence (rural), and economic status (rich). All thevariables were aggregated from the individual level to thedistrict level.
Statistical analysisFirst, the ordinary least squares (OLS) model was esti-mated to explore the relationship between cervical andbreast screening and their independent variables respect-ively. Second, tests for spatial dependence were performed.Third, the spatial regression models were employed tostudy the spatial effect on screening.
Estimation of spatial associationWe used R software (Version 3.6.1, http://cran.r-project.org/) to generate descriptive maps of cervical and breastscreening across the districts of India. We then gener-ated the spatial weights for the calculation of the spatialautocorrelation statistics. Contiguity-based spatialweights were used, as our objective was to understandthe spatial interdependence between the dependentvariable and a set of independent variables in the neigh-boring regions (districts). Within the spatially contiguousweights, we chose Queen’s Weight, which works on theprinciple that at least one point on the boundary of apolygon is within the snap distance of at least a point ofits neighbor (Fig. 1 Appendix). Finally, we used geo-spatial techniques, such as Moran’s I statistics, Univari-ate LISA (Local Indicators of Spatial Association), andgeospatial regression, to address the research questions.
Monica and Mishra BMC Women's Health (2020) 20:225 Page 3 of 15

Global and local spatial autocorrelationMoran’s I is the measure of global spatial autocorrel-ation. The magnitude of Moran’s I was estimated byusing the “moran.test” function. A significance level ofP-value < 0.05 was used to assess the spatial autocorrel-ation. The main idea behind spatially autocorrelated datais that values are not independent of space. This conceptis based on the first law of geography proposed byWaldo Tobler, according to which, “Everything is relatedto everything else, but near things are more related thandistant things.”
I ¼ nso
Pni¼1
Pnj¼1wi; jziz jPni¼1z
2i
Where n is equal to the total number of features; So isthe aggregate of all the spatial weights; zi is the deviationof an attribute for feature I from its mean (xi-X); and wi,j
is the spatial weight between feature i and j. The
Moran’s I score ranges from − 1 (dispersed) to 1 (clus-tered). A value of 0, or very close to 0, refers to randomdistributions. Positive autocorrelation suggests thatpoints with similar attribute values are closely distrib-uted in space, whereas negative spatial autocorrelationsuggests that closely associated points are more dissimilarin spatial terms. By applying the Monte Carlo simulationcomputational technique, Moran’s I was permuted 999times to determine the significance using multiplication.The global spatial autocorrelation does not reveal the
existence of regional spatial patterns. Therefore, tovisualize spatial clustering, Local Indicators of SpatialAutocorrelation (LISA) maps were created using localMoran’s index calculations [29]. LISA statistic wascalculated for each observation and cluster, with the sig-nificance level at P < 0.05. The LISA statistic indicatesthe extent of significant spatial clustering of similar ordissimilar values around a spatial feature. It is providedby the following formula:
Fig. 1 Prevalence of Cervical Screening. The district’s boundaries are as per the Census of India, 2011
Monica and Mishra BMC Women's Health (2020) 20:225 Page 4 of 15

Ii ¼n xi − xð Þ Pn
j¼1wij x j − x� �
Pni¼1 xi − xð Þ2
The parameters for the LISA statistics are the same asthose for Moran’s I. In fact, the sum of the LISA statis-tics for all spatial features is proportional to the globalMoran’s I. A positive Ii value indicates spatial clusteringof similar values around a spatial characteristic, whereasnegative values indicate a clustering of dissimilar valuesaround a spatial feature.Four types of spatial associations can be derived from
this statistic and plotted in Moran’s scatter plot, wherehigh-high (HH) and low-low (LL) types of spatial clus-tering denote similar values, and high-low (HL) and low-high (LH) types of spatial clustering indicate dissimilarvalues, referred as, spatial outliers [29] (see Fig. 2 & Fig. 3in appendix).Univariate Local Indicators of Spatial Association
(LISA) measures the correlation of neighborhood valuesaround a specific spatial location. It determines the ex-tent of spatial non-stationarity and clustering present inthe data. It is given by:
Ii ¼ ziX
j
wijz j
Thus, the data set and the shapefiles were imported toR studio to calculate Moran’s I and generate detailedLocal Indicators of Spatial Association (LISA) maps tostudy the spatial variations and conduct the spatial ana-lysis. Then, the spatial error model was used toscrutinize for the presence of a spatial relationship,which shows that a value observed in one location de-pends on the values found at the nearby sites, indicatinga spatial dependence. Spatial data may show spatial de-pendence in the variables and error terms. When spatialdependence is present in the error term, a spatial autore-gressive specification for this dependence is typicallyassumed.Spatial error model incorporates spatial effects through
error term.
Y ¼ xβþ ɛ
ɛ ¼ λ Wɛþ ξ
ɛ is the vector of error terms, spatially weighted usingthe weight matrix (W).λ is the spatial error coefficient.ξ is a vector of uncorrelated error terms.If there is no spatial correlation between the errors,then λ = 0.The spatial error model tells us only that there is an
unexplained spatial structure to the residuals, not what
caused them. It may offer better estimates of the modelparameters and their statistical significance, but it doesnot presuppose any spatial process generating thepatterns in the screening values. A different model thatexplicitly tests for whether the screening at a point isfunctionally dependent on the values of neighboringpoints is the spatially lagged model [30]. It is given by:y = ρ W y +Xβ + ɛ.where y is the endogenous variable, X is a matrix of
exogenous variables, and W is the spatial weights matrix.
ResultsGeographical distribution of cervical and breast screeningFigures 1 and 2 display the prevalence of cervical andbreast screening across the districts of India. Accordingto the NFHS report, 22% of women have undergone acervical examination, whereas the corresponding figurefor breast examination was 10%. The pattern of cervicalscreening indicates that the southern region, Kerala par-ticularly, has a major contribution followed by districtsfrom Maharashtra. The distribution curve of the preva-lence of cervical screening and the districts shows thatthe majority of the districts fall in the range of 10 to20%. A majority of the districts in Kerala have a highuptake of breast cancer screening, whereas North Goahas the maximum share. The distribution curve exhibitsthat most of the districts fall in the range of 0 to 10%.
Descriptive statisticsTable 1 presents the summary statistics of the variablesused in the analysis. The average values of cervical screen-ing and breast screening across the districts were 22 and10% respectively. Little variation was seen in the averagevalues of women having multiple partners, those havingparity more than 3, and those consuming alcohol (SD = 5,8, 6%). Hindu women and those who were literate, cur-rently married, and residing in rural areas had mean pro-portion values above 70% across the districts of India.Descriptive statistics for all the characteristics under studyat the individual level are provided in the appendix Table 1.Table 2 illustrates Moran’s I values for the dependent
and independent variables incorporated in the study. Mor-an’s I value for cervical and breast screening were 0.61 and0.55 respectively, indicating a high spatial autocorrelationacross the districts of India. Moran’s I for the independentvariables ranged between 0.81 (for districts with the per-centage of tobacco consumption) and 0.41 (for districtswith the percentage of women having multiple partners).
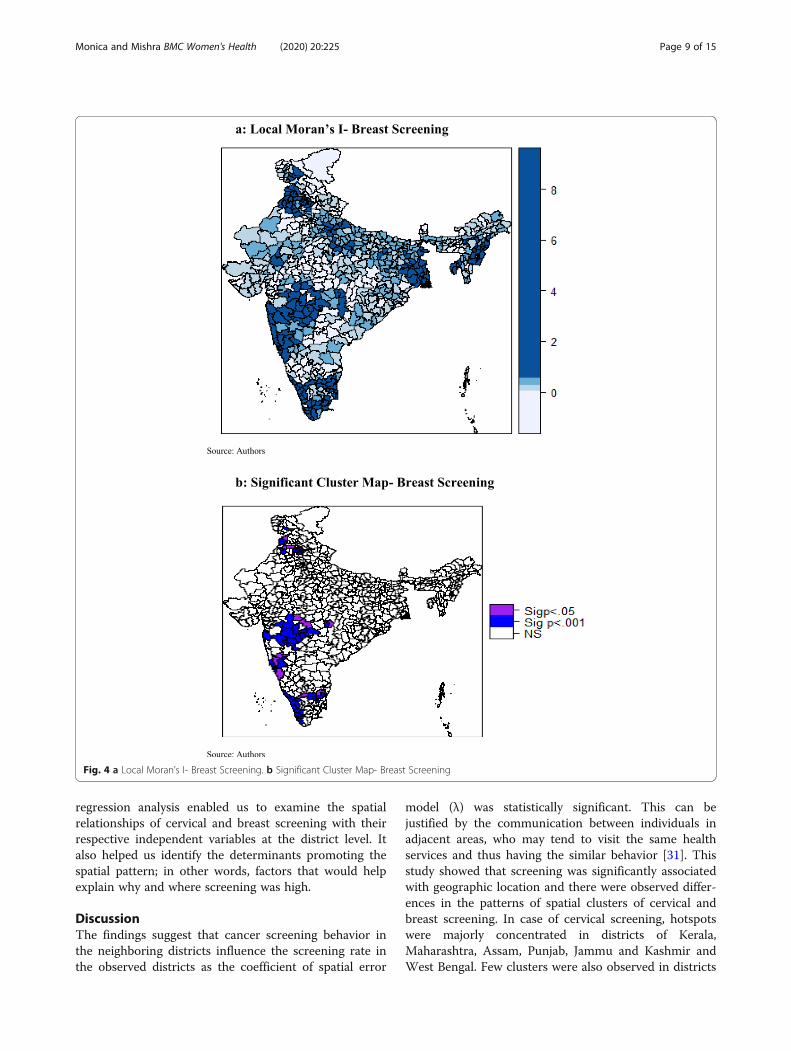
Univariate LISA mapsLocal Moran’s I value for cervical and breast screeningwere plotted in Fig. 3 a and Fig. 4 a respectively. Whereas,the significant local clusters of cervical and breast screen-ing were presented in Fig. 3 b and Fig. 4 b respectively. A
Monica and Mishra BMC Women's Health (2020) 20:225 Page 5 of 15

highly dense clustering of cervical screening could be seenin the districts of Kerala, Maharashtra, Assam, Punjab,Jammu and Kashmir, and West Bengal (Fig. 3b). A fewclusters were also observed in the districts of MadhyaPradesh and Uttar Pradesh. As seen in Fig. 4b, clus-tering of breast screening could be found in the
districts of Kerala, Tamil Nadu, Karnataka, Maharashtra,Punjab, and Jammu and Kashmir.
Ordinary least squares and spatial regression modelsIllustrated in Table 3, the OLS regression model identi-fied that, higher socio-economic status was found to be
Fig. 2 Prevalence of Breast Screening
Table 1 Summary Statistics of Dependent and Independent Variables
N = 640
Characteristics Mean Median StandardDeviation
Characteristics Mean Median StandardDeviation
Cervical Screening 21.96 18.47 14.62 Rich 38.71 33.98 24.26
Breast Screening 9.66 6.71 8.47 Oral Contraception 14.13 9.87 12.26
Literate 72.39 73.85 14.18 Tobacco 7.13 3.66 10.78
Currently Married 71.96 72.78 5.54 Insurance 18.96 10.99 20.13
Hindu 74.58 85.33 27.69 Multiple Partners 4.20 2.81 4.75
General Caste 21.77 17.48 18.29 Parity> 3 13.14 12.37 7.58
Rural 71.57 77.98 21.66 Alcohol 2.59 0.28 6.43
Monica and Mishra BMC Women's Health (2020) 20:225 Page 6 of 15

significantly positively associated with cervical screeningacross the districts, as was having insurance. This wasalso the case among districts having a higher proportionof currently married women, belonged to a general caste,and resided in rural areas in the districts. In contrast,use of oral contraceptives, having multiple partners,having parity above three, and being a Hindu womanwere seen to have a significant negative association withcervical screening in the districts.Table 3 shows the effect of female literacy on breast
screening at the district level, which at 0.13 was foundto be positively significant. This implies that the edu-cation of women and preventive healthcare-seekingbehavior goes hand in hand. Districts with higher per-centage of currently married women were 0.16 timesmore likely to go for breast examination. A similarpositive association was observed among districts witha higher percentage of general caste women, womenfrom economically prosperous districts, districts withhigher insured women, and women from rural areas.Use of oral contraceptives (− 0.24) and consumptionof tobacco (− 0.15) had a significant negative associ-ation with breast screening. Even adiposity and breastscreening shared a negative association (− 0.32) witheach other at the district level.The variance inflation factor (VIF) estimates showed
that there was very little multicollinearity among the in-dependent variables (Table 2 Appendix). Moran’s I valueof 0.42 (p < 0.01) and 0.34 (p < 0.01) for cervical andbreast screening respectively indicated spatial autocorrel-ation of the residuals (Table 4). The Akaike InformationCriterion (AIC) is a measure of the relative goodness offit of a statistical model. For a set of models, the pre-ferred model is the one with the minimum AIC value.The coefficient of determination (R-squared = 0.38 and0.33 for cervical and breast screening respectively) indi-cated that the OLS model was not the best fit.Table 5 shows that the Lagrange Multiplier (error) and
the Lagrange Multiplier (lag) were significant and indi-cated the presence of a spatial dependence in thecervical and breast screening data. The robust error andthe robust lag tests were also significant.
The spatial lag model provides Rho (ρ) as a coefficientparameter which measures the average effect on obser-vations by their neighboring observations and thusreflects the spatial dependence inherent in the data. Itwas found to be statistically significant and had a posi-tive effect for both the models (cervical and breastscreening). As a result, the general model fit improved,as indicated by the higher values of log-likelihood. How-ever, the significance of Breusch-Pagan test and theLikelihood Ratio test of spatial lag dependence for boththe models revealed that even though the introductionof the spatial lag term led the model fit to improve, itcould not eliminate the presence of spatial effects.The spatial error model provides λ (Lambda) as a coef-
ficient on the spatially correlated errors. The model washighly significant, with a positive effect for both themodels (cervical and breast screening). As a result, themodel fit improved, as indicated by the higher values oflog-likelihood. The Breusch-Pagan test and the Likeli-hood Ratio test of spatial error dependence were signifi-cant, indicating that the spatial effects in both themodels (cervical and breast screening) were still present.However, both the spatial error and the spatial lagmodels were an improvement on the OLS model. Thespatial error model appeared to fit the data better amongall as the AIC score was lower and the log-likelihoodvalue was greater for the spatial error model, employedfor both cervical and breast screening. The residualsmaps of OLS and spatial error model for cervical (Fig. 5aand b) and breast screening (Fig. 6a and b) indicatedmodel improvement. The amount of clustering of the re-siduals reduced (the residuals appeared to be more ran-domly distributed), and the Moran’s I of the spatial errorresiduals was reduced from 0.42 to − 0.04 for cervicalscreening and from 0.34 to − 0.05 for breast screening.The maps indicated that the problem of spatial autocor-relation amongst the residuals was mainly solved by thespatial error model. Following this, we proceeded to theanalysis, considering the coefficients of the spatial errormodel.The results shown in Table 6 for the spatial error
model demonstrate a statistically significant spatial auto-correlation (λ = 0.690) for cervical screening. Proportionof women having multiple partners (− 0.18) and usingoral contraceptives (− 0.17) were negatively associatedwith women taking up cervical screening at the districtlevel. The same was found to be the case among districtswith the percentage of Hindu women. A significant posi-tive association with cervical screening was found indistricts where women were insured (0.09), werecurrently married, and districts with higher general castefemale population. Women who resided in rural districtsand those who belonged to higher economic classes alsoshared a positive association at the district level.
Table 2 Moran’s I for Dependent and Independent Variables
Characteristics Moran’s I Characteristics Moran’s I
Cervical Screening 0.610 Rich 0.702
Breast Screening 0.555 Oral Contraception 0.765
Literacy 0.690 Tobacco 0.813
Currently Married 0.570 Insurance 0.735
Hindu 0.749 Alcohol 0.580
General caste 0.553 Parity > 3 0.753
Rural 0.418 Multiple Partners 0.413
Note: above values are significant at p value < 0.01
Monica and Mishra BMC Women's Health (2020) 20:225 Page 7 of 15

In Table 7, the spatial error model employed for breastscreening indicated a statistically significant spatial auto-correlation, with λ = 0.620. Districts with obese womenwere negatively associated (− 0.29) with the uptake ofscreening. A similar association was observed for districtswith Hindu women, those who used oral contraceptives,and those who consumed tobacco. A significant positiveassociation (0.12) with the uptake of breast screening was
observed among districts with currently married women,those residing in rural areas, those belonging to a generalcaste, and those who were economically well-off.The spatial autocorrelation (λ) came out to be statisti-
cally significant in the spatial error model, indicatingthat the relationship between screening and the inde-pendent variables at the macro-level (districts) may bemisleading if spatial clustering is ignored. The spatial
Fig. 3 a Local Moran’s I- Cervical Screening. b Significant Cluster Map- Cervical Screening
Monica and Mishra BMC Women's Health (2020) 20:225 Page 8 of 15
regression analysis enabled us to examine the spatialrelationships of cervical and breast screening with theirrespective independent variables at the district level. Italso helped us identify the determinants promoting thespatial pattern; in other words, factors that would helpexplain why and where screening was high.
DiscussionThe findings suggest that cancer screening behavior inthe neighboring districts influence the screening rate inthe observed districts as the coefficient of spatial error
model (λ) was statistically significant. This can bejustified by the communication between individuals inadjacent areas, who may tend to visit the same healthservices and thus having the similar behavior [31]. Thisstudy showed that screening was significantly associatedwith geographic location and there were observed differ-ences in the patterns of spatial clusters of cervical andbreast screening. In case of cervical screening, hotspotswere majorly concentrated in districts of Kerala,Maharashtra, Assam, Punjab, Jammu and Kashmir andWest Bengal. Few clusters were also observed in districts
Fig. 4 a Local Moran’s I- Breast Screening. b Significant Cluster Map- Breast Screening
Monica and Mishra BMC Women's Health (2020) 20:225 Page 9 of 15

of Madhya Pradesh and Uttar Pradesh. For breastscreening, districts of Kerala, Tamil Nadu, Karnataka,Maharashtra, Punjab, Himachal Pradesh, and Jammuand Kashmir exhibit spatial clusters. Contrary to spatialpatterns of cervical screening, no hotspots were observedin districts of east and northeast region of India in caseof breast screening.Further, this study determined that at the district level;
marital and economic status, area of residence and castewere common exposures spatially related to uptake of cer-vical and breast screening. One of the principal findingswas the significant positive association between having in-surance and undergoing cervical screening in bothmodels. Health care coverage may affect the decision toundergo screening since those who are protected for suchprocedures pay less out of pocket than those whose costsare not adequately covered [32]. It’s worth noting that themarital status of women has a considerable role in influen-cing their decision of undergoing screening. For bothmodels, cervical and breast screening showed a significant
positive association among currently married females.Similar associations have been documented in other stud-ies as well [15, 33]. Another crucial finding that emergedfrom our analysis was the statistically significant and posi-tive association between high socioeconomic status anduptake of cervical and breast screening. This strongly res-onates with the fact that the economic status of a womanprofoundly influences her decision to undergo screening[15, 16]. For breast examination, this study points thenegative area-based association between risky health be-havior and screening. Districts with high level of tobaccoconsumption tend to have lower screening coverage. Thisfinding corroborates to the fact that people involved inrisky behaviors might have less consideration for theirown health and thus give less preference for preventivehealth behavior like screening [34].For cervical and breast screening, clear and distinct
spatial clusters in districts of Kerala and Maharashtra, cov-ering nearly the whole state, were hard to miss. This sig-nificant result may be attributed to the various steps takenby the Kerala state health department. For instance, theKerala Police and the Swasthi Foundation, in associationwith the Aster Med-city, a leading quaternary care hos-pital in Kerala launched “Rakshaka Raksha,” a series of freecamps to screen state police force for cancer and lifestylediseases [35]. Kerala was also the first state in the Indianunion to formulate a cancer control program along withthe guidelines of the WHO as early as in 1988 (called 10-year action plan) [36]. Even the Panchayats in the state en-visages cancer control activities as part of their People’sPlan Program. Thus, Kerala has turned out to be a rolemodel for other states, with its focus on preventive healthmeasures, in this case, screening. Similarly, in case ofMaharashtra screening programs for cervical cancer arerun by “Tata Memorial Hospital” since 1998 and “Pra-shanti Cancer Care Mission”, a non- profit organizationprovides care for breast cancer among females.This study has some limitations, and future research
should be encouraged in that direction. Firstly, NFHS-4provides data for women in the reproductive age group of15–49 years only. This prevented the study from analyzingwomen undergoing screening beyond this age group. Sec-ondly, the scope of the paper limited us from providing anyinformation as to whether women undergo screening of
Table 3 Factors influencing Cervical and Breast Screening(Ordinary Least Square Model)
Characteristics OLS Cervical P value OLS Breast P value
Literate − 0.015 0.877 0.130 < 0.001
Currently Married 0.262 0.009 0.162 < 0.001
Hindu − 0.096 < 0.001 − 0.054 < 0.001
General Caste 0.103 0.001 0.054 0.005
Rural 0.127 < 0.001 0.023 0.120
Rich 0.251 < 0.001 0.134 < 0.001
Oral Contraception −0.571 < 0.001 − 0.245 < 0.001
Tobacco Consumption − 0.006 0.881 − 0.145 < 0.001
Insurance 0.079 0.004 0.034 0.051
Multiple Partners −0.394 < 0.001 – –
Parity> 3 − 0.403 < 0.001 – –
Alcohol – – − 0.015 0.901
Obese – – − 0.325 < 0.001
Model Estimates
Multiple R Squared 0.389 0.342
Adjusted R Squared 0.379 0.331
AIC 4968 4314.4
Table 4 Spatial Autocorrelation of Residuals for Cervical andBreast Screening
Residuals Moran’s I
Cervical Breast
OLS 0.422 *** 0.344 ***
Error −0.039 −0.047
Note: *** = p < 0.01 ** = p < 0.05 * = p < 0.1
Table 5 Spatial Dependence for Cervical and Breast Screening
Test Statistics Cervical Breast
Lagrange Multiplier Error 293.65 *** 194.99 ***
Lagrange Multiplier Lag 266.96 *** 209.79 ***
Robust Lagrange Multiplier Error 37.28 *** 7.00 **
Robust Lagrange Multiplier Lag 10.59 ** 21.79 ***
SARMA 304.24 *** 216.79 ***
Note: *** p < 0.001, ** p < 0.01
Monica and Mishra BMC Women's Health (2020) 20:225 Page 10 of 15

their own volition or due to external factors like govern-ment interventions. Thirdly, women opting for screeninginclude both those who like to practice preventive behavioras well as those who are suffering from the disease itself. Itis difficult to draw any inference due to data limitation.
ConclusionEven though cervical and breast cancer are preventablein nature through timely detection of precancerouslesions by using screening tests, there are geospatialvariations in cervical and breast screening across districts
Fig. 5 a OLS Residual Map - Cervical Screening. b Spatial Error Model Residual Map - Cervical Screening
Monica and Mishra BMC Women's Health (2020) 20:225 Page 11 of 15

of India. Thereby, this study highlights the importance ofensuring a region-specific and organ-specific approach to-wards control and prevention of cancer. Further, throughthematic maps generation, the study indicates that geog-raphy must be considered while assessing disparities andallocating resources. This is in line with the current Indian
government priorities, which as part of National HealthMission, for the first time have launched population-basedprevention, screening, and control programs for cancersof the cervix and the breast. Also, determinants that con-tribute to the utilization of cervical and breast screeningamong women in India include being currently married,
Fig. 6 a OLS Residual Map - Breast Screening. b Spatial Error Model Residual Map - Breast Screening
Monica and Mishra BMC Women's Health (2020) 20:225 Page 12 of 15

Table 6 Factors Influencing Cervical Screening (Spatial Error & Spatial Lag Model)
Characteristics cervical Spatial Error P value Spatial Lag P value
Literate −0.068 0.550 0.009 0.943
Currently Married 0.302 0.001 0.214 0.018
Hindu −0.083 0.003 −0.064 0.001
General Caste 0.083 0.006 0.073 0.004
Rural 0.156 < 0.001 0.087 0.001
Rich 0.332 < 0.001 0.159 < 0.001
Oral Contraception −0.176 0.089 −0.266 < 0.001
Tobacco Consumption −0.014 0.892 0.039 0.330
Multiple Partners −0.182 0.062 −0.206 0.027
Parity> 3 − 0.057 0.967 −0.082 0.333
insurance 0.091 0.004 0.058 0.010
Model Estimates
λ 0.690*** –
ρ – 0.590***
LR Test Value 235.8 *** 215.12 ***
Log-Likelihood − 2353.1 − 2363.4
AIC 4734.2 4754.8
Studentized Breusch-Pagan 22.19** 29.42***
Note: *** = p < 0.01 ** = p < 0.05 * = p < 0.1
Table 7 Factors influencing Breast Screening (Spatial Error & Spatial Lag Model)
Characteristics breast Spatial Error P value Spatial Lag P value
Literate −0.011 0.767 0.056 0.014
Currently Married 0.116 0.007 0.117 0.010
Hindu −0.038 0.007 −0.036 0.001
General Caste 0.064 0.001 0.046 0.005
Rural 0.062 0.001 0.019 0.217
Rich 0.179 < 0.001 0.085 < 0.001
Oral Contraception −0.134 0.022 −0.137 0.001
Obese −0.285 0.004 −0.222 0.003
Tobacco Consumption −0.0732 0.050 −0.054 0.080
Alcohol −0.005 0.932 −0.013 0.808
Insurance −0.005 0.661 0.017 0.241
Model Estimates
λ 0.620*** –
ρ – 0.534***
LR Test Value 164.3 *** 161.5 ***
Log-Likelihood − 2062.04 − 2063.4
AIC 4152.1 4154.9
Studentized Breusch-Pagan 35.3*** 30.52***
Note: *** = p < 0.01 ** = p < 0.05 * = p < 0.1
Monica and Mishra BMC Women's Health (2020) 20:225 Page 13 of 15

rural residence, belonging to general caste and high eco-nomic status. Being insured was positively associated withthe uptake of cervical screening only. Effective implemen-tation of population-based screening programs is the needof the hour and could be a way of improving the healthoutcomes of women in India.
Supplementary informationSupplementary information accompanies this paper at https://doi.org/10.1186/s12905-020-01083-6.
Additional file 1. Fig. 1 Neighbor Weight Matrix Map. Figure 2 Moranscatter plot of cervical screening in distrcits of India. Figure 3 Moranscatter plot for breast screening in districts of India. Table 1: Socio –demographic characteristics of women. Table 2: Variance Inflation Factor(VIF) for Cervical and Breast Screening (Ordinary Least Square Model).
AbbreviationsLISA: Local Indicators of Spatial Autocorrelation; OLS: Ordinary Least SquareRegression; VIF: Variance Inflation Factor; AIC: Akaike Information Criterion;NFHS: National Family Health Survey; PPS: Probability proportional to Size;HPV: Human papillomavirus
AcknowledgementsThe authors are grateful to Prof. Abhishek Singh (Dept. of Public Health andMortality, IIPS, Mumbai) for his guidance and helpful suggestions. His supportand help are deeply appreciated. We also thank Prof. Roger Bivand,Department of Economics, Norwegian School of Economics, Norway. Heinitially corrected and helped us with the codes and concepts of SpatialAnalysis on R studio software. This paper was presented at, Workshop:Population, Health and Society in India through the lens of the latest NFHSround; authors are thankful to Prof. C. Z. Guilmoto (Centre Population etDeveloppement, Paris) for his comments and suggestions.
Authors’ contributionsM and RM conceptualized the idea of the research paper, M and RM wereequally involved in analyzing, drafting and editing of the paper. Both theauthors read and approved the manuscript
FundingNo funding was received for this study from any funding agency ororganization.
Availability of data and materialsData and materials are freely available upon making an official request toDHS Team through the DHS website at https://dhsprogram.com/what-we-do/survey-Types/dHs.cfm
Ethics approval and consent to participateNo ethical approval was required as this study is based on survey dataavailable in the public domain.
Consent for publicationNot applicable
Competing interestsWe declare that we have no competing interest.
Received: 15 January 2020 Accepted: 21 September 2020
References1. World Health Organization (WHO). International Agency for Research on
Cancer. Latest global cancer data: cancer burden rises to 18.1 million newcases and 9.6 million cancer deaths in 2018. Geneva; 2018. https://www.who.int/cancer/PRGlobocanFinal.pdf. Accessed 25 Apr 2020.
2. World Health Organization (WHO). Cancer factsheet; 2020. https://www.who.int/cancer/resources/keyfacts/en/. Accessed 25 Apr 2020.
3. Rastogi T, Hildesheim A, Sinha R. Opportunities for cancer epidemiology indeveloping countries. Nat Rev Cancer. 2004;4(11):909–17.
4. Stewart B, Wild C. World cancer report 2014. Lyon: International Agency forResearch on Cancer. World Health Organization; 2014. p. 630.
5. Ferlay J, Soerjomataram I, Dikshit R, Eser S, Mathers C, Rebelo M, et al.Cancer incidence and mortality worldwide: sources, methods and majorpatterns in GLOBOCAN 2012. Int J Cancer. 2015;136(5):E359–E86.
6. World health Organization (WHO). International Agency for Research onCancer. India factsheet. Lyon: IARC; 2018. https://gco.iarc.fr/today/data/factsheets/populations/356-india-fact-sheets.pdf. Accessed 25 Apr 2020.
7. Kaarthigeyan K. Cervical cancer in India and HPV vaccination. Indian J MedPaediatr Oncol. 2012;33(1):7–12.
8. World Health Organization (WHO). Cancer prevention and control in thecontext of an integrated approach. Geneva: WHO; 2017. https://apps.who.int/iris/bitstream/handle/10665/275676/A70_R12-en.pdf?sequence=1&isAllowed=y. Accessed 25 Apr 2020.
9. Viens L, Perin D, Senkomago V, Neri A, Saraiya M. Questions about cervicaland breast cancer screening knowledge, practice, and outcomes: a reviewof demographic and health surveys. J Women's Health. 2017;26(5):403–12.
10. Britain G. National Screening Committee: first report of the NationalScreening Committee: Department of Health; 1998. http://aogm.org.mo/assets/Uploads/aogm/Guidelines/NHS/National-Screening-Committee-UK-1998.pdf. Accessed 25 Apr 2020.
11. Beining RM. Screening for cervical cancer: an exploratory study of urbanwomen in Tamil Nadu. India: University of Iowa; 2012.
12. Herrmann C, Vounatsou P, Thurlimann B, Probst-Hensch N, Rothermundt C,Ess S. Impact of mammography screening programmes on breast cancermortality in Switzerland, a country with different regional screening policies.BMJ Open. 2018;8(3):e017806.
13. Kitchener HC, Castle PE, Cox JT. Chapter 7: achievements and limitations ofcervical cytology screening. Vaccine. 2006;24(Suppl 3):S3/63–70.
14. International Institute for Population Sciences (IIPS) and ICF. National FamilyHealth Survey (NFHS-4), 2015–16: India. Mumbai: IIPS; 2017.
15. Lin SJ. Factors influencing the uptake of screening services for breast andcervical cancer in Taiwan. J R Soc Promot Heal. 2008;128(6):327–34.
16. Wu S. Sickness and preventive medical behavior. J Health Econ. 2003;22(4):675–89.
17. Coughlin SS, Leadbetter S, Richards T, Sabatino SA. Contextual analysisof breast and cervical cancer screening and factors associated withhealth care access among United States women, 2002. Soc Sci Med.2008;66(2):260–75.
18. McLafferty S, Wang F, Luo L, Butler J. Rural — urban inequalities in late-stage breast cancer: spatial and social dimensions of risk and access.Environment and Planning B: Planning and Design. 2011;38(4):726–40.
19. Selvin E, Brett KM. Breast and cervical cancer screening: Sociodemographicpredictors among white, black, and Hispanic women. Am J Public Health.2003;93(4):618–23.
20. de Sanjose S, Bosch FX, Munoz N, Shah K. Social differences in sexualbehaviour and cervical cancer. IARC Sci Publ. 1997;138:309–17.
21. Franco EL, Duarte-Franco E, Ferenczy A. Cervical cancer: epidemiology,prevention and the role of human papillomavirus infection. Cmaj. 2001;164(7):1017–25.
22. Centers for Disease Control and Prevention (CDC). What are the risk factorsfor breast cancer? 2018. https://www.cdc.gov/cancer/breast/basic_info/risk_factors.htm. Accessed 25 Apr 2020.
23. Akinyemiju TF, McDonald JA, Lantz PM. Health care access dimensions andcervical cancer screening in South Africa: analysis of the world healthsurvey. BMC Public Health. 2015;15:382.
24. Yang TC, Matthews SA, Hillemeier MM. Effect of health care system distruston breast and cervical cancer screening in Philadelphia, Pennsylvania. Am JPublic Health. 2011;101(7):1297–305.
25. Legendre P. Spatial autocorrelation: trouble or new paradigm? Ecology.1993;74(6):1659–73.
26. Huque MH, Bondell H, Ryan L. On the impact of covariate measurementerror on spatial regression modelling. Environmetrics. 2014;25(8):560–70.
27. Fotheringham AS, Brunsdon C, Charlton M. Geographically weightedregression: the analysis of spatially varying relationships. New York,Chichester, Toronto and Brisbane: Wiley; 2003.
28. Legendre P, Dale MRT, Fortin M-J, Gurevitch J, Hohn M, Myers D. Theconsequences of spatial structure for the design and analysis of ecologicalfield surveys. Ecography. 2002;25(5):601–15.
Monica and Mishra BMC Women's Health (2020) 20:225 Page 14 of 15

29. Anselin L. Local indicators of spatial association—LISA. Geogr Anal. 1995;27(2):93–115.
30. Harris R. An introduction to mapping and spatial Modelling in R: Universityof Bristol; 2013.
31. Vogt V, Siegel M, Sundmacher L. Examining regional variation in the use ofcancer screening in Germany. Soc Sci Med. 2014;110:74–80.
32. Jepson R, Clegg A, Forbes C, Lewis R, Sowden A, Kleijnen J. Thedeterminants of screening uptake and interventions for increasing uptake: asystematic review. Health Technol Assess. 2000;4(14):i–vii 1–133.
33. Damiani G, Federico B, Basso D, Ronconi A, Bianchi CB, Anzellotti GM, et al.Socioeconomic disparities in the uptake of breast and cervical cancerscreening in Italy: a cross sectional study. BMC Public Health. 2012;12:99.
34. Verboux D. Breast cancer screening in France: does space matters? 2015.http://www.erudite.univ-paris-est.fr/evenements/jade-journee-annuelle-des-doctorants-de-lerudite/textes-jade-2015/?eID=dam_frontend_push&docID=42135. Accessed 25 Apr 2020.
35. Aster Medcity. Aster Medcity champions cancer screening with Kerala policeand Swasthi Foundation. India; 2017. https://astermedcity.com/events-news-and-gallery/events/readmore/aster-medcity-champions-cancer-screening-with-kerala-police-and-swasthi-foundation. Accessed 25 Apr 2020.
36. Nair MK. Cancer control in Kerala, India. 50 years of cancer control inIndiaNational Cancer Control Programme, Directorate General of HealthServices, Ministry of Health and Family Welfare, Government of India; 2002.p. 114–28.
Publisher’s NoteSpringer Nature remains neutral with regard to jurisdictional claims inpublished maps and institutional affiliations.
Monica and Mishra BMC Women's Health (2020) 20:225 Page 15 of 15