An economic valuation of watershed pollution in … · · 2008-12-04An economic valuation of...
49
ISSN 1818-5614 Global United Nations Pacific Regional Environment Development Environment Facility Programme Programme An economic valuation of watershed pollution in Rarotonga, the Cook Islands By Stefan Hajkowicz and Petero Okotai IWP-Pacific Technical Report (International Waters Project) no. 18
Transcript of An economic valuation of watershed pollution in … · · 2008-12-04An economic valuation of...
ISSN 1818-5614
Global United Nations Pacific Regional Environment Development Environment Facility Programme Programme
An economic valuation of watershed pollution in Rarotonga, the Cook Islands By Stefan Hajkowicz and Petero Okotai IWP-Pacific Technical Report (International Waters Project) no. 18
ii
SPREP IRC Cataloguing-in-Publication data Hajkowicz, Stefan An economic valuation of watershed pollution in Rarotonga, the Cook Islands / by Stefan Hajkowicz and Petero Okotai. – Apia, Samoa : SPREP, 2006. viii + 41 p. ; 29 cm. IWP-Pacific Technical Report (International Waters Project) no. 18 ISBN: 978-982-04-0338-3 ISSN: 1818-5614 1. Watershed pollution – Rarotonga – Cook Islands. 2. Pollution – Water – Economic aspects – Rarotonga, Cook Islands. 3. Watershed pollution – Environmental monitoring – Rarotonga, Cook Islands. 4. Environmental pollution – Measurements – Control – Rarotonga, Cook Islands. I. Okotai, Petero. II. International Waters Project (IWP). III. Secretariat of the Pacific Regional Environment Programme. IV. Title. V. Series. 363.739 47 This report was produced by SPREP’s International Waters Project (IWP), which is implementing the Strategic Action Programme for the International Waters of the Pacific Small Island Developing States, with funding from the Global Environment Facility. This study was funded by IWP and jointly managed by the Secretariat of the Pacific Regional Environment Program (SPREP) and the Cook Islands Government’s Environmental Services Agency. The views expressed in this report are not necessarily those of the publisher. Cover design by SPREP’s Publication Unit Editing and layout: Mark Smaalders Printed by: Marfleet Printing Co. Ltd., Apia, Samoa SPREP PO Box 240, Apia Samoa E: [email protected] T: +685 21 929 F: +685 20 231 Website: www.sprep.org © Secretariat of the Pacific Regional Environment Programme, Commonwealth Scientific and Industrial Research Organisation, and Government of the Cook Islands, 2006 All rights for commercial/for profit reproduction or translation, in any form, reserved. SPREP authorises the partial reproduction of this material for scientific, educational or research purposes, provided that SPREP and the source document are properly acknowledged. Permission to reproduce the document and/or translate in whole, in any form, whether for commercial or non-profit purposes, must be requested in writing. Original SPREP artwork may not be altered or separately published without permission.
iii
Table of contents Acknowledgements........................................................................................................................ iv Glossary of Terms .......................................................................................................................... v Acronyms ...................................................................................................................................... vii Executive summary ........................................................................................................................ 1 Recommendations .......................................................................................................................... 3 1 Introduction ................................................................................................................................ 5 2 Background to the study............................................................................................................ 5 3 Study scope.................................................................................................................................. 6 4 Other Pacific region valuation studies...................................................................................... 6 5 Why conduct an environmental valuation? ............................................................................. 7 6 Background on the Cook Islands .............................................................................................. 7 7 Concepts related to economic valuation ................................................................................. 11
7.1 Types of value ..................................................................................................................... 11 8 Techniques for environmental valuation................................................................................ 12
8.1 Choosing a technique for Rarotonga ............................................................................. 13 8.2 Cost savings and avoidance ........................................................................................... 13 8.3 Net versus gross values in CSA studies......................................................................... 15 8.4 Handling time in CSA studies ....................................................................................... 15
9 Cost avoidance estimates for Rarotonga............................................................................ 16 9.1 Health impacts ............................................................................................................... 16 9.2 Downstream water filtration .......................................................................................... 19 9.3 Rainwater tanks ............................................................................................................. 20 9.4 Upstream water filtration ............................................................................................... 20 9.5 Water pipe upgrades ...................................................................................................... 22 9.6 Bottled water.................................................................................................................. 22 9.7 Mosquito control............................................................................................................ 23 9.8 Loss of lagoon fish stocks.............................................................................................. 24 9.9 Lost tourism income ...................................................................................................... 25 9.10 Non-financial impacts.................................................................................................... 28
References ..................................................................................................................................... 31 Appendix A: Persons consulted................................................................................................... 33 Appendix B: The study's objectives and products .................................................................... 34 Appendix C: Discussion of alternative valuation techniques ................................................... 35 Appendix D: Summary table of valuation techniques .............................................................. 37 Appendix E: Survey on water use............................................................................................... 40 Appendix F: Takitumu irritant syndrome health warning ...................................................... 41

iv
Acknowledgements The authors1 are very grateful to numerous persons in Rarotonga who freely gave their time, advice, data and knowledge. Some, though not all, are listed in Appendix A. Gratitude is expressed to the national coordinator and assistant national coordinator of the International Waters Project Cook Islands and to members of the International Waters Project National Task Force (NTF), who provided advice and feedback. The authors are also grateful to Paula Holland and staff from Project Coordination Unit of the Secretariat of the Pacific Regional Environment Programme, for providing valuable and detailed review comments on early drafts, and managing the project.
1 The consultancy work was undertaken by Stefan Hajkowicz and Petero Okotai. Stefan Hajkowicz is an environmental policy analyst with CSIRO Sustainable Ecosystems based in Brisbane Australia (e-mail: [email protected]; tel: +61 7 3214 2327). Petero Okotai is a consultant with the Voyager Consulting Group based in Rarotonga, Cook Islands (e-mail: [email protected]).
v
Glossary of Terms Ameliorative expenditure
Costs of reducing the harmful impacts of environmental problems, i.e. treating the symptoms. Purchasing bottled water is an example of ameliorative expenditure potentially resulting from poor drinking water quality.
Annuity An annuity is a finite series of periodic cash flows. It can be used to calculate periodic payments into the future arising from upfront capital expenditure. This allows once-off payments to be expressed in annualised terms.
Benefit cost analysis
An economic evaluation technique involving the comparison of a project"s benefits and costs over time to help determine whether the project is worthwhile.
Best, high and low estimates
The results are reported as low, high and best estimates. The best estimate is based on the set of assumptions judged to be most realistic. The low and high cost estimates are attained by varying the assumptions within set ranges.
Catchment For the purposes of this document, the area of the watershed within which rainfall is collected and drains through streams to a collection point or "water intake" for public consumption. (In Rarotonga, no one lives in this area, but access is not controlled or limited.)
Ciguatera Also known as fish poisoning, ciguatera is a form of human poisoning associated with seafood consumption with severe and sometimes prolonged and recurring symptoms. Certain types of fish become cigautoxic by consuming contaminated macroalgae attached to coral. Ciguatera is believed to be exacerbated by land sourced pollutants but the link is not yet scientifically proven.
Cost savings and avoidance (CSA)
The costs avoided (or saved) when environmental problems are effectively managed. These can also be referred to as gross benefits.
Depreciation The decrease in asset value over time due to wear and tear or obsolescence (e.g. the emergence of new technologies).
Discount rate This is the rate at which future payments are devalued. It is used in financial and economic calculations to incorporate the lost of opportunity of investing elsewhere and the tendency of people to prefer goods now rather than later.
E. Coli Escherichia coli is a type of faecal coliform. It can contaminate water supplies and cause gastrointestinal illness.
Environmental service
Any valued good or service supplied to humans though natural processes.
Faecal coliform Faecal coliform is a bacteria associated with animal and human excrement. If consumed it can be harmful to humans and potentially cause severe illness. Faecal coliform is a major cause of waterborne illness.
Gross benefit The magnitude of the economic benefit from correcting an environmental problem. Gross benefit does not account for the costs of remedial activities.

vi
Imputed costs The costs estimated (imputed) when market prices for items do not exist. For example, the loss of time resulting from illness can be handled as an imputed cost of labour being equal to the salary forgone while the patient recovers.
Inflation The tendency for the prices of goods and services to rise over time often measured with the cost price index.
Intergenerational equity
The fair distribution of wealth between the current generation and the next.
Mitigatory expenditure
Expenses incurred in activities aimed at reducing the potential for a physical hazard to cause asset damage, e.g. building flood barriers.
Net benefit The magnitude of the economic benefit from correcting an environmental problem less the costs of remedial activities.
Net present value This is equal to the present value of benefits less the present value of costs.
Non Use Value The value derived from knowing a resource exists and/or will be enjoyed by the next generation even though the person deriving value may never actually see or touch the resource. These are also referred to as "passive" use values.
Opportunity cost The lost opportunity of not pursuing the next best alternative. It can be considered the amount "sacrificed" because of selecting a particular course of action.
Present value This is the present value of a stream of future payments derived using a discount rate and accounting formulae.
Residual value The remaining value of an asset after depreciation over a set time period.
Total coliform A group of related organisms common in both the guts of animals and the environment. If total coliform is found present during water quality tests, detailed tests are usually conducted for other types of coliform such as E. Coli (US EPA 2005) which are harmful to humans.
Total economic value
The total of all types of use and non-use values people derive from natural resources.
Use value The value derived by people from direct or indirect use of a good or service. Direct use relates to immediate and obvious benefits derived from the good, e.g. fishing. Indirect use involves intermediate stages before benefits are obtained, e.g. drinking water cleansed by natural ecosystem filtration.
Watershed The area of land which includes the catchments within which rainfall is captured and drains through creeks, streams and rivers to an exit point which is the sea.

vii
Acronyms AE ameliorative expenditure
BCA benefit–cost analysis
CITC Cook Islands Tourism Corporation
CM choice modelling
CPI cost price index
CSA cost savings and avoidance
CVM contingent valuation method
GDP gross domestic product
HDI human development index
IWP International Waters Project
LP lost production
MMR Ministry of Marine Resources
NPV net present value
NZD New Zealand dollar
PME preventative and mitigatory expenditure
REC repair cost
RPC replacement cost
SPREP Secretariat of the Pacific Regional Environment Programme
TEV total economic value
UNDP United Nations Development Programme
USD United States dollar
WTA willingness to accept
WTP willingness to pay

viii

1
Executive summary
The International Waters Project (IWP) aims to strengthen the management and conservation of marine, coastal and freshwater resources in the Pacific Islands region. It is financed through the International Waters Programme of the Global Environment Facility, implemented by the United Nations Development Programme, and executed by the Secretariat of the Pacific Regional Environment Programme (SPREP), in conjunction with the governments of the 14 participating independent Pacific Island countries.
The Cook Islands IWP has established a project to address freshwater resources. Activities to address freshwater include community-based activities as well as national level activities. Community-based activities may include “low tech” solutions to addressing environmental degradation while national level activities may involve actions with a broader or more strategic focus.
The watersheds of the Cook Islands provide residents and visitors with a wide range of environmental services such as the supply of drinking water, natural filtration of freshwater runoff, recreational opportunities and scenery. While important, the value of these services is not readily apparent in economic terms. This means they can easily be overlooked in decision making and policy formulation. There is a pressing need to better understand the economic value of the nation’s watersheds to raise awareness and inform investment and regulatory decisions. This economic evaluation of the Rarotonga watershed has been conducted to support both community and national elements of the IWP in the Cook Islands.
It is estimated that Rarotonga, the largest of the Cook Islands by area and population, could potentially avoid costs of 7.4 million New Zealand dollars (NZD) per year, or NZD 2,900 per household per year, if watershed pollution across the entire island was prevented. The breakdown and range of avoidable costs is shown below. All results are gross values and do not include the costs of remedial action. Further studies into the benefits and costs of specific remedial actions will be required to assess the returns on investment.
Table i: Estimates of potentially avoidable costs (in NZD 000 per year)
Estimates Cost categories
Best Low High
Healthcare and illness costs (diarrhea, gastroenteritis, dengue fever & fish poisoning) 1,003 473 1,534
Downstream household water filters 116 80 161 Upstream public water filters 730 382 1,243
Household rainwater tanks 10 4 20
Bottled water 1,500 760 2,241
Mosquito control 1 1 1
Loss of fish stocks in lagoon 534 267 802
Water pipe upgrades 104 44 214
Lost tourism income 3,440 1,147 11,467
Total annual cost 7,439 3,157 17,682
Total annual cost per household 2.9 1.2 7
As % of 2003 gross domestic product (GDP) 3.12% 1.32% 7.41%
The avoided costs can be considered a potential gross benefit of watershed management. In other words, they would not occur were the watershed in perfect environmental condition. However, the extent to which these costs can be recovered is not known. It is likely that watershed management activities will only recover some part of the avoidable costs. This is
2
because a “perfect” cleanup of the watershed is unlikely to be feasible. Even the best management actions are likely to leave some pollution.
The results are based on data held in government reports, surveys of Rarotongan residents and tourists, and estimates supplied by government and industry staff. The assumption for which the results are most sensitive is the percentage of tourists not visiting Rarotonga due to concerns about lagoon and fresh water quality. The best estimate is based on a three per cent loss in tourists per annum. Further research is required to more deeply test the relationship between environmental conditions and tourist visitation. If tourist costs are removed, the economic impact is still significant, with a best estimate of NZD 4 million per annum or NZD 1,600 per household per annum.
At 1.32–7.41% of the Cook Islands gross domestic product (GDP), these costs place a significant burden on the local economy and constitute a not insignificant portion of people's day-to-day living expenses. Effective management of watersheds to recover at least some part of these costs will require a combined government, industry and community response to address:
• soil erosion and stream sedimentation; • herbicide and pesticide runoff; • fertiliser runoff; • livestock and animal waste; • septic tank leakage; • mosquito outbreaks from stream blockage and poor waste disposal; and • liquid and solid waste disposal.
Because these problems are dispersed across Rarotonga’s watersheds and involve many households and private firms, carefully designed policy instruments are required to deliver desired changes. These instruments might involve incentive payments, covenants with landholders or leaseholders, tax subsidies, awareness programs, training programs or regulatory provisions.
Part of policy design should include analysis on Rarotonga of the location and type of land management activities that will produce the greatest water quality benefits. It is likely that there exist some target land uses and sites on Rarotonga that have a pronounced impact on water quality. Identifying these sites will lead to improved efficiency of expenditure and overall response.
The impacts described in this report are only those that could be readily expressed in dollar values. There are numerous other non-financial impacts that also have significant, possibly greater, value to people:
• potential loss or harm to biodiversity; • loss of recreational or cultural sites; • damage to scenic beauty; • non-financial human health impacts.
Although not valued in monetary terms, these impacts warrant consideration in decisions alongside the financial costs identified in this report.

3
Recommendations 1. Review watershed programs in light of cost estimates
The range of potentially recoverable costs of watershed pollution identified in this report should be given consideration by government policy makers in light of the size and effectiveness of watershed protection programs and regulatory provisions aimed at reducing pollution. Given the considerable impact on the economy arising from watershed pollution there is an economic case for investigating, and most likely implementing, improved watershed management strategies.
2. Assess and identify policy instruments to improve watersheds
A set of alternative policy instruments for achieving required improvements in watershed management should be identified and then evaluated for the Cook Islands’ specific needs. The policy instruments could include tax subsidies, incentive payments, competitive tendering for watershed improvement contracts, awareness schemes, tradeable permits and regulations. It will be necessary to identify the mix of instruments that most suits the Cook Islands’ requirements.
3. Create government, community, industry and aid agency awareness
The government, community and industry stakeholders should be made aware of the potential costs of watershed pollution, both to the economy and to individuals on a day-to-day basis. Increased awareness may help promote improved watershed management. The results should also be shared with international aid agencies and investment banks, such as the Asian Development Bank. Opportunities for collaborating with these agencies in addressing watershed pollution in the Cook Islands should be explored.
4. Assess costs & benefits of on-ground actions
An assessment should be made of possible on-the-ground watershed management actions and their likely benefits and costs. These may include improved septic tank systems, fencing of riparian areas to restrict livestock access, improved or restricted fertiliser and pesticide application practices, installing stormwater filtering devices and improved building practices to prevent erosion during construction.
5. Identify pathways and target sites
The pathways for pollutants entering the lagoon, streams and drinking water supplies should be identified. This should be done to identify target sites, where improvement of land management or other practices will have the most significant impact on water quality. It is likely that funds for watershed rehabilitation will be limited so careful targeting will be important to ensure expeditures are efficient.
6. Consider relevance of Rarotongan results to other islands
The relevance of the results for Rarotonga should be given consideration on other islands, especially Aitutaki, which is experiencing considerable development pressure with the rapid growth in tourism. There may be relatively low-cost pre-emptive measures that could be taken for the islands with low population, before problems start to emerge. These opportunities should be assessed.
7. Assess impact of environmental quality on tourist arrivals
Given the importance of tourism to the Cook Islands’ economy further investigation should be conducted into the relationship between environmental quality and visitation rates. This study briefly explored tourist motivations for visiting the Cook Islands but further work needs to be conducted to assess the importance of the environmental component.
4
8. Develop an up-to-date land use map for Rarotonga and Aitutaki
The continuing growth of tourism is likely to place further pressures on the Cook Islands natural environment and watersheds. In the absence of a national and widely accepted land use plan, efforts to ensure tourism, and other industries, deliver the maximum attainable benefits to Cook Islanders will be hampered. It is recommended that a land use plan be developed for Rarotonga and Aitutaki to help use the nation’s scarce land resources effectively.
9. Water quality testing
There are currently limited water quality tests available for stream, tap and lagoon water on Rarotonga, and the Cook Islands generally. Tests for major pollutants should be undertaken at regular intervals according to appropriate standards and techniques. Water quality testing by different government agencies should be harmonised. Further efforts may be required to ensure ease of access to this data by the public.

5
1 Introduction The watersheds of the Cook Islands provide residents and visitors with a wide range of environmental services such as drinking water supplies, natural filtration of freshwater runoff, recreational opportunities and scenery. While important, the value of these services is not readily apparent in economic terms. This means they can easily be overlooked in decision making and policy formulation. There is a pressing need to better understand the economic value of the nation's watersheds to raise awareness and inform investment and regulatory decisions.
This report presents an economic valuation of watershed services to Rarotonga, the largest and most populated island in the Cook Islands. The methodology is based on the cost savings and avoidance approach to valuation. The study estimates the potential gross benefit of effective watershed management. The gross benefit is equal to the costs avoided were the watershed without any pollution. It does not account for the costs of remedial action. The extent to which gross benefits estimated in this report are recoverable is unknown.
Many important detrimental impacts of watershed pollution exist that are difficult or impossible to express in monetary terms, such as recreation and biodiversity. Though important, these impacts are not quantified in monetary terms in this report. Nevertheless, they should be given consideration alongside the quantified economic impacts in decision making.
The report commences with a discussion of the study scope, other related studies and a background description of environmental and economic issues in the Cook Islands. It then presents cost estimates under each category. The assumptions, input data and results are described. In a few cases the amount of information reported is limited due to confidentiality requirements. Alternative economic valuation methodologies that could potentially be applied are also discussed. The report concludes with a brief discussion of policy implications and future directions.
2 Background to the study This study has been undertaken at the request of the International Waters Project (IWP).2
IWP is a 7-year, USD 12 million initiative concerned with management and conservation of marine, coastal and freshwater resources in the Pacific islands region, and is specifically intended to address the root causes of environmental degradation related to trans-boundary issues in the Pacific. The project includes two components: an Integrated Coastal and Watershed Management (ICWM) component, and an Oceanic Fisheries Management component (the latter has been managed as a separate project). It is financed by the Global Environment Facility (GEF) under its International Waters Programme. The ICWM component is implemented by the United Nations Development Programme (UNDP) and executed by the Secretariat of the Pacific Regional Environment Programme (SPREP), in conjunction with the governments of the 14 independent Pacific Island countries: Cook Islands, Federated States of Micronesia, Fiji, Kiribati, Marshall Islands, Nauru, Niue, Palau, Papua New Guinea, Samoa, Solomon Islands, Tonga, Tuvalu and Vanuatu. The ICWM component focuses on integrated coastal watershed management, and supports national and community-level actions that address priority environmental concerns relating to marine and fresh water quality, habitat modification and degradation and unsustainable use of living marine resources through a 7-year phase of pilot activities, which started in 2000 and will conclude at the end of 2006.
2 IWP is formally titled Implementation of the Strategic Action Programme of the Pacific Small Islands Developing States.
6
Under the IWP in the Cook Islands, a project has been established to address freshwater resources. Activities to address freshwater include community based activities as well as national level activities. Community based activities may include “low tech” solutions to addressing environmental degradation while national level activities may involve actions with a broader or more strategic focus. This economic evaluation of the Rarotonga watershed has been conducted to support both community and national elements of the IWP in the Cook Islands.
3 Study scope This study was conducted during February and March 2005. The study objectives and deliverables are contained in Appendix B. An important part of the study was helping to build local capacity in the Cook Islands for environmental and resource economic analyses of this nature. The study was proceeded by a scoping of the major environmental and economic issues associated with the management of Rarotonga’s watersheds. This study has been undertaken over a relatively short period of time and at relatively low cost to obtain a rough estimate of economic value.
The valuation study is initially focused on Rarotonga, the largest and most populated of the Cook Islands. It is anticipated that methods, procedures and principles developed on Rarotonga will have applicability to other islands within the Cook Islands, and possibly elsewhere in the Pacific region. However, direct transfers of cost estimates will require careful adjustments and would not be appropriate in some cases.
Key outcomes from the study include: (a) estimates of the economic costs of watershed pollution on Rarotonga; (b) a better understanding of the methods, procedures and principles for valuation of environmental services in the Cook Islands; (c) an assessment of alternative valuation techniques; and (d) an appraisal of how environmental valuation methods can support the Cook Island’s policy formulation. The quantitative estimates are partly based on expert judgements and informed assumptions.
4 Other Pacific region valuation studies There have been few economic valuation studies of environmental resources of small island nations of the Pacific region. An economic valuation of mangrove habitats in Fiji was conducted by Lal (1990) considering damage costs avoided by protecting mangroves. This study found the following economic values associated with mangrove habitats:
• 6 USD/ha/yr for forestry benefits; • 100 USD/ha/yr for fishery benefits; and • 2600 USD/ha/yr for nutrient filtering involving human waste treatment.
A recent valuation study by Cantrell et al. (2004) used contingent valuation to determine the potential value of a fish stock enhancement program for Pacific threadfin in Hawaii. Contingent valuation is a survey-based valuation technique asking people's willingness to pay for environmental services or willingness to accept compensation for their loss (see Appendix C). It was found that people's net willingness to pay for the current average catch rate of 3.8 fish per trip is USD 7.95.
At the time of writing an environmental valuation study was underway in Tonga. This study is examining the economic costs and benefits of solid waste treatment.3 A search of environmental and resource economics journal databases, compendiums of valuation case studies (Rietbergen-McCracken and Abaza 2000) and internet searches found few other
3 Lal and Takau 2006.

7
examples from the South Pacific. However, many studies have been conducted in developed and developing nations outside the Pacific region.
5 Why conduct an environmental valuation? There have been thousands of environmental valuation studies conducted worldwide (for reviews see Adamowicz 2003; Rietbergen-McCracken and Abaza 2000). An environmental valuation study is typically undertaken to:
• Raise awareness about the magnitude of an environmental problem; • Place environmental issues on an “even footing” alongside economic concerns
that can easily dominate government and industry decisions; • Inform decisions about the appropriate level of investment in managing
environmental problems or protecting endangered resources; • Allow for explicit trade-offs between the environment and other areas of social
expenditure; • Estimate benefits and costs for environmental factors in a benefit–cost analysis
(BCA). The main reasons for the Cook Islands valuation study are to raise awareness of the importance of watershed pollution issues and to inform investment and regulatory decisions. This study may be followed by a set of carefully designed policy instruments and watershed management plans to achieve desired improvements in environmental conditions.
6 Background on the Cook Islands The Cook Islands consist of 15 small islands in the South Pacific, between 9° and 23° S latitude, and 156° and 167° W longitude (see Fig. 1 and Fig. 2). In 2001 (the latest census) the population of the Cook Islands was estimated at 18,027, and that of Rarotonga at 12,188. With a land area of 67.1 square kilometres (km2) Rarotonga is the largest of the islands, which have an aggregate land area of 236.7 km2. Land represents a small fraction of the Cook Islands exclusive economic zone which is mostly ocean and covers almost 2 million km2. The country is generally divided into the “northern” and “southern” groups of islands. Rarotonga is in the southern group. The overall resident population of the Cook Islands has declined over the last 20 years, due to overseas emigration, although that of Rarotonga has increased somewhat over that period, due to migration from the outer islands to Rarotonga. The 2001 resident population of Rarotonga was 9451, a decrease from the 10,374 recorded in 1996 (Statistics Office 2001). In 2004 the country's population growth rate was estimated to be negative 3.7%, and that of Rarotonga a negative 1.9% (SPC 2004).
The Cook Islands has the second highest per capita income of IWP participating countries (USD 4,947) (UNDP 1999). Life expectancy is relatively high, and infant mortality low, compared to other Pacific Island countries. The Cook Islands also ranks highly according to the United Nations Development Programme's human development index (HDI) (second in the Pacific region). The HDI combines a range of human quality of life indicators into a single index.
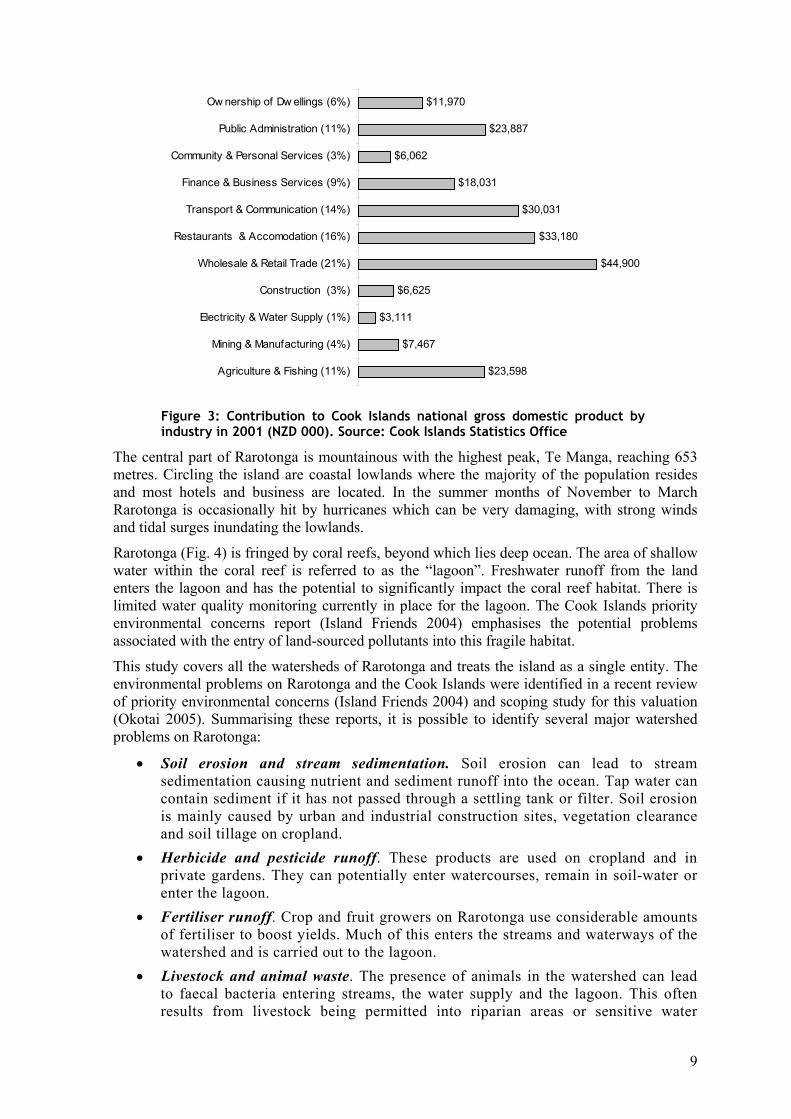
Restaurants and accommodation, which are industries heavily dependent on tourism, account for 16% of the Cook Islands' national income (Fig. 3). It is likely that tourists are also important to many other industries (e.g. transport, communication, retail). The primary industries of agriculture and fishing account for 11% of gross domestic product. In 2003 fish products accounted for 59% of exports, pearls for 20% and paw paws for 4%. It is estimated that around 70% of Cook Islanders are engaged in some type of agricultural activity, much of which is on a subsistence basis (Statistics Office 2001). It is common for a household to have chickens, goats, cows and/or pigs, and grow crops such as taro or bananas.

8
Figure 1: Location map
0 150 300 km
Pukapuka
Nassau Island
Penryhn
Manihiki
Rakahanga
Suwarrow
PalmerstonAitutaki Manuae
Takutea
Atiu
Mitiaro
MaukeRarotonga
Mangaia
SOUTH PACIFIC
0 150 300 km
Pukapuka
Nassau Island
Penryhn
Manihiki
Rakahanga
Suwarrow
PalmerstonAitutaki Manuae
Takutea
Atiu
Mitiaro
MaukeRarotonga
Mangaia
SOUTH PACIFIC
Figure 2: The Cook Islands
9
$23,598
$7,467
$3,111
$6,625
$44,900
$33,180
$30,031
$18,031
$6,062
$23,887
$11,970
Agriculture & Fishing (11%)
Mining & Manufacturing (4%)
Electricity & Water Supply (1%)
Construction (3%)
Wholesale & Retail Trade (21%)
Restaurants & Accomodation (16%)
Transport & Communication (14%)
Finance & Business Services (9%)
Community & Personal Services (3%)
Public Administration (11%)
Ow nership of Dw ellings (6%)
Figure 3: Contribution to Cook Islands national gross domestic product by industry in 2001 (NZD 000). Source: Cook Islands Statistics Office
The central part of Rarotonga is mountainous with the highest peak, Te Manga, reaching 653 metres. Circling the island are coastal lowlands where the majority of the population resides and most hotels and business are located. In the summer months of November to March Rarotonga is occasionally hit by hurricanes which can be very damaging, with strong winds and tidal surges inundating the lowlands.
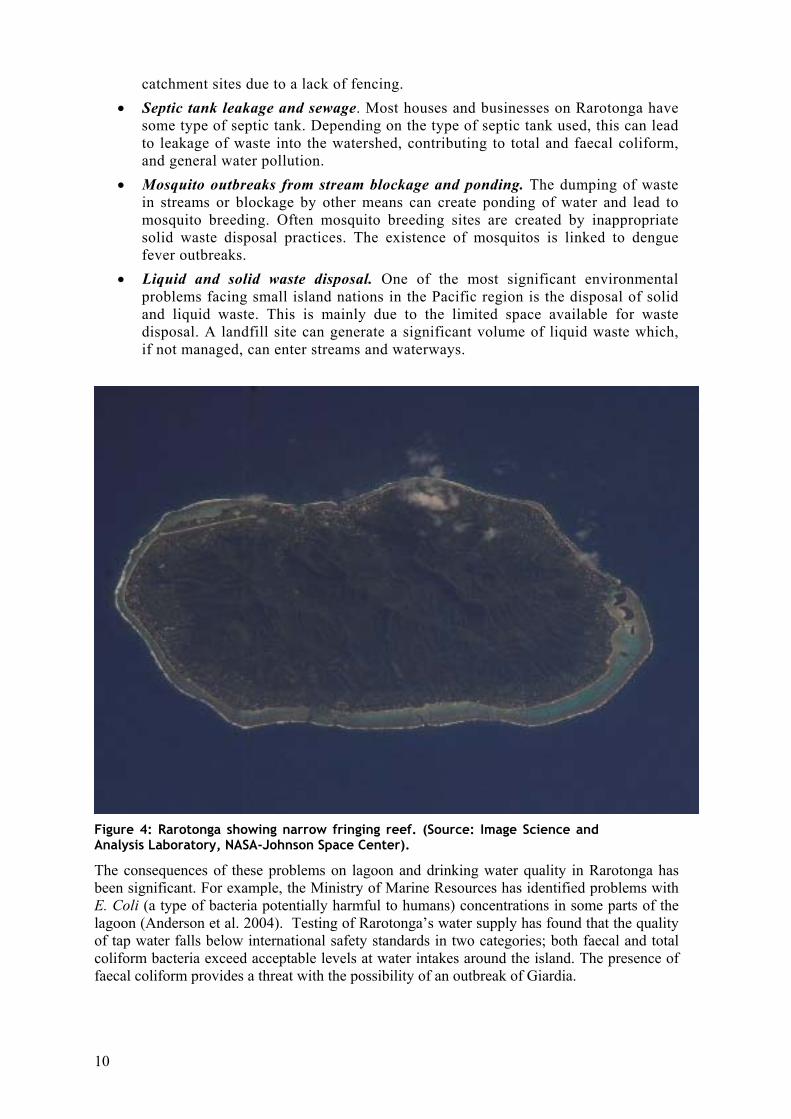
Rarotonga (Fig. 4) is fringed by coral reefs, beyond which lies deep ocean. The area of shallow water within the coral reef is referred to as the “lagoon”. Freshwater runoff from the land enters the lagoon and has the potential to significantly impact the coral reef habitat. There is limited water quality monitoring currently in place for the lagoon. The Cook Islands priority environmental concerns report (Island Friends 2004) emphasises the potential problems associated with the entry of land-sourced pollutants into this fragile habitat.
This study covers all the watersheds of Rarotonga and treats the island as a single entity. The environmental problems on Rarotonga and the Cook Islands were identified in a recent review of priority environmental concerns (Island Friends 2004) and scoping study for this valuation (Okotai 2005). Summarising these reports, it is possible to identify several major watershed problems on Rarotonga:
• Soil erosion and stream sedimentation. Soil erosion can lead to stream sedimentation causing nutrient and sediment runoff into the ocean. Tap water can contain sediment if it has not passed through a settling tank or filter. Soil erosion is mainly caused by urban and industrial construction sites, vegetation clearance and soil tillage on cropland.
• Herbicide and pesticide runoff. These products are used on cropland and in private gardens. They can potentially enter watercourses, remain in soil-water or enter the lagoon.
• Fertiliser runoff. Crop and fruit growers on Rarotonga use considerable amounts of fertiliser to boost yields. Much of this enters the streams and waterways of the watershed and is carried out to the lagoon.
• Livestock and animal waste. The presence of animals in the watershed can lead to faecal bacteria entering streams, the water supply and the lagoon. This often results from livestock being permitted into riparian areas or sensitive water
10
catchment sites due to a lack of fencing. • Septic tank leakage and sewage. Most houses and businesses on Rarotonga have
some type of septic tank. Depending on the type of septic tank used, this can lead to leakage of waste into the watershed, contributing to total and faecal coliform, and general water pollution.
• Mosquito outbreaks from stream blockage and ponding. The dumping of waste in streams or blockage by other means can create ponding of water and lead to mosquito breeding. Often mosquito breeding sites are created by inappropriate solid waste disposal practices. The existence of mosquitos is linked to dengue fever outbreaks.
• Liquid and solid waste disposal. One of the most significant environmental problems facing small island nations in the Pacific region is the disposal of solid and liquid waste. This is mainly due to the limited space available for waste disposal. A landfill site can generate a significant volume of liquid waste which, if not managed, can enter streams and waterways.
Figure 4: Rarotonga showing narrow fringing reef. (Source: Image Science and Analysis Laboratory, NASA-Johnson Space Center).
The consequences of these problems on lagoon and drinking water quality in Rarotonga has been significant. For example, the Ministry of Marine Resources has identified problems with E. Coli (a type of bacteria potentially harmful to humans) concentrations in some parts of the lagoon (Anderson et al. 2004). Testing of Rarotonga’s water supply has found that the quality of tap water falls below international safety standards in two categories; both faecal and total coliform bacteria exceed acceptable levels at water intakes around the island. The presence of faecal coliform provides a threat with the possibility of an outbreak of Giardia.

11
The financial impacts of watershed problems are estimated in this study. Numerous other intangible impacts arise from these problems, which are not valued in dollar terms. These intangible impacts could, for instance, include the loss of endangered plant and animal species, the degradation of cultural sites, the loss of recreational amenity and the loss of scenic beauty. It is appropriate that all relevant monetary and non-monetary impacts be given consideration in decision making.
7 Concepts related to economic valuation 7.1 Types of value People derive value from Rarotonga’s watersheds and other natural resources in different ways. The total economic value (TEV) of a resource is the sum total of all values a person attaches to it (Campbell and Brown 2003). The types of value classified under TEV, along with possible examples, are shown in Fig. 5.
TOTAL ECONOMIC V ALUE
Use Values Non-Use Values
Direct use value
Indi rect use value
Existence value
Bequest value
Option value
Drinking w aterIrrigation w ater
Water f iltrationFood production
Deferred direct and indirect use values
Landscape sceneryBiodiversity
Cultural signif icance
Consumptive
Sw immingSnorkellingSunbathing
Non-Consumptive
Figure 5: Total economic value
TEV comprises use and non-use values. Use values comprise direct and indirect use values. A direct use value includes the marketed goods and services related to the environmental resource. Direct use can be either consumptive, involving the depletion of a finite resource or non-consumptive, where enjoyment or use of the resource does not diminish its usefulness to others. An example of consumptive use on Rarotonga is the diversion of freshwater streams for drinking water. Non-consumptive use might be swimming and snorkelling in the lagoon.
Indirect use values involve an intermediary step between the environmental resource and the delivery of the good or service. For example, high quality agricultural produce is possible when soil resources are healthy. In this way people derive indirect value, i.e. good quality food products, from the soil resource.
Option values can be considered both a type of use and non-use value. An option value is the benefit derived from being able to use or enjoy an environmental resource at some point in the future. Merely having the option for alternative future uses is a source of value. Option values are difficult to quantify but are being increasingly recognised as an important source of value.
Non-use values include existence value and bequest value. Existence value refers to the benefits derived when people know an environmental resource exists even if they may never actual see or touch the resource. Bequest value is derived from knowing an environmental
12
resource will be enjoyed by the next generation. These values are also referred to as passive values, because they do not actually involve use of a resource.
Passive values are generally the most difficult values to quantify in monetary units because they have ill-defined or non-existent markets. The Rarotongan flycatcher, or kakerori (a bird) is an example of an environmental asset for which people are likely to hold existence and bequest value. This bird species in danger of becoming extinct. Both Cook Islands residents and many people living overseas place considerable value on knowing the bird species exist and that their children may also see one.
While biodiversity resources such as the kakerori are extremely valuable, this study is limited to a valuation of direct and indirect use values. It does not attempt to quantify option values, existence values or bequest values. This is due to methodological reasons (i.e. it is extremely difficult to express such intangible goods in monetary units), and time and resource constraints. Passive values are, nevertheless, important dimensions of natural resource management in the Cook Islands and should be given due consideration in decision making.
The different values conferred by watersheds on the economy of Rarotonga will impact different groups of stakeholders. For instance, well protected watersheds can provide farmers with fresh water in order to produce goods and services. These benefits, which accrue to individual firms or industry sectors, are commonly termed private benefits. By comparison, the same protection of watersheds can benefit the government of Rarotonga by minimising delivery costs for tap water. Such government benefits may be referred to as public benefits.
8 Techniques for environmental valuation The field of environmental economics has grappled with questions of environmental valuation for over the last 50 years (Adamowicz 2004). Numerous techniques have emerged, along with a vigorous debate about their relative merits. The range of valuation techniques available can be classified under several major groupings:
Market pricing. These techniques estimate the direct change in value of marketable goods and services following a change in environmental condition. In this report the market pricing technique used is cost savings and avoidance (CSA, see section 7.2).
Revealed preferences. The market value of an environmental good or service is inferred from the buying and selling of a related market good. An example might be the premium paid for a house with scenic views, as opposed to the same house without views. This can allow an estimate of the unit price of an environmental good.
Stated preferences. These techniques rely on surveys of the general populous about their willingness to pay for environmental services or their willingness to accept compensation for the loss of those services. The market is typically treated as hypothetical as payments do not occur in reality.
Non-monetary metrics. These approaches combine a set of environmental attributes in a variety of units into an overall performance metric that states the relative value of one environmental asset relative to another. They make no attempt to express value in monetary units, rather they define a non-monetary metric that measures the value of one option relative to another, i.e. they can provide a ranking.
Qualitative approaches. These approaches abandon the notion of quantitatively measuring environmental value due to ethical, methodological or data constraints. The worth of environmental goods is expressed through clear and concisely worded statements of value.
These broad approaches cover numerous specific valuation techniques. Appendix C and Appendix D contain a description of alternative techniques that have not been applied in this study.
13
8.1 Choosing a technique for Rarotonga The economic valuation technique adopted for this study is cost savings and avoidance (CSA). The CSA technique captures a range of measures including preventative and mitigatory expenditure, ameliorative expenditure, replacement costs, repair cost and lost production (Table 1). The use of CSA means that the valuation is limited to direct market costs. It does not attempt to include non-marketed goods such as biodiversity. Limited resources and time available for the valuation study limited the scope for applying other techniques.
While this limits the study to direct and indirect use values, market valuation techniques avoid the considerable methodological difficulties and onerous data requirements of stated and revealed preference techniques. Capturing only the market values (i.e. use values) of environmental services in Rarotonga will be a considerable achievement given that this is the first watershed valuation study conducted in the Cook Islands, and one of the first in the Pacific Island region.
8.2 Cost savings and avoidance In this report cost savings and avoidance (CSA) is used to summarise a range of market valuation methods that attempt to estimate the economic costs avoided if watershed deterioration did not occur or, conversely, the economic costs incurred if it continued.
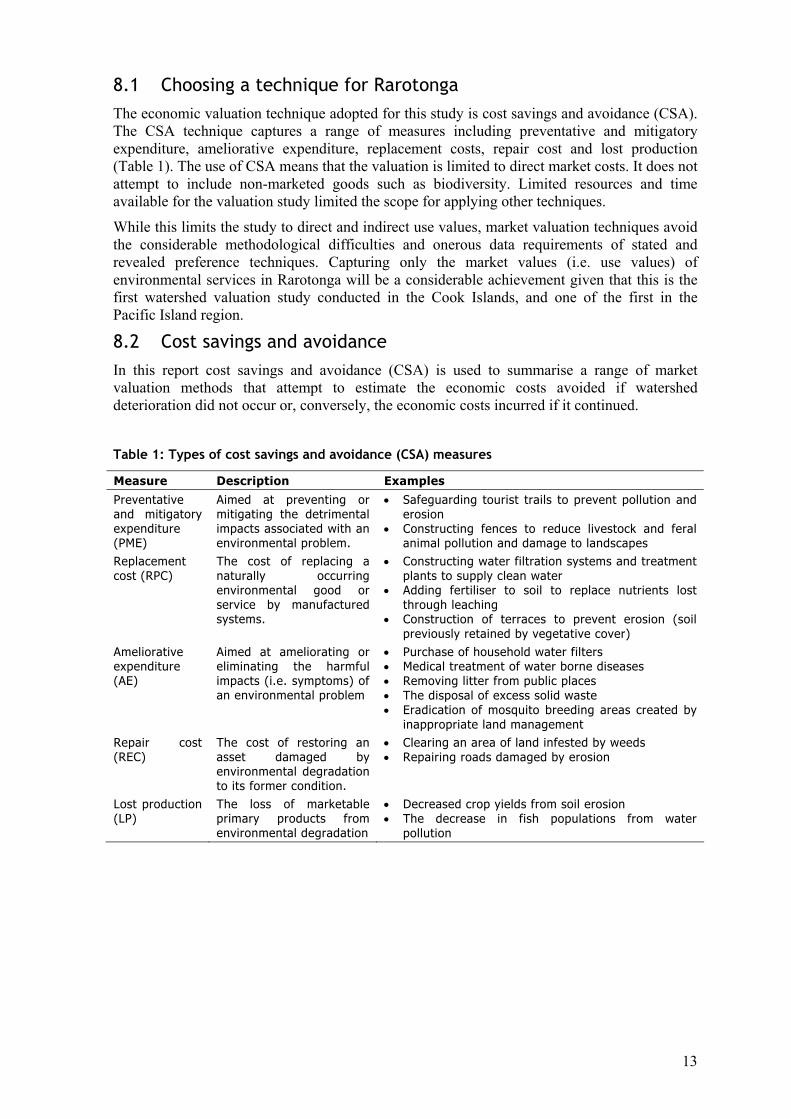
Table 1: Types of cost savings and avoidance (CSA) measures
Measure Description Examples Preventative and mitigatory expenditure (PME)
Aimed at preventing or mitigating the detrimental impacts associated with an environmental problem.
• Safeguarding tourist trails to prevent pollution and erosion
• Constructing fences to reduce livestock and feral animal pollution and damage to landscapes
Replacement cost (RPC)
The cost of replacing a naturally occurring environmental good or service by manufactured systems.
• Constructing water filtration systems and treatment plants to supply clean water
• Adding fertiliser to soil to replace nutrients lost through leaching
• Construction of terraces to prevent erosion (soil previously retained by vegetative cover)
Ameliorative expenditure (AE)
Aimed at ameliorating or eliminating the harmful impacts (i.e. symptoms) of an environmental problem
• Purchase of household water filters • Medical treatment of water borne diseases • Removing litter from public places • The disposal of excess solid waste • Eradication of mosquito breeding areas created by
inappropriate land management Repair cost (REC)
The cost of restoring an asset damaged by environmental degradation to its former condition.
• Clearing an area of land infested by weeds • Repairing roads damaged by erosion
Lost production (LP)
The loss of marketable primary products from environmental degradation
• Decreased crop yields from soil erosion • The decrease in fish populations from water
pollution

14
8.2.1 Preventative and mitigatory expenditure
Measures of preventative and mitigatory expenditure (PME) are based on spending by government, industry and households to prevent or reduce damage caused by environmental problems. Some examples of PME expenditure on Rarotonga would be fencing to limit the movement of feral animals, and the use of silt traps to prevent sediment runoff into the ocean. Conceivably the costs, or some part thereof, of government programs for environmental management could be considered defensive expenditure. These programs fund a set of activities aimed at limiting the impact of environmental problems.
Whether costs of public environmental programs should be used in a valuation study will partly depend on the intended use of the valuation results. If the valuation results are being used to determine future budgetary allocations to environment programs then their inclusion is most likely inappropriate. This would confuse the “benefit” and “cost” categories in evaluating the new expenditure. It would mean that the cost of current programs is being used to determine the cost of future programs. Carefully working through these issues can help reduce the possibility of double counting. In this study the costs of government environmental programs are not included.
8.2.2 Replacement cost
Measures of replacement cost (RPC) involve estimating the cost of the next best alternative to replace the environmental service under question. Consider, for example, a forested catchment in natural condition supplying clean water to an urban population. If the water resources became polluted it might be necessary to construct a water filtration plant. The opportunity cost (i.e. the value of benefits forgone) of damaging the water supply would be the cost of having to construct and operate the water filtration plant. This amount could be considered an economic value of keeping the water unpolluted.
One of the main problems with using replacement cost is that the next best alternative does not always exist, or if it does it is rarely capable of reproducing all of the previous environmental services. For example, a water filtration plant may be able to deliver clean drinking water but is unlikely to make it safe or desirable to swim in a polluted waterbody. Therefore only part of the lost opportunity has been replaced.
8.2.3 Ameliorative expenditure
Environmental pollution is often followed by actions to ameliorate its impact. For example, in the Cook Islands it is estimated that around 60% of households have water filters (Scoping Study, 2004). This is a form of ameliorative expenditure aimed at reducing people’s chances of drinking polluted water and avoiding the consequences of poor water quality. Likewise, the creation of solid waste and littering has resulted in significant clean-up costs for public authorities. In the absence of environmental problems these costs would be avoided.
A challenge with obtaining reliable estimates of ameliorative expenditure is determining the contribution of the environmental problem. For example, water treatment authorities will often need to filter or cleanse water extracted from undisturbed natural systems. This is because harmful bacteria or silt is often present in a waterway in its natural state. It may be unclear to what extent environmental pollution has prompted increased filtration. Generally an increase in contaminants from human activities will create a higher ameliorative cost, but it will be difficult to segregate the natural versus human induced component.
8.2.4 Repair cost
Environmental degradation often results in damage to human infrastructure and other assets, some of which themselves may be natural assets. Examples might be the corrosion of pipes due to poor water quality and damage to buildings and roads from erosion or landslips. In order

15
for this infrastructure to function properly significant repair costs may be required. If the environmental problems were not present these repair costs would be avoided.
8.2.5 Lost production
Primary industries, such as agriculture and fishing, are frequently impacted by land and water degradation. The impact often occurs through lost production. For example, soil erosion and nutrient leaching decreases the natural productivity of the soil. The result will be smaller crop yields, and therefore, smaller profits. The effect may also be offsite. Pollutant runoff into the ocean can damage marine habitat and reduce the size of fish stocks. With smaller harvests the profits of commercial fishers will be lower.
The main challenge in estimating lost production is to determine the relationship between the environmental problem, e.g. soil erosion, and the production loss, e.g. reduced crop yields. Often this relationship depends on complex scientific processes that are poorly understood and/or lack sufficient data to be verified. If the cause-effect relationship can be established then, in simple terms, the economic loss can be calculated by the difference in profits with and without the environmental problem:
Economic cost of lost production
Profit without yield constraint
Profit with yield constraint
equals minus
8.3 Net versus gross values in CSA studies In this study the costs that could potentially be avoided through effective watershed management are estimated. The avoidable costs are gross benefits of watershed management. That is, the costs of investing in activities to secure those benefits continue to accrue are not included in the estimation. This means this study does not determine whether watershed management is an economically efficient investment (i.e. worthwhile from an economic standpoint). However, it gives an indication of the magnitude of potential gross benefits that might accrue if future watershed management strategies are considered.
The extent to which the gross benefits (cost savings) estimated can be recovered is not yet known. It is probable that watershed management activities would only recover some part of the avoidable costs. This is because a “perfect” cleanup of the watershed is unlikely to be feasible. Even the most effective management strategies are likely to leave some pollution.
8.4 Handling time in CSA studies The timing of costs that are avoided in a CSA study is crucial to making an overall estimate of economic value. Consider a series of costs avoided into the future at regular time intervals due to improved watershed management. An example might be avoiding the annual costs of purchasing bottled water because mains supply is perceived as clean. In an economic analysis it would be inappropriate to simply sum these costs to obtain a total. This is because of time-discounting.
Costs that occur into the future are typically valued less than those occurring in the present. This is partly because people would rather receive benefits now than later, all else being equal. A discount rate is used to formalise the rate at which costs and benefits are devalued into the future. For example a payment of $100 that occurs in one year's time has a present value of $90.91 today when discounted at 10% per annum. Equations for discounting cash flows are contained in most introductory books on finance and economic analysis (see for example Campbell and Brown 2003). Functions are also available in spreadsheet packages to help make calculations.
It is worth noting that economists frequently debate appropriate rates and techniques of discounting given concerns about what is fair to current versus future generations (“inter-generational equity”). There are concerns that high discount rate might overlook the concerns

16
of future generations. For a discussion of discounting in light of inter-generational equity concerns see Marini and Scaramozzino (2000), Yang (2003) or Campbell and Brown (2003). The norm for most economic models dealing with public environmental goods is to use discount rates in the vicinity of 3%–10% for public projects, with most using the lower end of this scale.
The lower, best and upper estimates of total cost in this study are based on discount rates of 3%, 5% (best estimate) and 9%. The time period over which all costs are analysed is 20 years from 2005 to 2025. This time period was chosen because many capital items were estimated to have life expectancies of 20 years. All cost estimates are presented as annual values in 2005 NZD over the 20 year time period. Some of the cost items involve upfront purchase of capital items. These are treated as an annuity with a series of constant payments (made at the end of each time interval) over the investment period determined using the aforementioned discount rates.
9 Cost avoidance estimates for Rarotonga In this section the costs that could potentially be avoided through effective watershed management are described. The avoidable costs can be considered the potential gross benefit of watershed management. In other words, they would not occur were the watershed in perfect environmental condition. The cost avoidance estimates attempt to quantify the gap between current environmental conditions and a baseline, which is the watershed in “perfect” condition.
9.1 Health impacts Poor water quality on Rarotonga is believed by experts from the Cook Islands Ministry of Health to have a significant impact on people's health. The waterborne illnesses for which cost avoidance estimates were made in this study include gastroenteritis, diarrhoea in infants, diarrhoea in adults, dengue fever and fish poisoning also known as ciguatera (Table 2). Ciguatera has complex and uncertain causes and is described in more detail in Box 1. The number of reported cases of the illnesses represents only part of the total number of cases. This means the cost estimates given here are likely to be an underestimate as they are based only on reported cases. Table 2: Reported cases of diseases sourced from data held by the Cook Islands public health agency
Diseases Cases reported in 2003 (annual average cases for dengue)
Percentage attributed to watershed problemsb
Diarrhoea (adult/child) 705 20% Diarrhoea (infant) 130 50% Gastroenteritis 328 20% Dengue fevera 374 25% Fish poisoning 249 50%
a. Hospital records for dengue fever cases in the Cook Islands are available for the 10 year period from 1991 to 2003. For each year in this period the dengue fever cases reported were 644, 0, 0, 0, 786, 2, 1098, 0, 0, 0, 20, 2310 and 0. Dengue fever outbreaks are directly related to mosquito outbreaks which happened every few years or so. The figure reported here is an average number of cases over the 10-year period.
b. Based on estimates supplied by health officials and pharmacists.
The illnesses of diarrhoea and gastroenteritis are both classified as gastrointestinal diseases and have similar symptoms and treatments. Health officials advised that severe cases of these conditions may involve a patient arriving at hospital in a coma from dehydration. In these cases the patient is likely to require 1–2 weeks hospitalisation and several weeks of work-free time recovering. Most cases of gastrointestinal illness are not this severe and treatment is less intensive. Fish poisoning is an extremely serious condition with the potential for long lasting

17
damaging impact on the patient. These patients will often require longer stays in hospital. Dengue fever, which is related to mosquito breeding grounds, will also typically require hospitalisation from a period of weeks to months depending on the severity of the case.
Estimates were made of the treatment costs of the different illnesses and the likely time required away from work. Because some Rarotongans affected by illness may not receive salaries for the activities they undertake (e.g. carers) the costs of lost labour productivity were imputed (Table 3). A cost of labour was imputed at NZD 18,000 per annum or NZD 10 per hour being a rough approximate of the median wage based on verbal advice from staff at the Office of Statistics.
Data on the full costs of accommodating a patient in hospital were unavailable. Therefore estimates were based on the amounts charged for tourists which come close to cost recovery. Local charges for hospital stays are heavily subsidised. A tourist is charged NZD 200 per night for a private room and NZD 100 per night for a shared room. This covers the cost of meals and accommodation. It is likely that there exist additional overhead costs such as hospital administration and cleaning. Given these considerations hospital visits were costed at NZD 200 per night. This is likely to be an underestimate due to the many hidden costs of running the hospitals which are not readily available in the accounts.
Table 3: Assumptions on typical hospital stays, staff time and lost labour productivity for patients presenting with waterborne illnesses
Diseases Average time-
off work (days)
Average time in hospital
(days)
Average nurse time (hours)
Average doctor time (hours)
Diarrhea (adult) 5 1 4 2 Diarrhea (infant) 5 1 8 4 Gastroenteritis 5 1 4 2 Fish poisoning 30 10 40 10
Dengue fever 10 15 25 1
A local chemist supplied information on the costs of pharmaceutical treatment for gastrointestinal illnesses with products ranging from NZD 4–21 per treatment. Often more than one product is used in the treatment of gastrointestinal illness. Mannitol can be used to treat fish poisoning and one treatment is estimated in this study at NZD 24, covering the costs intravenous supply of 500 ml. Mannitol costs were obtained from hospital staff at the Ministry of Health. The drug therapies for dengue fever generally involve only pain relief products such as paracetamol. These are a relatively minor component of dengue fever costs being estimated at NZD 20 per patient.
A key area of uncertainty for medical experts consulted in the study was the extent to which the illnesses are caused by poor water quality as opposed to food or naturally occurring phenomena. A pharmacist suggested that around one-fifth of gastro-intestinal illnesses were caused by contact with water, with most cases resulting from food consumption. This opinion roughly concurred with that of doctors who suggested that “probably” the majority of cases were food related. Thus 20% of gastrointestinal illnesses were assumed to result from poor water quality. This was estimated to be higher for infants at 50% because they had not yet developed resistance to the harmful bacteria.
Most healthcare experts believed that land sourced pollutants were a significant cause of fish contamination and poisoning, but were unable to assign a figure. In lieu of recorded data 50% of fish poisoning cases were assumed to result from poor water quality (see Box 1 for further discussion).
Dengue fever is related to watershed management through mosquito breeding. Health officials advised that inappropriate waste dumping leads to stream blockage and water ponding. These

18
sites provide mosquito breeding grounds that increase the frequency and severity of mosquito and dengue fever outbreaks. Due to this problem the Cook Islands public health agency works in collaboration with the environment agency to urge people to dispose of waste properly. Health officials estimated that the number of dengue fever cases was around 25% greater due to problems of waste dumping in the watershed. This figure is used in the costing model as the portion of dengue fever cases attributable to Rarotonga’s watershed management problems.
Based on these assumptions, the results for increased costs imposed from the health impacts of poor water quality are given in Table 4. Although it has the least number of annual cases, fish poisoning still has the highest cost due to the longer and more intensive treatment. Its impact on the patient can potentially be long lasting involving considerable time away from work.
Box 1. Linking Fish Poisoning (Ciguatera) and Watershed Management Links between faecal and other bacterial concentrations in water and gastrointestinal illnesses (gastro enteritis and diarrhoea) are well established. However, there exists scientific uncertainty about the extent to which fish poisoning, also referred to as ciguatera, is a natural phenomenon as opposed to condition caused by land sourced pollutants arising from human activity. Given this uncertainty ciguatera is briefly discussed in this section.
Ciguatera is described by the Cook Islands Ministry of Marine Resources (MMR 2000). Ciguatera is a type of food poisoning that can affect people and animals after consuming fish with high levels of a toxin called ciguatoxin. Fish accumulate this toxin when they graze on plants containing an algae called ciguatera dinoflagellate. Predatory fish can accumulate higher levels of the toxin by eating herbivorous fish. Ciguatera outbreaks are directly related to outbreaks of the dinoflagellate. A person contracting ciguatera will have symptoms of nausea, vomiting, abdominal pain, diarrhoea , headaches and neurological disturbances. In a small portion of cases, around 5%, the symptoms can persist for a number of years (Lewis 2001). Severe cases may involve hypotension, respiratory difficulties and paralysis. Death is possible but uncommon (Lewis 2001).
Public information brochures issued by the Ministry of Marine Resources (MMR 2000) state that a ciguatera outbreak can be caused by:
• reef destruction from natural causes such as cyclones;
• rises in water temperature;
• construction of piers and wharves, or blasting of reef passages;
• sediment runoff from land use practices;
• increased nutrient runoff from septic tanks, sewage and fertilisers; and
• rubbish dumping and other reef-damaging activities.
The last four of these six causes are directly related to watershed and reef management. The Cook Islands Ministry of Health openly and repeatedly warns people not to eat fish from the lagoon, where land sourced bacterial contaminants occur in higher concentrations. The majority of locals living on Rarotonga are aware of the problem and avoid fish from the lagoon. In our survey 66% of locals indicated they would not eat fish from the lagoon, mostly due to concerns about being poisoned. There are fewer concerns expressed about cigautoxic fish in the nearshore regions of the Cook Islands’ smaller, less populated islands.
Research into the relationship between land management and dinoflagellates, which carry the toxins, has shown a relationship with nutrient runoff. Carlson (1984) found significant correlations between nearshore benthic dinoflagellates and rainfall (see Lehane and Lewis 2000). Factors contributing to this relationship include nutrient runoff and elevated bacterial counts. Both these forms of water pollution are present in Rarotonga.
Although the scientific link between land sourced pollutants (nutrients and bacteria) and fish poisoning is not yet proven (Lewis 2001) there is strong anecdotal evidence. Many of the “official” causes of cigautoxic fish are associated with land sourced pollutants. In this study it is assumed that microbial pollution in the watershed is partially responsible for the incidence of ciguatera. We assume that half of the incidence of ciguatera is assumed to be caused by poor watershed management. This was seen as an underestimate by some local people who considered watershed pollution to be entirely responsible.
19
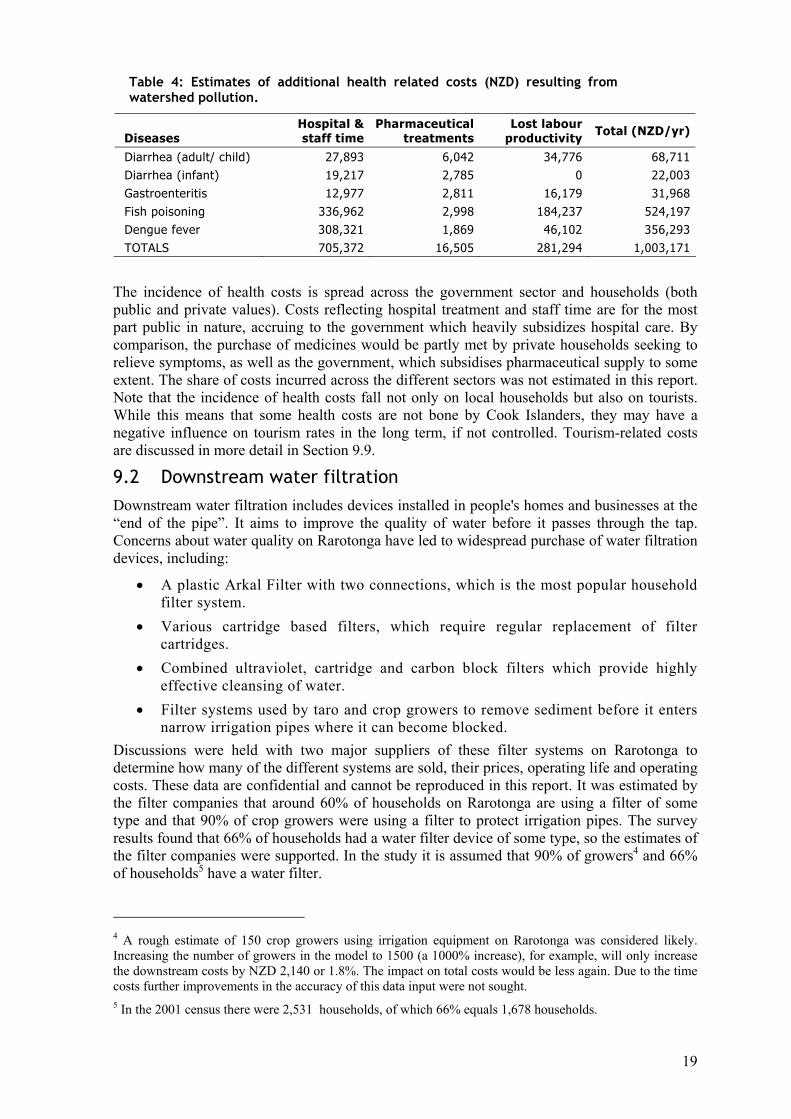
Table 4: Estimates of additional health related costs (NZD) resulting from watershed pollution.
Diseases Hospital & staff time
Pharmaceutical treatments
Lost labour productivity Total (NZD/yr)
Diarrhea (adult/ child) 27,893 6,042 34,776 68,711 Diarrhea (infant) 19,217 2,785 0 22,003 Gastroenteritis 12,977 2,811 16,179 31,968 Fish poisoning 336,962 2,998 184,237 524,197 Dengue fever 308,321 1,869 46,102 356,293 TOTALS 705,372 16,505 281,294 1,003,171
The incidence of health costs is spread across the government sector and households (both public and private values). Costs reflecting hospital treatment and staff time are for the most part public in nature, accruing to the government which heavily subsidizes hospital care. By comparison, the purchase of medicines would be partly met by private households seeking to relieve symptoms, as well as the government, which subsidises pharmaceutical supply to some extent. The share of costs incurred across the different sectors was not estimated in this report. Note that the incidence of health costs fall not only on local households but also on tourists. While this means that some health costs are not bone by Cook Islanders, they may have a negative influence on tourism rates in the long term, if not controlled. Tourism-related costs are discussed in more detail in Section 9.9.
9.2 Downstream water filtration Downstream water filtration includes devices installed in people's homes and businesses at the “end of the pipe”. It aims to improve the quality of water before it passes through the tap. Concerns about water quality on Rarotonga have led to widespread purchase of water filtration devices, including:
• A plastic Arkal Filter with two connections, which is the most popular household filter system.
• Various cartridge based filters, which require regular replacement of filter cartridges.
• Combined ultraviolet, cartridge and carbon block filters which provide highly effective cleansing of water.
• Filter systems used by taro and crop growers to remove sediment before it enters narrow irrigation pipes where it can become blocked.
Discussions were held with two major suppliers of these filter systems on Rarotonga to determine how many of the different systems are sold, their prices, operating life and operating costs. These data are confidential and cannot be reproduced in this report. It was estimated by the filter companies that around 60% of households on Rarotonga are using a filter of some type and that 90% of crop growers were using a filter to protect irrigation pipes. The survey results found that 66% of households had a water filter device of some type, so the estimates of the filter companies were supported. In the study it is assumed that 90% of growers4 and 66% of households5 have a water filter.
4 A rough estimate of 150 crop growers using irrigation equipment on Rarotonga was considered likely. Increasing the number of growers in the model to 1500 (a 1000% increase), for example, will only increase the downstream costs by NZD 2,140 or 1.8%. The impact on total costs would be less again. Due to the time costs further improvements in the accuracy of this data input were not sought. 5 In the 2001 census there were 2,531 households, of which 66% equals 1,678 households.

20
Data is not available on the portion of filters purchased because of watershed sediment, nutrient and bacterial pollution. In this study is estimated that 70% of filters are purchased because of Rarotonga’s water quality problems. This is a conservative estimate (the actual figure is likely to be higher) as 96% of survey respondents with a filter gave a reason that was related to water quality concerns. Based on these assumptions and the confidential data the total annual cost of filters is estimated at NZD 115,933. These costs are almost exclusively met by households.
This amount does not include the substantial costs of water filters being purchased by hotels and businesses. Data were unavailable to make estimates of what types of filters and how many have been installed. These filters are usually more expensive, but provide better cleansing of water and can handle a greater volume of throughput. If they were included the above estimate would rise substantially.
9.3 Rainwater tanks Based on the 2001 census (Statistics Office 2001; section 2.6.5) 8.1% of privately occupied dwellings (or 103 dwellings) on Rarotonga have their own rainwater tank. Discussions with locals suggest that these tanks are purchased both because of concerns about water quality and availability. Local water infrastructure suppliers advised that a 2,000 litre rainwater tank will sell for around NZD 800 and a 5-6000 litre rainwater tank for NZD 1,600. Over a 20 year period with no residual value6 and at a discount rate of 5% this results in annualised costs of NZD 64 and NZD 128. Assuming that there is an even split between the smaller and large tanks and that 50% of purchases are based on water quality problems this produces a total annual cost of NZD 9,870. As such, rainwater tanks are a relatively minor category of defensive expenditure.
9.4 Upstream water filtration The Rarotongan water supply comes from 12 stream water intakes, 8 of which have coarse gravel filters (Figs. 6 and 7).
Coarse-filtered water, to consumer.
Stream water
Coarse aggregate
Fine aggregate
Coarse-filtered water, to consumer.
Stream water
Coarse aggregate
Fine aggregate
Figure 6: Gravel filter system currently used for most stream water intakes
The gravel filters can remove sticks, leaves and large objects from the water but will not filter out bacteria. To prevent faecal and total coliform entering the water an industrial 5 micron filter is required. There are plans to install these filters in all stream intakes across Rarotonga. Ministry of Works staff advised there are no requirements for further stream intakes to be constructed, and that water supply can be ensured through improved management and storage.
Holding tanks are required to remove fine sediment from the water at each of the intakes. There are few such tanks in Rarotonga, with the main one in the Takuvaine region. There are
6 If the tanks do have a residual value at the end of this period the estimated annual cost will be lower. After a 20 year period a low or zero residual value could reasonably be expected.

21
plans to install these tanks in all water intakes to remove sediments from soil erosion. A major cause of soil erosion is urban, industrial and agricultural development within the higher parts of the watershed.
Figure 7: Locations of main water supply intakes (▲) in Rarotonga.
Data source: Ministry of Works.
There are two main types of defensive expenditures related to Rarotongas public stream water filtering', which are partly the result of poor watershed conditions. These expenditures are:
• The construction and installation of fine (5-micron) industrial water filters for all stream water intakes.
• Capital and operating costs of water tanks to remove sediment at all stream water intakes.
Some part of these expenditures would still occur even with effective watershed management. However, managers in the public works department suggested that most of the infrastructure upgrades are necessary due to watershed pollution. The new infrastructure is required to eliminate faecal and total coliform, and in the absence of these watershed pollution problems would probably not be installed. The estimates supplied by the Ministry of Works for water filtration system costs include:
• A capital cost of installing a 5 micron filter at a stream intake of NZD 46,627 with a lifespan of at least 20 years.
• A capital cost of NZD 219,969 for a settling tank, with 3 tanks required per filtration system. Two tanks are used for sediment settling and one tank for freshwater storage.
• A total of 16 filtration systems to remove total and faecal coliform from

22
Rarotonga’s water supply. • Around 10 hours labour time per week at an hourly rate of NZD 9.24 to maintain
the filtration system over the period of one year. Plus 5% of the labour costs for fuel, transport and equipment.
Given these input data the total annualised capital costs of the filtration system are estimated at NZD 907,107 and the annual maintenance costs at NZD 5,045. Eighty per cent of the total cost of the filtration system has been considered as being required because of watershed pollution problems, primarily total and faecal coliform. Thus, the annualised cost attributable to watershed pollution is NZD 729,721.
9.5 Water pipe upgrades Rarotonga's water system has intermittently low water pressure. When this occurs, water in the surrounding soil seeps into the system's pipes. If the water entering the pipes from the soil contains nonpoint source pollutants (e.g. herbicides, fertilisers, pesticides and sewage) these contaminants then mix with and contaminate the already-treated fresh water in the pipes. There are plans to upgrade all the water pipes in Rarotonga to prevent contamination of the water supply in this way.
Limiting the seepage of contaminants represents only part of the motivation for upgrading the water pipes. Other benefits include decreased leakage and improved pressure. In this study it is assumed that 20% of upgrades will occur due to soil water contamination issues, which ultimately result from non-point source pollutants entering the watershed. This estimate was supplied by the Ministry of Works managerial staff. Other estimates supplied by the staff include:
• A total of 100 km of water pipe require upgrading to prevent leaks. • The capital, once-off, cost of the upgrade is NZD 65,000 per km. Minimal
maintenance is required when the pipes are in place. The pipes will have a residual value of zero at the end of the 20 year planning period used in this study, however they have an operating lifespan of 50 years.
These estimates create an annualised cost over the next 20 years of NZD 521,577 in total. The amount attributable to water pollution, assumed at 20% of the total cost, is NZD 104,315.
9.6 Bottled water Increased rates of bottled water purchase due to watershed pollution were considered a form of defensive expenditure in this study. A survey (Appendix E) was conducted to assess the buying habitats of locals and tourists. The survey was conducted face-to-face by trained researchers in markets and other public places. With respect to bottled water the survey asked whether the respondent consumed bottled water, how much they consumed and why. The survey revealed that:
• On average a resident of Rarotonga consumes 1.39 litres of bottled water per day and a tourist 0.03 litres per day7.
• Of people stating they did drink bottled water 75% indicated it was because they felt the tap water was unsafe or not clean. The remainder either did not give a reason or cited other reasons, e.g. convenience.
7 It was surprising to see such low rates of consumption among tourists, as these were anticipated to be higher than residents. Further discussions with tourists revealed that many believed the tap water to be fine because it “looked good”. Tourists had much less familiarity with local water quality than residents. Also many were consuming bottled or filtered water at hotels and restaurants, but may not have been aware of this.

23
Determining the brands, exact sizes and prices of bottled water purchased by survey respondents was not considered feasible. These questions would have been too difficult to answer. Suppliers of bottled water on Rarotonga typically sell water containers of 500 ml, 600 ml, 750 ml, 1.5 litres, 3 litres, 11 litres, 15 litres and 20 litres. Sales data (prices and volume) were obtained on a confidential basis from one of the major suppliers over a period of one month. Most water is purchased in the larger containers for household usage. The sales data were used to calculate a weighted average price of water of NZD 0.62 per litre, taking into account the prices and volumes of major products retailed. This is the average price used for water purchased on Rarotonga.
The amount of water consumption induced by perceived watershed water quality problems was assumed at 50% of total consumption. The actual amount is likely to be higher given people's reasons for consumption as stated in the survey. Given that Rarotonga has a resident population of 9,451 and a tourist population of 2,737 (Statistics Office 2001) this results in annual bottled water purchases of NZD 1,500,343 induced by perceived watershed pollution. This makes domestic bottled water purchases a major category of defensive expenditure by Rarotongan residents and visitors.
9.7 Mosquito control A recent report on priority environmental concerns (Island Friends 2004) identifies the increase in mosquito breeding sites from poor watershed management as a major problem in Rarotonga and in other islands. The situation has arisen from increased debris and litter in streams and watercourses. The debris causes streams to become blocked and form dams where water can become stagnant and provide a habitat for mosquito breeding. It is believed this problem significantly increases mosquito populations leading to higher risks of dengue fever outbreak in addition to discomfort to people through mosquito bites.
Officials from the Ministry of Health responsible for controlling mosquito populations on Rarotonga were interviewed to determine the nature and magnitude of potentially avoidable costs through better watershed management. It was advised that cases of dengue fever are typically reported once every four years. When this occurs the Ministry of Health orders the delivery of Reslin, a chemical designed to kill mosquitos. Reslin is mixed with water and sprayed into bushland believed to be infested. Staff responsible for mosquito control advised that:
• Reslin costs NZD 99 per litre and around 0.75 litres are required to spray one site. The reslin is diluted in a larger quantity of water.
• A typical reslin treatment in Rarotonga involves spraying around six sites, three times each over a period of three weeks.
• Around 11 staff are required for a period of four hours to spray one site. Two staff drive a pilot vehicle to clear the area of people. The pilot is followed by three trucks, each with a driver and two sprayers.
For the staff involved a cost of labour at NZD 10 per hour is assumed for semi-skilled work. This creates costs of NZD 514 per site. For 3 doses to all 6 sites the cost is NZD 9,257 for a typical treatment of Rarotonga. If this cycle is repeated once every four years then the costs of spraying over a 20 year period have a present value of NZD 30,983. This contrasts to a present value of costs of NZD 18,821 were the procedure repeated every 8 years (half as often), due to improved watershed management. The difference in the present value of costs is NZD 12,162 or roughly NZD 929 per year if treated as an annuity.
Primarily because mosquito spraying is a relatively cheap exercise, in terms of staff time and material costs, the size of the cost avoided through improved watershed management under this category is negligible. However, the cost impact felt through dengue fever caused by high mosquito populations is significant.

24
9.8 Loss of lagoon fish stocks When surveyed 71% of Rarotongan residents stated they would not eat fish from the lagoon because of concerns about fish poisoning (ciguatera). The remainder either did not know about the problem, or did not consume fish. The Cook Islands’ public health agency routinely warns people not to consume fish from the lagoon due to the possibility of fish poisoning. The health costs of fish poisoning are estimated in section 8.1.
A causal link between land-sourced pollutants and fish poisoning has not been proven. However, in this study it assumed that land based pollutants are partially responsible for fish poisoning (see Section 6.1 and Box 1). The possibility of fish poisoning renders a significant marine resource (i.e. lagoon fish stocks), unusable and can be considered asset damage/loss partially resulting from watershed pollution. In this section an estimate is made of the value of lost fish stocks based on current market prices and the annual harvest that would otherwise be possible.
Estimates of the quantity of cigautoxic fish species (i.e. those lagoon fish capable of carrying poisonous cigautoxins), consumed per capita in 1989 and 2001 are provided in a study of Rarotonga by Tuatai (2001). The results are provided in Table 5.
Many of the lagoon fish are, or were, caught by locals from the lagoon on a subsistence basis. However, they can also be purchased at market. The data show a large decline in the total consumption of lagoon fish, with the amount consumed in 2001 being less than half that
consumed in 1989. It is assumed here that a primary reason for the drop in consumption has been increased awareness of fish poisoning8. In this study it is assumed the decrease in annual consumption of potentially cigautoxic fish from 1989 to 2001 can be attributed to fish poisoning. It was over this time period that people became aware of the problem and health authorities began issuing warnings. It is assumed that 50% of fish poisoning results from land-sourced contaminants associated with poor watershed management, the same portion used in the health cost category (see Box 1).
Aggregating these data to the Rarotonga's combined resident and visitor population of 12,188 persons, total consumption of lagoon fish in 1989 and 2001 is 228,659 and 91,642 kilograms per year. This implies a decrease in lagoon fish consumption of 137,017 kilograms per year for Rarotonga. Given the assumption that 50% of decrease in lagoon fish consumption is due to land sourced contaminants, this creates a watershed pollution-induced loss of 68,509 kilograms per year. Most lagoon fish is sold in Rarotonga at a flat rate of around NZD 7.80 per kilogram9, with minor variations for different fish species. The gross value (price times quantity) of the fish stock lost from watershed pollution is therefore estimated at NZD 534,368 per year.
8 Note, however, that declines in Rarotonga's lagoon fish stocks, and associated reduced catches, may also have affected lagoon fish consumption. 9 On advice from staff from the Ministry of Marine Resources.
Table 5: Consumption of potentially cigautoxic lagoon fish in Rarotonga in 1989 and 2001, in grams per person per day
Potentially Cigautoxic Finfish 1989 2001
Surgeonfish 17.8 6.4 Trevally 10.3 5.1 Goatfish 2.1 3.9 Emperor 2.1 2.6 Snapper 0 2.6 Moray eel 10.3 0 Mullet 0.6 0 Grouper 8.2 0 TOTAL 51.4 20.6
Source: Tuatai 2001.

25
The impact of this loss was highlighted through conversations with local persons, who suggested that for some residents the increased costs of purchasing food was a major factor in their consideration to live abroad (in New Zealand or elsewhere). Lagoon fish formed an important part of people's protein intake, partly because they were freely available just offshore. This important food source has at least partly been removed by ciguatera.
9.9 Lost tourism income Cook Islands Government statistics derived from customs data show that 66,883 persons arrived in 2003 with the purpose of having a vacation, out of a total of 78,328 arrivals. In the same year the average length of visitor stays of all nationalities was 11 days. The most recent survey on tourist expenditure was conducted over a decade ago (TCSP 1991). This found average tourist expenditure at NZD 902 per visit, or NZD 97 per day in 1991 New Zealand dollars. Adjusting for inflation10 to the year 2005 this gives values of NZD 1,714 and NZD 184, respectively.
Discussions with staff from the Cook Islands Tourism Corporation (CITC) revealed that these are probably low estimates given the changing nature of tourism since 1991. Today there are more 4-5 star hotels and “high-end” dining and accommodation options. There is also a wider range of leisure activities and tours available to the tourist. Given that mid-range hotels are in the vicinity of NZD 150-200 per room per night, actual tourist expenditure is likely to be higher. Rates of expenditure per tourist visit used in this study are likely to be underestimates.
Given these estimates annual tourism expenditure in the Cook Islands is around NZD 115 million, or 48% of gross domestic product in 2003. This makes tourism the mainstay of the Cook Islands economy. National income will be sensitive to changes in visitor arrivals. A 1% drop in tourist numbers will result in lost income of around NZD 1.5 million. The significance of tourism to the national economy means that it could potentially be the most important economic impact of watershed pollution. If deteriorating stream and lagoon water quality deter even a small fraction of the nation’s tourists there will be a large economic cost through lost income.
The challenge in quantifying the lost income from watershed pollution through tourism is estimating what portion of tourists may not visit the Cook Islands due to water and environmental problems. Given the complex and interrelated bundle of goods a tourist seeks from a Cook Islands holiday, teasing out the “environmental” component is extremely difficult. The tourism agency markets the Cook Islands as a pristine tropical island paradise. The “green” or environmental component is an important part of the typical tourist package but not the only part. Other interests include romantic escapes, weddings, fine dining, local culture, comfortable hotels, the chance to meet new people and activities (e.g. golf, fishing).
The most recent survey of tourist activities and motivations for visiting the Cook Islands was conducted around 14 years ago in 1991 (TCSP 1991). This survey did not include questions specifically about the “environmental” component of people’s visits. It is also outdated due to environmental change and tourists changing preferences. The CITC is planning another survey in the near future, and this report recommends that the importance of a “pristine environment to tourists be further explored.
While there clearly exists a mix of motivations, tourism officials suggested that perceptions of a pristine natural environment were a very important component. Were it to become unpleasant to swim in the Lagoon or the snorkelling became undesirable due to poor visibility tourist aspirations of a pristine environment would be unfulfilled. Tourism experts advised that when
10 The Cook Islands Government statistics office has cost price index (CPI) data for the March quarter of 1999 up until the September quarter of 2004. Values for 1991 until 2005 were extrapolated using a linear regression model with R2 of 0.92.

26
tourist aspirations are not fulfilled there is a likelihood they will not return and advise friends and relatives accordingly.
Two options were considered in this study to determine the relative importance of alternative motivations for a tourist visit to the Cook Islands: (a) a survey; and (b) content analysis of brochures used by travel agents worldwide. The tourist survey was not undertaken for two reasons. Firstly, a meaningful assessment of tourist motivations for visiting the Cook Islands requires a carefully designed survey of different demographics undertaken at different time periods to avoid seasonal irregularities. To do this survey properly lay beyond the time and budgetary capacity of the study. The CITC are planning to undertake such a study in the near future. Secondly, Rarotonga was impacted by four large cyclones — Mena, Nancy, Olaf and Percy — during February–March 2005, while this study was being conducted. Many tourists were attempting to leave as soon as possible and many others had cancelled trips. The cyclones and subsequent damage were likely to dominate tourist concerns and would have been likely to influence survey responses.
Accordingly, the option selected was content analysis of brochures. Advertising imagery analysis is commonly used in the social sciences to assess people's preferences or perceptions. For example, it was used in an environmental context by Kroma and Flora (2003) to assess people's changing perceptions towards pesticide use through imagery content analysis of United States farm magazines.
Content analysis was conducted of 233 images in a commonly used tourism brochure called “The Cooks Book: Your Recipe for True Paradise”. Only those images of a general nature designed to attract tourists to the Cook Islands were included, and the section of the brochure containing hotel rooms was excluded. These images were biased towards a particular product in the Cook Islands, not the whole package. Each image was independently assessed by both report authors for content. Points were assigned under the following categories with a total score of 100 for each image:
• Beaches and lagoon. This included depictions of pristine sandy beaches and clear lagoon water.
• Tropical vegetation and landscapes. This category included depictions of palm trees, mountains and lush tropical inland landscapes including waterfalls and streams.
• Corals, snorkelling and diving. This covered all images of corals, tropical fish and people snorkelling or diving.
• Local culture and people. Many of the images depicted local cultural attractions, e.g. dancing, and local people. Experiencing the local culture is a significant motivations for many tourists.
• Leisure activities and amenities. This included photos of comfortable hotel rooms, fine dining and activities (e.g. golf, fishing). The prospect of a comfortable and luxurious stay is important to many tourists.
• Weddings and romance. A significant form of tourism in the Cook Islands falls under the category of romantic escapes and weddings. It is common for persons from other countries to be married in the Cook Islands, inviting sometimes large numbers of guests to the wedding and reception.
• Other images. This included a range of images not fitting into any of the above categories.
Most images combined more than one of the above categories. In these cases points were distributed across categories based on the researcher's judgement. The results from the two

27
researchers11 are shown in Fig. 8. If categories A, B and C are considered to be primarily related to a “pristine natural environment”, then researchers one and two placed 41% and 45% of images into this category. This suggests that the notion of a pristine natural environment - comprising clear water, clean beaches, lush tropical vegetation and wildlife – is central to the Cook Islands marketing package. Staff from the tourism agency supported this finding indicating that expectations of most tourists were for a high quality environment. If those expectations are not met tourists will start to choose alternative destinations over time. It is possible this is already occurring, although it is difficult to quantify.
17.5%
12.7%
11.1%
21.4%
20.9%
11.8%
4.5%
17.2%
14.3%
13.8%
24.0%
24.8%
5.0%
0.9%
0% 5% 10% 15% 20% 25% 30%
Beaches and lagoon
Tropical vegetationand landscapes
Coral reefs,snorkelling, diving
Local culture andpeople
Leisure activities
Weddings andromance
Other
Portion of images classified into category
Researcher OneResearcher Two
Figure 8: Classification of 233 images used in tourist brochure.
Another source of information used to estimate the number of tourist visits lost to other locations from watershed pollution was the impact of the Takitumu Irritant Syndrome (see Box 2). This was widely publicised and hoteliers consulted in this study indicated news reached travel agent offices in New Zealand, Australia and the United States. Whether it deterred a significant number of tourists from vacationing in the Cook Islands is unknown. Most hoteliers believe it had an impact and that a repeat occurrence, considered a likelihood within the next 10 years by health officials, would lead to further tourist cancellations.
The number of tourists travelling elsewhere and/or avoiding the Cook Islands due to watershed problems is difficult to estimate. It is unlikely that even a lengthy and detailed study focusing specifically on this issue would provide a definitive answer, although it may help improve the estimate. In this study it is assumed that 3% of tourists, with a lower and upper bound of 1% and 10%, are lost to Rarotonga due to watershed pollution. These were consistent with estimates given by hoteliers and tourism officials interviewed in the study. They also support insights on the importance of the natural environment to Cook Islands tourism marketing.
With estimates of lost tourist arrivals and tourist expenditure lost income can also be estimated. The best estimate of tourism expenditure loss is NZD 3,440,000 with a lower and upper bound of NZD 1,147,000 and NZD 11,467,000 per year. This makes lost tourism income the most significant cost category. These losses are felt most by the private sector (industry) although, if
11 The two researchers conducting the content analysis were Stefan Hajkowicz and Petero Okotari, authors of this report and consultants working on the valuation study.

28
sustained in the medium term, they would ultimately be expected to impact household incomes as job availability in the tourism and related sectors falls.
Further research is required to more deeply test the relationship between tourist visitation and environmental conditions. The analysis of images in brochures, interviews with hoteliers and a review of the irritant syndrome conducted in this study permit an informed estimate. However, they do not provide a conclusive result. More research is needed.
9.10 Non-financial impacts In addition to the financial costs estimated above there exist some important non-financial impacts of water pollution. These hold significant, possibly greater, value to people. In Rarotonga they include:
• Potential loss or harm to biodiversity. • Loss of recreational or cultural sites. • Damage to scenic beauty. • Non-financial human health impacts. • Although not valued in monetary terms, these impacts should be given
consideration alongside the financial costs identified in this report.
Box 2. Takitumu Irritant Syndrome
In November of 2003 the district of Takitumu was struck by an outbreak of an air-borne irritant syndrome that and lasted through to June 2004. Typical symptoms of the irritant were itchiness or rash on the skin, running or bleeding nose, watery/stinging eyes and respiratory difficulties. The syndrome affected over thirty percent of the island’s costal area (all of the southern side) with over 700 reported cases during the outbreak. Health warnings were issued by the Ministry of Health (see Appendix F).
After much conjecture and various air, soil and water tests, it is believed that the cause of the outbreak was a toxic algae bloom in which the algae became aerosolized and was blown inland off the sea.
The algae suspected as responsible for the Irritant Syndrome is known as Lyngbya majuscule1. This form of algae occurs naturally on Rarotonga but is not always toxic. It is believed that the algae will become toxic when the algae is particularly stressed, which can be caused by an increase in temperature and/or an over population of algae. The algae blooms in the Takitumu lagoon area have been attributed to high nutrient levels within the lagoon which are believed to be caused by the sewerage runoff from pig farms in the area, and mismanaged sewerage waste by some tourist accommodators.
Thus it is regarded that a specific combination of climate (temperature, rainfall) and algae population which causes algae to become toxic and become a threat to the health of those in the vicinity. This outbreak is the first of its kind on Rarotonga, but similar outbreaks have been recorded in Northern Queensland in Australia and in Maui, Hawaii. It is believed that the potential lies for this problem to reoccur anytime within the next ten years if conditions are suitable, and thus may become a recurring problem on Rarotonga.
The major economic cost that could be incurred would be the possible losses in tourism if the problem reoccurred. Any major cause for a drop off in tourism numbers, such as bad publicity about Rarotonga water quality in the global travel market, would result in significant economic losses for the country.
Watershed management measures such as appropriate treatment of liquid waste and enforced guidelines for sewerage treatment will help to mitigate the reoccurrence of this outbreak and the economic costs that the country could incur from another outbreak.

29
10 Summary and conclusion
This study estimates the potentially avoidable costs of watershed pollution to Rarotonga at NZD 7,439,000, with a lower bound of NZD 3,157,000 and an upper bound of NZD 17,682,000. The best estimate of costs per household is NZD 2,900 per year. These are significant costs that consume around 3.12% of gross domestic product for the Cook Islands as a whole. The portion of Rarotonga’s gross domestic product would be slightly higher.
The most significant cost impacts are through lost tourism income, bottled water purchases and healthcare costs from illnesses related to water quality. Together these account for 77% of all costs. The loss of lagoon fish stocks from fish poisoning is also significant at 7% of the total cost. The breakdown of relative costs is shown in Fig. 9.
Figure 9 Portion of total costs by category (The “other” category includes: downstream household water filters; water pipe upgrades; household rainwater tanks; and mosquito control)
Of all the input data, the total cost estimate is most sensitive to the portion of tourists not visiting Rarotonga due to concerns about water quality. This is assumed at 3% for the best estimate. The assumption is based on an assessment of the way the Cook Islands are marketed to tourists, which heavily focuses on notions of a pristine environment, and estimates by hotel operators and tourism agency staff. Consideration was also given to the impact of the Titikaveka irritant syndrome on tourists.
While a detailed sectoral breakdown of the cost impacts was not undertaken, it can be seen that a significant portion of the costs are borne by households, tourism operators and government water infrastructure agencies. Rarotongan households are exposed through bottled water purchases, water related illnesses, the loss of lagoon fish resources and the need for defensive expenditure on water filters. Tourism operators, in particular hotel owners, are potentially incurring significant income losses through decreased visitor arrivals. It is worth noting that
Bottled water20%
Other3%
Lost tourism income
47%
Loss of fish stocks in lagoon
7%
Upstream public water
filters 10%
Healthcare and illness
costs13%

30
not all industry sectors will be equally, or even adversely, affected by water pollution. For example some industries supply goods and services designed to mitigate the negative impacts of water pollution. While these industries may “benefit” from increased demand for these goods, this expenditure still represents a cost to the economy as a whole. This is because defensive and mitigatory expenditure on items such as water filters, bottled water and water pipes represents a lost opportunity to the Rarotongan economy. The money could have been invested elsewhere. Nevertheless, government should give consideration to sectoral interests when addressing problems of water pollution. Not all sectors will be impacted in the same way.
The valuation method used in this study was cost savings and avoidance (CSA). This approach estimates the costs incurred by households, industry and government that could potentially be avoided in the absence of an environmental problem. The avoidable costs can be considered a gross benefit. The approach gives consideration to direct market impacts only.
This study suggests that watershed pollution places a significant burden on Rarotonga's economy. It displaces a large amount of investment that could be employed elsewhere. The portion of the total cost that would be recoverable with sound watershed management practices is unknown. This will depend on the effectiveness of those actions in reducing physical problems of water quality.
There are numerous non-market impacts of watershed pollution that have not been costed in this report. These would include the potential damage to biodiversity, the loss of recreational opportunities, the loss of scenic beauty, damage to cultural sites and the non financial costs of water quality related illnesses. These are important impacts of watershed pollution in Rarotonga and should be given consideration alongside the market impacts covered in this report.
31
References Abdalla C.W., Roach B.A. and Epp, D. 1992. Valuing environmental quality changes using
averting expenditures: An application to groundwater contamination. Land Economics 68(2), 163–169.
Adamowicz, W.L. 2004. What’s it worth? An examination of historical trends and future directions in environmental valuation, The Australian Journal of Agricultural and Resource Economics 48, 419–444.
Anderson, J., Maru, P., Solomona, D., Tuatai, T. and Turua, T. 2004. Water quality programme Rarotonga and Aitutaki Lagoons, Miscellaneous Report 04/01, Ministry of Marine Resources, Government of the Cook Islands, Rarotonga.
Barton, D.N. 2002. The transferability of benefit transfer: contingent valuation of water quality improvements in Costa Rica. Ecological Economics 42, 147–164.
Bastian, C., McLeod, D.M., Matthew, J., Germino, W.A., Reiners, B.J. and Benedict, J.B. 2002. Environmental amenities and agricultural land values: a hedonic model using geographic information systems data. Ecological Economics 40, 337–349 .
Campbell, H. and Brown, R. 2003. Benefit cost analysis: Financial and economic appraisal using spreadsheets. Cambridge University Press.
Cantrell, R.N., Garcia, M., Leung, P. and Ziemann, D. 2004. Recreational anglers” willingness to pay for increased catch rates of Pacific threadfin (Polydactylus sexfilis) in Hawaii. Fisheries Research 68, 149–158.
Carson, R.T., Mitchell, R.C., Hanemann, M., Kopp, R.J., Presser, S. and Ruud, P.A. 2003. Contingent valuation and lost passive use: Damages from the Exxon Valdez Oil spill. Environmental and Resource Economics 25: 257–286.
Chen, W., Hong, H., Liu, Y., Zhang, L., Hou, X. and Raymond, M. 2004. Recreation demand and economic value: An application of travel cost method for Xiamen Island, China Economic Review 15(4) 398–406.
Island Friends. 2004. Priority environmental problems (PEC). Prepared for the International Waters Project: Cook Islands Report. Island Friends Ltd, Cook Islands.
Kroma, M.M. Flora, C.B. 2003. Greening pesticides: A historical analysis of the social construction of farm chemical advertisements. Agriculture and Human Values 20, 21–35.
Lal, P. 1990. Conservation or conversion of mangroves in Fiji—an ecological economic analysis. Environment and Policy Institute, East West Centre, Honolulu.
Lal, P. and Takau L. 2006. Economic costs of waste in Tonga. IWP-Pacific Technical Report no. 33. Aia, Samoa: Secretariat of the Pacific Regional Environment Programme.
Lehane, L. and Lewis, R.J. 2000. Ciguatera: recent advances but the risk remains. International Journal of Food Microbiology 61, 91–125
Lewis, R.J. 2001. The changing face of ciguatera. Toxicon 39, 97–106.
Marini, G. and Scaramozzino, P. 2000. Social time preference. Journal of Population Economics. 13. 639–645.
MMR. 2000. Ciguatera in the Cook Islands. Ministry of Marine Resources. Avarua, Rarotonga, Cook Islands.
Okotai, P. 2005. Scoping study for the Rarotongan watershed area. Voyager Group Consultancy, Rarotonga.
32
Ostro, B. and Chestnut, L. (1998). Assessing the health benefits of reducing particulate matter air pollution in the United States”. Environmental Research, 76, 94–106.
Pires, M. 2004. Watershed protection for a world city: the case of New York Land Use Policy 21, 161–175.
Rietbergen-McCracken, J. and Abaza, H. Eds. 2000. Environmental valuation: a worldwide compendium of case studies. London: Earthscan.
Sengupta, S. and Osgood, D.E. 2003. The value of remoteness: a hedonic estimation of ranchette prices. Ecological Economics 44, 91–103.
SPC. 2004. Pacific Islands Population 2004. Noumea, New Caledonia: Secretariat of the Pacific Community.
Spurgeon, J. 1998. The socio-economic costs and benefits of coastal habitat rehabilitation and creation. Marine Pollution Bulletin 37, 373–382.
Statistics Office. 2003. 2001 Cook Islands census of population and dwellings — main report. Rarotonga, Cook Islands: Statistics Office, Ministry of Finance and Economic Management. http://www.stats.gov.ck/Census%202001/Census%20Report%202001.pdf; retrieved 31 August 2006.
TCSP. 1991. Cook Islands Visitor Survey. Survey Report No. 13. Tourism Council of the South Pacific. Suva, Fiji.
Tol, R.S.J. The damage costs of climate change towards a dynamic representation. Ecological Economics 19, 67–90.
Tuatai, T. 2001. Seafood consumption survey for Rarotonga, Cook Islands. MS311 Directed Study Unit. University of the South Pacific.
UNDP. 1999. Pacific human development report 1999. United Nations Development Program. Suva, Fiji.
US EPA. 2005. E. coli 0157:H7 in drinking water -- US EPA. United States Environmental Protection Agency website www.epa.gov, Washington.
Van Bueren, M. and Bennett, J. 2004. Towards the development of a transferable set of value estimates for environmental attributes. The Australian Journal of Agricultural and Resource Economics 48(1) 1-32.
Yang, Z. 2003. Dual-rate discounting in dynamic economic–environmental modelling. Economic Modelling. 20. 941–957.
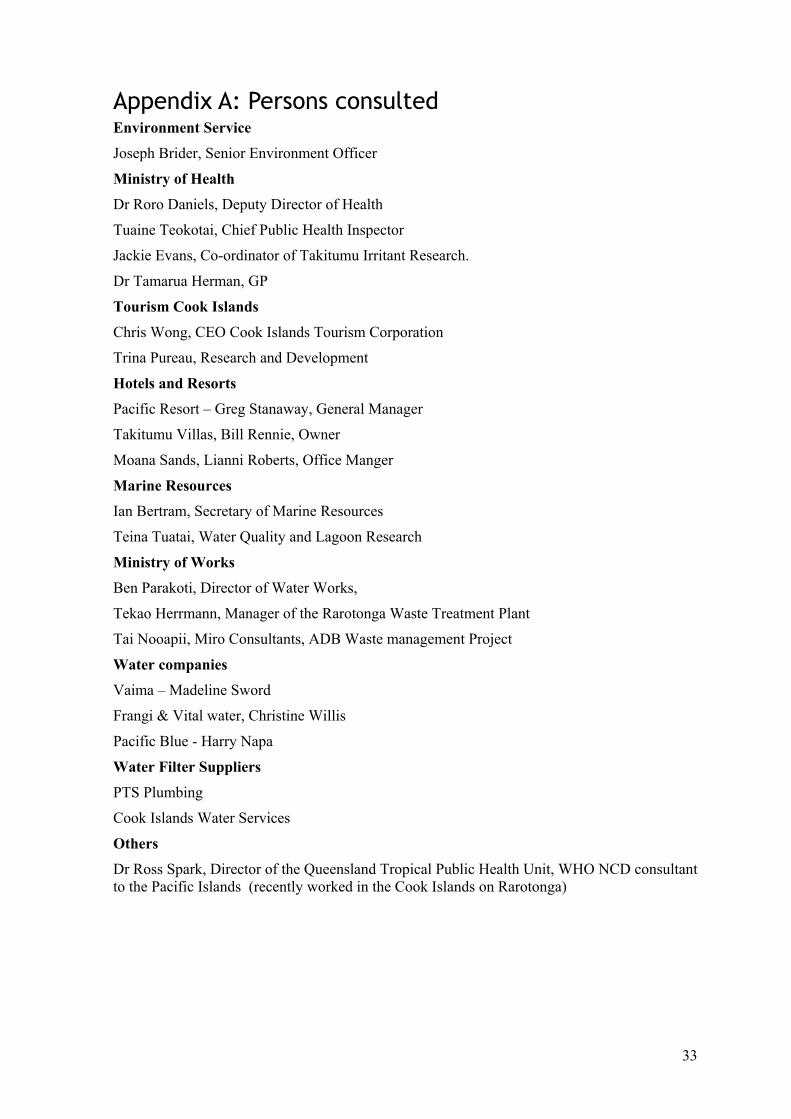
33
Appendix A: Persons consulted Environment Service
Joseph Brider, Senior Environment Officer
Ministry of Health
Dr Roro Daniels, Deputy Director of Health
Tuaine Teokotai, Chief Public Health Inspector
Jackie Evans, Co-ordinator of Takitumu Irritant Research.
Dr Tamarua Herman, GP
Tourism Cook Islands
Chris Wong, CEO Cook Islands Tourism Corporation
Trina Pureau, Research and Development
Hotels and Resorts
Pacific Resort – Greg Stanaway, General Manager
Takitumu Villas, Bill Rennie, Owner
Moana Sands, Lianni Roberts, Office Manger
Marine Resources
Ian Bertram, Secretary of Marine Resources
Teina Tuatai, Water Quality and Lagoon Research
Ministry of Works
Ben Parakoti, Director of Water Works,
Tekao Herrmann, Manager of the Rarotonga Waste Treatment Plant
Tai Nooapii, Miro Consultants, ADB Waste management Project
Water companies
Vaima – Madeline Sword
Frangi & Vital water, Christine Willis
Pacific Blue - Harry Napa
Water Filter Suppliers
PTS Plumbing
Cook Islands Water Services
Others
Dr Ross Spark, Director of the Queensland Tropical Public Health Unit, WHO NCD consultant to the Pacific Islands (recently worked in the Cook Islands on Rarotonga)

34
Appendix B: The study's objectives and products The objectives of the valuation study are to:
• provide information for IWP Cook Islands to highlight the importance of addressing watershed management through the IWP or other current or future initiatives (advocacy);
• explore methods, procedures and other issues associated with the economic evaluation of natural resources in Pacific Island countries;
• assist in resource management and planning; • provide a context for the watershed management activities conducted in the Cook
Islands, especially (but not limited to) those activities conducted under the IWP; and
• provide baseline values/descriptions for environmental activities conducted in countries.
The products arising from the study include:
• presentations to the IWP Cook Islands national coordinator and lead agency, the national task force (NTF, including Project Development Team) and Local Project Committees (if appropriate) at meetings arranged by the national coordinator; and
• a report (this document) on the economic value of watersheds on Rarotonga to the economy of the Cook Islands, outlining sectors affected by or reliant on watersheds, activities undertaken, method (s) used to collect and analyse the necessary data, key findings and any recommendations.
35
Appendix C: Discussion of alternative valuation techniques There are many additional techniques of environmental valuation that were not applied in the Rarotongan study. The techniques are described in this section.
Travel Cost
This is a revealed preference technique. It involves determining people’s expenditure incurred in travelling to a scenic location to enjoy its natural beauty. The use of travel cost is limited to environmental resources closely connected to eco-tourism or recreation. The key challenge with the travel cost technique is separating out the “environmental” component from a multi-purpose trip. One example of travel cost valuation comes from China (Chen et al., 2004). Here it was found that the recreational benefits of a beach on the eastern coast of Xiamen Island in China had a total value of USD 53 million.
Hedonic Pricing
The hedonic pricing technique is a revealed preference method that attempts to discern the premium being paid for a commonly marketed good or service to attain some level of a related environmental service. For example, people may be willing to pay more for a property with access to natural areas or beautiful scenery. The price difference between the “environmentally superior” property and another property of equal size can be considered the cost of the environmental good.
Generally hedonic price models involve the construction of a regression equation, where price is the dependent variable and a set of environmental and other attributes are the independent variables. Using statistical analysis it may be possible to determine the marginal impact of an environmental variable on price. Whether such a relationship is found will depend partly on the availability and quality of data. Often the data required to obtain statistically valid estimates is unavailable.
Bastian et al. (2002) use hedonic pricing to analyse the increased prices of land with better/more wildlife habitat, angling opportunities and scenic vistas. Sengupta and Osgood (2003) used hedonic to find that ranch property values increased by USD 1,416 per acre for a one per cent improvement in a satellite greenness index.
Contingent Valuation
The contingent valuation method (CVM) is a stated preference technique involving surveys of stakeholders and the general citizenry. In CVM surveys people are asked how much they would be willing to pay (WTP) for an environmental service or how much they would be willing to accept (WTA) in compensation for the loss of that service. As with other stated preference techniques CVM is used when the environmental good or service under question has no market, i.e. it is not bought or sold. The CVM technique attempts to create a hypothetical market, and guess the likely prices of environmental goods if they could be traded.
One famous example of CVM was a valuation of the economic impacts of the Exxon Valdese oil spill in Alaska in 1989. The researchers (Carson et al., 2003) estimated the aggregate loss of passive use of environmental resources at USD 4.87 billion.
Choice Modelling
The choice modelling technique is a stated preference method with a similar aim to contingent valuation. It differs to contingent valuation by presenting the questions to survey respondents as a series of choices from which values can be inferred. A choice modelling survey presents survey respondents with a series of carefully designed choices about their willingness to accept

36
different levels of environmental service at the cost of other factors. The value of the goods and services is inferred from the respondent’s choices using statistical techniques. A statistically significant result, i.e. one for which the data shows sufficiently strong relationships, is not always assured and will depend upon how people answer the questions. Choice modelling has been used by Van Bueren and Bennet (2004) to estimate the annual impact of water pollution, landscape aesthetics, species loss and social change to Australian households at A$29.72 per household.
Other Methods
A range of other methods have been applied amidst the hundreds of valuation studies conducted worldwide. One example is the dose-response approach. This involves defining the relationship between environmental damage (response) and the cause of that damage (dose). A common example of dose-response methods is in the assessment of healthcare costs emerging from environmental pollution. In this case the dose is the environmental contaminant and the response is poorer health.
The difficulty with the dose-response approach is establishing a causal link between the environmental problem and people’s healthcare needs. This link will depend on complex scientific principles and may require large amounts of specialised data to substantiate. Where the scientific models or data are unavailable it may be necessary to rely upon expert judgements, which adds an element of subjectivity.
Another approach can be described as the benefits-transfer method. This takes the results of a valuation study conducted in one location and transfers it to another. This is generally done because it is too expensive or impractical to conduct a valuation study in the area of interest. There are three ways of conducting benefit transfer (Barton, 2002):
• transfer of fixed values or unadjusted mean value estimates; • value estimator models or benefit function transfer; and • expert judgement methods.
Benefits transfer is a complex process and can easily produce large errors if incorrectly applied. Often it will not be applicable. This is because valuation results are typically highly context dependent. The results depend on the preferences of a particular population, the production techniques and technology, input prices (e.g. the cost of labour), characteristics of the physical environment and regional economic conditions. Often it will not be possible to accurately adjust for all these factors. Generally a tailored site and issue specific valuation will be required.
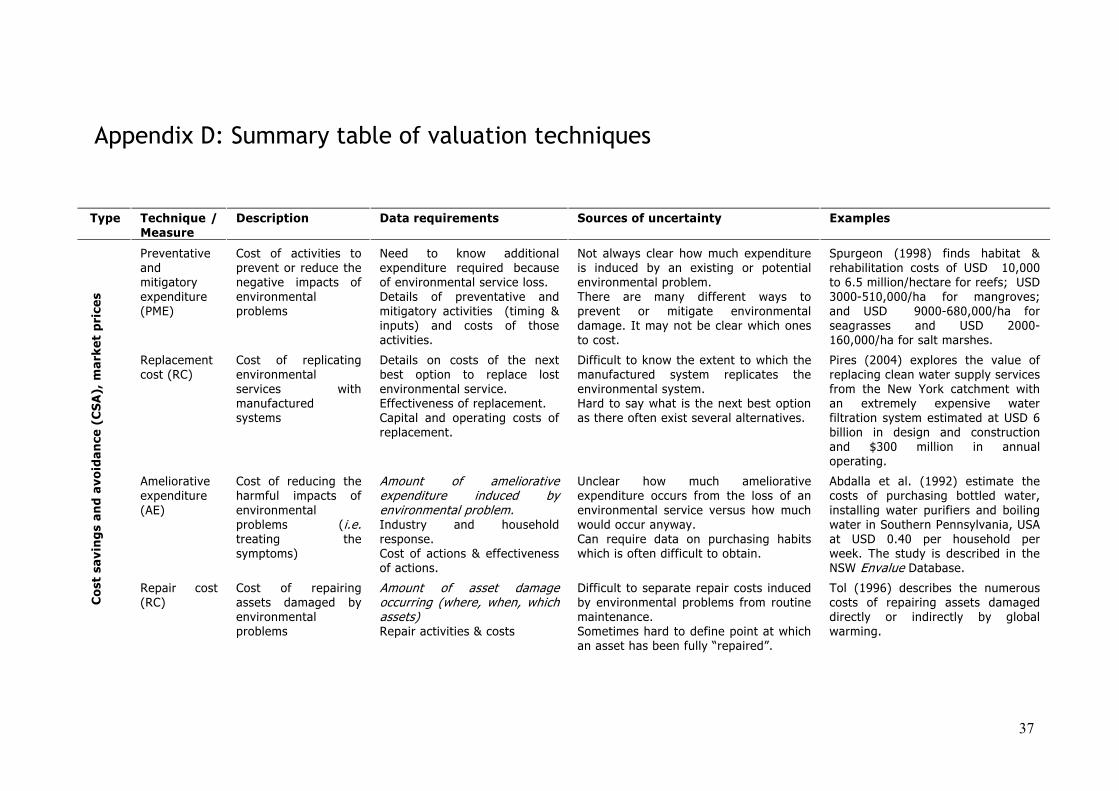
37
Appendix D: Summary table of valuation techniques
Type Technique / Measure
Description Data requirements Sources of uncertainty Examples
Preventative and mitigatory expenditure (PME)
Cost of activities to prevent or reduce the negative impacts of environmental problems
Need to know additional expenditure required because of environmental service loss. Details of preventative and mitigatory activities (timing & inputs) and costs of those activities.
Not always clear how much expenditure is induced by an existing or potential environmental problem. There are many different ways to prevent or mitigate environmental damage. It may not be clear which ones to cost.
Spurgeon (1998) finds habitat & rehabilitation costs of USD 10,000 to 6.5 million/hectare for reefs; USD 3000-510,000/ha for mangroves; and USD 9000-680,000/ha for seagrasses and USD 2000-160,000/ha for salt marshes.
Replacement cost (RC)
Cost of replicating environmental services with manufactured systems
Details on costs of the next best option to replace lost environmental service. Effectiveness of replacement. Capital and operating costs of replacement.
Difficult to know the extent to which the manufactured system replicates the environmental system. Hard to say what is the next best option as there often exist several alternatives.
Pires (2004) explores the value of replacing clean water supply services from the New York catchment with an extremely expensive water filtration system estimated at USD 6 billion in design and construction and $300 million in annual operating.
Ameliorative expenditure (AE)
Cost of reducing the harmful impacts of environmental problems (i.e. treating the symptoms)
Amount of ameliorative expenditure induced by environmental problem. Industry and household response. Cost of actions & effectiveness of actions.
Unclear how much ameliorative expenditure occurs from the loss of an environmental service versus how much would occur anyway. Can require data on purchasing habits which is often difficult to obtain.
Abdalla et al. (1992) estimate the costs of purchasing bottled water, installing water purifiers and boiling water in Southern Pennsylvania, USA at USD 0.40 per household per week. The study is described in the NSW Envalue Database.
Co
st s
avin
gs
and
avo
idan
ce (
CS
A),
mar
ket
pri
ces
Repair cost (RC)
Cost of repairing assets damaged by environmental problems
Amount of asset damage occurring (where, when, which assets) Repair activities & costs
Difficult to separate repair costs induced by environmental problems from routine maintenance. Sometimes hard to define point at which an asset has been fully “repaired”.
Tol (1996) describes the numerous costs of repairing assets damaged directly or indirectly by global warming.
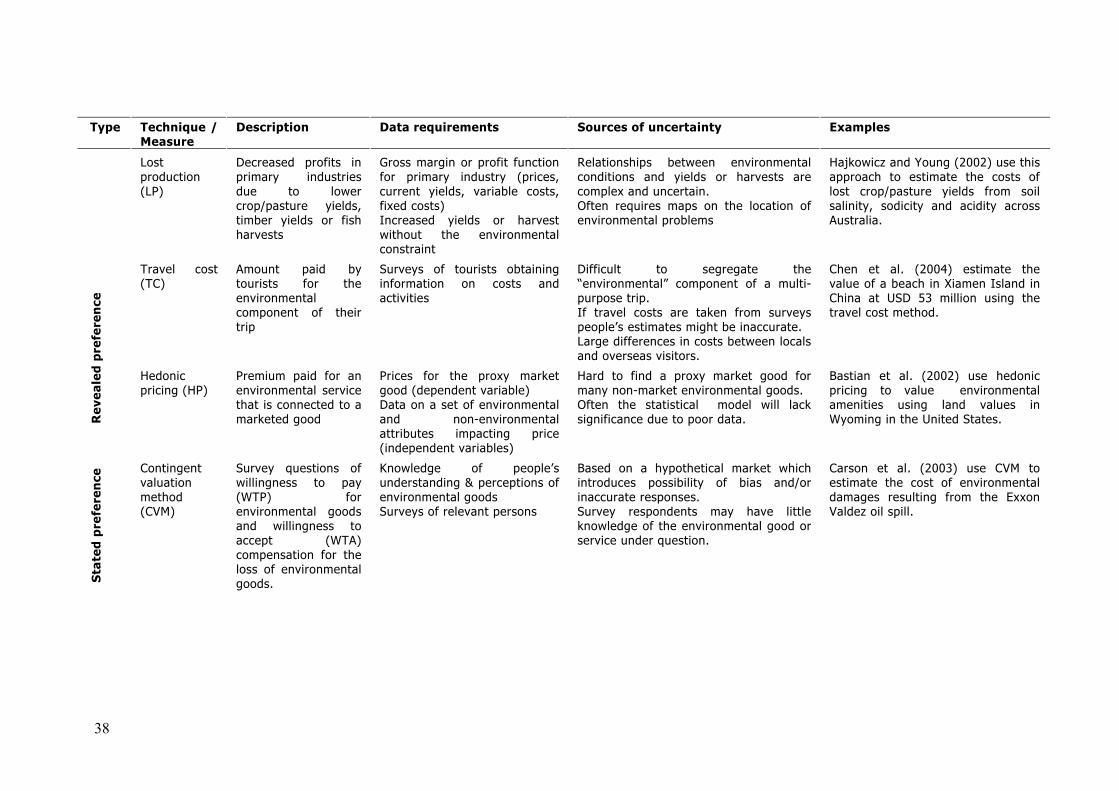
38
Type Technique / Measure
Description Data requirements Sources of uncertainty Examples
Lost production (LP)
Decreased profits in primary industries due to lower crop/pasture yields, timber yields or fish harvests
Gross margin or profit function for primary industry (prices, current yields, variable costs, fixed costs) Increased yields or harvest without the environmental constraint
Relationships between environmental conditions and yields or harvests are complex and uncertain. Often requires maps on the location of environmental problems
Hajkowicz and Young (2002) use this approach to estimate the costs of lost crop/pasture yields from soil salinity, sodicity and acidity across Australia.
Travel cost (TC)
Amount paid by tourists for the environmental component of their trip
Surveys of tourists obtaining information on costs and activities
Difficult to segregate the “environmental” component of a multi-purpose trip. If travel costs are taken from surveys people’s estimates might be inaccurate. Large differences in costs between locals and overseas visitors.
Chen et al. (2004) estimate the value of a beach in Xiamen Island in China at USD 53 million using the travel cost method.
Rev
eale
d p
refe
ren
ce
Hedonic pricing (HP)
Premium paid for an environmental service that is connected to a marketed good
Prices for the proxy market good (dependent variable) Data on a set of environmental and non-environmental attributes impacting price (independent variables)
Hard to find a proxy market good for many non-market environmental goods. Often the statistical model will lack significance due to poor data.
Bastian et al. (2002) use hedonic pricing to value environmental amenities using land values in Wyoming in the United States.
Sta
ted
pre
fere
nce
Contingent valuation method (CVM)
Survey questions of willingness to pay (WTP) for environmental goods and willingness to accept (WTA) compensation for the loss of environmental goods.
Knowledge of people’s understanding & perceptions of environmental goods Surveys of relevant persons
Based on a hypothetical market which introduces possibility of bias and/or inaccurate responses. Survey respondents may have little knowledge of the environmental good or service under question.
Carson et al. (2003) use CVM to estimate the cost of environmental damages resulting from the Exxon Valdez oil spill.
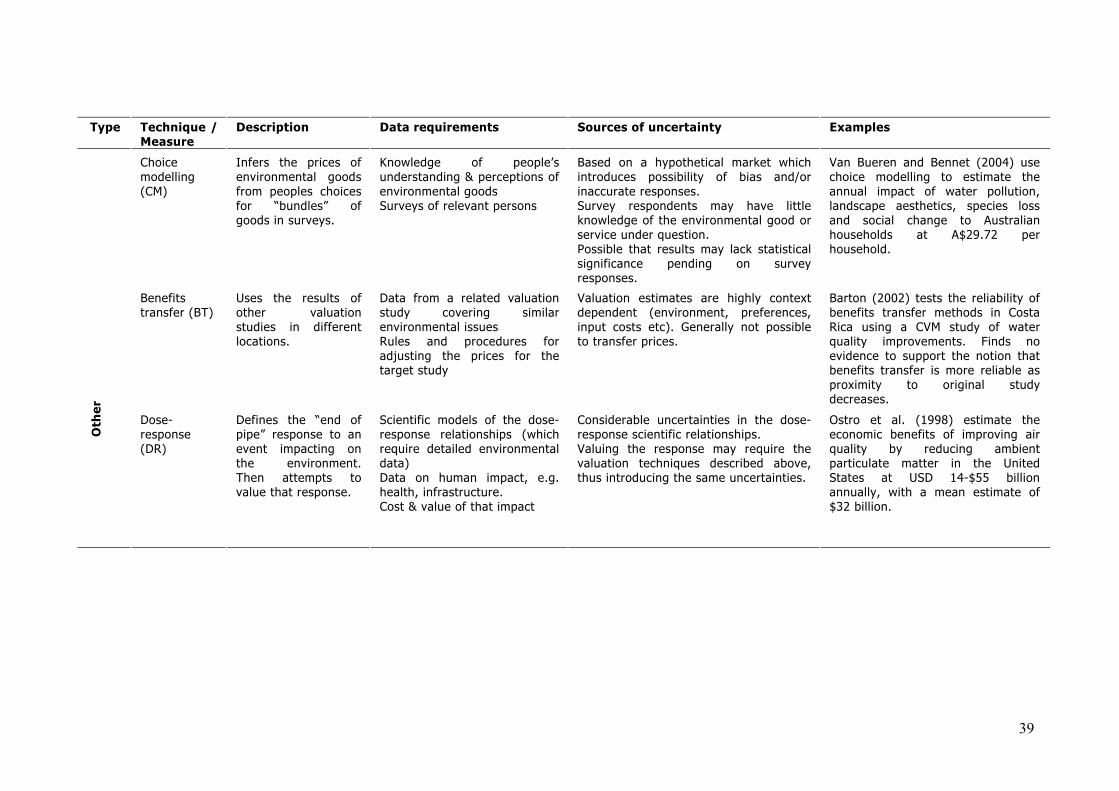
39
Type Technique / Measure
Description Data requirements Sources of uncertainty Examples
Choice modelling (CM)
Infers the prices of environmental goods from peoples choices for “bundles” of goods in surveys.
Knowledge of people’s understanding & perceptions of environmental goods Surveys of relevant persons
Based on a hypothetical market which introduces possibility of bias and/or inaccurate responses. Survey respondents may have little knowledge of the environmental good or service under question. Possible that results may lack statistical significance pending on survey responses.
Van Bueren and Bennet (2004) use choice modelling to estimate the annual impact of water pollution, landscape aesthetics, species loss and social change to Australian households at A$29.72 per household.
Benefits transfer (BT)
Uses the results of other valuation studies in different locations.
Data from a related valuation study covering similar environmental issues Rules and procedures for adjusting the prices for the target study
Valuation estimates are highly context dependent (environment, preferences, input costs etc). Generally not possible to transfer prices.
Barton (2002) tests the reliability of benefits transfer methods in Costa Rica using a CVM study of water quality improvements. Finds no evidence to support the notion that benefits transfer is more reliable as proximity to original study decreases.
Oth
er
Dose-response (DR)
Defines the “end of pipe” response to an event impacting on the environment. Then attempts to value that response.
Scientific models of the dose-response relationships (which require detailed environmental data) Data on human impact, e.g. health, infrastructure. Cost & value of that impact
Considerable uncertainties in the dose-response scientific relationships. Valuing the response may require the valuation techniques described above, thus introducing the same uncertainties.
Ostro et al. (1998) estimate the economic benefits of improving air quality by reducing ambient particulate matter in the United States at USD 14-$55 billion annually, with a mean estimate of $32 billion.

40
Appendix E: Survey on water use This survey was conducted of residents and tourists at the central town markets and other public places. A total of 100 persons were surveyed face-to-face by a trained researcher. The survey aims to determine bottled water consumption habits, household water filter ownership, rainwater tank ownership and whether people consume fish from the lagoon. In each case people are asked to state their reasons to help determine the component of consumption associated with watershed conditions.
Do you live in the Cook Islands? Yes / No
If no, what is your country of residence?
If yes, what village do you live in?
What is your age: <15 16-25 26-35 36-45 46-55 56-65 66 +
Gender: M / F
Do you drink bottled water (in addition to or instead of tap water)? Why?
Yes / No
Reason:
How much would you drink on average every day? Every week?
If the person is a tourist stop here
Do you have a household water filter? If yes why?
Yes / No
Reason:
Does your household have a water tank? If not, do you intend to get one?
Already have one: Yes / No
Intend to get one: Yes / No
State reason why:
Do you, or would you, eat fish from the lagoon? Why?
Yes / No
Reason:

41
Appendix F: Takitumu irritant syndrome health warning The following text is an extract from advice issued by the Ministry of Health:
If a group of people have all or most of the following symptoms…..
• Stinging/Sore , watery eyes
• Nose burning, stinging
• Sore Throat
• Itchy Skin
• Breathing difficulties
WHAT TO DO
• Wash itchy skin immediately with cold water and soap
• Move away from the area from which they were effected
• Call the hospital hotline number IMMEDIATELY to report the case or see a doctor for treatment. Please report ALL cases even if they don”t wish to see a doctor
Hospital Hotline Number: 22-664 The cause of the irritant syndrome is not known at present but there are two min possibilities: ground level ozone from the burning of rubbish and car exhaust and/or air-borne toxic algal blooms.
WHAT YOU CAN DO TO HELP
• Compost your garden rubbish instead of burning it
• Never burn plastic rubbish or tyres
• Ensure that your septic tank at home is working
• If you have tourist accommodation ensure that you are using adequate sewerage treatment system
• If you have a pig farm ensure the sewerage treatment system you are using is adequate for the size of your farm.
• Report all cases of the irritant syndrome
For more information on how to help call the Irritant Syndrome Project Coordinator, Jacqui Evans on 29664 or 55 050