An Appraisal of the Marine Fisheries of Orissa, India
15
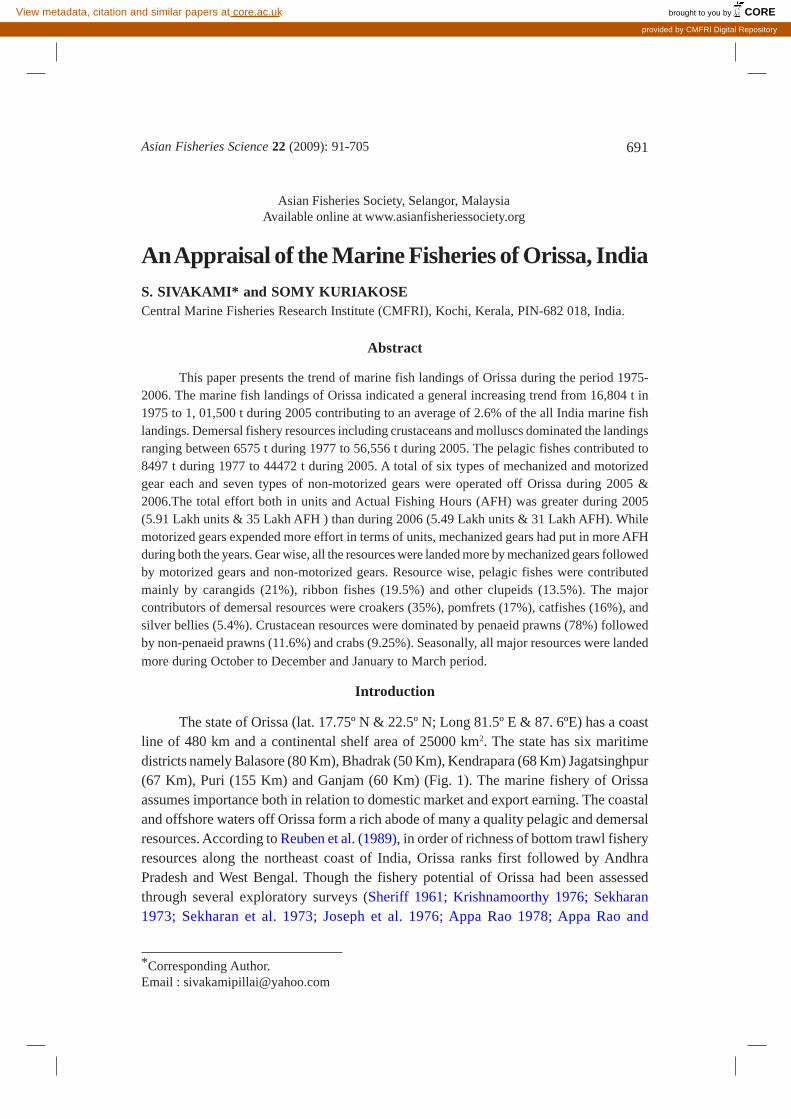
691 Asian Fisheries Science 22 (2009): 91-705 Asian Fisheries Society, Selangor, Malaysia Available online at www.asianfisheriessociety.org * Corresponding Author. Email : [email protected] An Appraisal of the Marine Fisheries of Orissa, India S. SIVAKAMI* and SOMY KURIAKOSE Central Marine Fisheries Research Institute (CMFRI), Kochi, Kerala, PIN-682 018, India. Abstract This paper presents the trend of marine fish landings of Orissa during the period 1975- 2006. The marine fish landings of Orissa indicated a general increasing trend from 16,804 t in 1975 to 1, 01,500 t during 2005 contributing to an average of 2.6% of the all India marine fish landings. Demersal fishery resources including crustaceans and molluscs dominated the landings ranging between 6575 t during 1977 to 56,556 t during 2005. The pelagic fishes contributed to 8497 t during 1977 to 44472 t during 2005. A total of six types of mechanized and motorized gear each and seven types of non-motorized gears were operated off Orissa during 2005 & 2006.The total effort both in units and Actual Fishing Hours (AFH) was greater during 2005 (5.91 Lakh units & 35 Lakh AFH ) than during 2006 (5.49 Lakh units & 31 Lakh AFH). While motorized gears expended more effort in terms of units, mechanized gears had put in more AFH during both the years. Gear wise, all the resources were landed more by mechanized gears followed by motorized gears and non-motorized gears. Resource wise, pelagic fishes were contributed mainly by carangids (21%), ribbon fishes (19.5%) and other clupeids (13.5%). The major contributors of demersal resources were croakers (35%), pomfrets (17%), catfishes (16%), and silver bellies (5.4%). Crustacean resources were dominated by penaeid prawns (78%) followed by non-penaeid prawns (11.6%) and crabs (9.25%). Seasonally, all major resources were landed more during October to December and January to March period. Introduction The state of Orissa (lat. 17.75º N & 22.5º N; Long 81.5º E & 87. 6ºE) has a coast line of 480 km and a continental shelf area of 25000 km 2 . The state has six maritime districts namely Balasore (80 Km), Bhadrak (50 Km), Kendrapara (68 Km) Jagatsinghpur (67 Km), Puri (155 Km) and Ganjam (60 Km) (Fig. 1). The marine fishery of Orissa assumes importance both in relation to domestic market and export earning. The coastal and offshore waters off Orissa form a rich abode of many a quality pelagic and demersal resources. According to Reuben et al. (1989), in order of richness of bottom trawl fishery resources along the northeast coast of India, Orissa ranks first followed by Andhra Pradesh and West Bengal. Though the fishery potential of Orissa had been assessed through several exploratory surveys (Sheriff 1961; Krishnamoorthy 1976; Sekharan 1973; Sekharan et al. 1973; Joseph et al. 1976; Appa Rao 1978; Appa Rao and brought to you by CORE View metadata, citation and similar papers at core.ac.uk provided by CMFRI Digital Repository
Transcript of An Appraisal of the Marine Fisheries of Orissa, India
691Asian Fisheries Science 22 (2009): 91-705
Asian Fisheries Society, Selangor, MalaysiaAvailable online at www.asianfisheriessociety.org
*Corresponding Author.Email : [email protected]
An Appraisal of the Marine Fisheries of Orissa, IndiaS. SIVAKAMI* and SOMY KURIAKOSECentral Marine Fisheries Research Institute (CMFRI), Kochi, Kerala, PIN-682 018, India.
Abstract
This paper presents the trend of marine fish landings of Orissa during the period 1975-2006. The marine fish landings of Orissa indicated a general increasing trend from 16,804 t in1975 to 1, 01,500 t during 2005 contributing to an average of 2.6% of the all India marine fishlandings. Demersal fishery resources including crustaceans and molluscs dominated the landingsranging between 6575 t during 1977 to 56,556 t during 2005. The pelagic fishes contributed to8497 t during 1977 to 44472 t during 2005. A total of six types of mechanized and motorizedgear each and seven types of non-motorized gears were operated off Orissa during 2005 &2006.The total effort both in units and Actual Fishing Hours (AFH) was greater during 2005(5.91 Lakh units & 35 Lakh AFH ) than during 2006 (5.49 Lakh units & 31 Lakh AFH). Whilemotorized gears expended more effort in terms of units, mechanized gears had put in more AFHduring both the years. Gear wise, all the resources were landed more by mechanized gears followedby motorized gears and non-motorized gears. Resource wise, pelagic fishes were contributedmainly by carangids (21%), ribbon fishes (19.5%) and other clupeids (13.5%). The majorcontributors of demersal resources were croakers (35%), pomfrets (17%), catfishes (16%), andsilver bellies (5.4%). Crustacean resources were dominated by penaeid prawns (78%) followedby non-penaeid prawns (11.6%) and crabs (9.25%). Seasonally, all major resources were landedmore during October to December and January to March period.
Introduction
The state of Orissa (lat. 17.75º N & 22.5º N; Long 81.5º E & 87. 6ºE) has a coastline of 480 km and a continental shelf area of 25000 km2. The state has six maritimedistricts namely Balasore (80 Km), Bhadrak (50 Km), Kendrapara (68 Km) Jagatsinghpur(67 Km), Puri (155 Km) and Ganjam (60 Km) (Fig. 1). The marine fishery of Orissaassumes importance both in relation to domestic market and export earning. The coastaland offshore waters off Orissa form a rich abode of many a quality pelagic and demersalresources. According to Reuben et al. (1989), in order of richness of bottom trawl fisheryresources along the northeast coast of India, Orissa ranks first followed by AndhraPradesh and West Bengal. Though the fishery potential of Orissa had been assessedthrough several exploratory surveys (Sheriff 1961; Krishnamoorthy 1976; Sekharan1973; Sekharan et al. 1973; Joseph et al. 1976; Appa Rao 1978; Appa Rao and
brought to you by COREView metadata, citation and similar papers at core.ac.uk
provided by CMFRI Digital Repository

692 Asian Fisheries Science 22 (2009): 691-705
Krishnamoorthi 1983;Reuben et al. 1989; Menon etal. 1996) the trend of marinefish landings through comm-ercial landings had been lessattempted (Dharmaraja &Philipose 1977; Scariah et al.1987; CMFRI 1995). Thispaper is an attempt on theappraisal of marine fisheries ofOrissa based on commerciallandings with particularemphasis on the currentexploitation and futurepotential.
Materials and Methods
The catch and effort data on marine fisheries of Orissa are obtained from
FRA Division of CMFRI, Kochi. Gear-wise landing data for the period between 2005
and 2006 are analyzed with special reference to seasonal abundance of major groups
landed in mechanized trawlers and motorized gill netters. Catch per hour is reckoned
for evaluating seasonal abundance.
Figure 2a. Marine fish landings off Orissa & its % in All India marine landings during1975 to 2006
Figure 1. Major fish landing centres in Orissa*.
693Asian Fisheries Science 22 (2009): 91-705
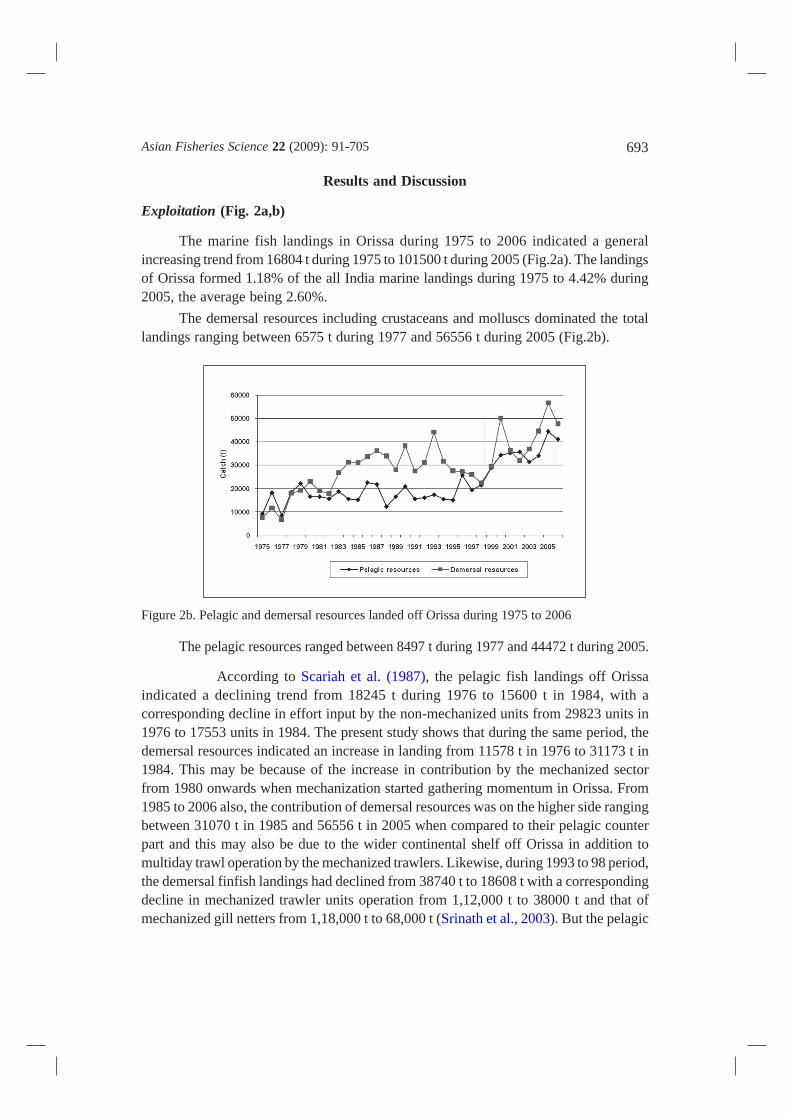
The demersal resources including crustaceans and molluscs dominated the totallandings ranging between 6575 t during 1977 and 56556 t during 2005 (Fig.2b).
Figure 2b. Pelagic and demersal resources landed off Orissa during 1975 to 2006
The pelagic resources ranged between 8497 t during 1977 and 44472 t during 2005.
According to Scariah et al. (1987), the pelagic fish landings off Orissaindicated a declining trend from 18245 t during 1976 to 15600 t in 1984, with acorresponding decline in effort input by the non-mechanized units from 29823 units in1976 to 17553 units in 1984. The present study shows that during the same period, thedemersal resources indicated an increase in landing from 11578 t in 1976 to 31173 t in1984. This may be because of the increase in contribution by the mechanized sectorfrom 1980 onwards when mechanization started gathering momentum in Orissa. From1985 to 2006 also, the contribution of demersal resources was on the higher side rangingbetween 31070 t in 1985 and 56556 t in 2005 when compared to their pelagic counterpart and this may also be due to the wider continental shelf off Orissa in addition tomultiday trawl operation by the mechanized trawlers. Likewise, during 1993 to 98 period,the demersal finfish landings had declined from 38740 t to 18608 t with a correspondingdecline in mechanized trawler units operation from 1,12,000 t to 38000 t and that ofmechanized gill netters from 1,18,000 t to 68,000 t (Srinath et al., 2003). But the pelagic
Results and Discussion
Exploitation (Fig. 2a,b)
The marine fish landings in Orissa during 1975 to 2006 indicated a generalincreasing trend from 16804 t during 1975 to 101500 t during 2005 (Fig.2a). The landingsof Orissa formed 1.18% of the all India marine landings during 1975 to 4.42% during2005, the average being 2.60%.

694 Asian Fisheries Science 22 (2009): 691-705
resources indicated a fluctuating pattern ranging from 15037 t during 1995 to 21488 tduring 1998, which may be attributed to the increased motorized units operationfrom 10000 m to 2,82,000 m (Srinath et al. 2003).
Fishery during 2005 and 2006: With a view to analyse the recent trend in landings,the catch and effort data during 2005 and 2006 were studied in detail.
Fishing crafts and gears: Orissa state has a total of 57 landing centers spread over641 fishing villages. According a latest estimate off Orissa, there are a total of 3577mechanized, 4719 motorized, and 15,444 non-motorized fishing crafts operated bya total of 74,980 active fisher folk (CMFRI, 2007a).
Effort expended during 2005 and 2006: A total of 19 types of gears were operatedoff Orissa under the mechanized, motorized, and nonmotorized categories (Table 1).
Table 1. Particulars of crafts & gears operated off Orissa during 2005 & 2006
Crafts Gears
Mechanised Single day Trawlers(MTN), MultiDay Trawlers(MDTN),Mechanised Gill Netters(MGN), Mechanised Drift Netters( MDN),Mechanised Drift Gil Netters(MDGN), MechanisedHooks & Line (MHL)
Motorised Out Board Gill Netters(OBGN), Outboard Drift Netters( OBDN),OutBoard Bottom Set Gill Netters(OBBGN),Out Board Hooks & Line(OBHL), Out Board Ring Netters (OBRN),OutBoard Ring Seine( OBRS)
Non motorised Non Motorised Gill Netters(NMGN), Non motorisedHooks & Line(NMHL), Non Motorised Shore Seine(NMSS), NonMotorised Boat Seine(NMBS),Non Motorised Drift Netters(NMDN),Non Motorised Bottom Set Gill Netters(NMBGN),Non Motorised Ring Netters(NMRN)
Particulars regarding unit effort and actual fishing hours (AFH) expended off Orissaduring 2005 and 2006 are presented in Fig. 3a & b.
Effort in units (Fig.3a): During 2005, a total of 0.69 lakhs mechanized units wereoperated followed by 2.80 lakh units of motorized gears and 2.42 lakh units of non-motorized gears. The total units expended amounted to 5.91 lakhs units. During2006, mechanized, motorized, and non-motorized gears operated 0.56 lakhs,2.95 lakhs and 1.98 lakh units, respectively, the total effort input being 5.49 lakhunits (Fig. 3a).

695Asian Fisheries Science 22 (2009): 91-705
Effort in AFH (Fig. 3b): During 2005, the mechanized gears expended an effort of18.03 lakhs followed by 8.96 lakhs hrs by motorized gears and 8.03 lakhs hrs by non-motorized gears.
During 2006, the mechanized gears had put in an effort of 13.9 lakh hrs whilemotorized gears expended 10.34 lakh hrs. The effort expended by non-motorized gearswas 6.71 lakh hrs (Fig.3b). The total fishing hours expended during 2005 & 2006amounted to 35 lakhs and 31 lakhs, respectively.
It may be noticed that the total effort both in units and AFH expended is moreduring 2005 than during 2006. However, among the different groups of gears, motorizedgears were found to have put in more effort in units while mechanized gears had expendedmore fishing hours during both the years that may be attributed to the operation ofmultiday trawlers by mechanized units.
Fishery Particulars regarding the landings of various resources off Orissa for the years2005 & 2006 are given in Table 2.
Figure 3b. Actual fishing Hours expended off Orissa during2005 & 2006
Figure 3 a. Effort (units) expended off Orissa during 2005 &2006
696 Asian Fisheries Science 22 (2009): 691-705
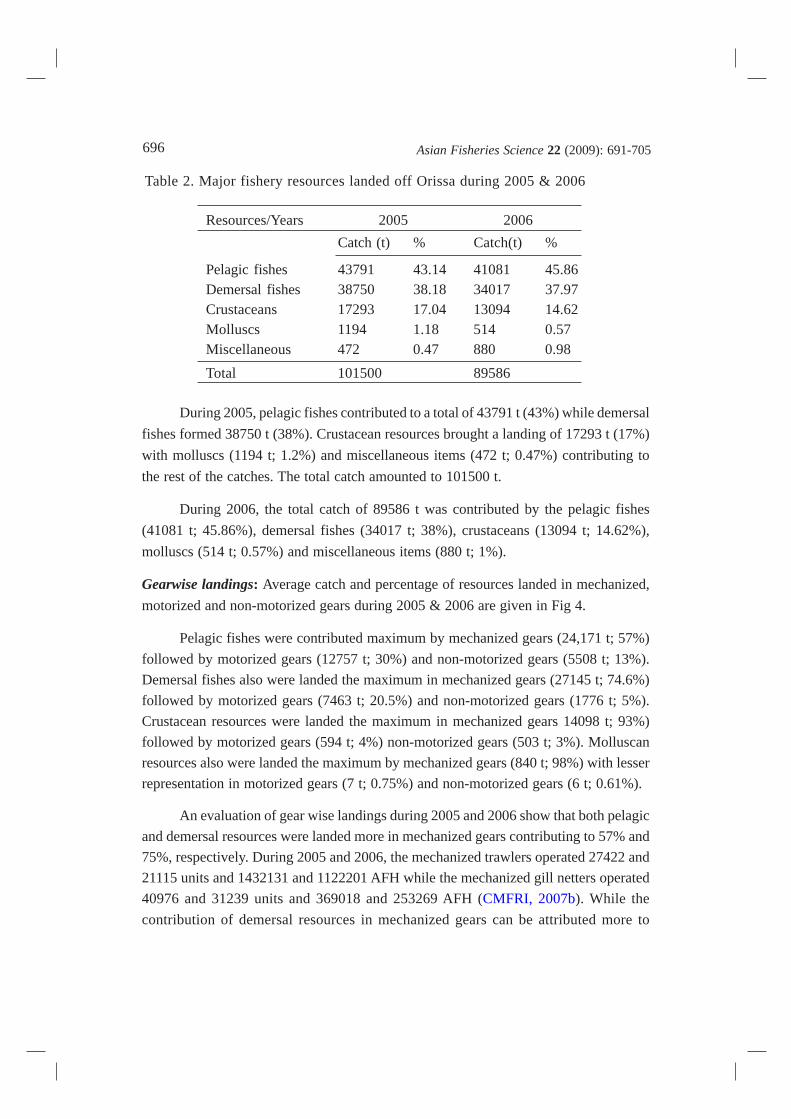
During 2005, pelagic fishes contributed to a total of 43791 t (43%) while demersal
fishes formed 38750 t (38%). Crustacean resources brought a landing of 17293 t (17%)
with molluscs (1194 t; 1.2%) and miscellaneous items (472 t; 0.47%) contributing to
the rest of the catches. The total catch amounted to 101500 t.
During 2006, the total catch of 89586 t was contributed by the pelagic fishes
(41081 t; 45.86%), demersal fishes (34017 t; 38%), crustaceans (13094 t; 14.62%),
molluscs (514 t; 0.57%) and miscellaneous items (880 t; 1%).
Gearwise landings: Average catch and percentage of resources landed in mechanized,
motorized and non-motorized gears during 2005 & 2006 are given in Fig 4.
Pelagic fishes were contributed maximum by mechanized gears (24,171 t; 57%)
followed by motorized gears (12757 t; 30%) and non-motorized gears (5508 t; 13%).
Demersal fishes also were landed the maximum in mechanized gears (27145 t; 74.6%)
followed by motorized gears (7463 t; 20.5%) and non-motorized gears (1776 t; 5%).
Crustacean resources were landed the maximum in mechanized gears 14098 t; 93%)
followed by motorized gears (594 t; 4%) non-motorized gears (503 t; 3%). Molluscan
resources also were landed the maximum by mechanized gears (840 t; 98%) with lesser
representation in motorized gears (7 t; 0.75%) and non-motorized gears (6 t; 0.61%).
An evaluation of gear wise landings during 2005 and 2006 show that both pelagic
and demersal resources were landed more in mechanized gears contributing to 57% and
75%, respectively. During 2005 and 2006, the mechanized trawlers operated 27422 and
21115 units and 1432131 and 1122201 AFH while the mechanized gill netters operated
40976 and 31239 units and 369018 and 253269 AFH (CMFRI, 2007b). While the
contribution of demersal resources in mechanized gears can be attributed more to
Resources/Years 2005 2006
Catch (t) % Catch(t) %
Pelagic fishes 43791 43.14 41081 45.86Demersal fishes 38750 38.18 34017 37.97Crustaceans 17293 17.04 13094 14.62Molluscs 1194 1.18 514 0.57Miscellaneous 472 0.47 880 0.98
Total 101500 89586
Table 2. Major fishery resources landed off Orissa during 2005 & 2006

697Asian Fisheries Science 22 (2009): 91-705
Figure 4. Gearwise landings (t) of major resources off Orissa during 2005 & 2006(Average)
operations of mechanized trawlers, the increased landings of pelagic resources also bymechanized gears may be due to the operation of mechanized gill netters.
Resource wise landings:
Pelagic resources: Average percent composition of pelagic, demersal, and crustaceansresources landed during 2005 & 2006 are depicted in Fig. 5a-c.
Figure 5a. Average % composition of pelagic resourceslanded off Orissa during 2005 & 2006
Among pelagic fishes,
carangids (20.58%), ribbon
fishes (19.54%) and other
clupeids (13.47%), were the
major resources landed
followed by other sardines
(9.23%), Stoleph-orus spp.,
(6.6%), Indian mackerel
(6.64%), Setipinna spp
(5.71%) and Seer fishes
(5.2%) Fig.5a.
Among demersals, croakers (35%), pomfrets (17%), catfishes (16%), silver bellies
(5.36%), goat fishes (4.66%) and flat fishes (4.22%) were the major groups landed
(Fig.5b). Among crustaceans, penaeid (78.2%), non penaeid prawn (11.64%), crabs(9)
and stomatopods were the major groups landed(Fig.5c)

698 Asian Fisheries Science 22 (2009): 691-705
Major species landed :
Among pelagic fishes,major carangids represented inthe landings were Megalaspiscordyla, Caranx ignobilis,C.malabaricus, Decapterusrusselli, D macrosoma andSelar crumenophthalmus.Major ribbon fish specieslanded were Trichiuruslepturus, Lepturacanthussavala, Eupleurogrammusintermedius and E.muticus.Lesser sardines wererepresented more by Sardinellagibbosa, S.fimbriata andS.brachysoma (CMFRI. 2007).
Among demersal fishes,
catfishes were represented by
species such as Tachysurus
thalassinus, T.tenuispinis, and
T.jella while the dominant
croakers landed were
Otolithoides biauritus,
Protonibea diacanthus, Johnius carutta, Otolithus argenteus and O.ruber.
Among crustaceans penaeid prawns were represented by Parapeneopsis stylifera,
Metapenaeus dobsoni, M.monoceros, M.affinis, Solenocera crassicornis, S.choprai
and S.indica,. S.hextii, and Fenneropenaeus indicus. Molluscan resources were chiefly
represented by cephalopods.
Resource wise landings in the present study shows that pelagic groups like ribbon
fishes and carangids and demersal groups such as croakers, catfishes, and pomfrets
were the major groups landed. Exploratory surveys along Orissa coast had indicated
that resources such as carangids and catfishes yielded high catch rates of 500 kg/hr at
19º26’N, 85º09’E at 90 m depth and 1500 Kg/hr off 19º19’N, 85º15’E (at 62 m depth)
(Menon et al. 1996). Vijayakumar and Naik (1991) had reported of high abundance of
catfishes along north east coast within 51-100 m depth. Sivakami et al. (1996) had
Figure 5b. Average % composition of demersal resourceslanded off Orissa during 2005 & 2006
Figure 5c. Average % contribution of crustacean resourcesoff Orissa during 2005 & 2006
699Asian Fisheries Science 22 (2009): 91-705
reported that Orissa coast is a potential zone for carangids. Nair et al. (1996) had obtained
a catch rate of 493 kg/hr of ribbon fishes from 100 m depth off south Orissa coast. Off
Andhra-Orissa coast, mackerel was abundant in the 51-100 m depth with a catch rate of
109 Kg/hr (Anon, 1987). Reuben et al. (1989) had noticed very rich grounds for mackerel
off 19º N,80ºE, 20ºN, 87ºE and 20ºN, 88ºE and for sciaenids at 19º N, 84ºE areas. They
had also observed that non demersal groups like mackerel and carangids were exploited
by the traditional sector much below their potential leaving scope for harvesting the
surplus stocks from waters beyond 40 m depth. Thus, it may be concluded that the shelf
waters off Orissa have a rich potential of both pelagic and demersal fishes probably by
virtue of a wider continental shelf of trawlable muddy/sandy bottom with the coast of
Orissa characterized by several estuarine systems of higher productivity.
According to Whitehead (1973) and Rao (1973), the distribution of Oil sardine
(Sardinella longiceps Val.) along the east coast of India is mainly off Tamil Nadu and
Andhra Pradesh where they form stray catches. Antony Raja (1969) includes the coast
of Orissa for the occurrence of oil sardine “under verification”. Ramasomayajulu and
Dhana Raju (1985) have confirmed its occurrence in this region and Scariah et al. (1987)
had reported of a landing of 539 t of oil sardine off Orissa coast during 1984. Pillai et al.
(2003) had observed that in the north eastern states of West Bengal and Orissa, a new
fishery for oil sardine has emerged from a position of no landings. In the present study,
oil sardine formed 86 t and 196 t during 2005 and 2006 contributing to an average of
0.35% of the pelagic fish landing off Orissa thereby confirming their distribution off
Orissa coast. They were landed in outboard gill net, ringnet, non-motorized gillnets &
trawl net.
Seasonal abundance: Catch rate (Kg/hr) of dominant groups of various resources landed
during 2005 & 2006 in mechanized trawlers and motorized gill netters is depicted in
Fig. 6a-l.
Pelagic fishes:
Mechanized trawlers:
Ribbon fishes: During 2005, ribbon fishes had the peak landings during January
(7.03 Kg/hr), March (14.35 Kg/hr), November (9 Kg/hr) and December (9 Kg/hr). In
addition during 2006, peak landings were observed during January (6.04 Kg/hr),
November (10 Kg/hr) and December (17.63 Kg/hr) (Fig.6a).

700 Asian Fisheries Science 22 (2009): 691-705
Figure 6a.Seasonal abundance (C/hr) of Rib-bon fishes landed off Orissa in mechanisedtralwers during 2005 & 2006
Figure 6b.Seasonal abundance(C/hr) ofCarangids landed off Orissa in mechanisedtrawlers during 2005 & 2006
Figure 6c. Seasonal abundance of mackerallanded in mechanised trawlers off Oissaduring 2005 & 2006
Figure 6d. Seasonal abundance (C/Hr) ofRibbon fishes landed off Orissa in motorisedgill netters during 2005 & 2006
Carangids: Carangids were landed the maximum during July 2005 (13 Kg/hr) and duringFebruary (6.28 kg/hr) and December (7 Kg/hr) during 2006 (Fig.6b).
Mackeral: Indian mackerel were landed the maximum during January (6.36 Kg/hr),March (25.48 Kg/hr) and November (4.13 Kg/hr) during 2005 while during 2006, catchrates were generally less with peaks during January (2.55 Kg/hr), February (2.5 Kg/hr)and December (6 Kg/hr) (Fig.6c).
Motorized gill netters:
Ribbon fishes: During 2005, ribbon fishes were landed the maximum duringNovember (16.11 Kg/hr) and December (28.67 Kg/hr) while during 2006, peak landingswere noticed during January (3.18 Kg/hr) and November (3.61 Kg/hr) (Fig.6d).
Carangids: During 2005, carangids were landed the maximum during January(7 Kg/hr), March (31.31 Kg/hr), April (12.6 Kg/hr) June (7.32 Kg/hr), August (20.35 Kg/hr)

701Asian Fisheries Science 22 (2009): 91-705
figure 6e.Seasonal abundance (C/Hr) ofCarangids landed in motorised gill netters offOrissa during 2005 & 2006
Figure 6f.Seasonal abundance of Croakerslanded in mechanised trawlers off Orissa dur-ing 2005 & 2006
Figure 6g. Seasonal abundance (C/Hr) ofcatfishes landed off Orissa in mechanised trawl-ers during 2005 & 2006
Figure 6h. Seasonal abundance (C/Hr) ofPomfrets landed in mechanised trawlers offOrissa during 2005 & 2006
Demersal fishes:
Mechanized trawlers: Croakers: In mechanized trawlers, croakers generallybrought good catch rates particularly during March (23.51 Kg/hr) and during October2005 (14.45 Kg/hr) and during August (11.81 Kg/hr) and December 2006 (11.42 Kg/hr)(Fig.6f).
Catfishes: Catfish landings were generally less in mechanized gears with peakonly during November 2006 (18.66 Kg/hr) (Fig.6g).
October (20.2 Kg/hr) November (20.2 Kg/hr) and December (13.4 Kg/hr). During 2006,peak landings were noticed during January (6.52 Kg/hr), February (12.92 Kg/hr) andJune (5.24 Kg/hr) (Fig.6e).
Pomfrets: Pomfret landings in mechanized trawlers were high during March (2.5 Kg/hr),July (2.6 Kg/hr) and during November 2005(1.84 Kg/hr). During 2006, good catch

702 Asian Fisheries Science 22 (2009): 691-705
Motorized gill netters:
Croakers: Compared to mechanizedtrawlers, landings of croakers in motorizedgill netters was less with peak duringMarch (9.06 Kg/hr), August (6.47 Kg/hr)and October (12 Kg/hr) during 2005.During 2006, peak catch rates wereobtained during February (2.42 Kg/hr),June (2.11 kg/hr) and July (4.76 Kg/hr)(Fig. 6i).
Catfishes: Catfish landings in motorizedgill netters indicated a peak during January(7.8 Kg/hr), March (5.51 Kg/hr), June(6.1 Kg/hr), August (6.01 Kg/hr) andOctober (5.5 Kg/hr) (Fig.6j).
Figure 6i. Seasonal abundance of Croakerslanded in motorised gill netters off Orissa dur-ing 2005 & 2006.
Figure 6j. Seasonal abundance of Catfishes(C/Hr) off orissa in motorised gill nettersduring 2005 & 2006
Figure 6k. Seasonal abundance of Pomfretslanded off Orissa in motorised gill nettersduring 200 & 2006
Pomfrets: Pomfrets brought good landingsonly during March (24.83 Kg/hr), May(9.8 Kg/hr) August (8.09 Kg/hr), Septem-ber (9.53 Kg/hr) and October 2005(25.6 Kg/hr) (Fig. 6k).
Crustaceans:Mechanized trawlers:
Penaeid prawns: Penaeid prawns inmechanized trawlers was generally goodwith peak during January (9.21 Kg/hr),July (16.93 Kg/hr), October (11.31 kg/hr)November (9.81 Kg/hr) and December(8.04 Kg/hr) during 2005. During 2006,peak landings were obtained duringJanuary (7.74 Kg/hr), April (6.58 Kg/hr),June (10.48 Kg/hr), November (11.42 Kg/hr)and December (14.05 Kg/hr) (Fig.6 l). Inmotorized gears the catch of penaeidprawns was negligible.
rates were obtained during August (4.54 Kg/hr), September (2.16 Kg/hr) andNovember (2 Kg/hr) (Fig.6 h).

703Asian Fisheries Science 22 (2009): 91-705
Seasonally, majorresources such as ribbon fish,mackerel, croakers & catfishhad brought higher catch ratesduring October to December &January to March period, whileother resources such ascarangids were landed moreduring February, April, June,and August. Penaeid prawnsalso brought good landingsduring January, July & October to December. Sekharan et al (1973) have found thatcatfishes are dominant in > 30 m depth during March-June. Scariah et al (1987) haveobserved that during 1875 to 84, off Orissa coast the highest landings was during fourthquarter (October to December) followed by first quarter (January to March), whenplanktivorus fishes such as sardines, pomfrets, etc contributed to more than 33%.According to Sankaranarayanan & Reddy (1968), there is evidence of upwelling in theNorth Western Bay of Bengal in January. Mathew et al (1996) have observed higherconcentration of zooplankton in North West Bay of Bengal off Chilka Lake & Paradeeparea during January and that the most productive period was during the North Eastmonsoon (October to January) followed by premonsoon (February to May). The aboveauthors have concluded that the fresh water influx and the high nutrient load towardsthe head of the Bay (Qasim 1977) coupled with the south westerly current and theprevailing wind pattern along with the effect of upwelling would have caused a pilingup of standing crop in the coastal waters between 18º N & 20º N. It is therefore logicalto believe that the peak landings of planktivorous fishes off Orissa during the north eastmonsoon season during October to December have a bearing on the proliferation ofzooplankton population because plankton production is funneled either by pelagic ordemersal groups into fish production (Sheldon et al. 1975).
Acknowledgements:
The authors wish to express their gratitude to Prof. (Dr). Mohan Joseph Modayil,Director, CMFRI, Kochi for suggesting this topic and necessary improvements madeand to Dr.E.Vivekanandan, Head, Demersal Fisheries Division, CMFRI, Kochi, for theencouragements. Thanks are also due to Dr.M.Srinath, Head, FRA Division for providingthe catch and effort data. The help rendered by Smt.P. K. Seetha, Senior TechnicalAssistant in preparing the manuscript is duly acknowledged.
Figure 6l. Seasonal abundance (C/Hr) of penaeid prawnslanded in mechanised trawlers off Orissa during 2005 &2006
admin
Rectangle
704 Asian Fisheries Science 22 (2009): 691-705
References
Anon. 1987. Demersal fishery survey along Andhra Pradesh-Orissa Coast during September-December 1986. Fishing
Chimes 7(4): 11.
Antony Raja, B. T. 1969. The Indian Oil sardine. Bulletin of the Central Marine Fisheries Research Institute 16: 1-128.
Appa Rao, T. 1978. Relative abundance of Sciaenids along Andhra- Orissa coasts. Indian Journal of Fisheries
23(1&2): 201-212.
Appa Rao, T. and B. Krishnamoorthy. 1983. Diurnal variation in the catches of demersal fishes in the north west
region of Bay of Bengal during 1959-60. Indian Journal of Fisheries. 29 (1 & 2): 134-143.
CMFRI. 1995. Marine Fish Landings in India during 1985-1993. Marine Fish Information Services T & E Series 136: 1-30.
CMFRI. 2007a. Marine fish profile, 2007. Orissa, www.cmfri.org.in.
CMFRI.2007b. Project Reports, Demersal Fisheries Division, CMFRI, Kochi. Dharmaraja, S.K.and V.Philipose.
1977. Trends in the yield of major exploited fisheries off east coast of India. Indian Journal of Fisheries
22 (1&2) (1975): 187-197.
ICM, 2003. Final report of the ICM Case Study in Orissa. Integrated Coastal Management. February-June, 2003.
Joseph, K.M..,N.Radhakrishnan, Antony Joseph and K.P.Philip , 1976. Results of demersal fishery resources survey
along the east coast of India, 1959-74. Bulletin Exploratory Fisheries Project .5: 53pp.
Krishnamoorthy, B. 1976. An assessment of the demersal fishery resources off the Andhra-Orissa coast based on
exploratory trawling. Indian Journal of Fisheries 21(2): 557-565.
Mathew, K.J..,K.N.Kurup, T.S.Naomi,G.Antony and Solomon. 1996. Zooplankton abundance in the contonental
shelf waters of the north-east coast of India. Proceedings of the Second Workshop on Scientific Results
of FORV Sagar Sampada, (ed. V.K. Pillai, S.A.H.Abidi, V. Ravindran, K.K. Balachandran and V.V. Agadi,
(Department of Ocean Development)) New Delhi, pp . 262.
Menon, N.G. , N.G.K. Pillai, S. Lazarus and P. Nammalwar. 1996. Finfish resources in the northeastern region in
the Indian EEZ. Proceedings of the Second Workshop on Scientific Results of FORV Sagar Sampada,
(ed. V.K. Pillai, S.A.H. Abidi, V. Ravindran, K.K. Balachandran and V.V. Agadi, (Department of Ocean
Development)) New Delhi, pp . 295-304.
Nair, P.N., Radhakrishnan, Alexander Kuraian, C. Muthiah, S. Lazaraus, R. Thiagarajan, M. Zaffer Khan and Prathibha
Rohit. 1996. Occurrence of ribbon fishes in the Indian EEZ . Proceedings of the Second Workshop on
Scientific Results of FORV Sagar Sampada (ed.V.K.Pillai, S.A.H.Abidi, V.Ravindran, K.K.Balachandran
& V.V.Agadi, (Department of Ocean Development) New Delhi), pp . 429-436.
Pillai, N.G.K., U. Ganga and A.A. Jayaprakash. 2003. Indian Oil Sardine. In: Status of Exploited Marine Fishery
Resources of India. Central Marine Fisheries Research Institute, Kochi., India. pp. 19.
Qasim, S. Z. 1977. Biological productivity of the Indian Ocean. Indian Journal of Marine Sciences (2): 122-137.
Rao, K. Virabhadra. 1973. Distribution pattern of the major exploited marine fishery resources of India. Proceedings
of the Symposium on Living Resources of the Seas around India. CMFRI Special. Publication pp. 18-101.
Ramasomayajulu, K. and K. Dhana Raju. 1985. A confirmation of the occurrence of oil sardine Sardinella longiceps
Val. along the Orissa coast. Indian Journal of Fisheries. 32(4): 495-496.
Reuben, S., G..S. Rao, G. Luther, T. Appa Rao, K. Radhakrishna, Y. Appanna Sasthry and G. Radhakrishnan. 1989.
An Assessment of the bottom trawl fishery resources of the North East coast of India. CMFRI Bullletin,
No. 44 (Part I): pp 59-77.
Sankaranarayanan, V. N. & C.V. G. Reddy. 1968. Nutrients of the northwestern Bay of Bengal. Proceedings of the
Symposium on the Indian Ocean. Bulletin of the National. Institute for the Promotion of Science, India.
38: 148-163.

705Asian Fisheries Science 22 (2009): 91-705
Scariah, K.S., V.Philipose, S.D. Dan, P. Karunakaran Nair and G. Subbaraman. 1987.An appraisal of the marinefisheries in Orissa. CMFRI Special. Publication31: pp 1-36. Sekharan, K. V. 1973. On the catfish resourcesof coast of Andhra Pradesh, Orissa and West Bengal. Proceedings of the Symposium on Living Resourcesof the Seas around India. Special Publication, CMFRI, Kochi-682 018, India, pp 517-536.
Sekharan, K. V., M.S. Muthu, K. Venkatasubba Rao, V. Ramamohana Rao, P. Mojumdar and S. Reuben. 1973.Exploratory trawling on continental shelf along the northwest part of Bay of Bengal. Proceedings of theSymposium on Living Resources of the Seas around India. Special. Publication, CMFRI, Kochi-682 018,India, pp. 280-337.
Sheldon. W., Sutcliffe Jr. W. H. and M. A. Paranjape. 1975. Structure of pelagic food chain and relationship betweenplankton and fish production. Journal of the Fisheries Research Board of Canada. 34: 2344-2353.
Sheriff, A. T. 1961. A survey of the off shore demersal fisheries of Andhra-Orissa 1960. In: Souvenir Fisheries ofGujarat. pp: 46-54.
Sivakami, S., P.N. Radhakrshnan Nair, A. A. Jayaprakash, Mohammed Kasim, T. M. Yohannan, M. Sivadas, K. P.Said Koya, and P. K. Seetha. 1996. Distribution and abundance of carangids along the EEZ of India.Proceedings of the Second Workshop on Scientific results of FORV Sagar Sampada (ed. V.K.Pillai,S.A.H.Abidi, V.Ravindran, K.K.Balachandran & V.V.Agadi, (Department of Ocean Development) NewDelhi), pp 347-362.
Srinath, M.Somy Kuriakose, K.G.Mini, M.R.Beena and S.K.Augustine, 2003. Trends in landings. In:Status ofExploited Marine fishery resources of India ( Eds): Mohan Joseph . M. and A.a Jayaprakash . CentralMarine Fisheries Research Insititute, Kochi. India, pp.283.
Vijayakumaran, K. & S.K.Naik. 1991. Demersal finfish resources of the inter-continental shelf of the EEZ. In:Proceedings Of the National Workshop on fishery resources and Data of Fish from Indus. (FSI, Bombay)pp.71-79
Whitehead, P. J.P. 1973. A synopsis of the Clupeoid fishes of India. Journal of the Marine Biological Association of.India. 14(1) 160-256.
Received: 23 November 2007; Accepted: 10 December 2008