Public Disclosure Authorized Orissa Irrigation Project India: … · 2016-07-15 · Report No....
167
Report No. 155Ea-IN RLE ClPY India: Appraisal of the Orissa Irrigation Project August 24, 1977 South Asia ProjectsDepartment Agriculture Division C FOR OFFICIALUSEONLY Documentof the World Bank Thisdocument hasa restricted distribution and may be usedby recipients only in the performance of their official duties. Its contents may not otherwisebe disclosed without World Bank authorization. Public Disclosure Authorized Public Disclosure Authorized Public Disclosure Authorized Public Disclosure Authorized Public Disclosure Authorized Public Disclosure Authorized Public Disclosure Authorized Public Disclosure Authorized
Transcript of Public Disclosure Authorized Orissa Irrigation Project India: … · 2016-07-15 · Report No....
Report No. 155Ea-IN RLE ClPY
India: Appraisal of theOrissa Irrigation ProjectAugust 24, 1977
South Asia Projects DepartmentAgriculture Division C
FOR OFFICIAL USE ONLY
Document of the World Bank
This document has a restricted distribution and may be used by recipientsonly in the performance of their official duties. Its contents may nototherwise be disclosed without World Bank authorization.
Pub
lic D
iscl
osur
e A
utho
rized
Pub
lic D
iscl
osur
e A
utho
rized
Pub
lic D
iscl
osur
e A
utho
rized
Pub
lic D
iscl
osur
e A
utho
rized
Pub
lic D
iscl
osur
e A
utho
rized
Pub
lic D
iscl
osur
e A
utho
rized
Pub
lic D
iscl
osur
e A
utho
rized
Pub
lic D
iscl
osur
e A
utho
rized
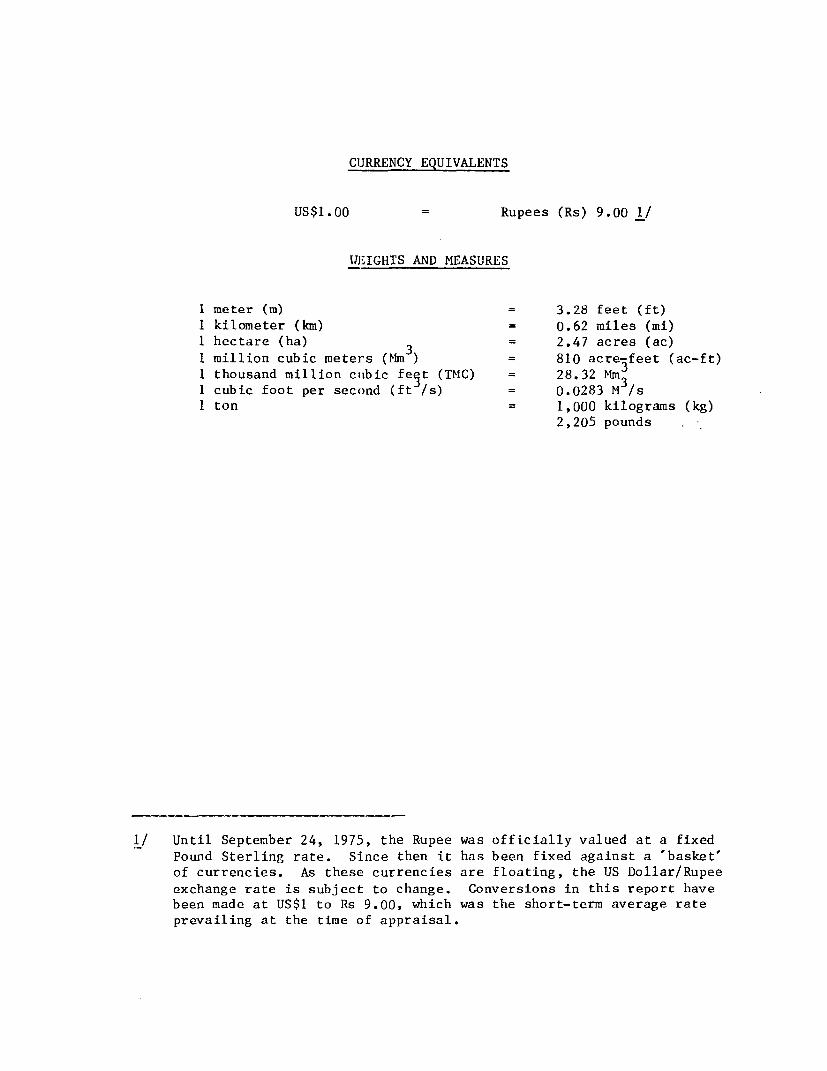
CIJRRENCY EQUIVALENTS
US$1.00 = Rupees (Rs) 9.00 1!
IWIGHTS AND MEASURES
1 meter (m) = 3.28 feet (ft)1 kilometer (kn) = 0.62 miles (mi)1 hectare (ha) 3= 2.47 acres (ac)1 million cubic meters (Mm ) 810 acre-feet (ac-ft)1 thousand million cubic feSt (TMC) = 28.32 Mmm3
1 cubic foot per second (ft Is) = 0.0283 M 3/s1 ton = 1,000 kilograms (kg)
2,205 pounds
1/ Until September 24, 1975, the Rupee was officially valued at a fixedPound Sterling rate. Since then it has been fixed against a 'basket'of currencies. As these currencies are floating, the US Dollar/Rupeeexchange rate is subject to change. Conversions in this report havebeen made at US$1 to Rs 9.00, which was the short-term average rateprevailing at the time of appraisal.
FOR OFFICIAL USE ONLY
PRINCIPAL ABBREVIATIONS A4 ACRONYMS USED
AC - Appraisal Committee of CWCAEO - Agricultural Engineering OrganizationARDC - Agricultural Refinance and Development CorporationCAD - Command Area DevelopmentCADA - Command Area Development AuthorityCWC - Central Water CommissionDAFP - Directorate of Agriculture and Food ProductionGOO - Government of OrissaGOI - Government of IndiaICB - International Competitive BiddingLCB - Local Competitive BiddingI&PD - Irrigation and Power DepartmentMIP - Medium Irrigation Project
GLOSSARY
amin - surveyorchak - outletchakas - consolidated plotskalassis - manual worker employed for operation and maintenance of
irrigation systemwarabundi - rotational system of irrigation
FISCAL YEAR
GOI, GOO and agencies - April 1 - March 31ARDC, Cooperatives - July 1 - June 30Commercial Banks - January - December 31
This document has a rstricted distrbution and may be w_ by recipients only in the performanceof their official dutie. Its contens mAy not otherwise be disclosed without World Bank authorization.

INDIA
ORISSA IRRIGATION PROJECT
TABLE OF CONTENTS
Page No.
SUMMARY AND CONCLUSIONS ....................... ...... i - iii
I. INTRODUCTION ........................................ ............ I
II. BACKGROUND ............................................ ...... 1
General ............................................. 1Agriculture and Irrigation in India ................ 2
III. STATE OF ORISSA .................................... 3
General .......................................... ............. 3
Climate . ................ .......... ............... * * * * * .* 3
Topography and Soils ........ . . . . . ................. ............ 4
Socio-Economic Conditions ... . ....................... 4
Agricultural Development ...........-................ 4
Irrigation Development ............................. 5
Project Formulation . .................. ............ . 7
IV. THE PROJECT ....................................... 8
Scope of the Project ............... ............... . 8
Medium Irrigation Projects 9........... ....... . 9
General ............... 9
Criteria for Medium Irrigation Projects .10
Command Area Development ..... ................ 11
General ........................................ 1
Land Consolidation .. .............. . ........... . 11
On-Farm Works ..................... ............ . 12
V. COST ESTIMATES AND FINANCIAL ARRANGEMENTS .......... 12
Cost Estimates ............................................... 0.... 12
Financing ........ ....................... .......... 13
Procurement ........................................ ............. 14
Disbursements . ............ ............ ... ... ....... 15
Accounts and Audits . .................. ............. 15
Cost Recovery ...... ...... a ............ ..... ........ 16
-2-
TABLE OF CONTENTS (cont'd)
Page No.
VI. ORGANIZATION AND MANAGEMENT ..... ................... 17
Medium Irrigation Projects ......................... 17
Orissa Irrigation and PowerDepartment (I&PD) ....... .............. sees 17
The Appraisal Committee of the CentralWater Commission s...0........................ 17
Procedures for Medium Irrigation Projects ..... 18Progress Review and Reporting Requirements .... 20Project Evaluation .........o . . . ... . . .o.o.e. .*o. . . . . 20
Command Area Development 21
Command Area Development Organizations *...... . 21Land Consolidation Process .................... 21Consolidation Organization .................... 22On-Farm Works .. ...... .s.e.e.s *.................... 22
VII. BENEFITS AND JUSTIFICATION ......................... 23
General ..... ...... o...............o.o..... 23Income Effects ..... 0. ................................ 23Economic Rates of Return ..se...................... 24Environmental Effects ....... a................ . -. 24Project Risks ...o..... ...... 0.00.....00.0 .... 24
VIII. AGREEMENTS REACHED AND RECOMMENDATIONS ... oo.......... 25
ANNEXES
1. The State of Orissa2. Medium Irrigation Projects3. Command Area Development4. Schedule of Expenditures, Proposed Allocation of the Credit
and Estimated Schedule of Disbursements5. Support Materials for Economic and Financial Analyses
MAPS
Soil Types - IBRD 12766Monsoon Rainfall - IBRD 12767Existing Irrigated Areas & Potential Medium IrrigationProjects - IBRD 12768
Land Cover - Land Use Association
INDIA
ORISSA IRRIGATION PROJECT
SUMMARY AND CONCLUSIONS
i. The State of Orissa, with a population of 26 M and 6.8 M ha of culti-vable land, is predominantly rural. The State has relatively fertile alluvialsoils, plentiful monsoon rains, and considerable, but largely unexploited waterresources. However, due to inadequate agricultural supporting services andinefficient use of existing irrigation systems, foodgrain yields are low andagricultural production has been virtually stagnant during the last decade.
ii. A review of Orissa's foodgrain potential and development constraintswas undertaken by IDA, FAO/CP, and the Governments of India (GOI) and Orissa(GOO) in 1975. Based on the findings, the Orissa Agricultural DevelopmentProject (Credit No. 682-IN, 1977, US$20.0 M) was formulated. The project isdesigned to strengthen agricultural supporting services, particularly ex-tension and research. It is aimed primarily at relieving the short-termconstraints tc foodgrain production. Experience from other parts of Indiahas indicated, however, that in the long run, irrigation is a prerequisitefor sustained growth in agricultural production. Private groundwater devel-opment, partly financed through the Agricultural Refinance Development Corp-oration (ARDC) with Bank Group assistance (Credit. No. 715-IN, 1977,US$200.0 M) is helping to increase the irrigated area in Orissa. The proposedproject would extend irrigation to areas inadequately served by groundwaterand improve water utilization in selected major irrigation systems.
iii. Orissa's irrigation development has been concentrated in the rela-tively more prosperous delta of large rivers such as the Mahanadi. This hasresulted in uneven distribution of irrigation benefits and regionally un-balanced growth. To correct this imbalance, the GOO in 1960 began construc-ting a number of medium irrigation projects (MIPs), utilizing numerous smallrivers throughout the State. In support of the GOO's development plan, theproposed project would finance construction, over a five year period, of about15 MIPs, covering about 66,000 ha throughout the State. In addition, theproject would support a command area development (CAD) program consistingof land consolidation on about 200,000 ha and on-farms works on 57,000 ha.These measures would greatly improve water use in three of the State's majorirrigation systems.
iv. Medium irrigation projects encompass cultivable command areas of2,000 to 12,000 ha. Each MIP is generally composed of an earthfill stor-age dam with a gated spillway, an unlined canal system which would deliverwater through outlets serving 5 ha blocks and a drainage network connectedto major natural drains. The average cost of MIPs is about Rs 11,000(US$1,220) per ha of cultivable command area.
v. In view of the large number of MIPs to be financed under the proposedcredit (about 15 MIPs) and their relatively small size, appraisal and progress
- IL -
review by IDA of individual MIPs would not be practical. Instead, under thegeneral guidance of IDA, the Central Water Commission (CWC) of GOI wouldappraise and monitor the progress of individual MIPs in accordance withtechnical and economic criteria and procedures agreed with IDA. This approachwould strengthen local capabilities for project appraisal, planning, designand implementation and, thus, lead to a general improvement in the technicaland economic viability of all projects in the irrigation sector.
vi. The command area development program would be extended to the threeexisting irrigation projects in Orissa -- Mahanadi Delta, Hirakud and Salandi.In the existing highly fragmented land holding pattern, construction ofon-farm works can be possible only following consolidation to make rotationalirrigation manageable to the farmers. In addition, experience from CAD pilotoperations in Orissa and from other States where large scale CAD has beenattempted suggest that major obstacles to the successful implementation ofsuch programs are: (a) obtaining rights-of-way for field channels and drainswithout payment of compensation for land; and (b) the large number of farmersineligible for bank loans due to unclear titles. Both obstacles would beremoved in the course of land consolidation which would precede the construc-tion of on-farm works.
vii. The Irrigation and Power Department (I&PD) of GOO would be respon-sible for the planning, design, implementation, and operation and maintenanceof MIPs. Coordination committees would be established at State and projectlevels to ensure better interdepartmental cooperation, especially with theDirectorate of Agriculture and Food Production (DAFP). Such coordination isessential both in project preparation and operation.
viii. Potential MIPs were identified in the Master Plan of 1972 for irri-gation development. Procedures for establishing the eligibility of MIPs tobe financed under the project include the following steps: (a) the prioritiesfor preparation of MIPs are established by the Secretary of Irrigation andPower after consultation with concerned GOO departments; (b) subsequent to theapproval of GOO Technical and Administrative departments and the GOI PlanningCommission, the MIPs are submitted to CWC for appraisal. The Appraisal Com-mittee (AC), consisting of engineers, agriculturalists and economists would beestablished in the CWC for this purpose; (c) the AC would visit the projectarea and prepare a Project Summary for each MIP; and (d) if the MIP meets allestablished criteria, costs less than Rs 70 M (US$7.8 M) and has an economicrate of return exceeding 12%, the CWC would be authorized to approve theproject. In all other cases, the project would be reviewed in detail by IDAbefore a decision is made whether to include the project in the credit.
ix. The AC would also closely monitor the progress of preparation,implementation and operation of the MIPs. Frequent progress reports wouldbe submitted to IDA. The main activities of IDA would be to: (a) assess thequality of AC appraisal and review work; (b) spot check whether agreed crite-ria have been followed; (c) review the financial records kept by GOI and GOO;(d) review procurement procedures; (e) review the appropriateness of theestablished criteria; and (f) review the content and frequency of the reportsto be submitted by CWC to IDA.
- iii -
x.. The Consolidation Unit of the Revenue Department would carry out the
land consolidation program. The Agriculture Engineering Organization of theDirectorate of Agriculture and Food Production (DAFP) would be responsible forthe planning, design and implementation of on-farm works. Their activitieswould be coordinated by the three Command Area Development Authorities (CADAs),which were recently established to ensure full cooperation among various de-partments concerned with CAD. Chak Level Operating Committees would be es-tablished for water distribution within the turnout areas (chaks) and formaintenance of the on-farm works.
xi. Total project costs are estimated at US$116.0 M, which include amedium irrigation projects component of US$81.1 M, land consolidation ofUS$6.7 M, on-farm works of US$4.1 M and overall price contingencies ofUS$24.1 M. The proposed credit of US$58.0 M would finance the foreignexchange costs (US$20.0 M) and about 40% of local costs or about 50% oftotal project cost. The GOI would relend the proceeds of the credit (exceptdisbursement for on-farm works which would be relent to ARDC) to the GOO inaccordance with its standard arrangements for State development projects.Land consolidation works would be financed from the GOO budget; on-farmworks would be financed by farmers using loans from commercial and landdevelopment banks. On-farm development loans would be refinanced by theAgricultural Refinance and Development Corporation (ARDC) at a rate of 90%.Farmers who are ineligible for ordinary loans from barks, mostly due tounclear title, would be financed from a revolving fund set up in ARDC andfunded through GOI, ARDC and GOO contributions.
xii. Civil works, which are scattered throughout the State and restrictedto seasonal construction would be best carried out by labor intensive methods.The works would not be practical to group into large contracts and, thus, wouldbe unsuitable for international competitive bidding. They would be tendered inaccordance with GOO's standard procedures which are satisfactory. No equipmentwould be procured under the project.
xiii. At full development (about mid-1980s), the project would increaseannual foodgrain production by some 110,000 tons, resulting in a net foreignexchange saving of about US$20 M, and generate about 34,000 and 13,000 addi-tional full time jobs in farm and non-farm sectors, respectively. It wouldalso increase net farm incomes in the presently rainfed areas on the averageof 180% and in the irrigated areas through CAD by about 16-33% and, thus, re-duce the rural poverty considerably. An additional advantage of the projectwould be the geographically wider distribution of direct and indirect benefitsfrom irrigation, which would induce a more even economic growth in the State.
xiv. The economic rates of return for the MIP and CAD components are 18%and 34%, respectively. The overall rate of return for the project is estimatedat 20%. The project is suitable for a credit of US$58.0 M on standard IDAterms. The Borrower would be the Government of India.

INDIA
ORISSA IRRIGATION PROJECT
I. INTRODUCTION
1.01 The State of Orissa, located in the Eastern Region of India, is wellendowed with relatively fertile alluvial soils, plentiful monsoon rains and
considerable but largely unexploited water resources. Yet, foodgrain yields
are generally lower than the national average and most social and economicindicators are inferior to the rest of India.
1.02 The Government of India (GOI) has requested IDA assistance in financ-
ing medium irrigation projects (MIPs) and command area development (CAD) in
Orissa. Utilizing numerous small rivers located throughout the State, theproject would provide irrigation to areas where large scale development and
groundwater exploitation are not feasible. It would also improve water useefficiency at the farm level in existing major irrigation systems through the
CAD program.
1.03 The proposed project, financed by the Agricultural Refinance andDevelopment Corporation from the line of credit made available by IDA (Credit
No. 715-IN, US$200.0 M), and the Orissa Agricultural Development Project(Credit No. 682-IN, 1977, US$20.0 M), was formulated after a review of Orissa's
agricultural potential and development constraints, undertaken jointly by IDA,FAO/CP, GOI and the Government of Orissa (GOO) in 1975. This report is basedon the findings of a mission to India in October/ November 1976 comprising
Messrs. P. Ljung, S. Baker, W. van Tuijl and Ms. M. Nguyen (IDA) and Mr. U Hpu
(Consultant). The GOO was assisted in preparing the CAD component by a teamfrom the FAO/IBRD Cooperative Programme (Report No. 22/76 IND 31). In the
course of the appraisal, the mission was also joined by staff from the CentralWater Commission of GOI.
II. BACKGROUND
General
2.01 India covers some 3.27 M km2 of which 49% is cultivable and about11% irrigated. India's population of about 630 M is growing at an annualrate of 2.3%. National income has grown at nearly 4% per annum since 1950,and the per capita GNP reached US$150 in 1975. Although average per capitaincome has increased, in general there has been little change in the livingstandards of the vast masses of urban and rural poor, which -- conservativelymeasured -- consist of some 200 M people with incomes below the poverty lineof US$60 per capita per year. Thus, the Government's development plans giveemphasis to alleviating poverty and creating employment, especially in ruralareas.
-2-
Agriculture and Irrigation in India
2.02 Agriculture is the dominant sector of the Indian economy and con-tributes about 45% of GNP. It engages about 70% of the labor force andprovides the base for about 60% of India's exports. During the last decade,GOI development plans have emphasized agriculture and sought to raise foodgrainproduction by increasing the use of fertilizers, plant protection chemicals,and improved seed varieties. In support of this, GOI has modernized andexpanded its agricultural credit institutions and accelerated the developmentof irrigation.
2.03 Despite these endeavors and the impressive results of the greenrevolution in some areas -- primarily the wheat growing northwestern states --the annual overall growth rate in foodgrain production over the last 15 yearshas been only about 2.3% or approximately equal to the population growth.Furthermore, India's agriculture remains heavily dependent upon the vagariesof weather, and foodgrain production can vary as much as 20% from one yearto another. Major factors in reducing this dependence would be the expansionof irrigation and the improvement of existing irrigation facilities.
2.04 Up to 1964/65, irrigated area increased at a rate of only about 2.1%per year, of which approximately two-thirds was from surface water resourcesand one-third from groundwater. Since then, the rate of increase has aboutdoubled, mainly through an accelerated program of groundwater development. Atpresent, the irrigated area is 42 M ha, about three-fifths of which is surfaceirrigated and two-fifths groundwater irrigated.
2.05 The pace of groundwater development has fallen off recently becausethe limit of groundwater resources is being approached in the northwesternstates. In the northeastern states with excellent groundwater potential, thepace of development is currently hampered by institutional constraints, espe-cially the lack of a well established agricultural credit structure.
2.06 The pace of surface water development has increased only slightlyover the past 25 years except for a moderate acceleration within the last twoyears. Plan targets set by GOI for a more rapid development of surface irri-gation have never been fulfilled. A major problem has been the continuingpressure to start a large number of projects, which with the limited resourceshas resulted in long construction periods for all projects. However, inrecent years, Indian authorities have made certain efforts to complete ongoingprojects.
2.07 In most completed projects, actual utilization is significantlyless than irrigation potential. Consequently, in the Fifth Plan (1974/75 toto 1978/79), increased emphasis has been given to "command area development,"which involves public investments to enable a better utilization of irrigationwater (drainage, roads, markets, agricultural extension and research) aswell as private investments to improve water use efficiency at the farm level(watercourse lining, field channels and drains, land shaping and leveling).
-3-
However, insufficient attention has been paid so far to the formulation of
realistic planning and design criteria for irrigation works. In particular,water losses assumed in the design of the conveyance system are generally much
lower than actual losses.
III. STATE OF ORISSA
General
3.01 The State of Orissa, covering some 15.5 M ha, is located in the
Eastern Region. Its population of about 26 M is predominantly rural and itsurbanization rate (8%) is one of the lowest in India. State per capita income
is about Rs 900 (US$100), which is only two-thirds of the national average
(US$150).
3.02 The 1975 review 1/ of Orissa's agricultural potential and develop-
ment constraints, undertaken jointly by IDA, GOI and GOO, concluded that theState's climate, soils and irrigation potential offered good opportunities for
accelerated agricultural development. However, the pace of development is
constrained by: ineffective agricultural extension services; inadequatesystems for delivery of farm inputs; small and fragmented holdings; largenumbers of disadvantaged groups (Schedule Castes and Tribes); poor utilizationof available water resources; and lack of coordinated planning. As a result,
the Orissa Agricultural Development Project (Credit 682-IN), is now beingimplemented to alleviate short-term constraints on both rainfed and irrigated
agriculture primarily through extension and research. In addition, the BankGroup supports groundwater development through the second line of credit to
the Agricultural Refinance and Development Corporation (Credit 715-IN). Theproposed Orissa Irrigation Project would expand the area under surface irri-
gation in the State and improve water utilization in existing surface irri-gation systems.
Climate
3.03 Orissa has a tropical monsoon climate with temperatures that aresuitable for year round cropping. Annual rainfall ranges from about 1,200 mm
in the southern Coastal Plain to about 1,700 mm in the Northern Plateau (para
3.04) and averages about 1,500 mm. Some 85% of rainfall occurs during thekharif season (June to October). However, variation in amount (as highas 50% from one year to the next) and timeliness are significant, which makes
supplementary irrigation during the kharif season necessary for high and
stable yields. Due to low rainfall, intensive cropping in the rabi season
(November to April) is not feasible without irrigation.
1/ "India: Eastern Region Foodgrains Production Review (Orissa)", IBRDReport No. 972--IN, February 1976.
-4-
Topography and Soils
3.04 On the basis of physical features and agro-climatic conditions,Orissa may be roughly divided into four zones: (i) the Northern Plateau (23%of the State's area) characterized by hill ranges rising to elevations of 2,000ft to 3,000 ft above sea level; (ii) the Central Table Land (23%), generallyflat with slightly undulating and folded topography, rising to elevations of1,000 ft; (iii) the Eastern Ghat Region (36%) with hill ranges along with someplains and valleys lying between them, with elevations of the plateaus rangingfrom 900 ft to 2,000 ft, and (iv) the Coastal Plain (18%) characterized by anumber of deltas.
3.05 Two types of soils are generally found in Orissa: residual soilsof the uplands, and transported alluvial soils of the lowlands. Residualsoils are predominantly lateritic, highly leached, acidic and low in nitrogenand organic matter. They tend to be shallow, sandy and erodible and have lowwater retention capacity. Transported soils are moderately fertile, lessacidic and more productive than the residual and they are suitable forpaddy.
Socio-Economic Conditions
3.06 About 60% of the population have incomes below the poverty line(US$60). The population is stratified along caste, class and tribal lines,with the Schedule Castes and Tribes making up about 38% of the total popula-tion, varying from 20% in the coastal areas to 70% in inland areas. Thelabor force constitutes 31% of the total population. Cultivators and agricul-tural laborers account for 49% and 28% of the labor force, respectively.
3.07 "Small" and "marginal" farmers (less than 2 ha) operate over 75%of all holdings but control less than 40% of cultivable land, while farmerswith 5 ha or more (less than 7% of holdings) control about 35%. The skeweddistribution of holdings is further complicated by land fragmentation; inthe delta areas an average farm (2 ha) comprises about 12 plots. Accordingto the 1970-71 Agricultural Census, about 92% of cultivable land is owneroperated. Share-cropping is the predominant form of tenancy.
Agricultural Development
3.08 Production and Yields. Agriculture dominates Orissa's economy, con-tributes about 60% of the gross domestic product and employs about 77% of thetotal labor force. The net cultivated area is about 6.8 M ha. Paddy is themost important crop (70% of the cropped area) but yields are low: 1.1 tonsper ha for rainfed, 1.6 tons for irrigated kharif paddy and 2.0 tons for ir-rigated rabi paddy. High yielding paddy varieties account for most of therabi crop but only for about 10% the kharif crop. Other crops such as cereals(7% of the cropped area), pulses (14%), oilseeds (6%), fibers (1%) and vege-tables (2%) are grown mostly in upland areas. The cropping intensity isgreater in the coastal districts (134%) than in the inland areas (118%) and
-5-
averages about 125% for the State. Agricultural production has virtually
stagnated since the mid-1960s. Rice production in 1973/74 (4.4 M tons) re-
mained the same as in 1964/65.
3.09 Agricultural Extension and Training. The extension service is nowbeing reorganized, under the Orissa Agricultural Development Project, with a
single line of command from the Director of Agriculture to the Village level
Workers (VLW). The VLW will work only on extension, covering 400 to 800
farmers, through a system of visiting groups of 50 to 100 farmers on a regular
basis every two weeks. The link between extension and research is also being
strengthened.
3.10 Agricultural Research. This is carried out by the Orissa University
of Agriculture and Technology (OUAT) and the Central Rice Research Institute of
the Indian Council of Agricultural Research, located in the State. Researchcovers the development of improved varieties of rice, cereals, pulses and
oilseeds as well as the economic evaluation of cropping systems, pest and
disease control and rainfed agriculture. The Orissa Agricultural DevelopmentProject supports an improved adaptive research program.
3.11 Agricultural Inputs. The use of cash inputs, such as fertilizers,improved seeds and pesticides is presently low, primarily due to ineffective
agricultural extension and a poor distribution system. An all-India project to
improve input storage and distribution, which would also cover Orissa, is nowunder preparation by IDA and the National Cooperative Development Corporation.
Marketing and processing facilities are more than adequate for present needs,with larger rice mills operating at only one-third capacity. Institutional
credit is mostly provided by the cooperative system but loan recovery has
generally been poor. However, in recent years, recovery has improved due tothe implementation of remedial measures recommended by the Reserve Bank of
India and the Agriculture Refinance Development Corporation (ARDC).
Irrigation Development
3.12 Irrigation Potential. Orissa has abundant water resources that arelargely undeveloped. Its extensive netwo5k of rivers, streams and drainage
ways annually discharges about 100,000 Mm into the Bay of Bengal. In addition,
the annual flow of groundwater into the sea is estimated at some 30,000 Mm .
Theoretically, these water resources could irrigate some 15 M ha. However, the
potential for utilization of these resources is limited by a number of factors:
(i) more than 80% of the surface flow occurs during the June-September periodwhen the need for irrigation water is the lowest; (ii) topography is not con-
ducive to the construction of major dams; (iii) inflows from upper riparian
states are likely to be substantially reduced; and (iv) about 80% of the
groundwater resources are in the Coastal Plain (para 3.04) which is alreadywell served by surface irrigation systems. Taking these constraints into
account, it is estimated that the irrigation potential and the present util-
ization of water resources are as follows:
Irrigation (in 21 ha)Actual 73/74 Potential Utilization
Kharif Rabi Total Kharif Rabi Total % of Potential
Major 0.57 0.30 0.87Medium 0.08 0.02 0.10 2.25 0.90 3.15 31
Minor 0.59 0.04 0.63 1.00 0.25 1.25 50Lift andWell 0.03 0.02 0.05 1.80 1.20 3.00 2
Total 1.27 0.38 1.65 5.05 2.35 7.40 22
3.13 Major Irrigation Projects (over 12,000 ha). Construction of majorschemes started towards the end of the nineteenth century, when irrigationcanals commanding about 150,000 ha were built in the Mahanadi and RushikulyaDeltas. During the first half of this century, the canal irrigated area re-mained virtually unchanged. However, since 1950, GOO has completed two majorschemes, the Salandi and Hirakud projects, and substantially extended theMahanadi Delta system. The area presently commanded is about 0.57 M ha, andwhen two major multipurpose schemes and one major irrigation project, now underconstruction, are completed in the mid-1980s, the area commanded by majorprojects will increase to about 1.0 M ha.
3.14 The Salandi Irrigation Project (Credit No. 14-IN, 1961, US$8.0 M)was one of the first irrigation projects supported by the Bank Group in India.Project implementation and disbursements were slow, mainly due to designmodifications and procurement difficulties. Like other Indian irrigationprojects financed by the Bank Group at about the same time, the Salandi Proj-ect did not achieve its agricultural potential due to inadequate supportingservices and lagging construction of field channels and drains by the farmers.These problems have led GOI and the Bank Group to adopt a more integratedapproach to irrigation development rather than focusing only on the construc-tion of dams and canals (para 2.07).
3.15 Medium Irrigation Proiects (2,000-12,000 ha). Past irrigationdevelopment has been concentrated in the more prosperous delta areas oflarge rivers. This has resulted in uneven distribution of irrigation bene-fits and regionally unbalanced growth. In order to correct this imbalance,GOO started, around 1960, to construct a number of medium irrigation projects(MIPs) throughout the State, particularly in areas where large scale irri-gation and groundwater development are not feasible. However, the commit-ment to these projects was low and many MIPs were under construction for10-15 years. At the start of the Fifth Five Year Plan in 1974/75, theemphasis changed from major to medium projects, and since then, GOO hasmade a concerted effort to speed up implementation; of the 29 MIPs underconstruction in 1975/76, 13 either have been or will be completed during1977/78.
- 7 -
3.16 Minor Surface Irrigation Projects (less than 2,000 ha). For cen-turies, Orissa farmers have used bucket-lift and other traditional irri-gation methods. They have also constructed tanks for storage of local runoffduring the monsoon. Typically, these schemes provide supplementary irrigationduring the kharif and the area irrigated varies substantially from year toyear. Because of the low reliability of irrigation supply, these schemesare given lower priority than major and medium projects and the area irrigatedhas remained virtually unchanged since 1950.
3.17 Groundwater. Orissa's groundwater potential remained largely un-developed until the mid-1960s. Since the Orissa Lift Irrigation Corporation(OLIC) was created in 1973, groundwater development has accelerated, andcurrently, there are some 90,000 dug wells and 700 tubewells supplying irriga-tion to 50,000 ha. A plan prepared by ARDC and OLIC proposes developmentof 200,000 dug wells, 15,000 private tubewells and 2,250 public tubewellsfor groundwater irrigation of an additional 295,000 ha by 1978/79 (para 3.02).
3.18 Investment Budget for Surface Irrigation (Annex 2). Expenditures onmedium and major irrigation projects have increased rapidly since the begin-ning of the Fifth Five Year Plan and are anticipated to increase as follows:
Actual AnticipatedYear 1974/75 1975/76 1976/77 1977/78 1978/79 Total
US$ Million 9.1 15.9 24.4 25.4 34.2 109.4
Major irrigation projects account for about 40% of actual and planned ex-penditures and medium projects for 60%. The Sixth Plan is presently in itsearly stages of preparation. However, it is likely that investments forsurface irrigation will at least remain at their present levels in real terms.
Project Formulation
3.19 In general neither major nor medium irrigation projects have yieldedbenefits to the full extent of their potential. Reasons for this poor perform-ance include:
(i) Water losses in the conveyance system and on fields aregrossly underestimated at the design stage, resulting inthe area actually irrigated being considerably smallerthan the area commanded by the distribution system.
(ii) Incomplete water conveyance systems and inadequate drainageat the farm level. Water at present is supplied throughoutlets serving 40 ha blocks, and the farmers are expectedto construct field channels and drains within these blocks.There is no effective organization to help farmers withthe design, implementation and financing of these works.Consequently, virtually no field channels and drains havebeen constructed. This has resulted in ineffective wateruse, shortages in some parts of the blocks, and water-logging in others.
-8-
(iii) Lack of integrated development of the irrigated areas;typically there is little input from the agricultural staffin the design and operation of irrigation systems. Theagricultural extension service is only partly effective inteaching the farmers cultivation practices suitable forirrigated crops and improved farm water management.
(iv) Severe fragmentation of holdings in the densely populateddelta areas, where a typical 2 ha farm consists of about12 plots. This hinders effective farm operations and, inparticular, it makes water deliveries on a rotationalbasis (warabundi) unmanageable for the farmer.
(v) Inadequate planning and preparation of medium irrigationprojects. Usually only rudimentary basic data are col-lected and analyzed before construction of a project.The hydrological data base is typically poor which resultsin over- or under-design of the dam and the irrigationnetwork in relation to the water de facto available. Soilsurveys and agro-economic surveys are not carried out, anddesigns are often based on cropping patterns that are un-likely to be adopted by the farmers or, if they were adopted,would lead to uneconomic use of irrigation water.
3.20 The project would support GOO's plans to spread irrigation devel-opment from the coastal areas of the State (where irrigation has long beenestablished) more evenly throughout the State by financing medium irrigationprojects. These projects would be designed and constructed in accordancewith criteria which are aimed at alleviating existing problems (para 3.19).In addition, the project would improve water use efficiency at the farm levelin three existing major irrigation schemes through a command area development(CAD) program.
IV. THE PROJECT
A. Scope of the Project
4.01 The project would include:
(a) construction, over a five year period, medium irrigationprojects, covering about 66,000 ha throughout the State;
(b) command area development in three existing majorirrigation systems -- Hirakud, Salandi andMahanadi Delta -- consisting of (i) consolidationof about 200,000 ha of irrigated land and (ii)
-9-
construction of on-farm works (field channelsand drains, access crossings, and other asso-ciated structures) on a consolidated area ofabout 57,000 ha.
B. Medium Irrigation Prolects
General
4.02 Medium irrigation projects (MIPs) encompass cultivable commandareas of 2,000 to 12,000 ha. Each MIP is generally composed of: (i) anearthfill storage dam with a gated spillway; (ii) an unlined canal networkwhich would deliver water through outlets serving 5 ha blocks,l/ and (iii)a drainage network connected to major natural drains. Typically, about80%-90% of the command area is irrigated in khariff and 40%-50% in rabi.The average cost is about Rs 11,000 (US$1,220) per ha of cultivable commandarea, ranging from Rs 9,000 (US$1,000) to Rs 14,000 (US$1,550). This issubstantially higher than the cost of about Rs 8,000 (US$890) per ha formost unlined major irrigation schemes. In general, however, MIPs have shor-ter gestation periods and thus yield somewhat quicker benefits. Normally,the dam accounts for about two-thirds of the cost of a MIP and the conveyanceand drainage networks together for about one-third.
4.03 The proposed IDA credit would finance, over a five year period, anyMIP meeting technical and economic criteria agreed with IDA (paras 4.04-4.10).It is estimated about one-third of the 19 MIPs now under construction wouldbe modified to meet these criteria and that between 8 to 10 new MIPs, designedspecifically to meet the criteria, would be started under the credit. In viewof the large number of MIPs involved, appraisal and progress review by IDA ofindividual MIPs would not be practical. Instead, under the general guidanceof IDA, the Central Water Commission (CWC) of GOI (paras 6.03-6.04) wouldappraise and monitor the progress of individual MIPs in accordance with cri-teria (paras 4.04-4.10) and procedures (paras 6.05-6.17) agreed upon with IDA.This procedure would enable a more even spread of IDA assisted irrigationbenefit. It would also provide an opportunity to: first, review in depth,and get fully involved in, the largest part of Orissa's irrigation sectorin the near future and to make a major impact, State-wide, on technical andeconomic standards applied in medium irrigation projects; second, build up acapable and responsible unit at the Center that would have the potential toassume, gradually, responsibilities also for other irrigation projects.
1/ For the major projects, CAD organizations would be established for im-plementation of on-farm works below the outlets that serve 40 ha blocks(paras 4.11 and 6.19). Since the numerous MIPs would be widely locatedthroughout the State, it would at this stage of development be neitherpractical nor administratively feasible to establish a CAD organizationfor each MIP. In these new projects, proper water supply to each farmwould instead be ensured by extending the canal system down to turnoutsserving 5 ha blocks.
Criteria for Medium Irrigation Projects
4.04 Basic data requirements, specific criteria for planning, designand construction, and a minimum level of economic viability have been estab-lished for each MIP to be financed under the project. An agreement has beenreached with GOI and GOO that MIPs to be financed under the IDA credit wouldbe designed, constructed and completed in accordance with these requirementsand criteria which are detailed in Annex 2 and summarized below:
4.05 Basic Data Requirements: (i) a land classification map based on asoil survey; (ii) an agro-economic survey to provide a basis for future agri-cultural, social and economic development planning; (iii) rainfall records inor near the project catchment area for a minimum of 20 years; (iv) a 20 yearrunoff estimate based on streamflow measurements with current meters corre-lated with observed rainfall data; and (v) sediment samples at or near eachdam site for determination of reservoir sediment storage capacity.
4.06 Water Requirements and Reservoir Operation Studies: (i) Christian-sen's equivalent, or an equivalent method would be used to estimate crop waterrequirements; (ii) water requirements for rice would include allowance forsaturation, evaporation and percolation; (iii) assumed field irrigation effi-ciencies would not be greater than 90% for rice and 60% for other crops; (iv)assumed canal conveyance efficiencies would not be greater than 70% for systemsflowing at more than 80% of capacity and 60% for systems flowing at lessthan 80% of capacity; (v) command area and active reservoir capacity would besuch that full kharif irrigation requirements would be met in 75 years out of100; (vi) the average area to be irrigated in rabi would be established througha 20-year reservoir operations study; and (vii) a minimum 50 year sedimentcapacity would be provided in the reservoir.
4.07 Design Criteria: (i) watercourses and turnouts would serve irriga-ble areas no larger than 5 ha each; (ii) minor canals would be designed forrotational (warabundi) irrigation, with special attention given to peakcapacity requirements; (iii) canals and minor watercourses would be designedwith structures to permit full irrigation deliveries to all commanded areawhen flows are less than 50% of capacity; (iv) the unit hydrograph anddesign storm method would be used in conjunction with the regional formula(Dicken's enveloped curve floods) to estimate the required spillway capacity;and (v) an emergency spillway would be provided where favorable topographyexists.
4.08 Construction: (i) land clearing and shaping on presently unculti-vated land would be done prior to the delivery of water; (ii) canal embank-ments and the invert of the canal would be mechanically compacted when theinvert is in fill; (iii) earthfill around structures would be mechanicallycompacted; and (iv) construction of each project would be completed withinfive years.
4.09 Cost Estimates: (i) cost estimates would be based on bid pricesprevailing in the project area at the time of appraisal; (ii) cost estimateswould include: a physical contingency factor of 20% of construction costs,
- 11 -
and costs for administration, design and supervision (normally about 15% ofthe construction cost), land acquisition, and resettlement of familiesdisplaced by the project.
4.10 Economic Criteria: (i) individual sub-projects would have a benefit-cost ratio exceeding 1.0 based on annual net benefits and investment costsdiscounted at a 12% interest rate; (ii) the benefit-cost ratio would beestablished by using techniques set out in the "Form for establishing theeconomic viability of medium irrigation projects" (Annex 2, Appendix 1,pages 5-6); and (iii) cost of land acquisition would be excluded; and (iv)cost of land clearing and shaping on presently uncultivated land would beincluded.
C. Command Area Development
General
4.11 The command area development (CAD) program would cover about 200,000ha in three of Orissa's major irrigation systems -- the Hirakud, Salandi andMahanadi Delta schemes. The main objective of the program would be to opti-mize the productive use of available water resources. This would be achievedthrough land consolidation and provision of irrigation and drainage facilitiesat the farm level together with associated control structures, lining of cri-tical water course sections and proper land development. Water distributionto each farm would be ensured and proper drainage would eliminate waterloggingin low lying areas. Results from pilot operations in Orissa, covering atotal of about 5,000 ha in various command areas, indicate that the likelybenefits would be a 20% to 30% increase in yields and water savings that wouldpermit a 20% to 30% increase in the irrigated area.
4.12 Experiences from pilot operations in Orissa and elsewhere in India,where large scale CAD has been attempted, suggest that major obstacles to thesuccessful implementation of such programs are: (i) obtaining rights-of-wayfor field channels and drains without compensation; and (ii) the large numberof farmers ineligible for bank loans due to unclear titles. Both these ob-stacles would be removed in the course of land consolidation which wouldprecede construction of on-farm works.
Land Consolidation
4.13 Land fragmentation in Orissa has been a constraint to intensifiedagriculture. In 1972, GOO introduced the "Orissa Consolidation of Holdings
and Prevention of Fragmentation Act", which enables the rearrangement andredistribution of land in compact rectangular blocks. In the course of landconsolidation, land titles are cleared and land is set aside for communalpurposes such as field channels and drains. Under the CAD program, the align-ment of field channels and drains would be coordinated with the layout of thechakas (consolidated plots) so that each holding would be ensured direct andindependent access to an irrigation and drainage channel. Topographical
- 12 -
surveys for on-farm works would be undertaken during the consolidation pro-
cess. Since the start of the land consolidation program in 1974, about
15,000 ha have been consolidated and work is underway on about 160,000 ha
in the three command areas. Since the consolidation process takes about
2-1/2 to 3 years (paras 6.21-6.22), a 200,000 ha is a realistic target for
a four year implementation period.
On-Farm Works
4.14 Topographical surveys would be carried out on a 30 m x 30 m grid
with contours of 0.30 m intervals. Layout plans, designs for field channels
and drains would be made for each chak (area served by an irrigation turnout)
at the same time as the holdings are consolidated. Rights-of-way for channels
and drains would be located along the realigned boundaries of the holdings.
4.15 Field channels would be designed as an extension of the main
canal system. They would be provided with masonry checks, turnouts and drop
structures. It is estimated that lining would be required for about 20% of
the total length of the field channels, principally in the main stem near thehead reaches of the channels. Where natural drainage is inadequate, field
drains would be constructed to: (i) reduce the area, depth and duration of
flooding during heavy rains; (ii) provide drainage of paddy fields when needed;
and (iii) intercept groundwater flow, particularly the seepage from irrigation.
4.16 Principal field channels would have an escape to a drain and each
farm would be provided with an outlet to a field drain. Access to fields
is traditionally available by informal rights-of-way, which connect with
public roads. Permanent structures would be provided where field channels
and drains cross access tracks and roads. Land shaping and leveling wouldnot be required since most of the irrigated areas are already bunded andleveled.
4.17 Construction of field channels and drains, which is mostly earthwork
and masonry (drop structures, division boxes, farm outlets) would be done by
manual labor. The construction would be supervised by the staff of the Agri-
cultural Engineering Organization (para 6.25). Since no large scale on-farmdevelopment has previously been undertaken in Orissa, the implementation pro-
gram would be limited to 57,000 ha over a four year period.
V. COST ESTIMATES AND FINANCIAL ARRANGEMENTS
Cost Estimates
5.01 Medium Irrigated Projects (Annex 2). The project would support a
five year time-slice of Orissa's medium irrigation program, which is proj-
ected to amount to about US$125.7 M. The proposed IDA credit would finance
all expenditures on MIPs, designed and constructed in accordance with the
agreed criteria (paras 4.04-4.10), during the 1977/78-1981/82 period. On-going MIPs and MIPs started in 1977/78 would be completed under the project
- 13 -
while MIPs started in 1978/79 or later would only be financed up to 1981/82.However, any MIP started under the project would be completed in accordancewith the agreed criteria. The five-year expenditures on MIPs that meet thecriteria are estimated atUS$102.7 M,comprising US$59.2 M for new and US$43.5 Mfor ongoing MIPs. This amount includes US$21.6 M in expected price increasescalculated at an annual inflation rate of 8%.
5.02 Command Area Development (Annex 3). The cost of the CAD componentincludes consolidation and on-farm works, estimated at Rs 300 per ha andat Rs 650 per ha, respectively. Total cost for this component would amountto US$13.3 M, including physical contingencies (20% of cost of works), admini-stration, engineering and supervision costs (up to 20%) and price contingen-cies (US$2.5 M) at 8% annually.
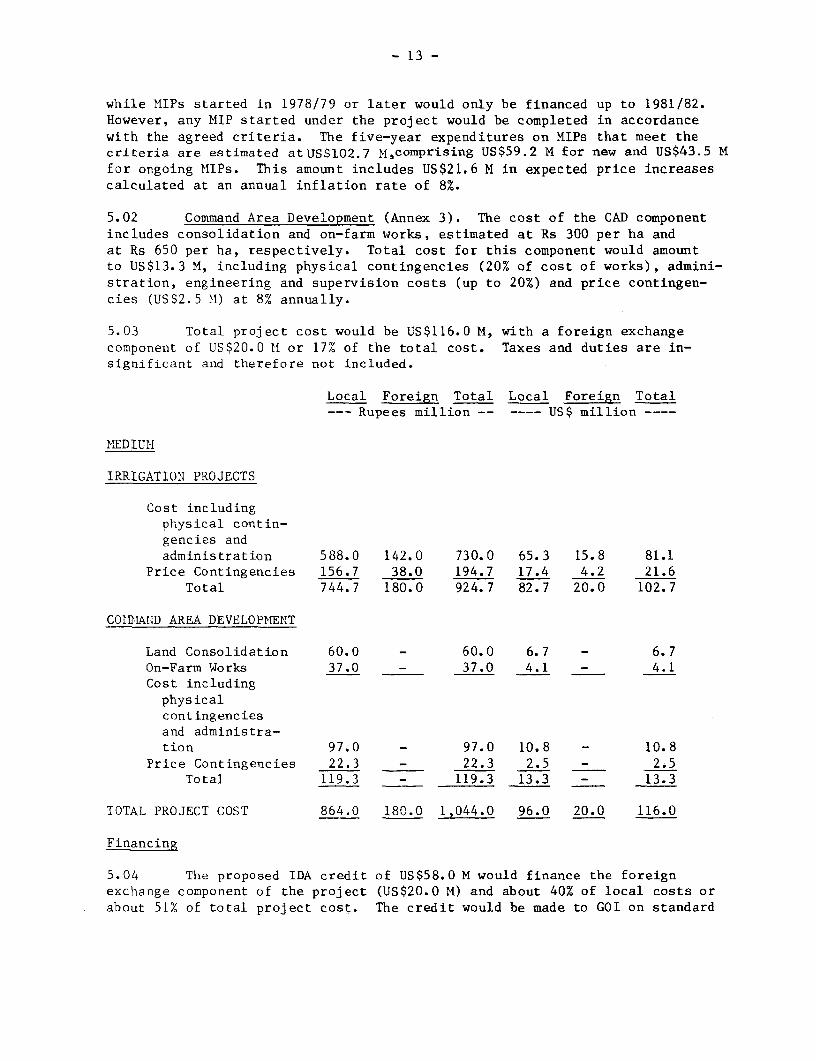
5.03 Total project cost would be US$116.0 M, with a foreign exchangecomponent of US$20.0 H1 or 17% of the total cost. Taxes and duties are in-significant and therefore not included.
Local Foreign Total Local Foreign Total--- Rupees million -- ---- US$ million
MEDIUM
IRRIGATION PROJECTS
Cost includingphysical contin-gencies andadministration 588.0 142.0 730.0 65.3 15.8 81.1
Price Contingencies 156.7 38.0 194.7 17.4 4.2 21.6Total 744.7 180.0 924.7 82.7 20.0 102.7
COMIIA.D AREA DEVELOPMENT
Land Consolidation 60.0 - 60.0 6.7 - 6.7On-Farm Works 37.0 - 37.0 4.1 - 4.1Cost includingphysicalcontingenciesand administra-tion 97.0 - 97.0 10.8 - 10.8
Price Contingencies 22.3 - 22.3 2.5 - 2.5Total 119.3 - 119.3 13.3 - 13.3
TOTAL PROJECT COST 864.0 180.0 1,044.0 96.0 20.0 116.0
Financing
5.04 The proposed IDA credit of US$58.0 M would finance the foreignexchange component of the project (US$20.0 M) and about 40% of local costs orabout 51X of total project cost. The credit would be made to GOI on standard
- 14 -
terms. Agreement has been reached with GOI that; (i) the proceeds of thecredit, except disbursements for on-farm works, would be channeled to GOO onGOI's standard terms and arrangements for development assistance to the states;and (ii) disbursements for on-farm works (US$2.4 M) would be made availableto ARDC.
5.05 On-farm works (US$5.2 N, including price contingencies) would befinanced by the farmers using funds provided by commercial and land devel-opment banks at a minimum interest rate of 10.5% over a maximum 15 yearsperiod, including a grace period of two years on repayment of principal.Farmers' downpayment would range from 5% to 15% depending on their pre-development incomes. Loans made to eligible farmers would be refinanced byARDC at the rate of 90%. ARDC's refinance would be in line with repaymentperiods of ultimate borrowers and bear a minimum interest rate of 7.5%annually. ARDC would in turn be refinanced by GOI, with a maximum repaymentperiod of 15 years at an annual interest rate not less than 7.25%. The loanto farmers ineligible for ordinary bank credit would be refinanced to 100%by a revolving fund contributed by GOI, GOO, ARDC and administered by ARDC(Annex 3).
5.06 The Sixth Five-Year Plan is in its early stages of formulationand Orissa's overall investment program for MIPs over the next five yearsis not yet firm. However, agreements have been reached with GOO that:(i) as many as possible of the ongoing and the new MIPs would be implementedin accordance with the established technical and economic criteria; and(ii) it would promptly provide the funds to implement and complete IDA-financed MIPs in accordance with the schedule of expenditures (Annex 4, Table1). GOO would inform IDA about any material changes in its expected MIPinvestment program (Annex 2, para 8). Conditions of disbursement for on-farm works would be that: (i) a revolving fund for loans to farmers ineli-gible for ordinary bank credit has been established; and (ii) financialarrangements, satisfactory to IDA, have been made between GOI and ARDC.
Procurement
5.07 Medium Irrigation Projects. Civil works would be restricted toseasonal construction and best carried out by labor-intensive methods. Workswould be relatively small and scattered throughout the State. Consequently,it is not feasible nor economic to group them into large contracts for Inter-national Competitive Bidding. Present practice of GOO for ongoing MIPs is tocontract most of the construction works for dams, spillways, and distributionnetworks to local contractors after Local Competitive Bidding; procedures forwhich are satisfactory. The remaining portion is completed under small unitprice contracts. Due to the remoteness of many of the HIP areas, responses tobids are not received in some cases and the work is implemented under forceaccount. Force account would also be used when required by safety or qualityconsiderations. However, such procedure would be limited to a maximum of 25%of all civil works.
- 15 -
5.08 On-Farm Works. Land shaping and leveling would not be required underthe project. Field channels and drains and associated masonry structureswould be built by manual labor, the most economic and practical means. Con-tracts for these works would be let on a unit price basis to small villagecontractors. The procedures used for letting such contracts are satisfactory.
Disbursements
5.09 Disbursements for approved HIPs (para 6.10) would cover 65% of ex-penditures on civil works. Disbursements for force account work and forpayments of less than Rs 50,000 under civil works contracts would be madeagainst certificates of expend4ture -- itemized by sub-projects -- submittedby GOO. Documentation of these works would be retained by GOO and madeavailable for inspection during project supervision. Full documentationwould be required for other contract works.
5.10 Two disbursement categories would be established for CAD: one forland consolidation and another for on-farm works. Disbursement for land con-solidation would be made at a rate of Rs 150 per ha against Inspector Generalof Land Registration's certificates of completion of consolidation. Disburse-ments for on-farm works would cover 55% of ARDC's refinance and be made againsta certificate of expenditures submitted by ARDC. The documentation for thiswould be retained by GOO and ARDC, respectively, and made available forinspection by IDA during project progress review. The estimated schedule ofexpenditure, the proposed allocation of the proceeds of the credit and thesemi-annual disbursement schedule are presented in Annex 4. It is expectedthat disbursements would be completed by October 1983, about one year aftercompletion of the project.
Accounts and Audits
5.11 Implementing agencies would be subject to normal Government controland auditing procedures which are satisfactory. Agreements have been reachedwith GOO that: (i) the Irrigation and Power Department (para 6.01), the Con-solidation Unit (para 6.23) and the Agriculture Engineering Organization (para6.25) would maintain separate accounts on project expenditures -- in the caseof MIPs, accounts would be maintained for each sub-project; and (ii) theseaccounts would be audited annually by independent auditors acceptable to IDA;(iii) audit summaries would be submitted to IDA within twelve months aftereach fiscal year together with the auditors' reports and (iv) completeaccounts and financial statements would be available for inspection duringproject review missions.
5.12 Auditing procedures for ARDC are satisfactory. Agreements havebeen reached with ARDC that: (i) it would require participating banks tomaintain separate accounts for lending made under the project, and (ii)these would be audited and audit summaries would be submitted to IDA withinfour months after the end of each fiscal year, together with an audited ARDCstatement on project lending to such banks.
- 16 -
Cost Recovery
5.13 The average cost of MIPs is about Rs 11,000 per ha. The annualcharge for full recovery of O&M and capital costs over 30 years at an interestrate of 10% would amount to about Rs 1,250 per ha.
5.14 The prime vehicle for recovery of irrigation costs in Orissa isthe water charge. The level of the water charge depends on the crop grownand the season in which irrigation is received. The rates range from lessthan Rs 4 per ha to about Rs 125 per ha. At current levels, the charge wouldamount to about Rs 35 per ha per year for the typical cropping pattern of anMIP. Other agricultural taxation includes the land revenue assessment, thegraded producer's levy and sales tax. Land revenue assessment, which dependson soil type and location, averages about Rs 20 per ha. Large farmers owningmore than 10 ha of irrigated or 20 ha of unirrigated land are subject to agraded producer's levy in which they are required to sell part of their paddycrop at procurement prices lower than the market prices. More important isthe sales tax on agricultural goods. Paddy purchased by millers and whole-salers is taxed at 7%. Rice that has not been taxed as paddy is taxed at 3%;other foodgrains, pulses and oilseeds at 3%. If it is assumed that all theincremental production due to investment in MIPs financed under the projectwould be marketed, the sales tax would, on the average, amount to Rs 160 per
ha.
5.15 Orissa has one of the lowest taxation rates in India and theState's per capita revenue ranks 17 among the 21 States. Consequently, in-creasing investments in agriculture without a high rate of cost recovery wouldseverely strain the State's budgetary resources. On the other hand, Orissahas a larger portion of its rural population below the poverty line than anyother State in India. Average rural per capita income is only about Rs 700(US$78) or about three-fifths of the average per capita income for India.Thus, a feasible cost recovery plan must take into account the economiccondition of the beneficiaries and their ability to pay.
5.16 Assurances have been obtained that GOO would, by December 31, 1979,review the question of water charges and implement, after consultation withIDA, a system of water and water related charges to ensure adequate recoveryof annual O&M costs and as much as possible of capital costs. In establishingthe level of charges, due regard would be given to incentives for and paymentcapacity of farmers.
- 17 -
VI. ORGANIZATION AND MANAGEMENT
A. Medium Irrigation Projects
Orissa Irrigation and Power Department (I&PD)
6.01 The direct responsibility for planning, implementation, and opera-tion and maintenance (O&M) of MIPs would rest with I&PD of GOO. The I&PD isheaded by a Chief Engineer (CE) who reports to the Secretary of Irrigationand Power. Recently, in order to reduce the workload of the CE, some of hisfunctions have been delegated to two Additional Chief Engineers: one is res-ponsible for construction and O&M of MIPs, and the other for construction andO&M of the Mahanadi Delta project. The CE retains direct responsibility forall planning and design activities and for construction and O&M of major ir-rigation projects outside the Mahanadi Delta. At headquarters, he is supportedby the Directorate of Design and the Planning Cell.
6.02 The I&PD is organized on a geographical basis with seven circles,each headed by a Superintending Engineer (SE). The SE is responsible forfour to five divisions, each headed by an Executive Engineer (EE). A divi-sion consists of five to eight sub-divisions. Generally, two to four sub-divisions have responsibilities for investigations, minor works and O&M ofexisting projects within specific geographical areas. Special constructionsub-divisions are set up for execution of larger works. For a typical 10,000ha project, three sub-divisions are created; one for dam construction, one forconstruction of the distribution and drainage networks and one for operationand maintenance of the construction equipment. Sub-divisions are headedby Assistant Engineers (AE). I&PD has a sufficient number of technicallycompetent staff to plan, design and construct the MIPs in accordance withthe agreed criteria.
The Appraisal Committee of the Central Water Commission
6.03 The Central Water Commission (CWC) of GOI is the highest technicalauthority for water resources development in India. The Commission consistsof a Chairman and four members. It has a staff of more than 1,000 engineers.A large part of the staff is on rotation from the states. The CWC is re-sponsible for technical review of all major and medium irrigation projectsbefore they are submitted for approval to the Planning Commission of GOI. Inthe case of medium irrigation projects, the review is only proforma, whilemajor irrigation projects are analyzed in detail.
6.04 The CWC would be responsible for appraising and reviewing the pro-gress of MIPs financed under the project. For this purpose, CWC has estab-lished an Appraisal Committee (AC), headed by the Member, Planning and Pro-gress. The Committee has a competent engineering staff. Agriculturalistswould be deputed from the Department of Agriculture and economists from the
- 18 -
irrigation wing of the Planning Commission. Conditions of credit effective-ness would be that: (i) GOI has appointed a director for AC, and (ii)staffing arrangements, satisfactory to IDA, have been made for AC.
Procedures for Medium IrriRation Prolects
6.05 There would be a continuous interaction between AC and GOO duringthe implementation of MIPs. The main activities in the "project cycle" wouldfollow procedures described below:
6.06 Sub-prolect Identification. The overall strategy for irrigationdevelopment in Orissa is outlined in the Master Plan of 1972, which alsoidentifies potential MIPs. Priorities for preparation of MIPs are estab-lished by the Secretary of Irrigation and Power after consultation withconcerned GOO departments.
6.07 Sub-project Preparation. As at present, sub-project investigationswould be carried out by I&PD at the Division level under supervision of theEE. These investigations would form the basis for a draft Project Report,which would include preliminary designs, cost estimates and a tentativeimplementation plan. The draft would be reviewed by the I&PD Planning Celland Directorate of Design before finalization. An agreement has beenreached with GOO that a Preparation Committee, at project level, would beestablished for each IDA financed MIP. This committee would include theEE, concerned Block Development Officers within the project area and districtlevel officers from the Agriculture and Cooperation, Revenue, Forestry andFisheries Departments. At State level, an interdepartmental committee hasbeen set up to review draft Project Reports. The progress of MIP prepara-tion would be reviewed every six months by AC to ensure the implementationof established criteria for planning and preparation.
6.08 Submission of Sub-project to CWC. After clearance by GOO technicaland administrative departments, sub-project proposals would be included inGOO's annual development plan to be reviewed by the Planning Commission ofGOI. Subsequent to Planning Commission approval of the plan, the selectedMIPs would be submitted to CWC for appraisal.
6.09 Sub-project Appraisal. The AC would visit the sub-project area toreview the proposed sub-project in detail and ascertain that the proposed MIPmeets the criteria agreed with IDA (paras 4.04-4.10). The AC would alsoensure that: the proposed cropping pattern is suitable for the command area;agricultural supporting services are adequate; and the implementation scheduleis realistic. The AC would confirm and adjust the cost estimates as necessaryand prepare a Project Summary, which would be submitted to IDA.
6.10 Sub-project Approval. The AC would be authorized to approve sub-projects that meet the technical criteria and cost less than Rs 70 M (US$7.8 M)excluding price contingencies if the benefit/cost ratio is higher than 1.0.In all other cases, sub-projects would be reviewed by IDA which would baseits decision on an analysis of Project Reports and Summaries (paras 6.07 and6.09), supplemented by field visits, if necessary. To establish quality
- 19 -
standards for CWC appraisal work, full documentation for the first three MIPs(Project Report and Project Summary) would be submitted to IDA for approvalregardless of the costs. With these procedures, it is expected that about40-50% of eligible MIPs, representing more than 60% of the IDA financedinvestment program, would be subject to IDA detailed appraisal of individualschemes.
6.11 Sub-Project Implementation. The I&PD would be responsible for theimplementation all irrigation works. Each MIP would be implemented by two orthree sub-divisions that would be technically and administratively controlledby the divisional EE (para 6.02). Agreements have been reached with GOO that:(i) simultaneously with the construction of each MIP, GOO would strengthen, ifnecessary, the credit, input supply and marketing facilities in the area tomeet the need of irrigated farming, and (ii) the staffing of agriculturalextension services in each MIP area would conform with statewide standards setunder the Orissa Agricultural Development Project. Progress of project imple-mentation would be reviewed by AC three times during each construction season.
6.12 Operation and Maintenance. Responsibility for the day-to-dayoperation of each sub-project would rest with the sub-divisional AssistantEngineer. Under him, three to five Junior or Sub-Assistant Engineers wouldeach be responsbile for a section of the canal system (commanding about5,000 ha) down to the farm turnouts. Within this area, one or two patrolswould be posted to assess the water delivery requirements and each wouldsupervise five to ten kalassis. The kalassis would operate sluices and out-lets and do routine maintenance within a command area of about 250 ha each.Water would be delivered, on a rotational basis, through outlets serving nomore than 5 ha. Water allocation would be established at the beginning ofeach irrigation season by a committee consisting of a Revenue Officer, theAssistant Engineer in charge of the MIP, Agricultural Extension, CooperativeExtension, and Block Development Officers and Panchayat Samiti (Chairmanof the local by elected body at block level). This committee would alsocoordinate all other activities pertaining to irrigated agriculture such ascropping patterns, input distribution and credit facilities. An agreement hasbeen reached with GOO that such a committee would be established for eachMIP.
6.13 Most system maintenance would take place during the non-irrigationseason (March to June). In order to ensure effective O&M of the system andto reduce establishment charges, the I&PD has recently employed small unitprice contractors for annual repair and maintenance work. Kalassis are re-sponsible for routine maintenance during the irrigation season. An agreementhas been reached with GOO that I&PD would investigate alternative methods formaintenance works in order to establish the most cost effective way of ensur-ing a proper maintenance of MIPs; the conclusion of this study would besubmitted to IDA by March 31, 1983.
6.14 Since the present investigation and design practices for storageand diversion dams are consistent with IDA standards, no criteria has beenspecified for these structures. An agreement has been reached with GOO thatbiennial safety inspections would be undertaken for all dams and necessaryrepairs would be made.
20 -
Progress Review and Reporting Requirements
6.15 Progress review and the reporting requirements, which have been
agreed with CWC, are designed to: (i) ensure that the sub-projects are de-
signed, appraised and implemented in accordance with the agreed criteria;
(ii) ensure that work for which disbursements are requested actually has been
carried out; (iii) provide information ("feedback") to allow better project
preparation and appraisal in the future; (iv) provide guidance for the AC
staff in its review of project progress; (v) develop channels for mutual ex-
change of experience between IDA, CWC and GOO staff; and (vi) provide early
warning signals to IDA if problems are developing in implementation of the
MIPs.
6.16 The AC would closely monitor progress of project preparation,
implementation and operation. The following reports would be prepared by
AC and be submitted to IDA for review:
(a) An "Annual Implementation Program" (Annex 2, Appendix 2)
would be prepared after a review, with the GOO officials,of projects under preparation and implementation. Special
attention would be given to budgetary allocation for eachsub-project in order to ensure that adequate funds would be
provided in accordance with agreed implementation schedules.
(b) A "Progress Summary: Preparation" (Annex 2, Appendix 3)would be prepared after each visit to the Divisional Office
where a sub-project is being prepared and preferably tothe project site. Progress of sub-project preparationwould be reviewed every six months.
(c) A "Progress Summary: Implementation" (Annex 2, Appendix 4)
would be prepared and updated three times during each con-struction season, after visits to the MIP site.
(d) A "Progress Summary: Operation" (Annex 2, Appendix 5) would
be prepared once a year after a visit to the completed proj-
ect to assess irrigation benefits and to review the qualityand effectiveness of O&M.
6.17 The main thrust of IDA review would be to: (i) assess the quality
of AC's appraisal and review work; (ii) spot check whether agreed criteria
have been followed; (iii) review procurement procedures; (iv) check the
financial records kept by GOI and GOO; (v) assess the appropriateness of
established criteria; and (vi) examine the contents and timing of reports
submitted by CWC.
Project Evaluation
6.18 There would be a need to evaluate the costs and benefits associ-
ated with the improved design and construction standards implemented under the
project. For this purpose, an agreement has been reached with GOO that I&PD
- 21 -
and DAFP would undertake a study, by March 1983 ,of water losses and agricul-tural benefits in both existing and IDA-financed MIPs. This study, togetherwith the bench mark agro-economic surveys (para 4.05) and CWC progress reportswould form the basis for an evaluation of the MIP component, which would beundertaken jointly by GOO, CWC and IDA.
B. Command Area Development
Command Area Development Organizations
6.19 The CAD organization in Orissa extends from Cabinet level downto village committees. In May 1976, the GOO constituted three Command AreaDevelopment Authorities (CADAs) for the Hirakud, Salandi and Mahanadi Deltairrigation systems. Each CADA is chaired by a Revenue Divisional Commissionerand administered by a Project Director. CADA acts as a coordinating agencyfor all activities related to CAD such as construction of field channels anddrains, improvements to and O&M of irrigation systems, consolidation of hold-ings and development of agricultural supporting services. However, it has thepower to direct, subject to broad guidelines established by the GOO, the mannerin which programs relating to these activities would be executed. Initially,the CADA is provided with working capital from GOO. Under the project, thebeneficiaries when applying for loans would authorize the lending banks toplace the amount with the CADA who, through the Agricultural EngineeringOrganization, would plan, design and supervise the construction of on-farmworks.
6.20 In order to ensure effective supervision of the CAD programs inall three areas as well as to ensure inter-departmental coordination, GOOhas established a State Committee, presided over by the Chief Minister. TheCommittee consists of Cabinet members, senior GOO officials and Chairmen ofthe three CADAs. The CAD Commissioner is appointed as convenor of the StateCommittee. The Agricultural and Cooperation Department is the administrativedepartment for CAD.
Land Consolidation Process
6.21 Land consolidation is carried out in stages: (i) cadastral survey,topographical survey, preparation of maps and layouts for irrigation, drainageand road system; (ii) determination of land rights, valuation of differentland classes, and settlement of rent and cess payments wherever necessary;(iii) preparation of a new plan for the village, including allocation of landfor communal purposes (such as field channels and drains, access roads andother public uses); (iv) reallocation of land into compact holdings; and(v) preparation of new land ownership records and maps.
6.22 The consolidation process is lengthy since ample provisions aremade for objections and appeals by farmers concerned at each stage in theprocess. Completion of consolidation takes about 2-1/2 to 3 years. In order
- 22 -
to prevent future fragmentation of consolidated plots, the Act prohibitstransfer of ownership for holdings less than one acre to any one except to anadjoining farmer.
Consolidation Organization
6.23 Responsibility for consolidation rests with the Consolidation Unit,established in the Revenue Department and headed by a Director. The basicoperating unit is a consolidation camp (normally covering 2,000-2,500 ha ofconsolidable area), consisting of an Assistant Consolidation Officer, onesurveyor and two consolidators. Each camp is responsible for cadastral sur-veys, field inquiries for determination of land values, preparation of landrecords and maps, delineation of consolidated plots and allotment to land-owners. About 5 to 8 camps constitute a circle, headed by a ConsolidationOfficer (CO). He supervises the work of the camps and has power to resolvedisputes concerning allotment of land and determination of land values. Aboutthree circles constitute a range, headed by a Deputy Director, Consolidation,who had jurisdiction over appeals made by landowners. The Director of Con-solidation has overall administrative control and supervision responsibility.The Consolidation Commissioner, who is responsible for the formulation of theprogram, has final jurisdiction over the appeals made by farmers againstdecisions of lower consolidation authorities. The budgetary provisions comefrom the Revenue Department.
6.24 A special feature of the consolidation process is the involvementof the village community at all stages. A Consolidation Committee, comprisedof at least one landless agricultural laborer, one representative of eachcategory of land owners and one person from Scheduled Castes/Tribes, is con-stituted for each camp. The Committee advises the consolidation officers onmatters such as determination of land values and allotment of consolidatedholdings.
On-Farm Works
6.25 The Agriculture Engineering Organization (AEO) of DAFP, headedby the Joint Director of Agriculture, Engineering, would be responsible forthe implementation of on-farm works. Four Divisions would be established fortopographical surveys, alignment of field channels and drains, preparation ofcost estimates and supervision of on-farm works carried out by small contrac-tors. Each Division would be headed by an Executive Engineer, assisted byfour Assistant Agricultural Engineers and 16 Junior Agricultural Engineers.AEO would be suitable for implementing on-farm works since it has staff withtraining in both agriculture and engineering and who have experience fromplanning, design and supervision of on-farm works in the pilot projects (para4.11). Responsibilities for water distribution and maintenance of field chan-nels and drains would rest with the Chak Level Operating Committee consistingof nominees of cultivators within the chak.
- 23 -
VII. BENEFITS AND JUSTIFICATION 1/
General
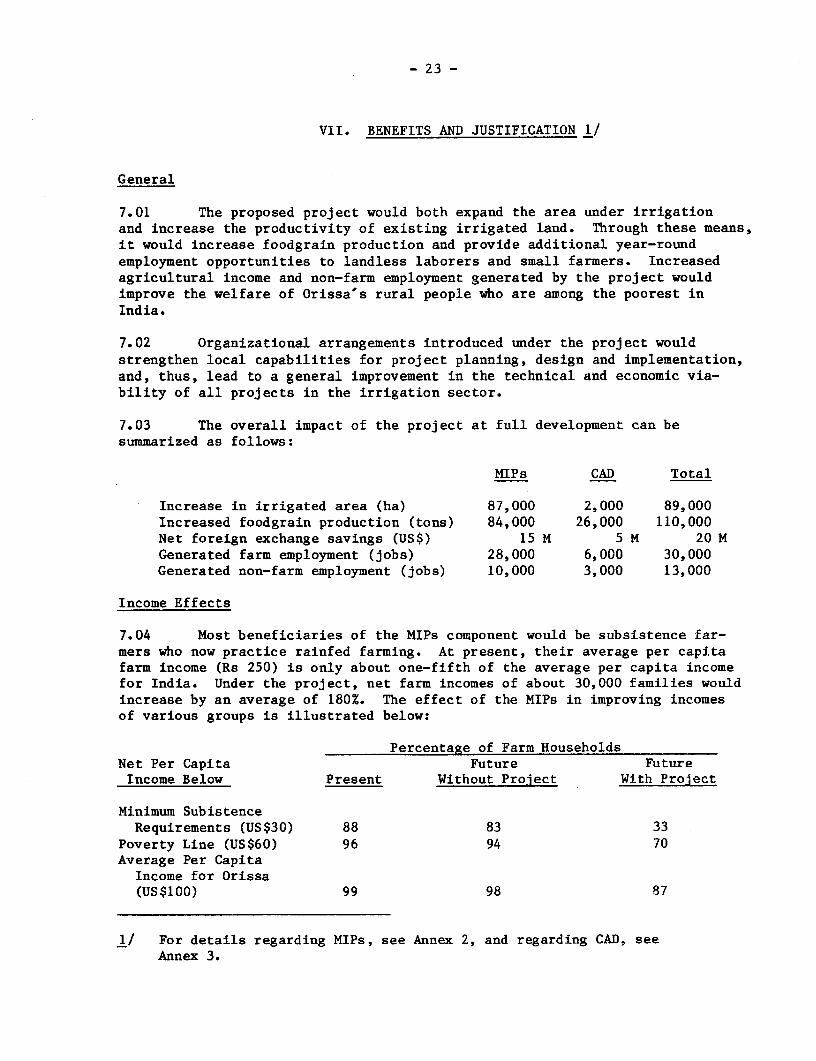
7.01 The proposed project would both expand the area under irrigationand increase the productivity of existing irrigated land. Through these means,it would increase foodgrain production and provide additional year-roundemployment opportunities to landless laborers and small farmers. Increasedagricultural income and non-farm employment generated by the project wouldimprove the welfare of Orissa's rural people who are among the poorest inIndia.
7.02 Organizational arrangements introduced under the project wouldstrengthen local capabilities for project planning, design and implementation,and, thus, lead to a general improvement in the technical and economic via-bility of all projects in the irrigation sector.
7.03 The overall impact of the project at full development can besummarized as follows:
MIPS CAD Total
Increase in irrigated area (ha) 87,000 2,000 89,000Increased foodgrain production (tons) 84,000 26,000 110,000Net foreign exchange savings (US$) 15 M 5 M 20 MGenerated farm employment (jobs) 28,000 6,000 30,000Generated non-farm employment (jobs) 10,000 3,000 13,000
Income Effects
7.04 Most beneficiaries of the MIPs component would be subsistence far-mers who now practice rainfed farming. At present, their average per capitafarm income (Rs 250) is only about one-fifth of the average per capita incomefor India. Under the project, net farm incomes of about 30,000 families wouldincrease by an average of 180%. The effect of the MIPs in improving incomesof various groups is illustrated below:
Percentage of Farm HouseholdsNet Per Capita Future FutureIncome Below Present Without Project With Project
Minimum SubistenceRequirements (US$30) 88 83 33
Poverty Line (US$60) 96 94 70Average Per CapitaIncome for Orissa(US$100) 99 98 87
1/ For details regarding MIPs, see Annex 2, and regarding CAD, seeAnnex 3.
- 24 -
7.05 The CAD program would mainly benefit farmers with land in the tail-ends of the outlet blocks. The present field-to-field irrigation, whichleaves tailend farmers with either too little or too much water, results inincome differences of about 30% between headreach and tailend farmers. Theon-farm works would increase the incomes of tailend farmers (net of loanrepayment) by 15%-30x. Although headreach farmers' net incomes would notchange significantly, they would benefit from stable yields as a result ofthe more reliable water supply.
Economic Rates of Return (ERR)
7.06 According to the economic criteria established for MIPs, CWC wouldbe authorized to approve projects with an ERR exceeding 12%. Based on anestimated average investment cost of Rs 11,000 per ha for MIPs and on aprojected "typical" cropping pattern, it is estimated that the average ERRof MIPs would be around 18%. The estimated ERR for the CAD program would beabout 34%. The overall ERR of the project is estimated at 20%.
Environmental Effects
7.07 The main water-related diseases in Orissa are malaria and typhoid.Although the incidence of such diseases is not expected under the project, anassurance would be obtained that GOI and GOO would take all measures as con-sidered necessary to minimize the hazards of malaria and other water-relateddiseases in both MIPs and CAD project areas.
Prolect Risks
7.08 The risk associated with the MIP component would stem from (i) theuse of standardized yield and input projections for the economic evaluationof all sub-projects and (ii) the procedures for approval and progress reviewof sub-projects. Since the agro-economic conditions in all sub-project areaswould be broadly similar, the error introduced by the use of standardizedprojections in the evaluation of an individual sub-project would be limited.Furthermore, the overestimation of actual benefits for one MIP would be com-pensated by the underestimation of benefits for another. Thus, the riskof the MIPs taken as a group is minimal. Arrangements for approval of thesub-projects and the reporting requirements that would permit IDA to identifyproblems early and to intervene directly, if necessary, are designed tominimize the risk associated with the proposed appraisal and progress reviewprocedures. In view of the benefits from institution building and the socialimportance of MIPs constructed in the more backward areas of Orissa, the riskis acceptable.
7.09 The risk associated with the CAD component would be small due tohigh anticipated returns and the successful experience of pilot operations.
-25-
VIII. AGREEMENTS REACHED AND RECOMMENDATIONS
8.01 Agreements have been reached with GOI and GOO that IDA-financed MIPswould be designed, constructed and completed in accordance with the agreedtechnical and economic criteria (para 4.04);
8.02 Agreements have been reached with GOI that:
(i) it would channel the proceeds of the credit, except dis-bursement for on-farm works, to GOO on standard terms andarrangements for development assistance to the states(para 5.04); and
(ii) disbursements for on-farm works would be made availableto ARDC (para 5.04).
8.03 Agreements have been reached with GOO that:
(i) as many as possible of the on-going and the new MIPswould be implemented in accordance with the estab-lished technical and economic criteria (para 5.06);
(ii) GOO would promptly provide the funds to complete IDA-financed MIPs in accordance with the schedule ofexpenditures (para 5.06);
(iii) the implementing agencies would maintain separate accountson project expenditures -- in the case of MIPs, accountswould be maintained for each sub-project (para 5.11);
(iv) the accounts would be audited annually by independentauditors acceptable to IDA (para 5.11);
(v) audit summaries would be submitted to IDA within twelvemonths after each fiscal year along with the auditors'reports (para 5.11);
(vi) complete accounts and financial statements would be avail-able for inspection during project review missions (para 5.11);
(vii) GOO would, by December 31, 1979, review the question of watercharges and implement, after consultation with IDA, a systemof water and water related charges to ensure adequate recoveryof annual O&M costs and as much as possible of capital costs.In establishing the level of charges, due regard would be givento incentives for and payment capacity of farmers (para 5.16);
- Zb -
(viii) a Project Preparation Committee, consisting of the Execu-tive Engineer, concerned Block Development Officers anddistrict level officers from the Agriculture and Coopera-tion, Revenue, and Forestry and Fisheries Departments,would be established for each MIP (para 6.07);
(ix) simultaneously with the construction of the MIPs, it wouldstrengthen, if necessary, the credit, input supply andmarketing facilities in the areas to meet the need ofirrigated farming (para 6.11);
(x) the staffing of agricultural extension services in eachMIP area would conform with the statewide standards setunder the Orissa Agricultural Development Project (para 6.11);
(xi) water allocation in each MIP would be established at thebeginning of each irrigation season by a committee consistingof a Revenue Officer, Assistant Engineer in charge of theproject, Agricultural Extension, Cooperative Extension andBlock Development Officers and Panchayat Samiti (para 6.12);
(xii) the I&PD would investigate alternative methods for maintenanceworks in order to establish the most cost effective way ofensuring a proper maintenance of MIPs. The conclusion ofthis study would be submitted to IDA by March 31, 1983(para 6.13).
(xiii) biennial safety inspections would be undertaken for MIPdams and necessary repairs would be made (para 6.14);
(xiv) it would by March 1983, undertake a study of water lossesand agricultural benefits relating to technical criteriaestablished for IDA-financed MIPs (para 6.18); and
(xv) all measures would be taken to minimize the hazards ofmalaria and other water-related diseases in MIP CAD projectareas (para 7.07).
8.04 Agreements have been reached with ARDC that:
(i) it would require participating banks to maintainseparate accounts for lending under the project(para 5.12); and
(ii) these accounts would be audited and audit summarieswould be submitted to IDA within four months afterthe end of each fiscal year, together with an auditedARDC statement on project lending to such banks(para 5.12).
- 27 -
8.05 Conditions of credit effectiveness would be that:
(i) GOI has appointed a director for AC (para 6.04); and
(ii) staffing arrangements, satisfactory to IDA, have beenmade for AC (para 6.04).
8.06 Conditions of disbursements for on-farm works would be that:
(i) GOI and ARDC have made satisfactory financial arrangementsto IDA (para 5.06); and
(ii) a revolving fund for loans to farmers ineligible forordinary bank credit has been established (para 5.06).
8.07 With the above assurances and conditions of disbursements, the pro-posed project would be suitable for an IDA credit of US$58.0 M on standardIDA terms. The Borrower would be the Government of India.
August 24, 1977
ANNEX 1
INDIA
ORISSA IRRIGATION PROJECT
THE STATE OF ORISSA
Table of Contents
Page No.
I. BACKGROUND
General ......s1Plimate o .a............... 1Physiography 2
soils3Topography and Land Use...... 3Population 3
Farm Size and Land Tenure..oo.ooo........s.* 4
II. AGRICULTURE IN ORISSA
General 4
Cropping Patterns and Yields 4Agricultural Production ... 5Faming Practices 5
Agricultural Supporting Services 6
III. IRRIGATION IN ORISSA
Water Resources ....... 8
Irrigation Potential and Utilization ..... 9
28
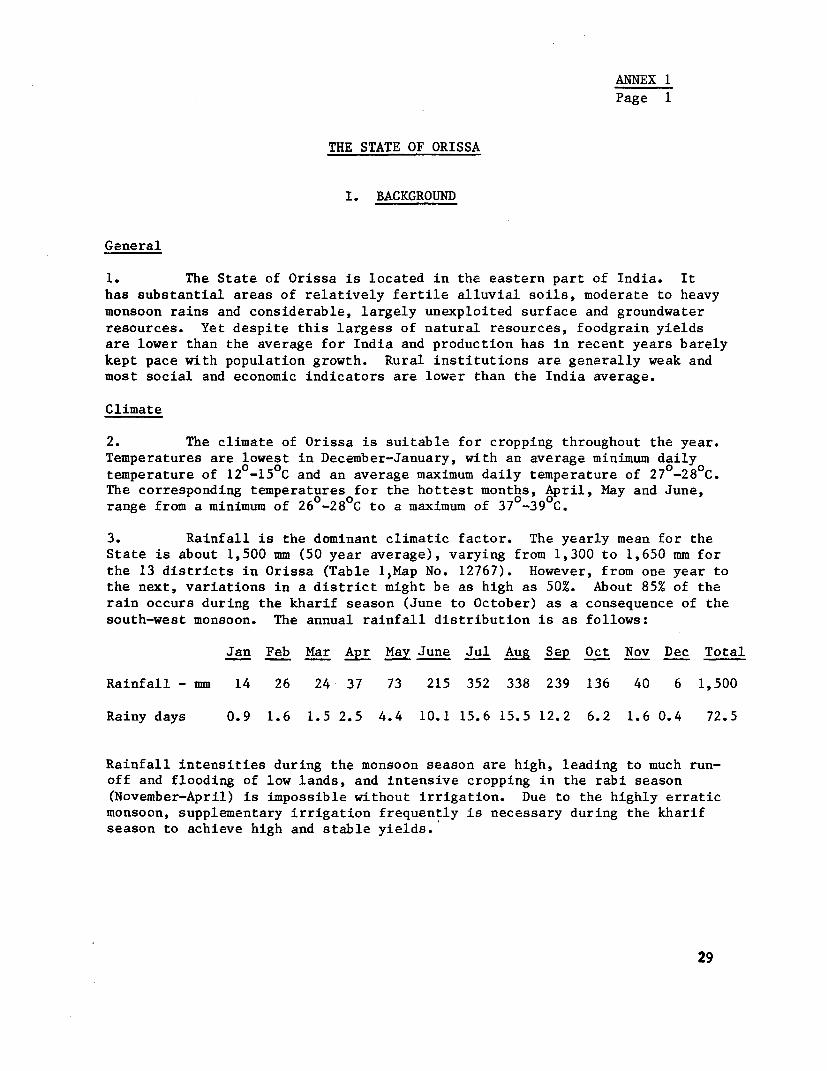
ANNEX 1Page 1
THE STATE OF ORISSA
I. BACKGROUND
General
1. The State of Orissa is located in the eastern part of India. Ithas substantial areas of relatively fertile alluvial soils, moderate to heavymonsoon rains and considerable, largely unexploited surface and groundwaterresources. Yet despite this largess of natural resources, foodgrain yieldsare lower than the average for India and production has in recent years barelykept pace with population growth. Rural institutions are generally weak andmost social and economic indicators are lower than the India average.
Climate
2. The climate of Orissa is suitable for cropping throughout the year.Temperatures are lowest in December-January, with an average minimum dailytemperature of 12 -15°C and an average maximum daily temperature of 270-280C.The corresponding temperatures for the hottest months, April, May and June,range from a minimum of 260-280C to a maximum of 3 7 -3 9 0C.
3. Rainfall is the dominant climatic factor. The yearly mean for theState is about 1,500 mm (50 year average), varying from 1,300 to 1,650 mm forthe 13 districts in Orissa (Table 1,Map No. 12767). However, from one year tothe next, variations in a district might be as high as 50%. About 85% of therain occurs during the kharif season (June to October) as a consequence of thesouth-west monsoon. The annual rainfall distribution is as follows:
Jan Feb Mar Apr May June Jul Aug Sep Oct Nov Dec Total
Rainfall - mm 14 26 24 37 73 215 352 338 239 136 40 6 1,500
Rainy days 0.9 1.6 1.5 2.5 4.4 10.1 15.6 15.5 12.2 6.2 1.6 0.4 72.5
Rainfall intensities during the monsoon season are high, leading to much run-off and flooding of low lands, and intensive cropping in the rabi season(November-April) is impossible without irrigation. Due to the highly erraticmonsoon, supplementary irrigation frequently is necessary during the kharifseason to achieve high and stable yields.
29
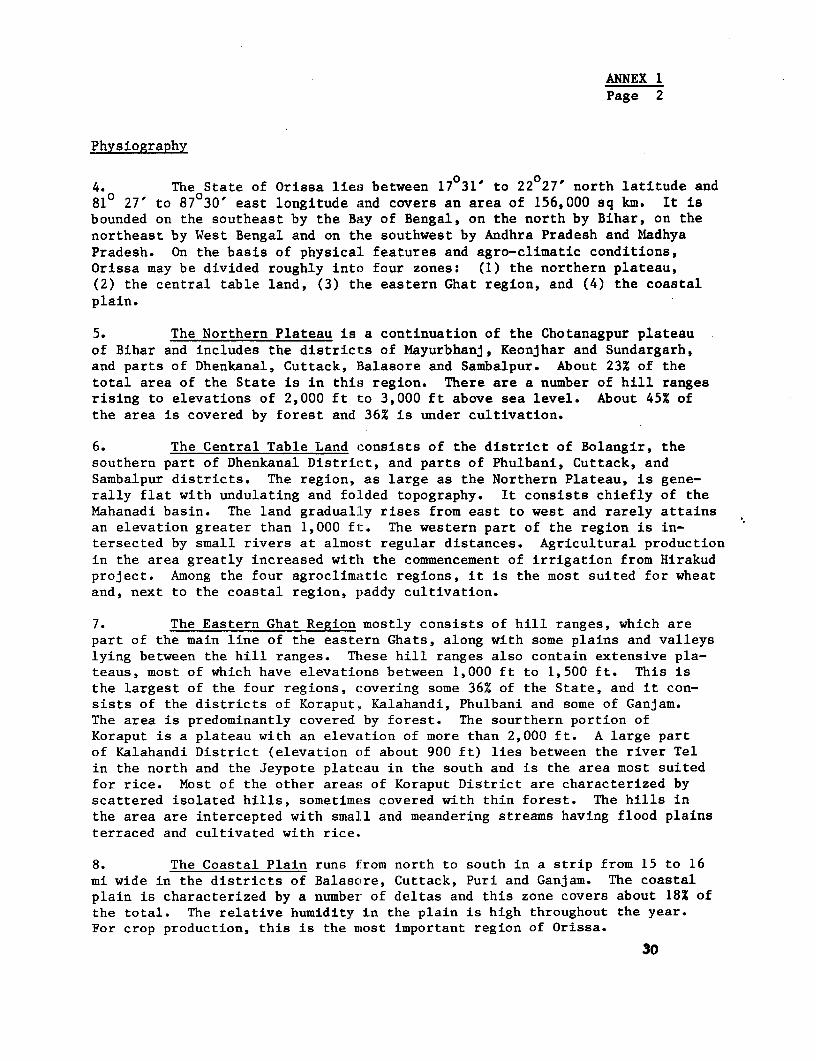
ANNEX 1Page 2
Physiography
4. The State of Orissa lies between 17031' to 22027' north latitude and810 27' to 87030' east longitude and covers an area of 156,000 sq km. It isbounded on the southeast by the Bay of Bengal, on the north by Bihar, on thenortheast by West Bengal and on the southwest by Andhra Pradesh and MadhyaPradesh. On the basis of physical features and agro-climatic conditions,Orissa may be divided roughly into four zones: (1) the northern plateau,(2) the central table land, (3) the eastern Ghat region, and (4) the coastalplain.
5. The Northern Plateau is a continuation of the Chotanagpur plateauof Bihar and includes the districts of Mayurbhanj, Keonjhar and Sundargarh,and parts of Dhenkanal, Cuttack, Balasore and Sambalpur. About 23% of thetotal area of the State is in this region. There are a number of hill rangesrising to elevations of 2,000 ft to 3,000 ft above sea level. About 45% ofthe area is covered by forest and 36% is under cultivation.
6. The Central Table Land consists of the district of Bolangir, thesouthern part of Dhenkanal District, and parts of Phulbani, Cuttack, andSambalpur districts. The region, as large as the Northern Plateau, is gene-rally flat with undulating and folded topography. It consists chiefly of theMahanadi basin. The land gradually rises from east to west and rarely attainsan elevation greater than 1,000 ft. The western part of the region is in-tersected by small rivers at almost regular distances. Agricultural productionin the area greatly increased with the commencement of irrigation from Hirakudproject. Among the four agroclimatic regions, it is the most suited for wheatand, next to the coastal region, paddy cultivation.
7. The Eastern Ghat Region mostly consists of hill ranges, which arepart of the main line of the eastern Ghats, along with some plains and valleyslying between the hill ranges. Thiese hill ranges also contain extensive pla-teaus, most of which have elevations between 1,000 ft to 1,500 ft. This isthe largest of the four regions, covering some 36% of the State, and it con-sists of the districts of Koraput, Kalahandi, Phulbani and some of Ganjam.The area is predominantly covered by forest. The sourthern portion ofKoraput is a plateau with an elevation of more than 2,000 ft. A large partof Kalahandi District (elevation of about 900 ft) lies between the river Telin the north and the Jeypote plateau in the south and is the area most suitedfor rice. Most of the other areas of Koraput District are characterized byscattered isolated hills, sometimes covered with thin forest. The hills inthe area are intercepted with small and meandering streams having flood plainsterraced and cultivated with rice.
8. The Coastal Plain runs from north to south in a strip from 15 to 16mi wide in the districts of Balascre, Cuttack, Puri and Ganjam. The coastalplain is characterized by a number of deltas and this zone covers about 18% ofthe total. The relative humidity in the plain is high throughout the year.For crop production, this is the most important region of Orissa.
30
ANNEX IPage 3
Soils
9. The soils of Orissa can be grouped into residual and transportedsoils. The residual soils of the uplands are predominantly red and yellowlaterites which are typically highly leached, acidic (pH 5.0-6.50), and lowin organic matter and nitrogen, with high phosphorous fixation. Althoughlateritic, most do not contain lateritic masses within their profiles. Theytend to be shallow, sandy and erodible on the steeper slopes. Their pro-ductivity is therefore limited both by fertility and water holding capacity.The uplands also contain smaller areas of "black cotton" and brown, forestsoils, which are deeper, finer in texture, and generally more fertile, butare much less permeable and more erosive than the red and yellow soils.They have a high water holding capacity but are slow to dry, and, sincethey cannot be worked when very wet, seedbed preparation and land cultiva-tion are difficult without adequate water control.
10. The transported alluvial soils found in the lowlands are moderatelyfertile, slightly acidic, deep and more productive than the residuals. Thesesoils are ideal for paddy production. Residual moisture in the winter is notenough for a second (rabi) crop of paddy, but pulses can be widely grown.The potential of the alluvial soils of the coastal zone depends primarilyupon elevation and therefore the intensity and duration of inundation. Inthe lowest areas, flood control measures are necessary to increase productiv-ity. Although the transported soils cover only 6% of the State's area, theyare the most important agriculturally. Along the coast, there are problems ofsalinity. Leaching and drainage measures and construction of embankments tocheck encroachment of sea water are needed to improve soil fertility.
Topography and Land Use
11. Microtopography is extremely important and traditionally plays amajor role in cropping patterns and practices. It is closely related to wateravailability during the growth season, and crops are planned accordingly. Thecultivable area is composed of high, medium and low lands. The high lands areusually planted to upland short duration paddy or, in the lighter soils andslopes, to millets, maize, oilseeds and pigeon pea. These are the first cropsto suffer in drought. The medium lands are planted to medium duration paddy,and the lowlands are planted to long duration, relatively flood resistant,paddy, harvested in December or January. Many farmers own parcels of landin all three categories, providing them with some form of insurance undervarying climatic conditions. Of the 6.8 M ha under cultivation, about 47%are upland, 30% medium and 23% lowland. The existing land use-pattern isshown on Map: "Orissa, India, Land Cover-Land Use Association".
Population
12. Orissa has a population of 26 M (1976 population extrapolated from21 M in 1971, Table 2), with about 92% living in the rural areas. Orissaranks 11th among the India states in terms of population, and it is probablyone of the poorest states, since about 60% of the population has an income
31
ANNEX 1Page 4
below the country poverty line (US$60). The overall literary rate was 26%in 1971, compared to an India average of 29%, with considerable variabilityfrom one district to another (i.e. about 30% in coastal districts and 10%in some inland districts). The population is also stratified along caste,class and tribal lines which hamper economic development in the State. Thescheduled castes and tribes, the weakest section of the economy, make up about38% of the total population, varying from 17%-25% in the coastal districts to30%-70% in inland districts. The labor force constitutes 31% of the totalpopulation. Cultivators and agricultural laborers account for 49% and 28%of the labor force, respectively.
Farm Size and Land Tenure
13. Overlapping with the schedule tribes and castes, but recognizedseparately for administrative purposes, are the "small" and "marginal" farmers,with holdings of less than 2 ha, who represent roughly 2.6 M out of a totalof 3.4 M cultivators' households (Table 3). Although these farmers operateover 75% of all operational holdings, they control less than 40% of the totalcultivable land, while farms of 5 ha or more (representing less than 7% ofholdings) account for about 35% of the land. Adding to the skewed distribu-tion of income in the rural areas are the landless and agricultural laborers,who constitute an additional 1.8 M households. Fragmentation is primarily aproblem in the coastal areas, where the farm sizes are also smaller.
14. The bulk of the agricultural land in Orissa is owned by its opera-tors; about 92% of the total area is recorded as fully owned and operatedand the remaining 8% is shown as rented from others. From the statistics,the problem of share croppers does not appear to be really severe, since onlyabout 0.3 M ha or 5% of the cultivated area, is recorded to be share cropped.However, in practice, a much larger but unquantified area is believed to beshare-cropped.
II. AGRICULTURE IN ORISSA
General
15. Agriculture is dominant in Orissa's economy, contributing over 60%of the gross domestic product. The livelihood of about 80% of the populationis in some way dependent on agriculture. Of a total area of about 15.5 M ha,about 6.8 M are cultivated.
Cropping Patterns and Yields
16. Paddy is the most important of the crops grown, occupying some 70%of all cropped area. The remainder is taken up by cereals (7%), pulses (14%),oilseeds (6%), fibers (1Z), and vegetables (2%). Over 95% of the rice crop isgrown in the kharif season, from June to December. In the coastal area, onlypaddy is grown in kharif whereas in upland areas, cereals, pulses, groundnutsand oilseeds are grown in addition to paddy. The statewide cropping intensity
32
ANNEX 1Page 5
is about 125%, and is greater in the coastal districts (134%) than in theinland areas (118%). Most of the second crop, planted after the kharif paddycrop is harvested, depends principally on residual moisture for its waterrequirements. Rice yields are low in relation to the rest of India and similarareas in Asia are about: 1.1 tons/ha for rainfed paddy; 1.6 tons/ha for irri-gated paddy in kharif, and 2.0 tons/ha for irrigated paddy in rabi. The lowrice yields will, as a result of the extension and research programs providedunder the Orissa Agricultural Development Project (Credit No. 625-IN, 1977,US$21.0 M) increase by some 15-20% through improved cultivation practicesand depending on the level of recommended fertilizer use, by between 50% and100% for adopting farmers. Wheat yields, on the other hand, are higher thanthe all-India average because wheat is grown mainly under irrigation inOrissa, using modern varieties and high levels of chemical fertilization.Pulse yields are roughly the same as the all-India average.
Agricultural Production
17. Foodgrain production is grown at an annual rate of less than 1% from1964/65 to 1974/75. The production of rice was stagnant, partly due to floodand drought spells such as in 1965/66, 1971/72 and 1974/75. The production ofminor crops such as wheat and maize increased significantly; however, sincetheir base is small compared to total output, the overall effect was almostnegligible. The production of non-food crops increased modestly, except forthe production of oilseeds which doubled between 1964/65 and 1973/74.
Farming Practices
18. Rice. Because of the uncertainty of rainfall in the rainfed agri-cultural areas of the State, it is necessary to plow during the first rainsto ensure optimum infiltration of water and provide storage to achieve a goodearly establishment of the rice seedling. Dry soil is too hard to cultivatewith animal draft power before it has become saturated, so that planting mustbe delayed until sufficient moisture is present to soften the soil. As mech-anization is not common in Orissa, land preparation is mostly done by bul-locks. Standards of cultivation are generally low, which results in severeweed problems during later growth stages, aggrevated by the fact that most ofthe crop area is broadcast so that timely hand weeding is not possible. Thecurrent practice is to cross-plow or harrow through the established crop.This achieves some weed control, and limited trials suggest it does not sig-nificantly affect yields of indigenous varieties. However, with high yield-ing varieties (HYV) this operation may severely check growth and reduce yields,and, therefore, it is not an acceptable method of weed control.
19. In the kharif, irrigated paddy is usually broadcast in June/July andharvested in November/December. Cross plowing is carried out one month afterplanting and usually about 2.4 cart loads of manure are applied. Little in-organic fertilizer is used. High yielding varieties are not widely planteddue to poor water control and higher risks of damage through diseases andpests. In the rabi, irrigated paddy is transplanted in January/February andreceives varying amounts of fertilizer.
33
ANNEX IPage 6
20. Other Crops. Pulse crops are usually grown on residual soil mois-ture after the kharif paddy crop. Groundnuts are mostly grown in upland areasduring kharif or on residual moisture in previously flooded low land or withirrigation during the rabi season. Wheat is mostly grown under irrigatedconditions.
Agricultural Supporting Services
21. Agricultural Extension and Training. The extension system is reor-ganized on a statewide basis under the Orissa Agricultural Development Project.The reorganization involves:
(a) placing the entire extension staff under the directcommand of the Directorate of Agriculture and FoodProduction (DAFP);
(b) increasing the numbers of professional supervisors andSubject Matter Specialists;
(c) a method of field and village visits which would ensureregular coverage of most farms;
(d) effective and continuously applied in-service training; and
(e) strengthening of Village Level Worker (VLW) pre-servicetraining to ensure a continuing supply of well-trainedworkers.
22. The VLWs work only on extension, each covering 400 to 800 farmers.They visit groups of 50 to 100 farmers on a regular basis every two weeks.The link between extension and research is also strengthened.
23. Agricultural Research. Agricultural research is carried out byOUAT and, for rice, by the Central Rice Research Institute (CRRI) of theIndian Council of Agricultural Research (ICAR) at Cuttack. Some adaptiveresearch is also carried out by DAFP. Both the CRRI and OUAT have producedseveral high yielding varieties of rice, such as Hema, Kumar and Rajeswari,which are suitable for the red laterite soils of Orissa, and Iarijata andSuphala, which are adaptive to low land conditions and are resistant to majorpests and oilseeds. In addition, OUAT has also done work on economic eva-luation of cropping systems, pest and disease control, soil fertility andrainfed agriculture.
24. Despite the accomplishments outlined above, much more effectivelyapplied and adaptive research is needed to overcome the constraints to cropproduction in Orissa. Such research programs are being carried out by theOUAT and DAFP under the Orissa Agricultural Development Project.
25. Farm Power. Most Orissa farmers are wholly dependent on humanlabor and animal power. About 3.4 M cultivators, 1.9 M agricultural laborersand an estimated 2.6 M animals work on the land. Nevertheless, there are
34
ANNEX 1Page 7
serious shortages of animal power for early cultivation, and of labor, par-ticularly for transplanting and weeding, despite pervasive landlessness, un-employment and poverty. A major constraint to production is the failure toprepare and sow the land in time. Before the first rains have softened it,the soil generally is too hard to cultivate and then, at a time when the bul-locks are in poor condition following the dry season, peak demand results ina shortage of draft power and consequent late planting, inadequate prepara-tion and poor cultivation. The local country plow is also very inefficient,requiring many more animal hours than improved plows to achieve less. Mecha-nization is at an early stage in Orissa, with only about 1,800 tractors and450 power tillers in use, and it will spread slowly because of the many smallfragmented farms. Animal power must therefore be used better to improve culti-vation.
26. The DAFP and CRRI have carried out valuable work on improved animal-drawn implements, a number of which, particularly the mould-board plow, areready for production and distribution on a commercial scale.
27. Input Supply. Orissa's present fertilizer use is low (average 9kg/ha compared with the all-Indian average 14.8 kg/ha), partly because exten-sion is not organized to encourage it and because the distribution system isnot well-developed. Fertilizer supply is not an immediate constraint sincethe production plants in Orissa have capacity to produce more than localdemands for some years. However, neither the cooperatives (which handlethe imported fertilizers) and the private retailers are well equipped for thedistribution of fertilizers, either in terms of technical knowledge and train-ing or the storage, transport and working capital required. In addition,GOI-controlled distribution margins also create a further disincentive to theexpansion of fertilizer uptake, especially in remote areas.
28. Neither cooperatives nor private traders supply seeds, pesticidesor implements on any scale. The DAFP has been primarily responsible for theproduction of seeds (from departmental farms) as well as for the distributionof improved seeds, the processing facilities for which are rudimentary. Seedsare usually sold uncertified; seed certification for cereals having only beenintroduced in the rabi season of 1974/75 on a pilot basis.
29. Marketing and Storage. About 12% of paddy production was marketedin 1974/75. In the case of pulses, the marketable surplus varies from 40% to50% and oilseeds from 50% to 70%. There are about 1,400 primary or villagemarkets in the State, which means that producers, except in the less populatedparts, normally have direct access to a weekly market. About 37 regulatedmarkets with storage space, grading facilities, auction halls, shops forcommission agents and traders and other amenities for market users are inoperation in the State. Fees and market practices are standardized and salesare by open auction. The GOI has recently sponsored new efforts to hastenthe development of regulated markets in the command areas of irrigation pro-jects, in important producing areas for commercial crops and in economicallybackward areas.
35
ANNEX 1Page 8
30. The Cooperatives have played a small part in the marketing of foodcrops due to their limited storage facilities. The private traders, withadequate storage facilities for their needs, are relatively active in mar-keting food crops, especially in the coastal districts. In many areas withinadequate communication facilities, especially in the hilly tracts, thelocal traders, due to the absence of competition, tend to pay a price lowerthan that offered in the coastal areas. Formal grading of rice is undertakenonly for purchases under the official fixed price programs. Maize, for whichsome attempts for procurement have been made, has not been graded but standardsfor moisture content and admixture have been fixed.
31. The GOO also has practiced a limited procurement of paddy and ricein order to stabilize prices and to ensure the required minimum food needs ofthe population in times of shortage. Theoretically, the GOO has a monopolyfor the wholesale trade of rice. Licensed millers are required to buy paddyat official fixed prices and deliver the corresponding quantities of rice tothe Government's storage or distribution agents (monopoly procurement). In1974/75, the Government introduced the miller's levy system, where millers arerequired to deliver 75% of the rice milled from the paddy they buy rather than100%. In practice, it is difficult to enforce the procurement regulations,especially in the case of small millers and shellers. Typically, the GOO wouldprocure only about 5-6% of the production. The effect of these systems is todiscourage the more efficient processors (modern rice mills) and encourage theless efficient processors (small millers and shellers). The GOO also intro-duced, for 1975/76 kharif season, a levy on paddy producers with more than fourirrigated acres or eight unirrigated acres of paddy. The levy rises progres-sively from one to three quintals per acre depending on the size and type ofland. This system has not worked well due to bad land records.
32. In addition to procurement on paddy and rice, the GOO also restrictedthe unlicensed movement of paddy and rice either out of the State or out of thesurplus producing areas within the State. The effect of this is to reduce theopen market price of paddy below what it otherwise would be in the surplusareas.
33. There are about 2,985 registered rice mills in the State, of whichthe majority are small milling units. In addition, the number of unregisteredsmall hullers is estimated to be on the order of 3,500-5,000, which handle asignificant share of traded paddy and rice. The large millers normally operateat only one-third of their full capacity, partly due to the procurement levymentioned above.
III. IRRIGATION IN ORISSA
Water Resources
34. The water resources of the State of Orissa are, for the most part,underdeveloped. Even in areas which have fully developed irrigation systems,
36
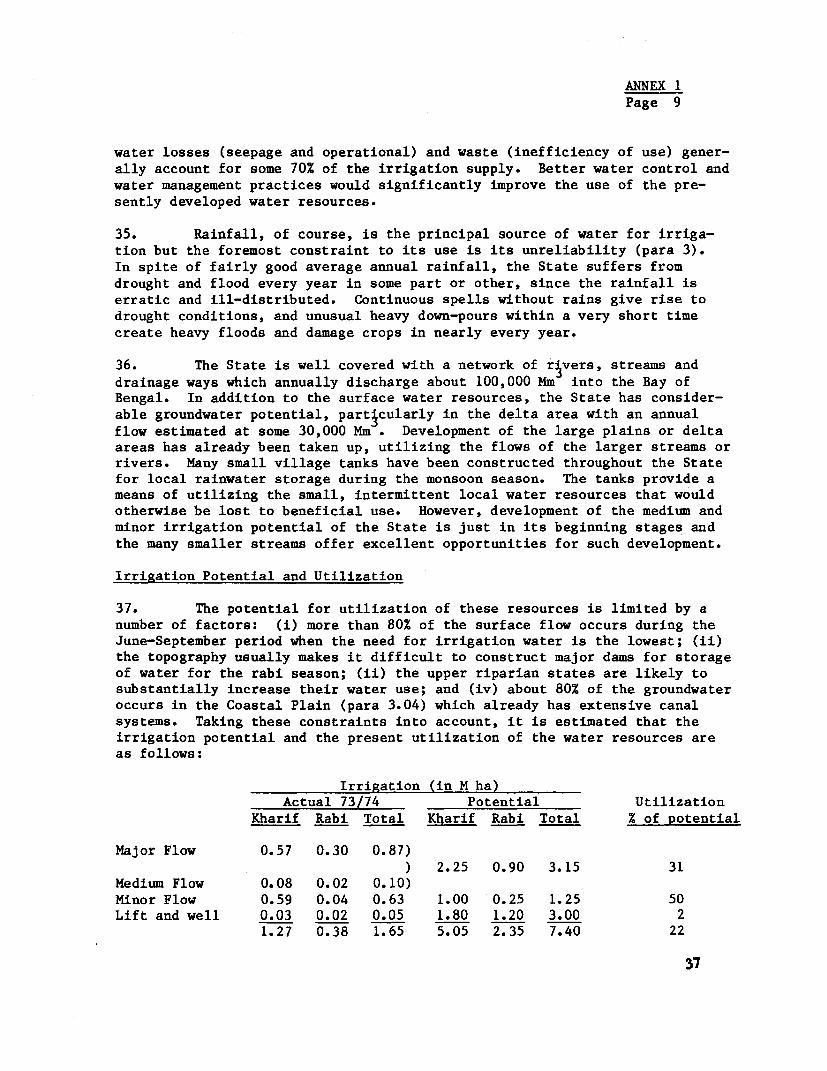
ANNEX 1Page 9
water losses (seepage and operational) and waste (inefficiency of use) gener-ally account for some 70% of the irrigation supply. Better water control andwater management practices would significantly improve the use of the pre-sently developed water resources.
35. Rainfall, of course, is the principal source of water for irriga-tion but the foremost constraint to its use is its unreliability (para 3).In spite of fairly good average annual rainfall, the State suffers fromdrought and flood every year in some part or other, since the rainfall iserratic and ill-distributed. Continuous spells without rains give rise todrought conditions, and unusual heavy down-pours within a very short timecreate heavy floods and damage crops in nearly every year.
36. The State is well covered with a network of rivers, streams anddrainage ways which annually discharge about 100,000 Mm into the Bay ofBengal. In addition to the surface water resources, the State has consider-able groundwater potential, particularly in the delta area with an annualflow estimated at some 30,000 Mm . Development of the large plains or deltaareas has already been taken up, utilizing the flows of the larger streams orrivers. Many small village tanks have been constructed throughout the Statefor local rainwater storage during the monsoon season. The tanks provide ameans of utilizing the small, intermittent local water resources that wouldotherwise be lost to beneficial use. However, development of the medium andminor irrigation potential of the State is just in its beginning stages andthe many smaller streams offer excellent opportunities for such development.
Irrigation Potential and Utilization
37. The potential for utilization of these resources is limited by anumber of factors: (i) more than 80% of the surface flow occurs during theJune-September period when the need for irrigation water is the lowest; (ii)the topography usually makes it difficult to construct major dams for storageof water for the rabi season; (ii) the upper riparian states are likely tosubstantially increase their water use; and (iv) about 80% of the groundwateroccurs in the Coastal Plain (para 3.04) which already has extensive canalsystems. Taking these constraints into account, it is estimated that theirrigation potential and the present utilization of the water resources areas follows:
Irrigation (in M ha)Actual 73/74 Potential Utilization
Kharif Rabi Total Kharif Rabi Total % of potential
Major Flow 0.57 0.30 0.87)) 2.25 0.90 3.15 31
Medium Flow 0.08 0.02 0.10)Minor Flow 0.59 0.04 0.63 1.00 0.25 1.25 50Lift and well 0.03 0.02 0.05 1.80 1.20 3.00 2
1.27 0.38 1.65 5.05 2.35 7.40 22
37
ANNEX 1Page 10
38. Major Irrigation Projects (over 12,000 ha). Construction of majorschemes started towards the end of the nineteenth century, when irrigationcanals covering about 150,00 ha were built in the Mahanadi and RushikulyaDeltas. During the first half of the twentieth century, the canal irrigatedarea remained virtually unchanged. However, since Independence GOO has com-pleted two major schemes and substantially extended the Mahanadi Delta system.The area commanded by existing projects is about 0.57 M ha. Presently, twomajor multipurpose schemes and one major irrigation project are under con-struction. When these projects are completed in the mid-1980s, the areacommanded by major projects will have increased to about 1.0 M ha.
39. Medium Irrigation Project (2,000 - 12,000 ha). Orissa's irrigationdevelopment has been concentrated in the relatively more prosperous deltaareas, utilizing the flow of large rivers. This has resulted in uneven dis-tribution of irrigation benefits and regionally unbalanced growth. Around1960, GOO realized this problem and started construction on a number of mediumirrigation projects (MIPS) in order to spread irrigation development moreevenly throughout the State. However, the commitment to these projects waslow and many MIPs were under construction for 10-15 years. At the start ofthe Fifth Five Year Plan, the emphasis changed from major to medium plans, andnow about 60% of the investment budget for irrigation projects is allocated toMIPs.
40. Minor Flow Irrigation_Projects (less than 2,000 ha). For centuries,the Orissa farmers have used bucket-lift and other traditional methods forirrigation. They have also constructed tanks for storage of local runoff dur-ing the monsoon. Typically, these projects only provide supplementary irriga-tion during the kharif season and the area irrigated varies substantiallyfrom year to year. Because of the low reliability of the irrigation supplyfrom these projects, they are given lower priority than major and mediumprojects and the irrigated area has remained virtually unchanged since Inde-pendence.
41. Groundwater. Orissa's groundwater potential remained largelyundeveloped until the mid-1960s. Since the Orissa Lift Irrigation Corpora-tion was created in 1973, groundwater development has been accelerating withIDA assistance through its line of credit to ARDC. Currently, there aresome 90,000 dug wells and 700 tubewells in operation. However, they irrigateonly about 50,000 ha.
August 1977
38
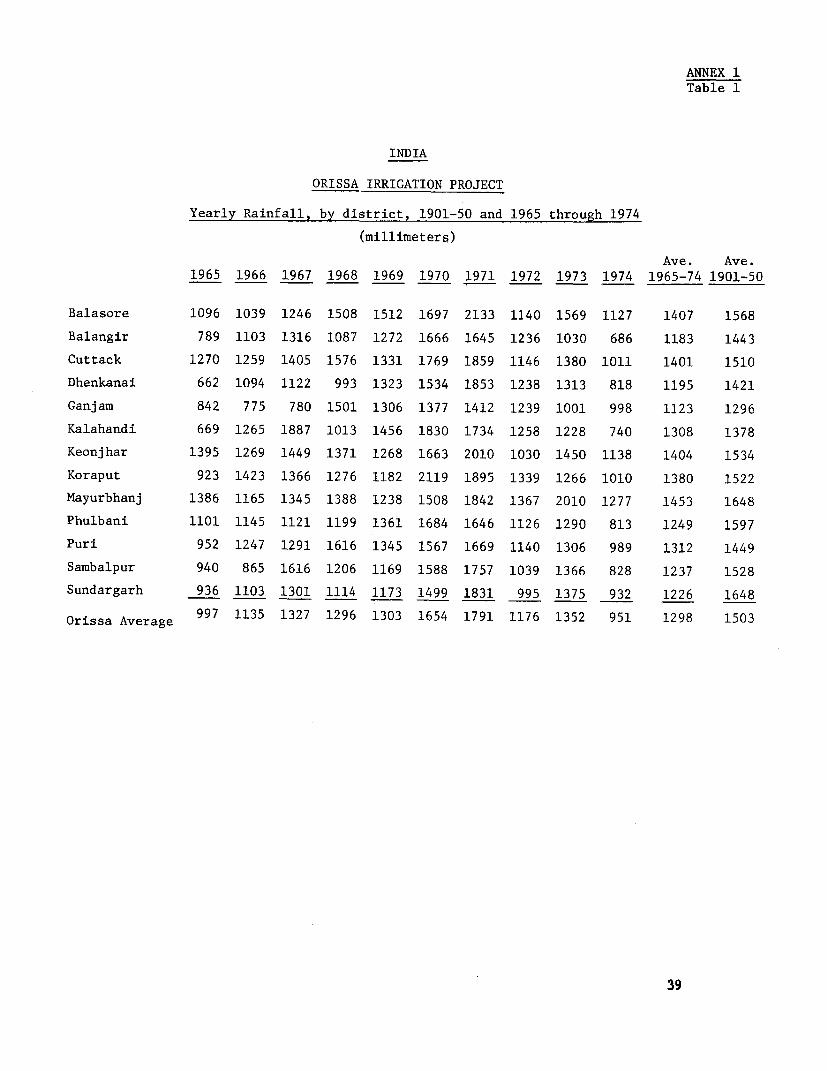
ANNEX 1Table 1
INDIA
ORISSA IRRIGATION PROJECT
Yearly Rainfall, by district, 1901-50 and 1965 through 1974
(millimeters)
Ave. Ave.1965 1966 1967 1968 1969 1970 1971 1972 1973 1974 1965-74 1901-50
Balasore 1096 1039 1246 1508 1512 1697 2133 1140 1569 1127 1407 1568
Balangir 789 1103 1316 1087 1272 1666 1645 1236 1030 686 1183 1443
Cuttack 1270 1259 1405 1576 1331 1769 1859 1146 1380 1011 1401 1510
Dhenkanai 662 1094 1122 993 1323 1534 1853 1238 1313 818 1195 1421
Ganjam 842 775 780 1501 1306 1377 1412 1239 1001 998 1123 1296
Kalahandi 669 1265 1887 1013 1456 1830 1734 1258 1228 740 1308 1378
Keonjhar 1395 1269 1449 1371 1268 1663 2010 1030 1450 1138 1404 1534
Koraput 923 1423 1366 1276 1182 2119 1895 1339 1266 1010 1380 1522
Mayurbhanj 1386 1165 1345 1388 1238 1508 1842 1367 2010 1277 1453 1648
Phulbani 1101 1145 1121 1199 1361 1684 1646 1126 1290 813 1249 1597
Puri 952 1247 1291 1616 1345 1567 1669 1140 1306 989 1312 1449
Sambalpur 940 865 1616 1206 1169 1588 1757 1039 1366 828 1237 1528
Sundargarh 936 1103 1301 1114 1173 1499 1831 995 1375 932 1226 1648
Orissa Average 997 1135 1327 1296 1303 1654 1791 1176 1352 951 1298 1503
39
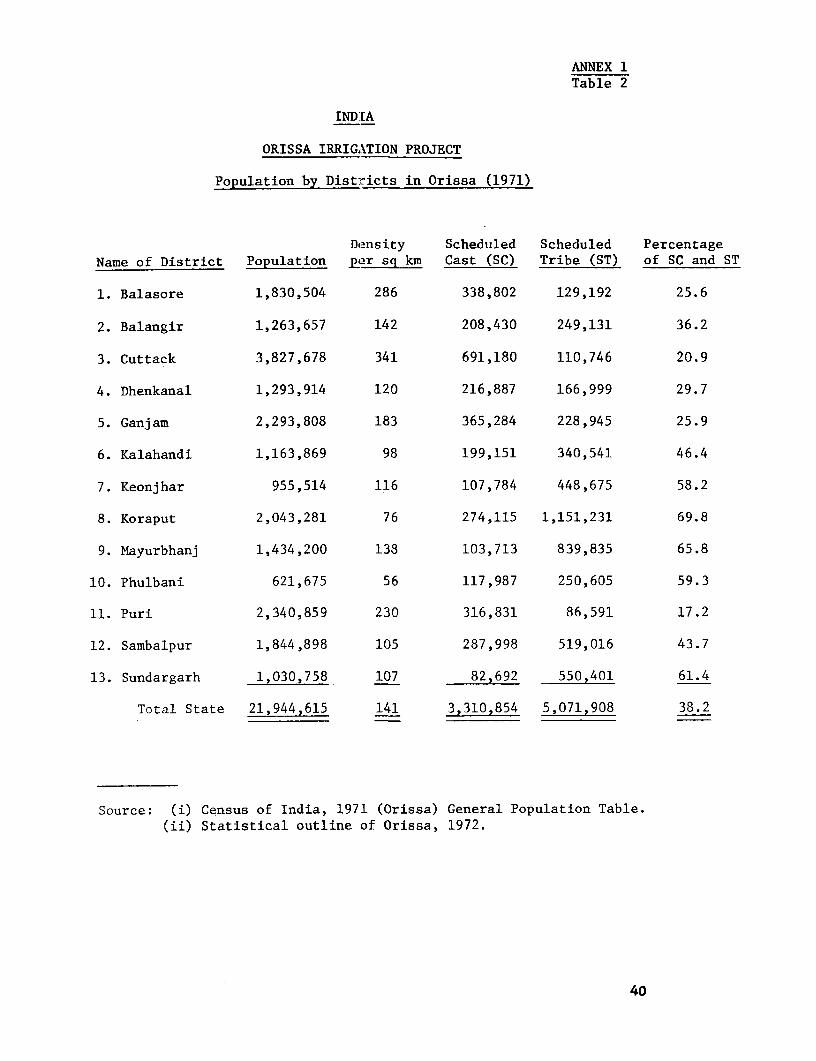
ANNEX 1Table 2
IND IA
ORISSA IRRIGATION PROJECT
Population by Districts in Orissa (1971)
Density Scheduled Scheduled Percentage
Name of District Population per sq km Cast (SC) Tribe (ST) of SC and ST
1. Balasore 1,830,504 286 338,802 129,192 25.6
2. Balangir 1,263,657 142 208,430 249,131 36.2
3. Cuttack 3,827,678 341 691,180 110,746 20.9
4. Dhenkanal 1,293,914 120 216,887 166,999 29.7
5. Ganjam 2,293,808 183 365,284 228,945 25.9
6. Kalahandi 1,163,869 98 199,151 340,541 46.4
7. Keonjhar 955,514 116 107,784 448,675 58.2
8. Koraput 2,043,281 76 274,115 1,151,231 69.8
9. Mayurbhanj 1,434,200 138 103,713 839,835 65.8
10. Phulbani 621,675 56 117,987 250,605 59.3
11. Puri 2,340,859 230 316,831 86,591 17.2
12. Sambalpur 1,844,898 105 287,998 519,016 43.7
13. Sundargarh 1,030,758 107 82,692 550,401 61.4
Total State 21,944,615 141 3,310,854 5,071,908 38.2
Source: (i) Census of India, 1971 (Orissa) General Population Table.(ii) Statistical outline of Orissa, 1972.
40
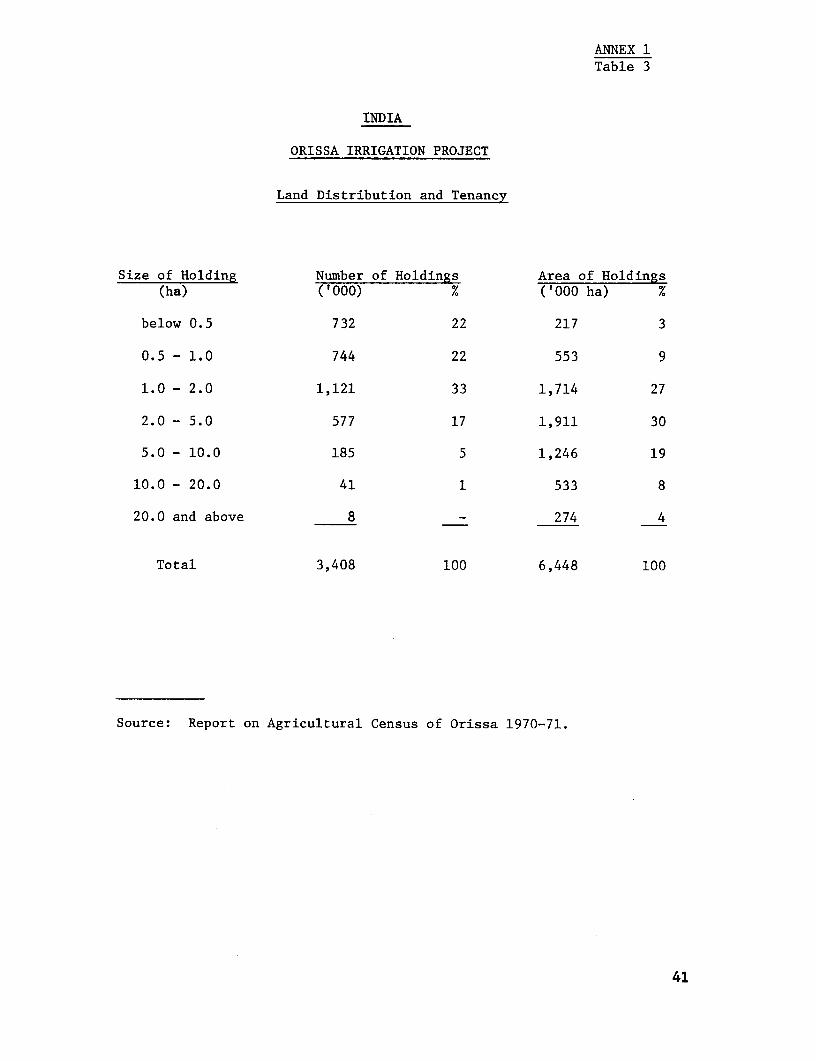
ANNEX 1Table 3
INDIA
ORISSA IRRIGATION PROJECT
Land Distribution and Tenancy
Size of Holding Number of Holdings Area of Holdings(ha) ('000) % ('000 ha) %
below 0.5 732 22 217 3
0.5 - 1.0 744 22 553 9
1.0 - 2.0 1,121 33 1,714 27
2.0 - 5.0 577 17 1,911 30
5.0 - 10.0 185 5 1,246 19
10.0 - 20.0 41 1 533 8
20.0 and above 8 - 274 4
Total 3,408 100 6,448 100
Source: Report on Agricultural Census of Orissa 1970-71.
41
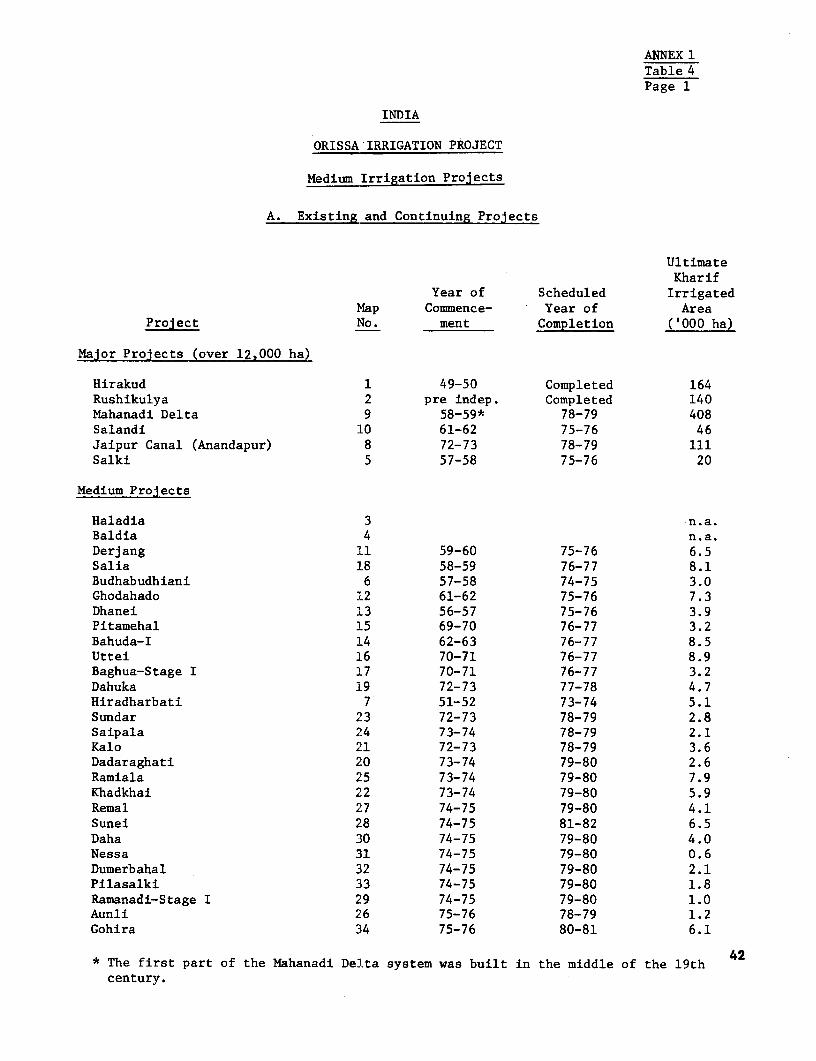
ANNEX 1
Table 4Page 1
INDIA
ORISSA IRRIGATION PROJECT
Medium Irrigation Projects
A. Existing and Continuing Projects
UltimateKharif
Year of Scheduled IrrigatedMap Commence- Year of Area
Project No. ment Completion ('000 ha)
Major Projects (over 12,000 ha)
Hirakud 1 49-50 Completed 164Rushikulya 2 pre indep. Completed 140Mahanadi Delta 9 58-59* 78-79 408Salandi 10 61-62 75-76 46Jaipur Canal (Anandapur) 8 72-73 78-79 111Salki 5 57-58 75-76 20
Medium Projects
Haladia 3 n.a.Baldia 4 n.a.Derj ang 11 59-60 75-76 6.5Salia 18 58-59 76-77 8.1Budhabudhiani 6 57-58 74-75 3.0Ghodahado 12 61-62 75-76 7.3Dhanei 13 56-57 75-76 3.9Pitamehal 15 69-70 76-77 3.2Bahuda-I 14 62-63 76-77 8.5Uttei 16 70-71 76-77 8.9Baghua-Stage I 17 70-71 76-77 3.2Dahuka 19 72-73 77-78 4.7Hiradharbati 7 51-52 73-74 5.1Sundar 23 72-73 78-79 2.8Saipala 24 73-74 78-79 2.1Kalo 21 72-73 78-79 3.6Dadaraghati 20 73-74 79-80 2.6Ramiala 25 73-74 79-80 7.9Khadkhai 22 73-74 79-80 5.9Remal 27 74-75 79-80 4.1Sunei 28 74-75 81-82 6.5Daha 30 74-75 79-80 4.0Nessa 31 74-75 79-80 0.6Dumerbahal 32 74-75 79-80 2.1Pilasalki 33 74-75 79-80 1.8Ramanadi-Stage I 29 74-75 79-80 1.0Aunli 26 75-76 78-79 1.2Gohira 34 75-76 80-81 6.1
* The first part of the Mahanadi Delta system was built in the middle of the 19th 42century.
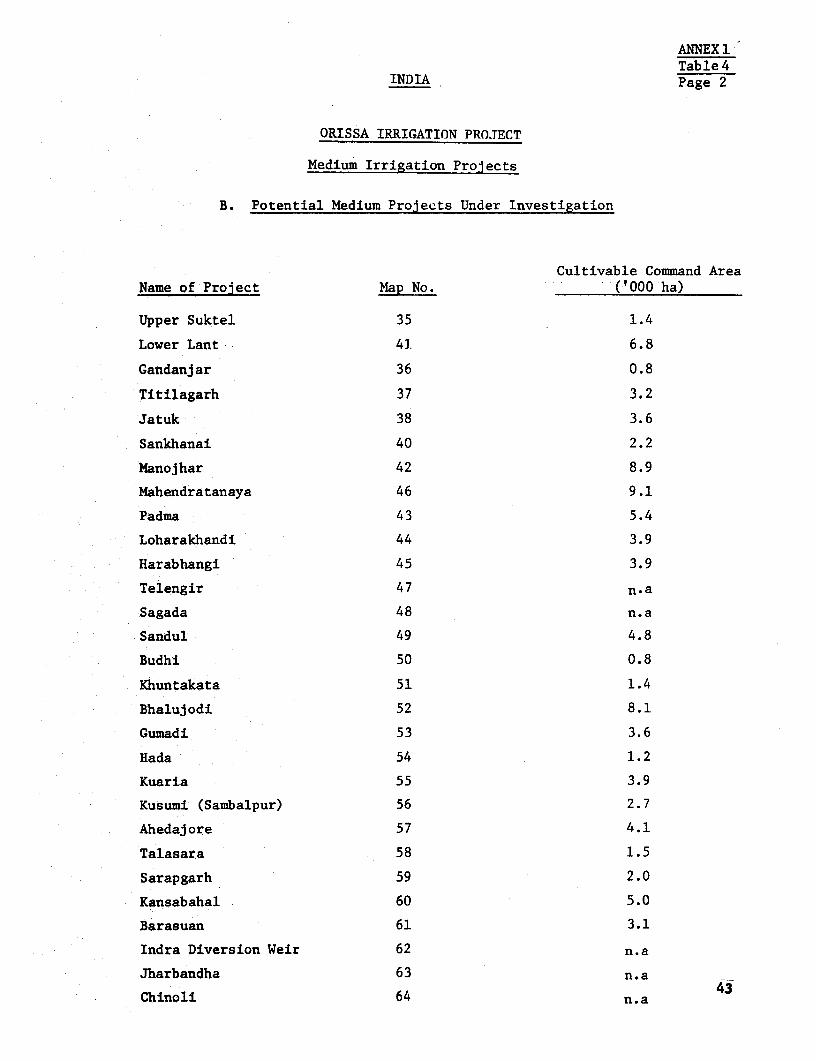
ANNEX 1Table 4
INDIA Page 2
ORISSA IRRIGATION PROJECT
Medium Irrigation Projects
B. Potential Medium Projects Under Investigation
Cultivable Command AreaName of ProJect Map No. ('000 ha)
Upper Suktel 35 1.4
Lower Lant 41. 6.8
Gandanjar 36 0.8
Titilagarh 37 3.2
Jatuk 38 3.6
Sankhanai 40 2.2
Manojhar 42 8.9
Mahendratanaya 46 9.1
Padma 43 5.4
Loharakhandi 44 3.9
Harabhangi 45 3.9
Telengir 47 n.a
Sagada 48 n.a
Sandul 49 4.8
Budhi 50 0.8
Khuntakata 51 1.4
Bhalujodi 52 8.1
Gumadi 53 3.6
Hada 54 1.2
Kuaria 55 3.9
Kusumi (Sambalpur) 56 2.7
Ahedajore 57 4.1
Talasara 58 1.5
Sarapgarh 59 2.0
Kansabahal 60 5.0
Barasuan 61 3.1
Indra Diversion Weir 62 n.a
Jharbandha 63 n.a
Chinoli 64 n.a
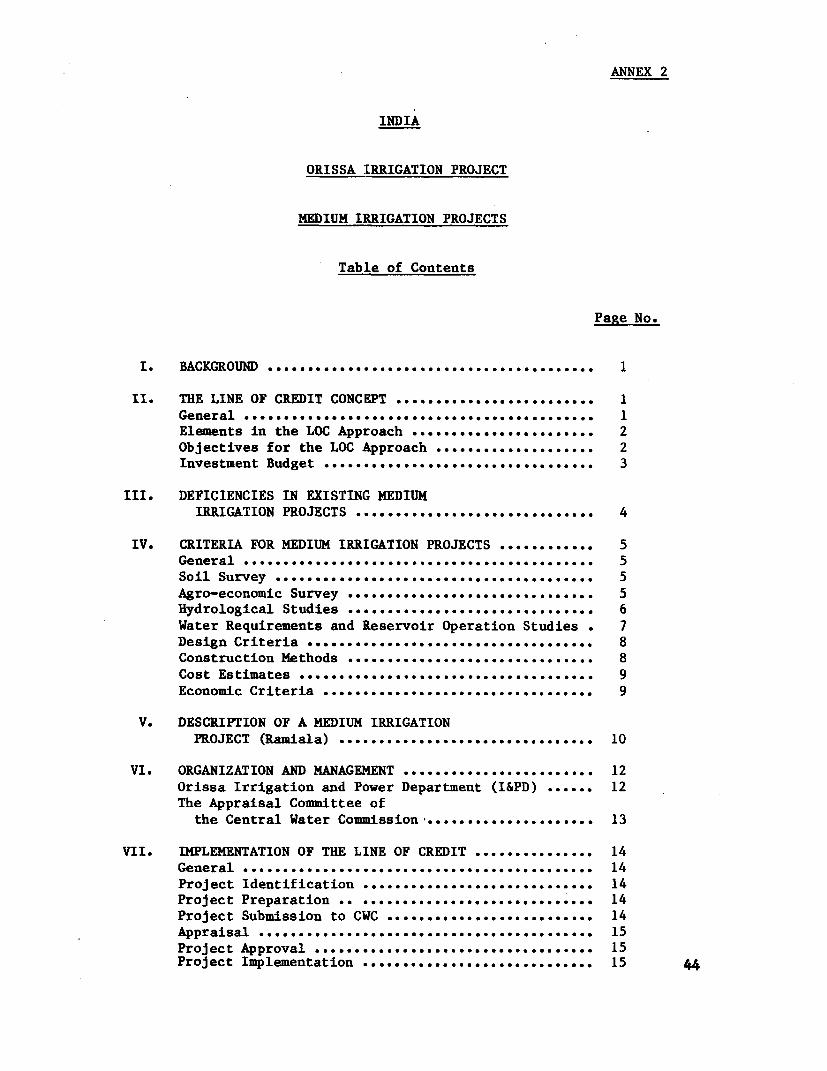
ANNEX 2
INDIA
ORISSA IRRIGATION PROJECT
MEDIUM IRRIGATION PROJECTS
Table of Contents
Page No.
Is BACKGROUND I...........................
II. THE LINE OF CREDIT CONCEPT ...o ............. 1General ............................... 1
Elements in the LOC Approach ....................... 2Objectives for the LOC Approach .........ss........... 2
Investment Budget ................................. 3
III. DEFICIENCIES IN EXISTING MEDIUMIRRIGATION PROJECTS .................... o....e..... 4
IV. CRITERIA FOR MEDIUM IRRIGATION PROJECTS ............ 5
General ........................* .................... 5
Soil Survey ........ooo ......... ............... 5
Agro-economic Survey ....................... *****.. 5Hydrological Studies ................ ..... .... .. . 6Water Requirements and Reservoir Operation Studies . 7
Design Criteria s ................................... 8
Construction Methods ..... o..... .......... ... * . .... .. . 8
Cost Estimates ....... .................................... 9
Economic Criteria .................................. 9
V. DESCRIPTION OF A MEDIUM IRRIGATIONPROJECT (Ramiala) ............................... 10
VI. ORGANIZATION AND MANAGEMENT ........................ 12
Orissa Irrigation and Power Department (I&PD) ...... 12
The Appraisal Committee ofthe Central Water Commission-..........o.......... 13
VII. IMPLEMENTATION OF THE LINE OF CREDIT .......... ..... 14
General ................. ...... 00...................... 14
Project Identification ..........-.......... o...se.. 14
Project Preparation .. ............................. 14
Project Submission to CWC ......................... 14
Appraisal ..oo.............. 15
Project Approval .. ....................... 15Project Implementation ......................... 15 44
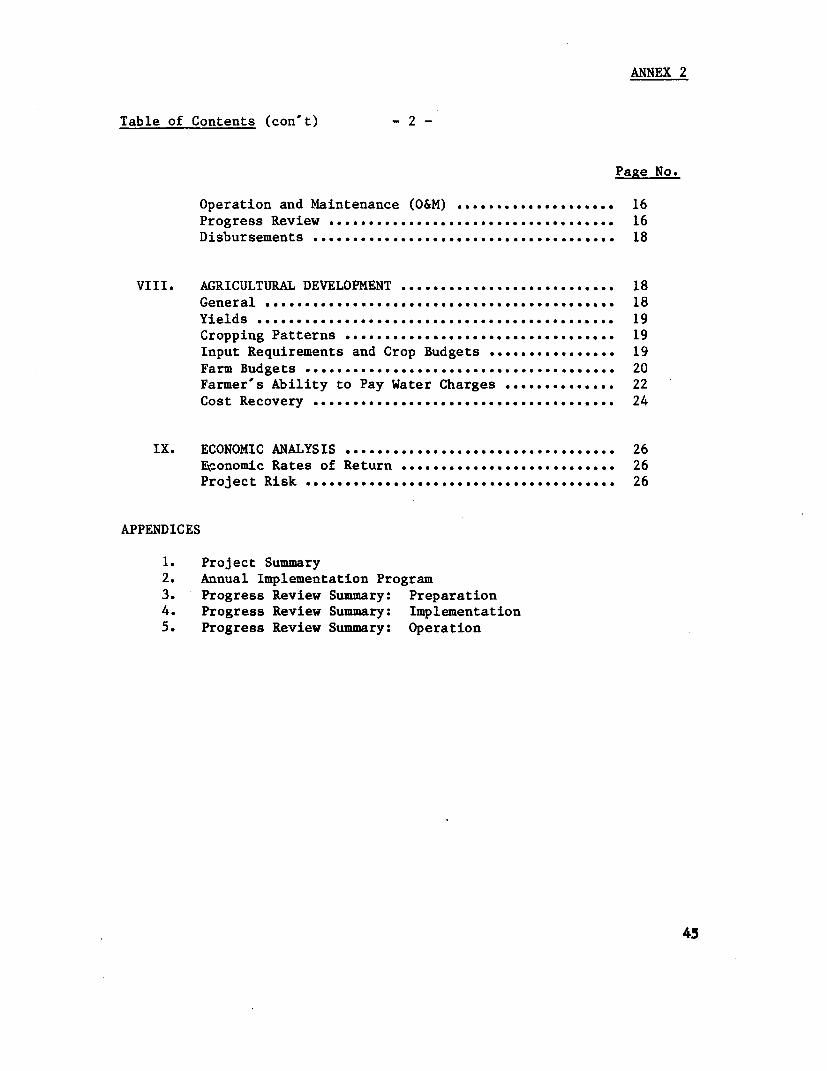
ANNEX 2
Table of Contents (con't) - 2 -
Page No.
Operation and Maintenance (O&M) .................... 16
Progress Review .. . ... .... ..... .... *... 0-. ... ... 16
Disbursements .................... 18
VIII. AGRICULTURAL DEVELOPMENT .. ... ...................... 18
General .... ooo.*ooooo.o..* ... o.........o...o........o 18Yields -ooo .... o..000.0.0*0...0.00.00000........ .... 19Cropping Patterns *.... *ooo.........*................ 19
Input Requirements and Crop Budgets o ........... 0...0 19
Farm Budgets o.o....ooo.............. o.................... 20Farmer's Ability to Pay Water Charges .............. 22
Cost Recovery .-.-... 0..... ..... . ... .0 ..... ..... 24
IX. ECONOMIC ANALYSIS .... o ............. ......... ........ 26E-onomic Rates of Return .................... 00 ....... 26
Project Risk ooo .................. 00..*...00.0.0...... 26
APPENDICES
1. Project Summary2. Annual Implementation Program3. Progress Review Summary: Preparation4. Progress Review Summary: Implementation5. Progress Review Summary: Operation
45
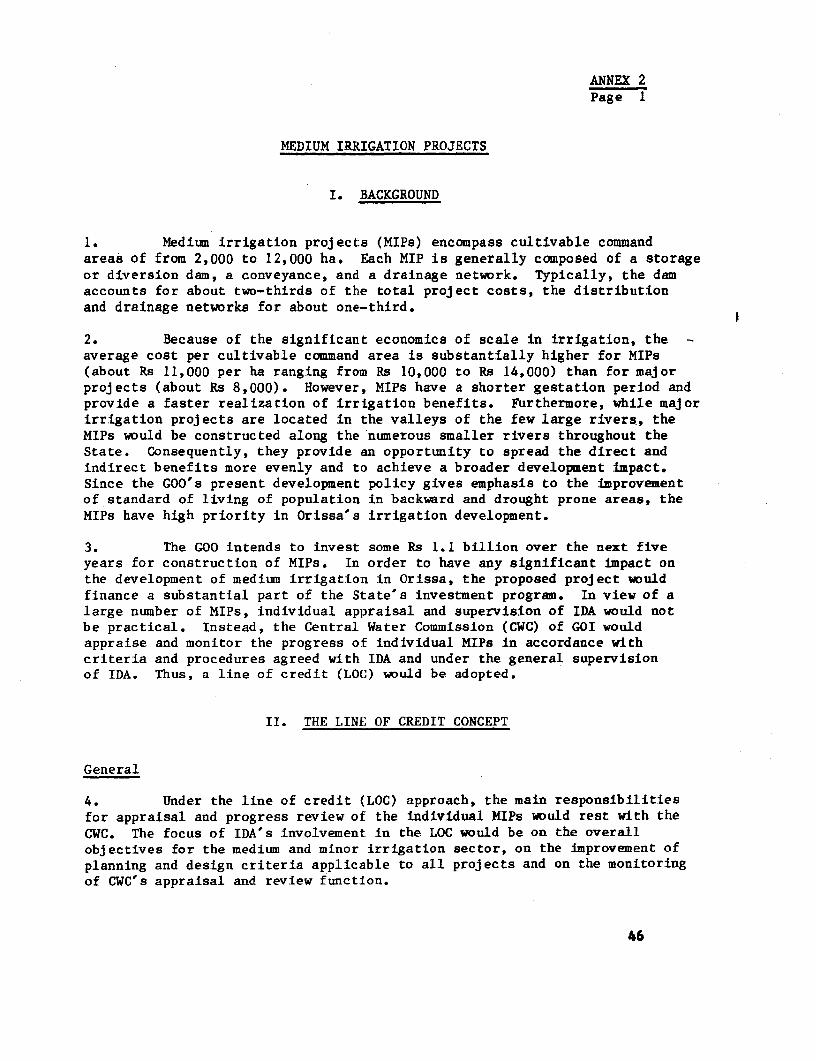
ANNEX 2Page 1
MEDIUM IRRIGATION PROJECTS
I. BACKGROUND
1. Medium irrigation projects (MIPs) encompass cultivable commandareas of from 2,000 to 12,000 ha. Each MIP is generally composed of a storageor diversion dam, a conveyance, and a drainage network. Typically, the damaccounts for about two-thirds of the total project costs, the distributionand drainage networks for about one-third.
2. Because of the significant economics of scale in irrigation, theaverage cost per cultivable command area is substantially higher for MIPs(about Rs 11,000 per ha ranging from Rs 10,000 to Rs 14,000) than for majorprojects (about Rs 8,000). However, MIPs have a shorter gestation period andprovide a faster realization of irrigation benefits. Furthermore, while majorirrigation projects are located in the valleys of the few large rivers, theMIPs would be constructed along the numerous smaller rivers throughout theState. Consequently, they provide an opportunity to spread the direct andindirect benefits more evenly and to achieve a broader development impact.Since the GOO's present development policy gives emphasis to the improvementof standard of living of population in backward and drought prone areas, theMIPs have high priority in Orissa's irrigation development.
3. The GOO intends to invest some Rs 1.1 billion over the next fiveyears for construction of MIPs. In order to have any significant impact onthe development of medium irrigation in Orissa, the proposed project wouldfinance a substantial part of the State's investment program. In view of alarge number of MIPs, individual appraisal and supervision of IDA would notbe practical. Instead, the Central Water Commission (CWC) of GOI wouldappraise and monitor the progress of individual MIPs in accordance withcriteria and procedures agreed with IDA and under the general supervisionof IDA. Thus, a line of credit (LOC) would be adopted.
II. THE LINE OF CREDIT CONCEPT
General
4. Under the line of credit (LOC) approach, the main responsibilitiesfor appraisal and progress review of the individual MIPs would rest with theCWC. The focus of IDA's involvement in the LOC would be on the overallobjectives for the medium and minor irrigation sector, on the improvement ofplanning and design criteria applicable to all projects and on the monitoringof CWC's appraisal and review function.
46
ANNEX 2Page 2
Elements in the LOC Approach
5. The LOC approach contains the following elements:
(a) An assessment of the agricultural and irrigation potentialin Orissa (Annex 1);
(b) A review of the effectiveness of existing projects aswell as plans and designs for projects under prepara-tion (paras 10-16);
(c) Development of guidelines and criteria for the prepara-tion, design, construction and evaluation of the sub-projects (paras 17-25);
(d) A review of GOO's institutional capability to plan andimplement the MIPs (paras 28-29);
(e) Establishment of an Appraisal Committee (AC) withinthe CWC for progress review and appraisal of theindividual subprojects (paras 30-32); and
(f) Establishment of procedures for approval and progressreview of subprojects and for disbursements (paras 33-56).
Objectives for the LOC Approach
6. The line of credit approach for medium and minor irrigation inOrissa would achieve the following objectives:
Institutional: (i) Strengthening appraisal capability withinCWC, which is the central technical auth-ority for approval of irrigation projectsin India.
(ii) Strengthening coordination between variousdepartments in Orissa to ensure that multi-sectoral considerations are taken intoaccount in the planning, implementationand operation of medium and minor irrigationproj ects.
Technical: (i) Establishing a better data base for the plan-ning and design of MIPs.
(ii) Establishing technical criteria leading to amore efficient use of water in MIPs.
4?
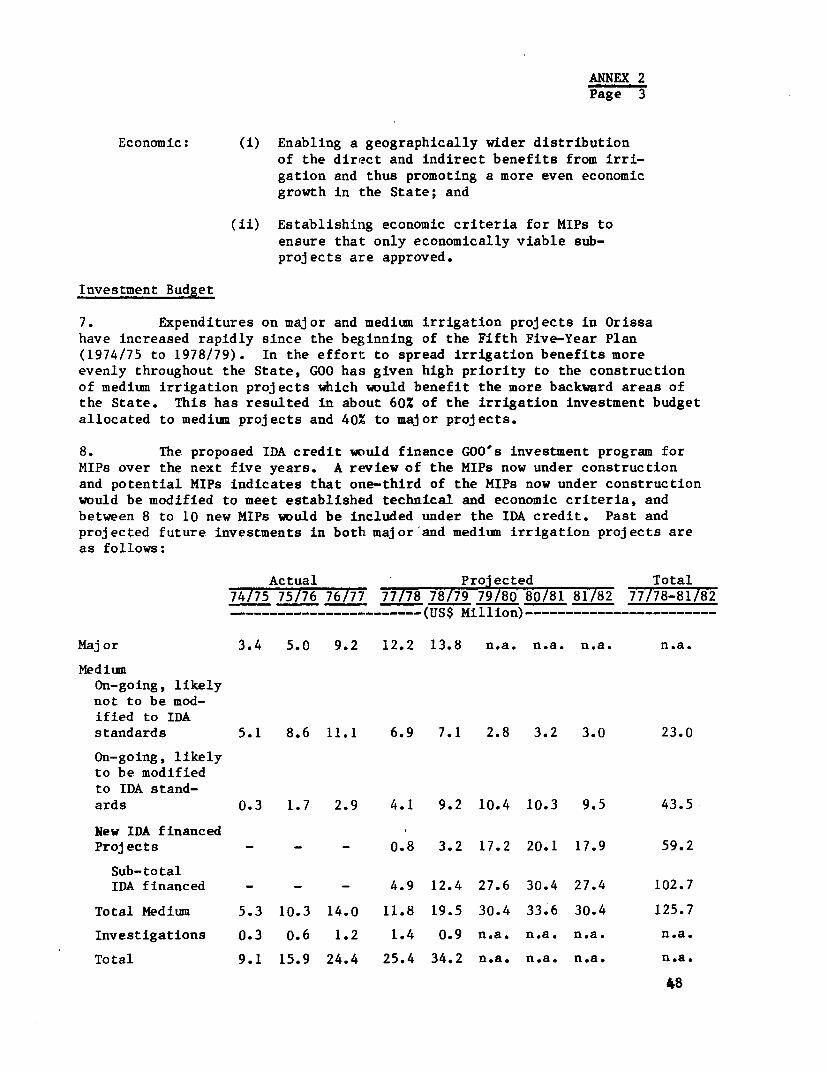
ANNEX 2Page 3
Economic: (i) Enabling a geographically wider distributionof the direct and indirect benefits from irri-gation and thus promoting a more even economicgrowth in the State; and
(ii) Establishing economic criteria for MIPs toensure that only economically viable sub-projects are approved.
Investment Budget
7. Expenditures on major and medium irrigation projects in Orissahave increased rapidly since the beginning of the Fifth Five-Year Plan(1974/75 to 1978/79). In the effort to spread irrigation benefits moreevenly throughout the State, GOO has given high priority to the constructionof medium irrigation projects which would benefit the more backward areas ofthe State. This has resulted in about 60% of the irrigation investment budgetallocated to medium projects and 40% to major projects.
8. The proposed IDA credit would finance GOO's investment program forMIPs over the next five years. A review of the MIPs now under constructionand potential MIPs indicates that one-third of the MIPs now under constructionwould be modified to meet established technical and economic criteria, andbetween 8 to 10 new MIPs would be included under the IDA credit. Past andprojected future investments in both major and medium irrigation projects areas follows:
Actual Projected Total74/75 75/76 76/77 77/78 78/79 79/80 80/81 81/82 77/78-81/82-----------------------…(US$ Million)------------------------
Major 3.4 5.0 9.2 12.2 13.8 n.a. n.a. n.a. n.a.
MediumOn-going, likelynot to be mod-ified to IDAstandards 5.1 8.6 11.1 6.9 7.1 2.8 3.2 3.0 23.0
On-going, likelyto be modifiedto IDA stand-ards 0.3 1.7 2.9 4.1 9.2 10.4 10.3 9.5 43.5
New IDA financedProjects - - - 0.8 3.2 17.2 20.1 17.9 59.2
Sub-totalIDA financed - - - 4.9 12.4 27.6 30.4 27.4 102.7
Total Medium 5.3 10.3 14.0 11.8 19.5 30.4 33.6 30.4 125.7
Investigations 0.3 0.6 1.2 1.4 0.9 n.a. n.a. n.a. n.a.
Total 9.1 15.9 24.4 25.4 34.2 n.a. n.a. n.a. n.a.
48
ANNEX 2Page 4
9. The proposed credit would finance about three-quarters of GOO'sinvestment program for MIPs over the next five years.
III. DEFICIENCIES IN EXISTING MEDIUM IRRIGATION PROJECTS
10. Although the cost of irrigation is substantially higher in MIPsthan in major projects, lower standards are at present followed in projectplanning, in the design and construction of the distribution network and in
operation and maintenance procedures, resulting in considerable waste of waterand a rapid deterioration of the canal system. The IDA's review of existingand planned MIPs has identified a number of deficiencies in present prac-
tices, which are discussed briefly below.
11. One of the principal factors contributing to poorly functioningprojects is the unreliability of the data base used in the planning process.In Orissa, investigation costs for MIPs are presently limited to 1% of the
total estimated project cost, while the provision for major projects rangesbetween 1% and 3%. The result of this low budget allocation for projectpreparation is that only the most rudimentary data collection is done. Thehydrological data base is typically poor which results in an over or under
design of the dam and the command area in relation to the water de factoavailable. An allocation of 3% to 5% would be required for MIPs.
12. No soil survey or agricultural surveys have been carried out and
this has resulted in the adoption of design cropping patterns that eitherare unlikely to be adopted by the farmers or would lead to uneconomic useof irrigation water. This problem is enhanced by the fact that the designof MIPs is a pure engineering exercise with only nominal input from exper-ienced agriculturalists.
13. Water losses in conveyance and on the fields are underestimatedleading to a much smaller irrigated area than what was originally planned.
14. Irrigation water is supplied through outlets designed to serve40 ha blocks. The farmers are expected to construct field channels anddrains within these blocks. However, no effective organization exists to
help them with the design and implementation of these works, which has meantthat virtually no field channels have been constructed. This leads to watershortages in some parts of the blocks and water logging in other parts.
15. Except around structures, canal banks are not compacted, which,
combined with poor maintenance, has led to a rapid deterioration of theconveyance system and high operational and seepage losses.
16. Water allocation decisions are undertaken by the local revenueofficer and not by the irrigation staff responsible for operation and main-
tenance of the system. This frequently results in unsystematic and uneconom-ical water delivery schedules.
49
ANNEX 2Page 5
IV. CRITERIA FOR MEDIUM IRRIGATION PROJECTS
General
17. Based on a review of existing MIPs in Orissa and of present designstandards (paras 10-16), a number of specific criteria for the planning, de-sign and construction of MIPs to be financed under the LOC have been devel-oped. It would be the responsibility of the CWC to ensure that these criteriaare met for all the subprojects approved under the LOC.
Soil Survey
18. A soil survey and land classification map derived therefrom shouldbe carried out prior to the implementation of the project 1/ in order toestablish the extent and level of suitability of the proposed project landsfor sustained crop production under irrigation. The lands should be rankedthrough consideration of the physical and chemical attributes, topography,drainage and other relevant soil-related characteristics, and shall be des-ignated by classes on the basis of the integrated effects of these charac-teristics on attainable, profitable crop production. Two basic land classessuitable for production of diversified upland crops, two classes for lowlandcrops, one class to identify lands where crops can be grown but irrigationdevelopment probably would not be profitable, and one class to identify thenon-arable lands would be established. These classes should be indicatedappropriately on maps along with subscripts denoting the kind and the inten-sity of the production constraints that now have or would have a stronginfluence on the yield and/ or on the cost of producing adaptable crops.
Agro-economic Survey
19. In order to provide a basis for future agricultural, social andeconomic development planning of an irrigated command area, an agro-economicsurvey should be undertaken prior to the implementation of the project. 1/Standard questionnaires should be developed jointly by the Directorate ofAgriculture and Food Production and the Planning Cell of the Irrigation andPower Department. The survey should cover the following factors:
(a) Demographic and social characteristics (population,average family size, labor force).
(b) Employment (farm, non-farm) and income;
(c) Land use, ownership and farm size distribution;
(d) Existing cropping pattern and yields (distinguish betweenrainfed and irrigated agriculture);
1/ For ongoing projects these data can be collected concurrently withproject construction.
50
ANNEX 2Page 6
(e) Agricultural production and disposal;
(f) Marketing channels and prices;
(g) Use of agricultural inputs for both rainfed andirrigated conditions (fertilizer, draft power); and
(h) Agricultural supporting services (extension services,storage facilities).
Hydrological Studies
20. Basic hydrological data required for each medium and minorirrigation project to be included in the LOC would be:
(a) A minimum 20-year rainfall record in or near the catch-ment area, with a ten year minimum record allowable forprojects where a reasonable correlation with long-termrecords in adjacent basins is possible. Rainfall datacorrelations should be adjusted for altitude differen-tials, where the correlated record is used to computecatchment runoff.
(b) A stream gauging network on major tributaries and/orat the dam site should be established. Streamflowmeasurements should be made with recently rated(within two years under normal use) current metersin accordance with accepted practice. Stable riverinvert sections should be established at each gaugingsite, with the invert designed to accurately measurelow flows. Alternatively low flow measurements may bemade with carefully set weirs or other accurate flowmeasurement devides.
(c) At least one year stream gauging record should be avail-able. 2/ The recorded streamflow should be used to cor-relate the actual streamflow at the site with runoffcomputed using long-term rainfall records. Streamflowshould be reconstituted on a monthly basis for a 20-yearstudy period using a proven simulation program. Projectssubmitted for approval in the second and third years, (orlonger) should have a 2 and 3 year stream gauging programfor correlation purposes, respectively.
1/ For ongoing projects these data can be collected concurrently withproject construction.
2/ For ongoing projects, the current meter measurements could be carriedout simultaneously with the construction of the dam or diversion weir.
51
ANNEX 2Page 7
(d) Sediment samples should be taken at each dam site for awide range of streamflows for use in estimating reservoirsediment space requirements.
Water Requirements and Reservoir Operation Studies
21. General planning criteria to be followed in determining waterrequirements and for reservoir operation studies:
(a) Crop water requirements for rice and diversifiedupland crops should be determined by Christiansen'smethod, in accordance with the procedures laiddown in the publication "A Guide for EstimatingIrrigation Water Requirements" prepared by theMinistry of Agriculture, Government of India.Alternatively, the water requirements may be cal-culated according to the Modified Penman method,following FAO Irrigation and Drainage Paper No. 24.For rice, land preparation requirements should in-clude water for saturation, evaporation and per-colation. During the cultivation period, waterrequirements for percolation losses and a cultiva-tion depth (normally 3 to 4 inches) should be pro-vided. This also applies to paddy nurseries.
(b) Assumed canal conveyance efficiencies would not begreater than 70% for irrigation systems flowing atmore than 80% of their capacity and 60% for systemsflowing at less than 80%. Field irrigation effi-ciencies of not more than 90% for rice crops and60% for diversified (upland) crops should be assumed inaccordance with local conditions. Where land is leveled,higher efficiencies up to 70% may be used for uplandcrops.
(c) The area to be commanded by the project in the kharifseason (or the active reservoir capacity) should be sizedto provide full irrigation requirements in 75 years outof 100. A 10% under-irrigation in any single month canbe assumed with a slight reduction in yield. The area tobe cropped in the rabi season is dependent on storageavailable at the end of kharif. For the economic evalua-tion, the average rabi area would be established througha 20-year reservoir operations study.
52
ANNEX 2Page 8
Design Criteria
22. The following minimum design standards should be met:
(a) The Irrigation and Power Department should construct --and maintain -- watercourses and regulated turn-outsserving areas no larger than 5 ha each. 1/
(b) Minor canal designs should be made on the basis ofwarabundi (rotational) irrigation. The designsshould provide for peak carrying capacity as deter-mined on the basis of crop water requirement com-putations;
(c) Canals and watercourses should be designed and con-structed to permit full irrigation deliveries to allcommand areas when flows in the canals or minors areless than 50% capacity. For this purpose, cross re-gulators or check structures should be provided toraise water levels in the watercourses, and turnoutsshould be designed and constructed to permit gravityreleases to the whole area. Drop structures shouldbe provided for all watercourses and drains, at loca-tions where flows otherwise would be excessive andcreate erosion problems.
Construction Methods
23. The construction of the projects should follow sound engineeringstandards, in particular:
(a) The Government should ensure that the land clearing andshaping on presently uncultivated land are done by theconcerned individuals/agencies prior to the delivery of water.
(b) Special care should be taken in construction of canalsand minor distributors to guard against leakage andexcessive erosion. In this regard, canal embankmentsand earthfill around structures should be compacted.Furthermore, where the canal invert is in fill, thecanal banks and the invert should be compacted. Mechan-ical compaction equipment should be employed.
I/ This criterion is required since CAD has been excluded from the MMIPs.CAD is a slow, time consuming process that requires heavy concentrationon institution building in its early stages. Since the numerous MMIPswould be spread over the whole State, it is not feasible at this stageto establish effective institutions covering all MIPs that can assistthe farmers in the design, implementation and financing of on-farmworks. Thus, in order to improve water distribution at the farm level,the blocks canal system would be designed with farm turn-outs thatserve 5 ha instead of the normal 40 ha blocks. 53
ANNEX 2Page 9
(c) Construction of each project should be completed withinfive years.
(d) The Government should ensure that the land clearing andshaping on present uncultivated land are done by theconcerned individuals/agencies prior to the delivery ofwater.
(e) An emergency spillway should be provided where favorabletopography exists to reduce spillway costs and/or reducethe risk of dam failure from a flood greater than thatpredicted using the data available.
Cost Estimates
24. Cost estimates for project construction work should be based onbid prices prevailing in the project area at the time of project submission.A physical contingency factor of 20% of the construction cost should beapplied. The Government's costs for administration, project preparation,design and construction supervision (normally about 20% of the constructioncost of works excluding cost of land and special tools and plants) shouldbe included in the estimate. The estimate also should include the cost ofland acquisition costs associated with resettlement of farmers displaceby the projects and costs of land clearing, shaping and levelling, if any,for presently uncultivated land.
Economic Criteria
25. The economic viability of the projects should be established througha comparison of the discounted project benefits with the discounted projectcosts. In order to ensure that consistent and realistic yield, input andprice assumptions are made and to simplify the calculations, the benefitmatrix, 1/ developed by IDA, should be used for the economic evaluation ofprojects included under the LOC. The "Form for establishing the economicviability of medium and minor irrigation projects" (Appendix 1, page 5)should be filled out in the following manner:
(a) Benefits. The present and the anticipated cropping patternshould be inserted on the appropriate lines of the form andtotal benefits should be calculated through multiplicationswith the benefit factors of each crop. Different sets ofbenefit factors should be used for drought prone areas,defined by the total average (20 years minimum records)kharif rainfall (June to October).
(b) Costs. The basic project cost should be calculated inaccordance with procedures described in para 24. For theeconomic analysis, land acquisition cost should be excluded
1/ Basic assumptions used in the derivation of the economic value per haof each crop ("benefit factors") are described in detail in Annex 5.
54
ANNEX 2Page 10
The basic cost should be adjusted for the length of theimplementation period. For projects with an implementationperiod of five years, no adjustment should be done, forprojects with a four and three-year implementation period,the base cost would be reduced by 6% and 11%, respectively.
(c) Economic Viability. The buildup rates and discounting factorsof both benefits and costs are taken into account in the bene-fit factors. Consequently, the total incremental projectbenefit should be compared directly to the adjusted projectcost. If the benefit/cost (B/C) ratio is higher than 1.0, 1/
the AC would be authorized to approve the project.
V. DESCRIPTION OF A MEDIUM IRRIGATION PROJECT (Ramiala)
26. The Ramiala Irrigation Project is one of the MIPs anticipated to beincluded under the line of credit. Work on the project has been started since
1975/76 and the expenditure incurred up to the present amounts to 6% of thetotal project cost. The project was appraised jointly by the IDA mission and
the technical staff of CWC.
27. The project is located in the Dhenkanal District of Orissa State.It envisages the construction of a dam across the Ramiala River along with a
distribution and drainage network. The project would benefit about 2,700farm households mostly of the subsistence category which practice rainfedfarming. Farm size distribution in the command area is 50% less than 1 ha,
40% between 1 to 2 ha and only about 10% above 2 ha. Average per capitaincome is about Rs 250 and far below the poverty level. Salient features of
this project are:
Hydrology
Catchment - 328 sq kmMean Annual Rainfall: 118.3 Cm.
Reservoir
Full reservoir level (FRL) - 109.73 mMaximum water level (MWL) - 110.64 mDead Storage level (DSL) - 101.95 mGross Storage at FRL - 86 Mm 3Dead Storage at DSL - 16.6 Mm3
Live Storage - 69.4 MmTop Level of Dam - 113.69 m
Submerged Are of MWL - 1,669 ha
1/ A 12% rate of opportunity cost of capital has been chosen for the calcu-
lation of the benefit factors. The established criteria implies thatprojects with a rate of return higher than 13% can be approved by AC.
55
ANNEX 2Page 11
Main Dam
Type: Rolled earth filled homogenous sectionTotal length of dam - 475.00 mMaximum height of dam from
deepest foundation level - 28.35 m
Spillway
Type: Ogee type with radial crest gates 12.20 x 6.10 mSize - 4 nos.Length of Spillway - 60.96 mSpillway capacity
(design flood) - 2,831 m /sec
Distribution System
Length of unlinedmain canals - 31.50 km
Unlined water courses with 5 ha block outlets.Gross command area - 12,455 haCultivable Command Area - 9,990 haArea irrigated during
kharif - 7,492 haArea irrigated duringrabi - 5,194 ha
Total annual irrigation - 12,685 ha
56
ANNEX 2Page 12
Cost Estimate CultivableRs '000 Rs/Command Area % of Total
Land Acquisition
Dam (includingresettlement) 8,620
Main Canals 1,300
Distributaries 0,800 - -
Sub-total 10,720 1,070 10.0
Civil Works - Base Cost
Dam 46,300 4,630 43.0
Main Canals 11,960 1,200 11.2
Distributaries 7,430 740 6.9
Water Courses 3,540 350 3.3
Drainage 1,000 10 0.9
Sub-total 70,230 6,930 65.3
Physical Con-tingencies (20%) 14,000 1,390 13.0
Total Civil Works /a 84,230 8,320 78.3
Administration, Engineeringand Supervision (15%) 12,630 1,250 11.7
Total Project Cost /b 107,580 10,640 100.0
of which
Dam 72,430 7,160 67.3
Conveyance and Drain-age System 35,150 3,480 32.7
/a Foreign exchange component for these labor intensive works is
estimated at 25%.
/b Foreign exchange component for the whole project is estimated at 20%.
VI. ORGANIZATION AND MANAGEMENT
Orissa Irrigation and Power Department (I&PD)
28. The direct responsibility for planning, implementation, operation
and maintenance of the MIPs would rest with the I&PD of GOO. The I&PD is
headed by a Chief Engineer (CE) who works under the guidance of the Secretary
57
ANNEX 2Page 13
of Irrigation and Power. Recent]y, in order to reduce the work load of CE,certain functions were delegated to two Additional Chief Engineers (ACE):one is responsible for construction and O&M of medium and minor irrigationprojects and the other for construction and O&M of the Mahanedi Deltaprojects. However, the CE is ret:aining the responsibility for all planningand design activities and for construction and O&M of major irrigation pro-jects outside the Mahanedi Delta. At headquarters, he is supported by theDirectorate of Design and the Planning Cell.
29. The I&PD is organized on a geographical basis with seven circles,each headed by a superintending engineer (SE) (Chart 1). A circle consistsof 4 to 5 divisions, each headed by an Executive Engineer (EE). The divisionsare built up both along functional and geographical lines (Chart 2). Gen-erally, 2 to 4 sub-divisions have responsibilities for investigations, minorworks and O&M of existing projects within their areas. Special constructionsub-divisions are set up for execution of larger works. For a typical 10,000ha project, three sub-divisions are created; one for dam construction, one forconstruction of the distribution and drainage networks and one for operationand maintenance of the construction equipment. The sub-division is headed byan Assistant Engineer (AE).
The Appraisal Committee of the Central Water Commission
30. The Central Water Commission (CWC) of GOI is the highest technicalauthority for water resources development in India. The Commission consistsof a Chairman and five members. It has a staff of more than 1,000 engineers.A large part of the staff is on rotation from the States.
31. The CWC is responsible for technical review of all major and mediumirrigation projects before they are submitted for approval by the PlanningCommission of GOI. In the case of medium irrigation projects, the review isonly proforma, while major irrigation projects are analyzed in detail. TheCWC usually is actively involved in the planning of large projects of highnational importance. Recently, CWC established a Central Monitoring Direc-torate, which continuously follows the implementation of selected majorprojects. The CWC is sometimes directly responsible for the planning andimplementation of federally sponsored schemes.
32. The CWC would be responsible for the appraisal and progress reviewof medium and minor irrigation projects to be financed under the proposedline of credit. For this purpose, CWC has established an Appraisal Committee
(AC), headed by the Member, Planning & Preparation (P&P). The unit has acompetent engineering staff. Agriculturalists would be deputed from theDepartment of Agriculture and economists from the irrigation wing of thePlanning Commission.
58
ANNEX 2Page 14
VII. IMPLEMENTATION OF THE LINE OF CREDIT
General
33. There would be a continuous interaction between AC and GOO duringthe implementation of the line of credit. The implementation process is des-cribed below for the main activities in the "project cycle".
Project Identification
34. Potential MIPs are identified in GOO's Master Plan (1972) for irri-gation development. The initial investigations for the projects are under-taken by the various divisions which prepare a Preliminary Investigation Report.This purely engineering report which gives an indication of the technicalfeasibility of the project and outlines the requirements for detailed inves-tigations, provides the basis for a decision about a full scale investigationprogram. The investigation and preparation priorities of MIPs are establishedby the Secretary for Irrigation & Power after consultation with concerned GOOdepartments.
Project Preparation
35, The detailed investigations are carried out by the division undersupervision of the EE. They form the basis for a draft Project Report, whichincludes preliminary designs, cost estimates and a tentative implementationplan. The draft is reviewed by the Planning Cell and the Directorate ofDesign before finalization. For projects to be financed under the LOC, aProject Preparation Committee at project level would be established. Thiscommittee would include the EE, the Block Development Officers within theproject area and district officers from the Agriculture, Forestry, Revenueand Cooperative Departments. At the State Level, an interdepartmental com-mittee has been set up for the review of draft Project Reports.
36. Designs for minor canals and structures are prepared by the divi-sion. Designs for major structures and canals (capacity over 1 m /s) areprepared by the Directorate of Design in Bhubaneswar.
37. The progress of project preparation works would be reviewed everysix months by the AC to ensure the implementation of established criteria forplanning and preparation.
Project Submission to CWC
38. After clearance with GOO's technical and administrative departments,the MIPs would be included in GOO's annual development plan to be reviewed bythe Planning Commission of GOI. Subsequent to GOI approval of the plan, theselected MIPs would be submitted for CWC for appraisal.
59
ANNEX 2Page 15
Appraisal
39. The AC would appraise each MIP on behalf of IDA. The AC would visit
the project area, review the proposed project in detail and ascertain that theproject meet the established criteria (Chapter IV). The AC would also ensurethat the proposed cropping pattern is suitable for the command area, that alldesigns are technically sound and that the implementation schedule is realis-tic. The AC would revise the cost estimates in accordance with the estab-lished criteria and prepare a Project Summary (Appendix 1), which would besubmitted to the Bank.
Project Approval
40. The Member, P&P of CWC who heads the AC would be authorized toapprove projects costing less than Rs 70 M (or US$7.8 M excluding price con-tingencies) if the benefit/cost ratio (B/C) is higher than 1.0. In all othercases, MIPs would be submitted to IDA for approval.
41. In order to establish appraisal quality of the AC, full documentationof the first three projects (Project Report and Project Summary) would be sub-mitted to IDA for approval regardless of the costs. Furthermore, the ProjectSummary would be reviewed by IDA before disbursements are authorized for eachMIP. This would ensure that MIPs approved by AC would meet standards accep-table to IDA.
Project Implementation
42. The I&PD would be responsible for implementing all irrigation worksincluding construction of the dam and the distribution system down to 5 haoutlet. Field works would be technically and administratively controlled bythe Divisional Executive Engineer. Typically, three sub-divisions, eachheaded by an Assistant Engineer, would be set up for the construction of theproject. Since the civil works would be labor-intensive, relatively small,restricted to seasonal construction and would not be practical to group intolarge contracts, they are unsuitable for International Competitive Bidding(ICB). The present practice of GOO for on-going medium products is to con-tract most of the construction work for the dam, spillway structures anddistribution network, to local contractors after local competitive bidding(LCB). The remaining portion is completed under small unit price contracts.Due to the remoteness of many of the NMIP areas, in some cases responsesto bids are not received and the work is implemented under force account.These procedures are acceptable to IDA.
43. The progress of project implementation would be reviewed by AC threetimes during each construction season.
60
ANNEX 2Page 16
Operation and Maintenance (O&M)
44. Water Allocation. At the beginning of each irrigation season, anoverall water delivery plan would be established by a committee consisting ofthe Taksildar (Revenue Officer), the Assistant or Sub-Assistant Engineer incharge of the project, the Agricultural Extension Officer, the CooperativeExtension Officer, the Block Development Officer and the Panchayat Sarpanch(the Chairman of the local elected body at the block level). This Committeewould also coordinate all other activities pertaining to irrigated agriculturesuch as cropping patterns, input distribution and credit facilities.
45. Day-to-Day Operation. The responsibility for the operation of theMIP rests with the subdivisional Assistant Engineer. Under him, three tofive Junior or Sub-Assistant Engineers are each responsible for a section ofthe canal system (about 5,000 ha) down to the farm turnouts. Each sectionemploys one or two patrols who assess the water delivery requirements andsupervises the five to ten kalassis. The kalassis operate sluices and outletsand do routine maintenance within a commanded area of about 250 ha each. Underthe proposed LOC, water would be delivered, on a rotational basis, throughoutlets serving no more than 5 ha each.
46. Maintenance. Most maintenance of the systems would take placeduring the non-irrigation season (March to June). In order to ensure effec-tive O&M of the system and to reduce establishment changes, the I&PD hasrecently started to employ small unit price contractors for the annual repairand maintenance work. The kalassis are responsible for the routine mainten-ance during the irrigation season. Under the proposed LOC, the I&PD wouldinvestigate alternative methods for the maintenance work in order to establishthe most cost effective way of ensuring a proper maintenance of MIPs.
Progress Review
47. General. The system for progress review and the reporting require-ments for the proposed LOC are designed to:
(i) ensure that the sub-project are designed, appraisedand implemented in accordance with the agreed criteria;
(ii) ensure that work for which disbursements are requestedactually has been carried out;
(iii) provide information ("feedback") to allow better proj-ect preparation and appraisal in the future;
(iv) provide guidance for the AC staff of CWC in itsreview activities;
(v) develop channels for mutual exchange of experiencebetween IDA, CWC and GOO staff;
61
ANNEX 2Page 17
(vi) provide early warning signals to IDA if problems aredeveloping in the implementation of the LOC, and
48. The Appraisal Committee (AC) of CWC. Before the start of each fis-cal year, the AC would meet with GOO officials to review the implementationprogram for the following year. This review would cover both MIPs underpreparation and under implementation. Special attention would be given tothe budget allocation for each MIP in order to ensure that adequate funds areavailable for implementation of the MIPs in accordance with the time schedule.During the discussion, AC would raise general questions about the progressduring the previous year. After this review, AC would submit the AnnualImplementation Program to IDA (Appendix 2).
49. Progress of MIPs under preparation would be reviewed by AC every sixmonths. Normally this review would involve a visit to the Divisional Officewhere the project is prepared. However, at least during the first mission,the AC staff would visit the project area and review the general suitabilityof the dam site, the command area and the site for current meter measurements.
50. Progress of MIPs under implementation would be reviewed three timesduring each year. At least two of these reviews would be made during theconstruction season. Completed projects would be reviewed once every year.These review missions would always involve a visit to the project area.
51. Subsequent to the review missions (generally within one month afterreturn of the mission) Progress Review Summaries would be submitted to IDA.Outlines of Progress Review Summaries for projects under Preparation, Imple-mentation and Operation are shown in Appendices 3, 4 and 5, respectively.
52. Project Review by IDA Staff. All reports would be submitted to theBank's New Delhi Office (NDO), where they would be reviewed by the agricul-tural and engineering staff. The NDO would also participate -- in an advisorycapacity - in some of the appraisal and review missions. Furthermore, atpresent there is a close working relationship between NDO and CWC. Thiswould ensure that NDO would be continuously informed about the progress ofthe LOC.
53. The thrust of IDA activities would include:
(i) review the quality of AC's appraisal and review work;
(ii) spot check whether the agreed criteria have beenproperly implemented;
(iii) review procurement procedures;
(iv) review the financial records kept by GOI and GOO;
(iv) assess the appropriateness of established criteria.
62
ANNEX 2Page 18
(v) review the content and frequency of the reports tobe submitted by CWC to IDA and propose revisions,if required.
Disbursements
54. From the GOO's point of view, the construction of MIPs is a con-tinuous operation. Each year the program covers a number of projects atdifferent stages of preparation and implementation. Because of budget andmanpower constraints, it is neither feasible nor desirable to start a largenumber of new projects in any single year. Thus, IDA would finance projectsthat would be started over a two to three year period.
55. A time slice approach, over a five-year period, is selected to fi-nance MIPs under the proposed IDA credit. IDA would finance the MIPs nowunder construction but could be modified to meet the technical and economiccriteria to completion. Finance of new MIPs that meet these criteria wouldbe constructed in year 2 and year 3 of the IDA credit and would be completed undera repeater credit. This approach would give a neatly arranged and relativelyfast disbursement schedule.
56. The MIPs would form a single disbursement category. Only sub-projects that meet technical and economic standards acceptable to IDA wouldbe eligible for disbursements. Disbursements would be made for 65% ofexpenditures for civil works. Disbursements for force account work and forpayments of less than Rs 50,000 under civil works contracts would be madeagainst certificates of expenditures -- itemized by subproject -- from GOO.Supporting documentation for these works would be retained by GOO and madeavailable for inspection during project supervision. Full documentation wouldbe required for other contract works. It is expected that disbursements wouldbe completed by March 1983.
VIII. AGRICULTURAL DEVELOPMENT
General
57. Inherent in the line of credit approach is that the individualsubprojects are not fully identified at the time of IDA appraisal. However,based on extensive field visits and analysis of available climatic as wellas agroeconomic data, it was concluded that:
(i) the agricultural conditions in the areas where mediumand minor irrigation projects would be constructed,are largely similar, and
(ii) differences in non-irrigated yields in the areas arelargely due to the distribution of rainfall duringthe kharif season.
63
ANNEX 2Page 19
58. The descriptions, projections and analyses below refer to the"typical" situation in non-coastal areas where most MIPs would be located.The discussion further assumes that the average kharif rainfall is above1,100 mm. The variations in rainfall (Annex 5) mean that the benefits fromthe LOC as a whole is slightly underestimated.
Yields
59. The present yields have been derived from the State agriculturestatistics, agro-economic surveys and information gathered during field visits.Under "future without project" conditions, improved cultivation practices re-sulting from the implementation of the Orissa Agricultural Development Projectfinanced by the Bank Group would lead to some increase in yields. Under"future with project" conditions, significant increase in yields would bedue to improved quality and reliability of the irrigation supply as well asprovision of drainage. It has been shown in Orissa that with proper watercontrol and good cultivation practices, yield level of 4.5 tons/ha of paddy canbe achieved. Summary of present and projected yields are presented in Table1.
Cropping Patterns C
60. At present, about 80% of the cropped area in kharif is under rain-fed paddy. Virtually no high yielding varieties (HYVs) are grown under rainfedconditions. Rainfed sugarcane accounts for about 1% of the area. Upland crops-- primarily maize, ragi, groundnuts and vegetables -- are grown on the re-mainder of the area. The overall cropping intensity under rainfed conditionsis about 100%. After construction of MMIP, the cropping intensity wouldincrease significantly to about 140% due to water availability in the rabiseason and reliable water supply in the kharif. Furthermore, the reliabilityof irrigation supply would cause a shift from the cultivation of local varietyto HYVs which generate higher yield. The shift in cropping patterns and theassumed yield increases are illustrated for a "typical" 10,000 ha project inTable 2. The production increase would amount to about 1.3 tons of foodgrainper ha of CCA. The average investment cost for MIPs is about Rs 11,000 perha in 1977 prices. The proposed LOC would finance projects for a total costof Rs 924.3 M (US$102.7 M) in current prices or about Rs 729.9 M (US$81.1 M) inconstant 1977 prices. Thus, a total of about 66,000 ha would be developedunder the LOC. The total production increase due to the MIPs financed underLOC would amount to about 87,000 tons of foodgrains.
Input Requirements and Crop Budgets
61. Present and projected input requirements are given in Table 3. Theestimated current levels of inputs are based on interviews with farmers fromsome sub-project areas and on infonnation obtained from the District Agri-culture Officers, the Directorate of Agriculture and Food Production (DAFP)and from the agro-economic surveys in the irrigated areas of Puri and SambalpurDistricts. Future requirements are based on the recommendations by the DAFPand on observed cultural practices of the progressive farmers in the inlandareas of the State. For different tnputs, the estimates are:
64
ANNEX 2Page 20
(a) Land Preparation: Much of the land preparation would be moretimely and efficient as a result of irrigation and the imple-mentation of the Orissa Agricultural Development Project. Nosubstantial change in farming practices is assumed under pro-ject conditions.
(b) Fertilizers: Very little chemical fertilizer is used at presentbut manure is widely used. No fertilizer is used for local rain-fed paddy, while a little is used for irrigated HYV Kharif andRabi paddy. Some improvement is assumed under "without project"conditions as a result of the implementation of the AgricultureDevelopment Project. The "future with project" usage of fertil-izer is based on interview with agricultural officers and pro-gressive farmers in the irrigated areas of the Puri and Samabalpurdistricts.
(c) Farm Power: The improved cultural practices as recommendedin the Agricultural Development Project would reduce labor andanimal requirements for land preparation. However, this wouldbe offset by the increased requirements for transplanting(instead of present broadcasting), harvesting and threshing.Bullocks are usually owned by the larger landholders and rentedby the smaller holders. It is estimated that the inputed costof a pair of bullocks to the owner is roughly equal to the dailyrental charge. This has consequently been uniformly appliedfor all crops and farm sizes.
(d) Other Inputs: Seed rates are assumed to be constant for presentas well as future requirements. Interest on production creditand depreciation on farm implements are included in the mis-cellanous charges.
62. Crop budgets based on financial prices are presented in Table 4.The prices used in this analysis are discussed in Annex 5. Both family andhired labor is priced at an average rate of Rs 5 per man day.
Farm Budgets
63. Households in Orissa can be somewhat arbitrarily classified intofive groups according to their economic situation:
Landless Agricultural Laborers: Most of whom earn their livingas daily workers in the fields or in construction, make up aboutabout 30% of rural working population in the State.
Marginal Farmers cultivate less than 1.0 ha of land. Since evenwith irrigation, the production would provide less than the sub-sistence requirement of an average family (about 5.8 persons),typically half of the household income would have to be suppliedfrom work outside the family farm. In the farm budget analysis,a 0.5 ha farm has been chosen to represent those 30% of the house-holds that operate less than 1.0 ha. 65
ANNEX 2Page 21
Small Farmers cultivate an area of 1.0 to 2.0 ha, typically have a
a per capita income that is well below national average -- about 23%of the households belong to this category -- which is represented in
the farm budget analysis by 1.5 ha.
Medium Farmers cultivate an area of 2.0 to 5.0 ha and they accountfor about 12% of the households. This group is represented by a 3.0ha farm.
Large Farmers own more than 5 ha and constitute about 4% of thehouseholds in the State. Many of the large farmers have jointholdings with various generations of a family as the owners. Thisgroup is represented by the 5.0 ha farm, including the lowest es-timate of the farm income.
64. The following cropping intensities have been assumed in the farmbudget analysis:
Cropping Intensity (%)Future Future
Farm Size (ha) Present Without Project With Project
0.5 100 100 1501.5 100 100 1403.0 100 100 1355.0 100 100 132
In the preparation of farm budgets (Table 5), the following assumptions have
been made:
(a) Hired Labor: The number of family members varies with farm
size and the need for hired labor depends on availability offamily labor. However, most marginal and small farmers onlyhire labor during the peak season, while large farmers dependmore on hired labor. Based on the agroeconomic survey inSambalpur District (non-coastal area), it is assumed thatabout 10%, 40%, 60% and 70% of field labor requirements of a0.5, 1.5, 3.0 and 5 ha farm, respectively, are supplied byhired labor at present and in the "future without projectsituation." Under project condition, the hired labor pro-
portion is assumed to increase to 30%, 60%, 70% and 80%.
(b) Non-Farm Incomes: These have not been included in the analysis
due to lack of data. However, since the net farm incomes ofmarginal and small farmers do not meet the subsistence require-
ment, non-farm incomes would constitute about one-third to one-
half of the total incomes. Their relative importance, however,declines with larger farm sizes. Consequently, the farm budgets
underestimate the income levels of marginal and small farmers andgive a somewhat distorted picture of relative income differences.
66
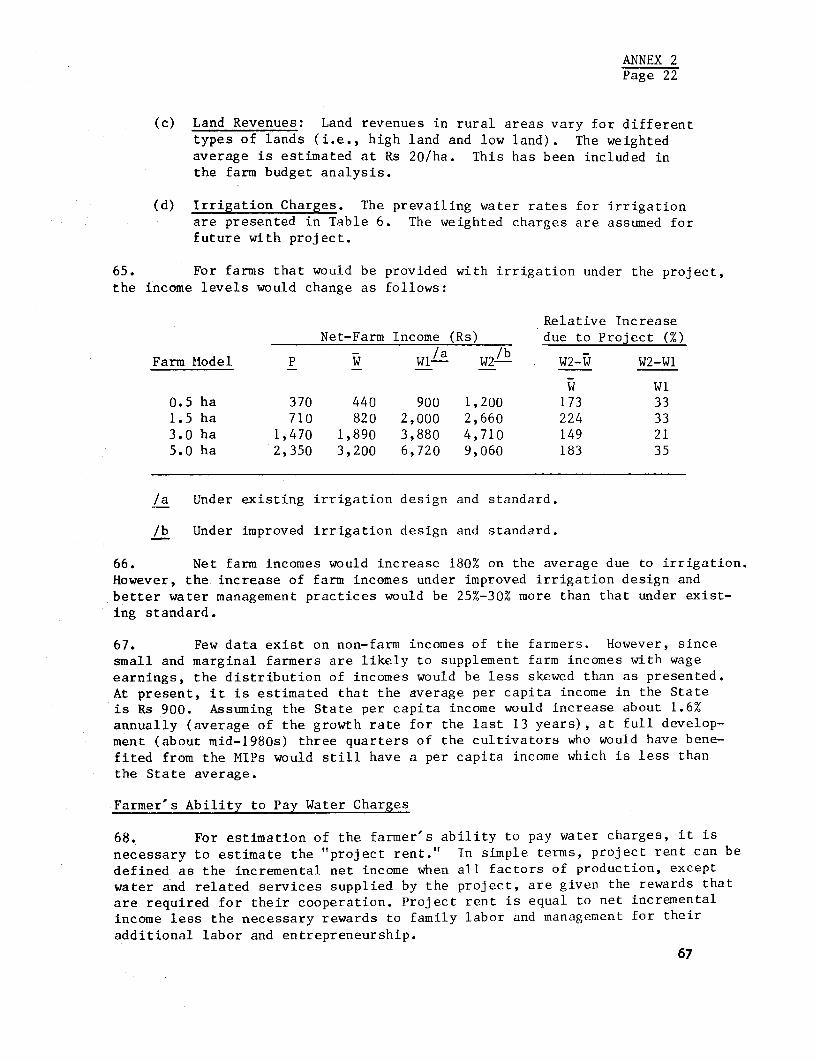
ANNEX 2Page 22
(c) Land Revenues: Land revenues in rural areas vary for differenttypes of lands (i.e., high land and low land). The weightedaverage is estimated at Rs 20/ha. This has been included inthe farm budget analysis.
(d) Irrigation Charges. The prevailing water rates for irrigationare presented in Table 6. The weighted charges are assumed forfuture with project.
65. For farms that would be provided with irrigation under the project,the income levels would change as follows:
Relative IncreaseNet-Farm Income (Rs) due to Project (%)
W/a W/bFarm Model P Wi- W2- W2-W W2-WI
Wi0.5 ha 370 440 900 1,200 173 331.5 ha 710 820 2,000 2,660 224 333.0 ha 1,470 1,890 3,880 4,710 149 215.0 ha 2,350 3,200 6,720 9,060 183 35
/a Under existing irrigation design and standard.
/b Under improved irrigation design and standard.
66. Net farm incomes would increase 180% on the average due to irrigation.However, the increase of farm incomes under improved irrigation design and
better water management practices would be 25%-30% more than that under exist-ing standard.
67. Few data exist on non-farm incomes of the farmers. However, sincesmall and marginal farmers are likely to supplement farm incomes with wageearnings, the distribution of incomes would be less skewed than as presented.At present, it is estimated that the average per capita income in the Stateis Rs 900. Assuming the State per capita income would increase about 1.6%annually (average of the growth rate for the last 13 years), at full develop-ment (about mid-1980s) three quarters of the cultivators who would have bene-fited from the MIPs would still have a per capita income which is less thanthe State average.
Farmer's Ability to Pay Water Charges
68. For estimation of the farmer's ability to pay water charges, it isnecessary to estimate the "project rent." In simple terms, project rent can bedefined as the incremental net income when all factors of production, exceptwater and related services supplied by the project, are given the rewards thatare required for their cooperation. Project rent is equal to net incrementalincome less the necessary rewards to family labor and management for theiradditional labor and entrepreneurship.
67
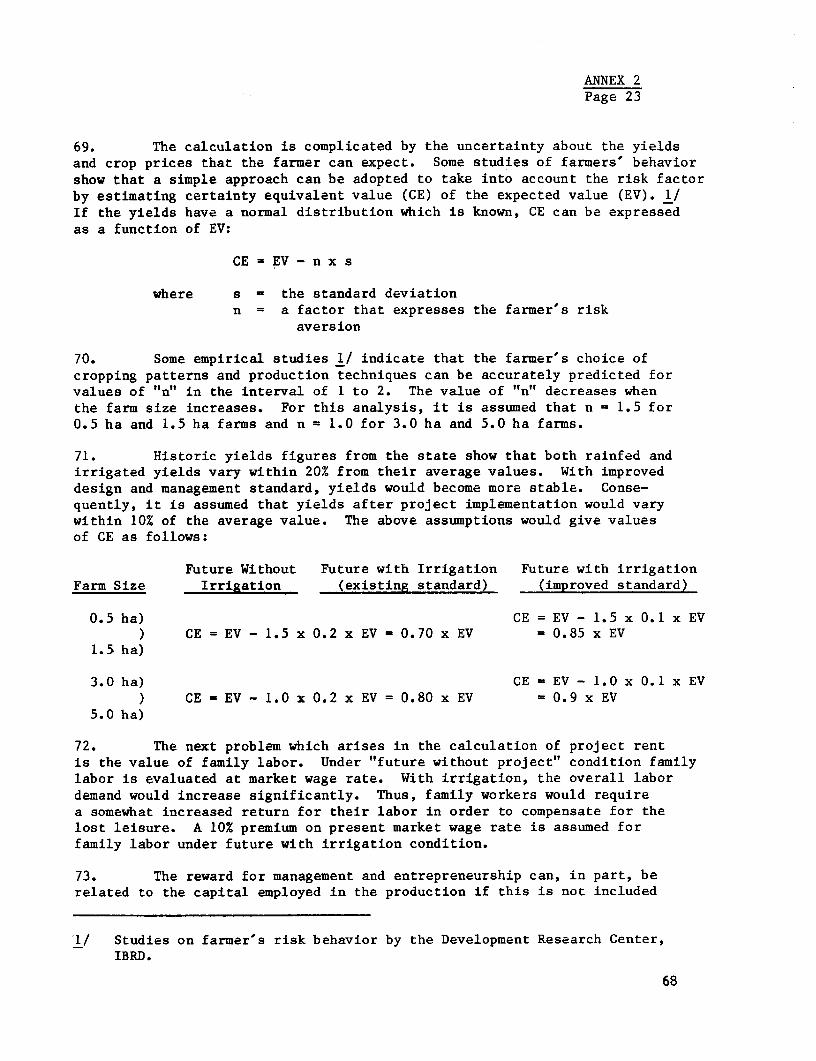
ANNEX 2Page 23
69. The calculation is complicated by the uncertainty about the yieldsand crop prices that the farmer can expect. Some studies of farmers' behaviorshow that a simple approach can be adopted to take into account the risk factorby estimating certainty equivalent value (CE) of the expected value (EV). 1/If the yields have a normal distribution which is known, CE can be expressedas a function of EV:
CE = EV - n x s
where s = the standard deviationn = a factor that expresses the farmer's risk
aversion
70. Some empirical studies 1/ indicate that the farmer's choice ofcropping patterns and production techniques can be accurately predicted forvalues of "n" in the interval of 1 to 2. The value of "n" decreases whenthe farm size increases. For this analysis, it is assumed that n = 1.5 for0.5 ha and 1.5 ha farms and n = 1.0 for 3.0 ha and 5.0 ha farms.
71. Historic yields figures from the state show that both rainfed andirrigated yields vary within 20% from their average values. With improveddesign and management standard, yields would become more stable. Conse-quently, it is assumed that yields after project implementation would varywithin 10% of the average value. The above assumptions would give valuesof CE as follows:
Future Without Future with Irrigation Future with irrigationFarm Size Irrigation (existing standard) (improved standard)
0.5 ha) CE = EV - 1.5 x 0.1 x EV) CE = EV - 1.5 x 0.2 x EV = 0.70 x EV = 0.85 x EV
1.5 ha)
3.0 ha) CE = EV - 1.0 x 0.1 x EV) CE = EV - 1.0 x 0.2 x EV = 0.80 x EV = 0.9 x EV
5.0 ha)
72. The next problem which arises in the calculation of project rentis the value of family labor. Under "future without project" condition familylabor is evaluated at market wage rate. With irrigation, the overall labordemand would increase significantly. Thus, family workers would requirea somewhat increased return for their labor in order to compensate for thelost leisure. A 10% premium on present market wage rate is assumed forfamily labor under future with irrigation condition.
73. The reward for management and entrepreneurship can, in part, berelated to the capital employed in the production if this is not included
1/ Studies on farmer's risk behavior by the Development Research Center,IBRD.
68
ANNEX 2Page 24
in the crop production cost. But it is primarily a premium for the specialskills that farm management require. Furthermore, many activities are notincluded in the crop labor requirements such as applying for credit, listen-ing to extension officers, hiring and directing daily laborers. Consequently,it has been assumed that the "management fee" is equal to 10% of the netreturns.
74. The project rent for each farm model is shown in Table 7. The re-sults indicate that because of low yields and inadequate irrigation, the proj-ect rent would be very low (average about Rs 100 ha) for existing irrigationtechnology. With improved design and operation of the irrigation system, theproject rent would be substantially higher (about Rs 900 per ha, on the aver-age). The results of this and the farm budget analysis (paras 63-67) show:
(a) The low and questionable benefits the farmers gets fromirrigation projects designed and operated at their pre-sent standard. The project rent calculation is basedon estimated average yields and input requirements, andthus it is likely that some farmers do not benefit fromirrigation at all. 1/ This is obviously an importantreason for the low water charges in Orissa.
(b) The high potential benefits from improvements in the designand operation of irrigation projects.
(c) The relatively low incomes of most farmers even afterimproved irrigation has been provided. Due to the smallfarm sizes in Orissa and the relatively low irrigatedyields that are projected for "with project" conditions,about three quarters of the beneficiaries would stillhave incomes below the State average (which is about 2/3sof the national per capita income).
Cost Recovery
75. The average cost of MIPs would be about Rs 11,000 per ha. Theannual charge for full recovery of capital costs over 30 years at 10% wouldamount to about Rs 1,250 ha per year.
76. The prime vehicle for recovery of irrigation costs is the watercharge. The rates for the water charge depends on the crops grown and inwhich season irrigation is received. The rates range from less than Rs 4per ha to about Rs 125 per ha. For the typical cropping pattern under theMIPs, the charge would amount to about Rs 35 per ha per year.
1/ The appraisal mission found examples of irrigated yields that were lowerthan normal rainfed yields.
69
ANNEX 2Page 25
77. The land revenue assessment which depends on the soil type andthe location of the plot, averages about Rs 20 per ha. Large farmers owningmore than 10 ha of irrigated or 20 ha of unirrigated land are subject to agraded producer's levy 1/. More important, however, is the sales tax onagricultural goods. Paddy purchased by millers and wholesalers is taxed at7%. Rice that has not been taxed as paddy is taxed at 3%; other foodgrains,pulses and oilseeds are taxed at 3%. If it is assumed that all the incre-mental production due to the MIPs would be marketed, the average tax wouldamount to Rs 160 per ha.
78. Despite various efforts to increase Government revenue, Orissa hasone of the lowest taxation rates in. India and the State's per capita taxrevenue ranks 17 among the 21 States. Consequently, increasing investmentsin agriculture without a higher rate of cost recovery would severely strainthe State's budgetary resources.
79. The average per capita income in Orissa ranks 16 among the States.According to surveys in the mid-1960s, 2/ Orissa has on a larger portion of itsrural population below the poverty line than any other State in India. Theaverage income in rural areas is around Rs 700 per capita, which is aboutthree-fifths of the average per capita income for India.
80. As noted in paragraph 74 above, the present benefits from irriga-tion are low and uncertain which, combined with the generally low rural in-comes, have been the major reasons for low water charges. Under improveddesign standards and with better water management, farm incomes would in-crease significantly. However, these benefits would not be realized untilthe mid-1980s. Because of the significant difference in farm income andproject rent for farmers under existing irrigation standard and under thestandard that would be implemented through the LOC, there is a need tomonitor carefully the ability of farmers to pay water charges before a fea-sible cost recovery plan can be drawn up.
81. The GOO would review the question of water charges and implement,after consultation with IDA, a system of water and water related charges toensure adequate recovery of 0 & M costs and as much as possible of capitalcosts by December 1, 1979. In establishing the level of charges, due regardwould be given to incentives for and payment capacity of farmers.
1/ Sale of paddy at procurement price which is usually lower than themarket price.
2/ The rural per capita income itl Orissa has been virtually stagnant duringthe last ten years.
70
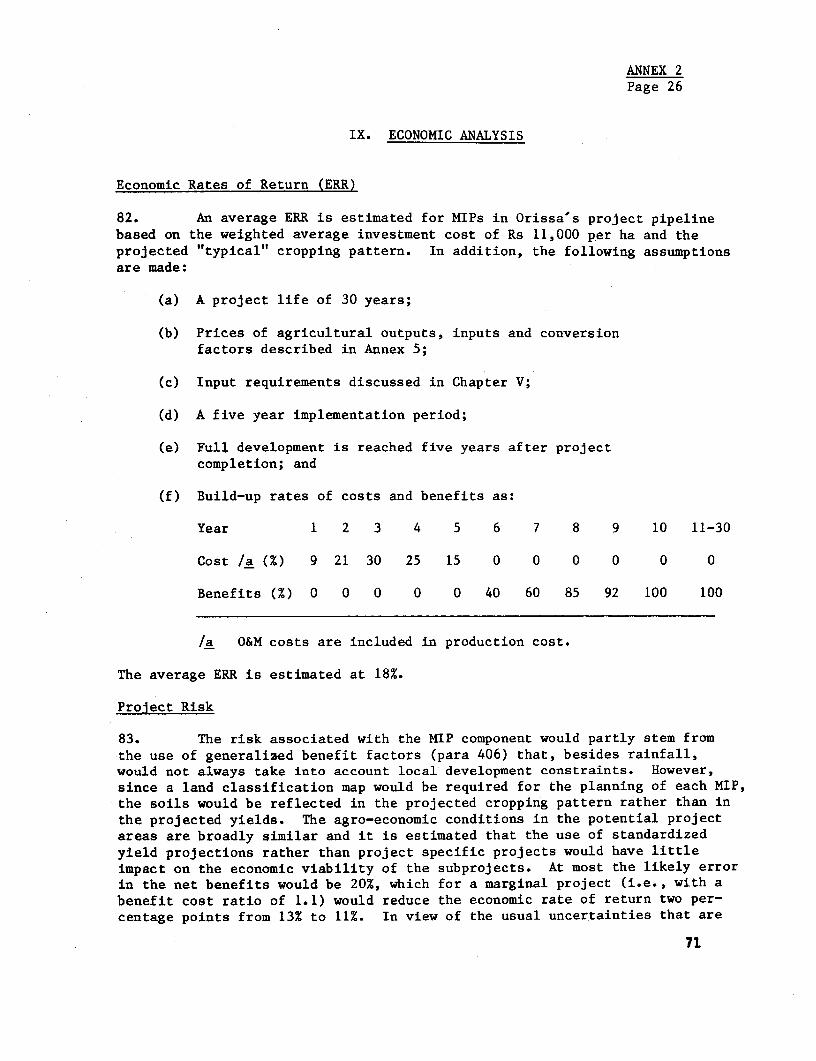
ANNEX 2Page 26
IX. ECONOMIC ANALYSIS
Economic Rates of Return (ERR)
82. An average ERR is estimated for MIPs in Orissa's project pipelinebased on the weighted average investment cost of Rs 11,000 per ha and theprojected "typical" cropping pattern. In addition, the following assumptionsare made:
(a) A project life of 30 years;
(b) Prices of agricultural outputs, inputs and conversionfactors described in Annex 5;
(c) Input requirements discussed in Chapter V;
(d) A five year implementation period;
(e) Full development is reached five years after projectcompletion; and
(f) Build-up rates of costs and benefits as:
Year 1 2 3 4 5 6 7 8 9 10 11-30
Cost /a (%) 9 21 30 25 15 0 0 0 0 0 0
Benefits (%) 0 0 0 0 0 40 60 85 92 100 100
La O&M costs are included in production cost.
The average ERR is estimated at 18%.
Prolect Risk
83. The risk associated with the MIP component would partly stem fromthe use of generalized benefit factors (para 406) that, besides rainfall,would not always take into account local development constraints. However,since a land classification map would be required for the planning of each MIP,the soils would be reflected in the projected cropping pattern rather than inthe projected yields. The agro-economic conditions in the potential projectareas are broadly similar and it is estimated that the use of standardizedyield projections rather than project specific projects would have littleimpact on the economic viability of the subprojects. At most the likely errorin the net benefits would be 20%, which for a marginal project (i.e., with abenefit cost ratio of 1.1) would reduce the economic rate of return two per-centage points from 13% to 11%. In view of the usual uncertainties that are
71
ANNEX 2Page 27
inherent in projections of future benefits and costs, it is likely that the useof subproject specific projections instead of standard projections, in practice,would not influence the accept/reject decision. Furthermore, since thebenefit factors reflect "average" conditions in the potential project areas,the overestimation of actual benefits for one MIP would be compensated by theunderestimation of benefits for another. Thus, the overall viability of theMIP component would not be effected by the use of generalized benefit factors.
84. Another risk element in the MIP component is associated with theproposed appraisal and supervision procedures. The reporting requirementsand frequent IDA revtew of progress reports are designed to ensure a properappraisal and implementation of the MIPs. Furthermore, the AC of CWC hasalready prepared satisfactory Project Summaries for two projects in Orissa'spipeline. In view of the social importance of medium irrigation developmentin the inland -- and more backward -- areas of Orissa the rather limited risk
associated with the proposed implementation procedures is acceptable.
August 1977
72
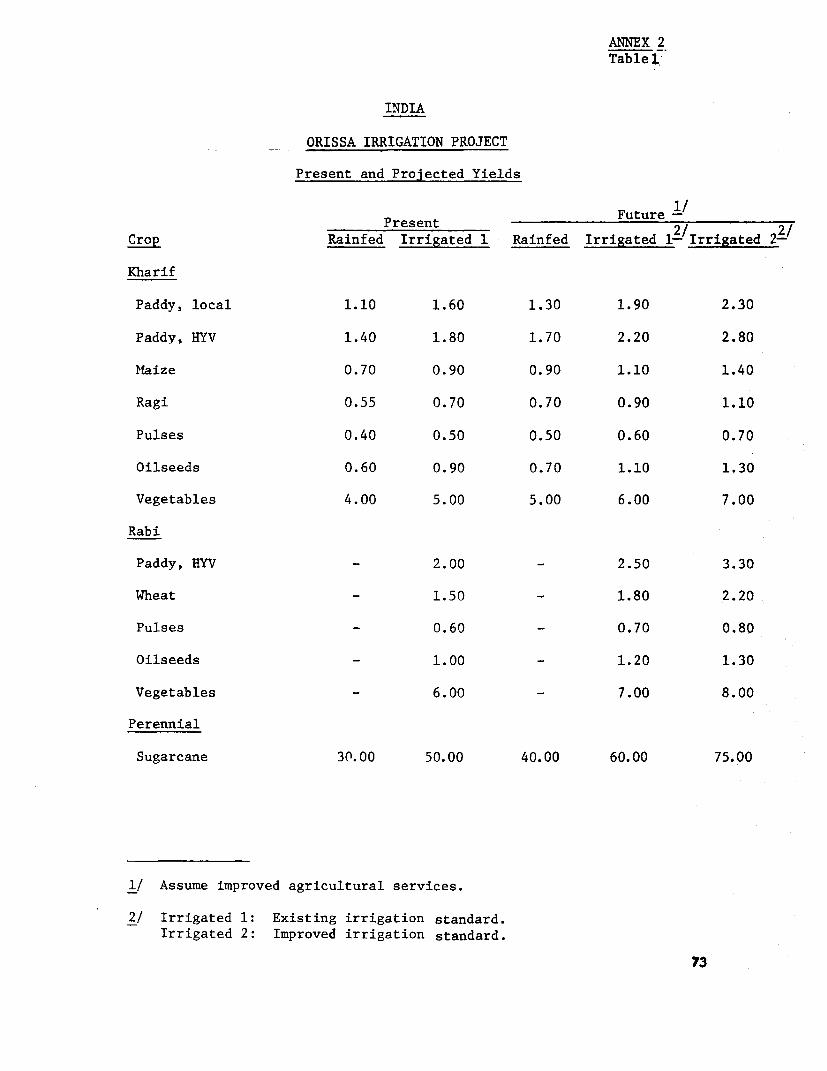
ANNEX 2Table 1
INDIA
ORISSA IRRIGATION PROJECT
Present and Projected Yields
Future -1/Present 2/9/ 9~~/Crop Rainfed Irrigated 1 Rainfed Irrigated 1-'Irrigated 2-'
Kharif
Paddy, local 1.10 1.60 1.30 1.90 2.30
Paddy, HYV 1.40 1.80 1.70 2.20 2.80
Maize 0.70 0.90 0.90 1.10 1.40
Ragi 0.55 0.70 0.70 0.90 1.10
Pulses 0.40 0.50 0.50 0.60 0.70
Oilseeds 0.60 0.90 0.70 1.10 1,30
Vegetables 4.00 5.00 5.00 6.00 7.00
Rabi
Paddy, HYV - 2.00 - 2.50 3.30
Wheat - 1.50 - 1.80 2.20
Pulses - 0.60 - 0.70 0.80
Oilseeds - 1.00 - 1.20 1.30
Vegetables - 6.00 - 7.00 8.00
Perennial
Sugarcane 30.00 50.00 40.00 60.00 75.00
1/ Assume improved agricultural services.
2/ Irrigated 1: Existing irrigation standard.Irrigated 2: Improved irrigation standard.
73
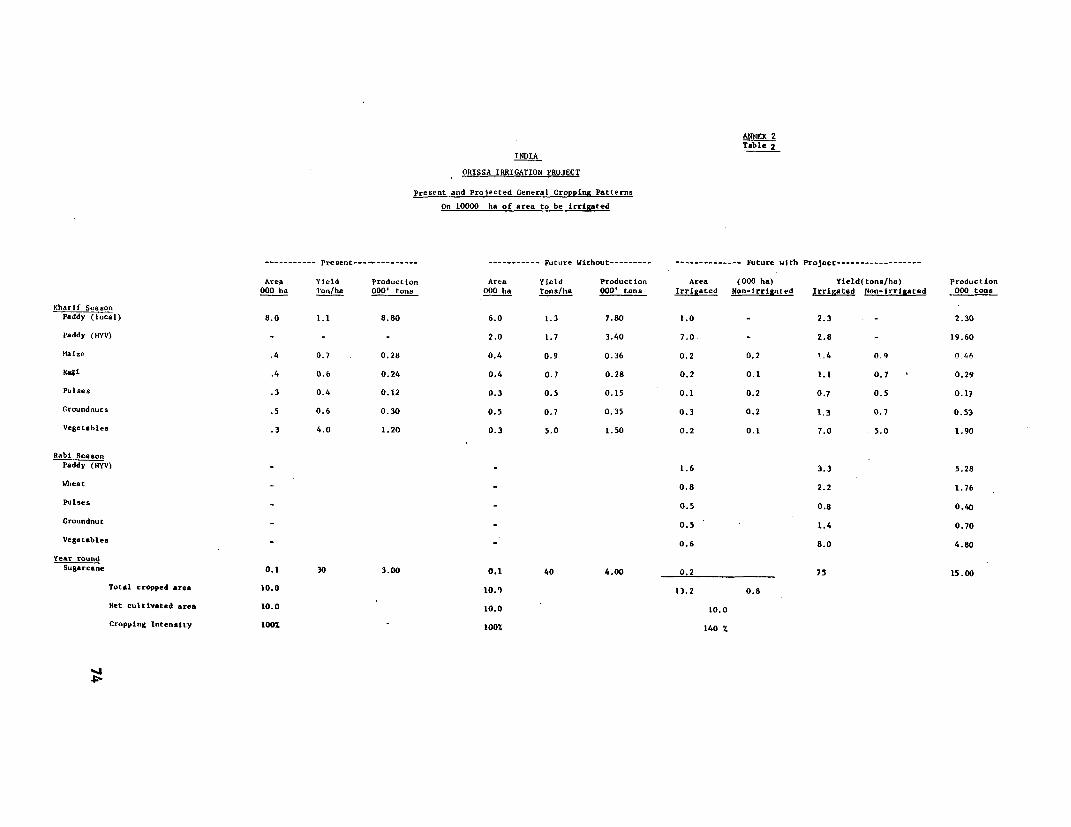
Table 2INDIA
ORISSA IRRIGATION PROJECT
Present and Projecred General Cropping PatternsOn 10000 ha of area to be irrigated
----------- Present-------------- ----------- Future Without--------- -------------- Future with Project…-----------------
Area Yield Production Area Yield Production Area (000 ha) Yield(tons/ha) Production000 Ila Ton/ha 000' tons 000 ha Tons/ha 000' tons Irrigated Non-irrigated Irrigated Non-irrigated 000 tonsKharlf SeasonPaddy (local) 8.0 1.1 8.80 6.0 1.3 7.80 1.0 _ 2.3 - 2.30Paddy (IIyV) - - - 2.0 1.7 3.40 7.0. - 2.8 - 19.60Maize .4 0.7 0.28 0.4 0.9 0.36 0.2 0.2 1.4 0 4 0 46KaSi .4 0.6 0.24 0.4 0.7 0.28 0.2 0.1 1.1 0.7 0.29Pulses .3 0.4 0.12 0.3 0.5 0.15 0.1 0.2 0.7 0.5 0.17Groundnuts .5 0.6 0.30 0.5 0.7 0.35 0.3 0.2 1.3 0.7 0.53Vegetables .3 4.0 1.20 0.3 5,0 1.50 0.2 0.1 7.0 5.0 1.90
Rabi SeasonPaddy (PlYV) ~ 1.6 3.3 5.28Whl.est
0.8 2.2 1.76Pulses
0.5 0.8 0.40Groundnut
0.5 1.4 0.70Vegetables - 0.6 8.0 4.80
year roundSugarcane 0.1 30 3.00 0.1 40 4.00 0.2 75 15.00
Total cropped area 10.0 10.0 13.2 0.8
Net cultivated area 10.0 10.0 10.0
Cropping Intensity 100% 100% 140 %
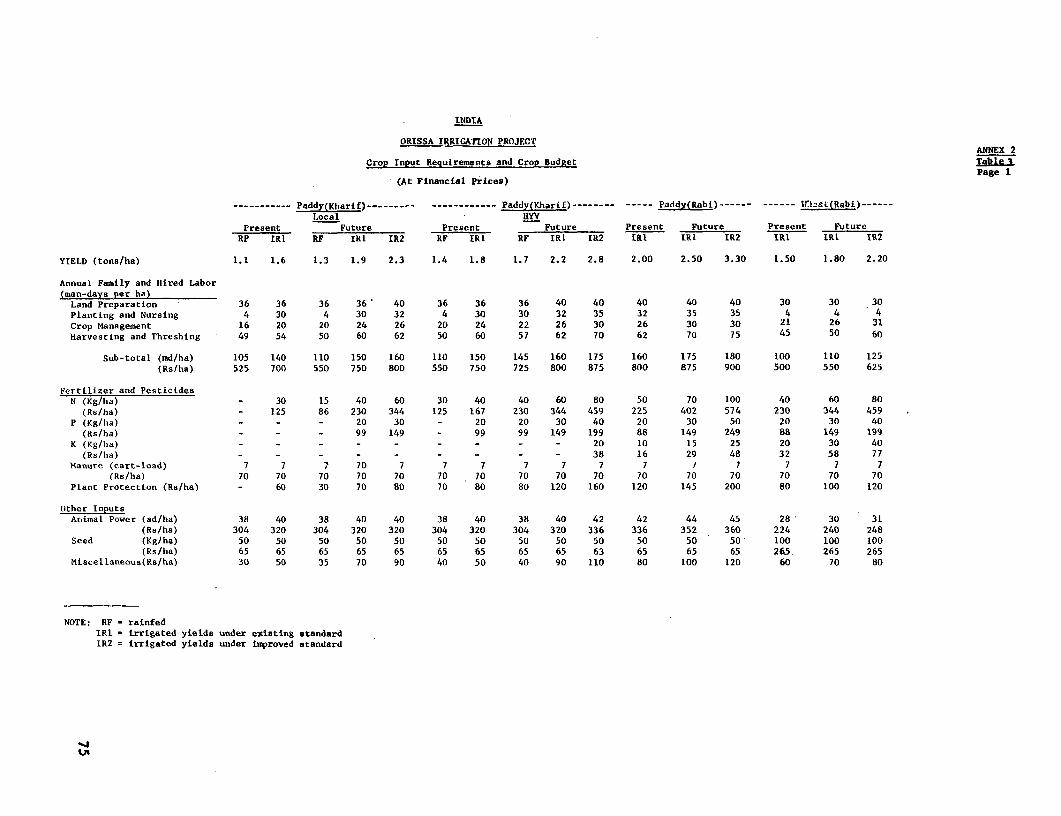
INDIA
ORISSA IRRIGATION PROJECTANNEX 2
Crop Input Requirements and Crop Budget TableIl
(At Financial Prices)
----- P4ddy(Kharif) - ----------- Paddy(Kharif)-------- ----- Paddy(Rabi)------ ------ tlJ:kL(Rabi)------Local HIYV
Present Future Present Future Present Future Present FutureRF IRI RF IRI IR2 RF IRI RF IRI IR2 IRI IRI IR2 IRI IRI IR2
YIELD (tons/ha) 1.1 1.6 1.3 1.9 2.3 1.4 1.8 1.7 2.2 2.8 2.00 2.50 3.30 1.50 1.80 2.20
Annual Family and Hired Labor(man-days per ha)Land Preparation 36 36 36 36 40 36 36 36 40 40 40 40 40 30 30 30Planting and Nursing 4 30 4 30 32 4 30 30 32 35 32 35 35 4 4 4Crop Management 16 20 20 24 26 20 24 22 26 30 26 30 30 21 26 31Harvesting and Threshing 49 54 50 60 62 50 60 57 62 70 62 70 75 45 50 60
Sub-total (md/ha) 105 140 110 150 160 110 150 145 160 175 160 175 180 100 110 125(Rs/ha) 525 700 550 750 800 550 750 725 800 875 800 875 900 500 550 625
Fertilizer and PesticidesN (Kg/ha) - 30 15 40 60 30 40 40 60 80 50 70 100 40 60 80
(Rs/ha) - 125 86 230 344 125 167 230 344 459 225 402 574 230 344 459P (Kg/hia) - - - 20 30 - 20 20 30 40 20 30 50 20 30 40(Rs/ha) - - - 99 149 - 99 99 149 199 88 149 249 88 149 199
K (Kg/ha) - - - - - - - - - 20 10 15 25 20 30 40(Rs/ha) _ _ _ _ _ _ _ _ _ 38 16 29 48 32 58 77
Manure (cart-load) 7 7 , 70 7 7 7 7 7 7 7 7 7 7 7 7(Rs/ha) 70 70 70 70 70 70 70 70 70 70 70 70 70 70 70 70
Plant Protection (Rs/ha) - 60 30 70 80 70 80 80 120 160 120 145 200 80 100 120
Other InputsAnimal Power (ad/ha) 38 40 38 40 40 38 40 38 40 42 42 44 45 28 30 31
(Rs/ha) 304 320 304 320 320 304 320 304 320 336 336 352 360 224 240 248
Seed (Kg/ha) 50 50 50 50 50 50 50 50 50 50 50 50 50' 100 100 100(Rs/ha) 65 65 65 65 65 65 65 65 65 63 65 65 65 265 265 265
Miscellaneous(Rs/ha) 30 50 35 70 90 40 50 40 90 110 80 100 120 60 70 80
NOTE: RF - rainfedIRI - irrigated yields under existing standardIR2 = irrigated yields under improved standard
tj
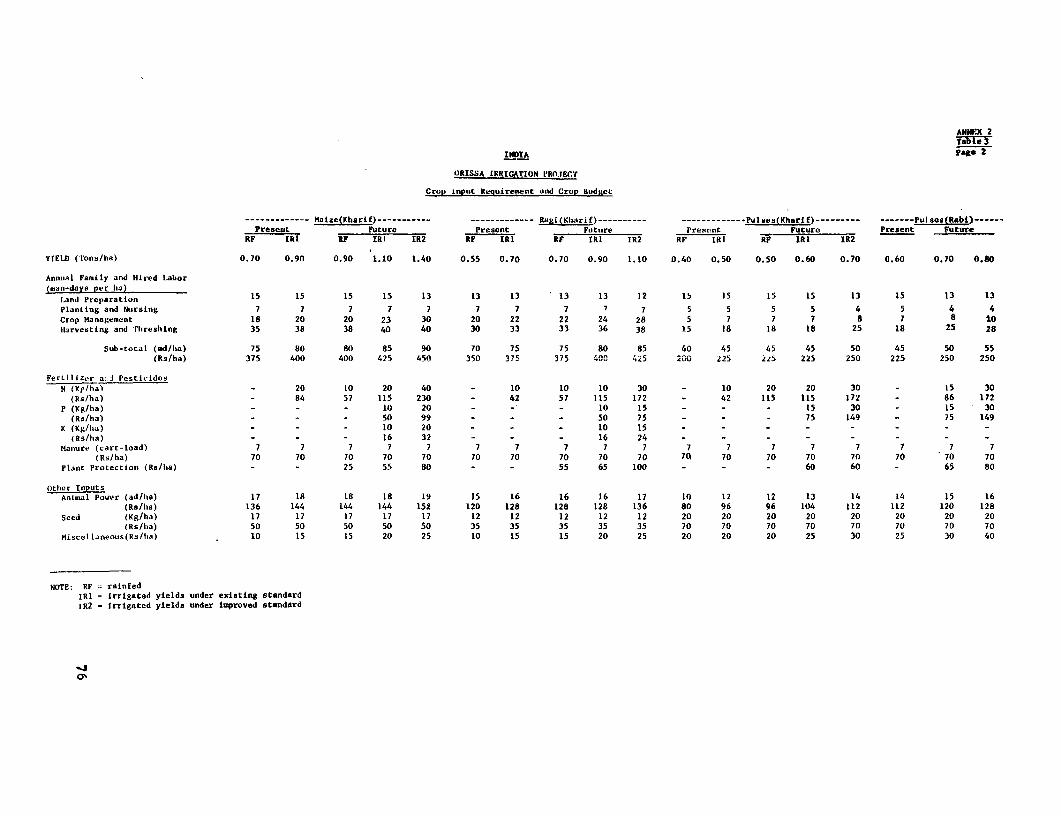
ANNWX 2
INDIA Page 2
ORISSA LRRIGArION PROJEC.T
Crop inpust Requirement and Crop Budket
------------- Malze(Kharif) ----------- ------------- RagiLarif)---------- ------------- Pulue --------- ------- Pulses(Rabi------Preseat Future Present Fututre Present Futurc Present Future
RFP IRI F IRI IR2 RF IRI RF IRI IR2 RF IRI RF IRI IR2
YlEl.D (Tons/ha) 0.70 0.9nl 0.90 1.10 1.40 0.55 0.70 0.70 0.90 1.10 0.40 0.50 0.50 0.60 0.70 0.60 0.70 0.80
Amnnal Family and Hlred Labor(man-days per ha)
Land Preparation 15 15 15 15 13 13 13 13 13 12 15 15 is 15 13 15 13 13
Planlting and Nuirsing 7 7 7 7 7 7 7 7 7 7 5 5 5 5 4 5 4 4Crop Management 18 20 20 23 30 20 22 22 24 28 5 7 7 7 8 7 8 10llarvesting and Trhreshing 35 38 38 40 40 30 33 33 36 38 15 18 18 18 25 18 25 28
Sub-total (md/ha) 75 80 80 85 90 70 75 75 80 85 40 45 45 45 50 45 50 55(Rs/ha) 375 400 400 425 450 350 375 375 400 425 200 225 225 225 250 225 250 250
Fertilizer a:j PesticidesN (Kp/hal - 20 10 20 40 - 10 10 10 30 - 10 20 20 30 - 15 30
(Rs/ha) - 84 57 115 230 - 42 57 115 172 _ 42 115 115 172 - 86 172P (Kg/lia) - - - 10 20 - - - 10 15 - - - 15 30 - 15 *30
(Rs/ha) - - - 50 99 - - - 50 75 - 75 149 - 75 149K (Kg/la) - - - 10 20 - - - 10 15
(Rs/ha) - - - 16 32 - - - 16 24Maniure (cart-load) 7 7 7 7 7 7 7 7 7 7 7 7 7 7 7 7 7 7
(Rs/ha) 70 70 70 70 70 70 70 70 70 70 70 70 70 70 70 70 70 70Plane Protection (Rs/ha) - - 25 55 80 - - 55 65 100 - - - 60 60 - 65 80
Other InPutsAnimal Power (ad/ha) 17 18 18 18 19 15 16 16 16 17 10 12 12 13 14 14 15 16
(Rs/ha) 136 144 144 144 152 120 128 128 128 136 80 96 96 104 112 112 120 128Seed (Kg/ha) 17 17 17 17 17 12 12 12 12 12 20 20 20 20 20 20 20 20
(R5/ba) 50 50 50 50 50 35 35 35 35 35 70 70 70 70 70 70 70 70Miscellaneous(Rs/ha) 10 15 15 20 25 10 15 15 20 25 20 20 20 25 30 25 30 40
NOTE: RF = rainfedIRI = irrigated yields under existing standardIR2 - Irrigated yields under improved standard
-J
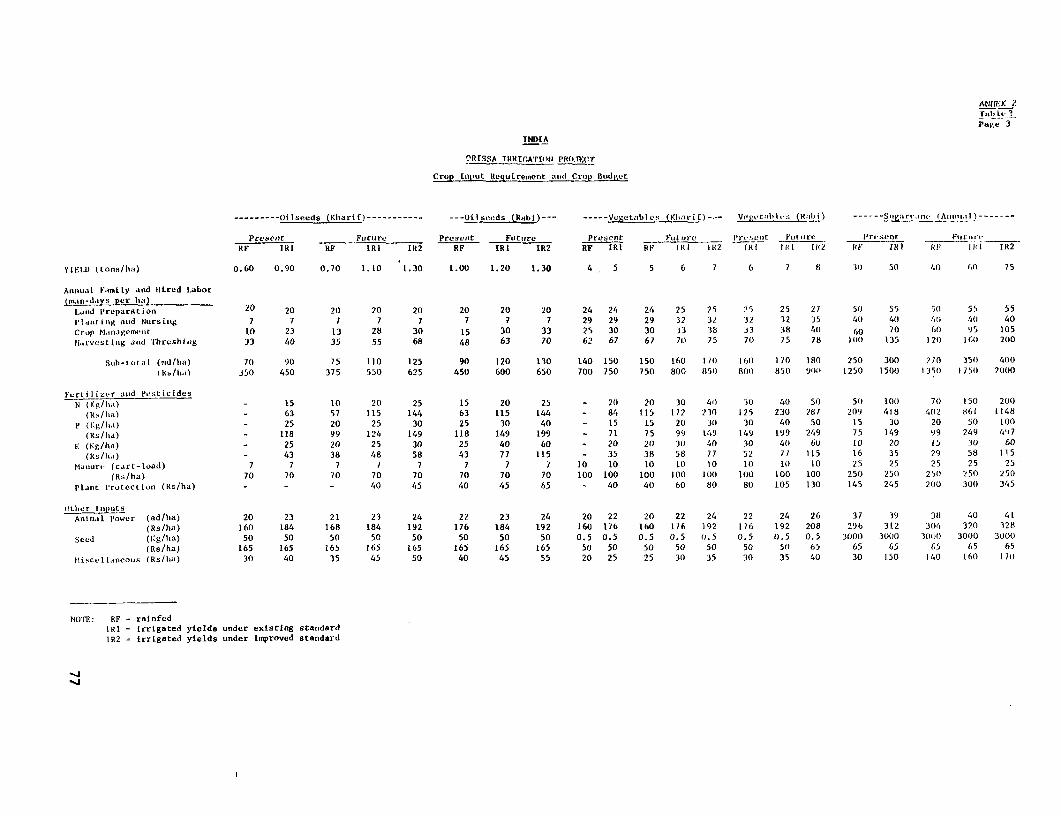
AifIUEX 2
Page 3
INDIA
r^RTSSA TRRlt'ATIon '()R'I
Crop I[put Requiiremeit aid Crop Buidget
--------- Oilseeds (Khari) …----------- --- Oilseeds (Rab-- ----- Vegetabi es (Klarif)--- Vege tral ,. (Rl, i ) ------ Sga re. (A_.nna I)…-------
Presentr Futujre Present Futuire Present Ftit lre lPrv seiit FnUtre P'resent FRJtnlwe _
RF lRI itF IRI IR2 RF IRI IR2 IRF IRI HF TI IR2 fi 1tl, 11<2 ikF IRI -R-F1 li R1 IR2
YIELID (tons/ha) 0.60 0.90 0.70 1.i0 1.30 1.00 1.20 1.30 4 5 5 6 7 6 7 8 3') 50 40 6tl 75
Annuiil.i Family and hiired Labor
(ma n-days per lia)
Land Preparation 20 20 20 20 20 20 20 -20 24 24 24 25 25 25 25 27 5O 55 0 55 55
1llant ilg anid Ntirsinig 7 7 7 7 7 7 7 7 29 29 29 32 32 32 32 35 40) 40 4) 4(1 40
Crop Managemenit 10 23 13 28 30 15 30 33 25 30 30 33 38 31 38 40 60 70 f0 95 105
fharvesinLg atid Threshinig 33 40 35 55 68 48 63 70 62 67 67 7D 75 70 75 78 100O 135 120 16O 200
Stub-total (md/lid) 7(1 90 75 110 125 90 120 130 140 150 150 160 170 101) 170 180 250 300 270 35() 400
Ills/ha.) 350 450 375 550 625 450 600 650 700 750 750 800 85( 800) 850 9O/l 1250 1500 13591 1750 ?()00
Fertilizer anid Peslicides
N (Kg/ha) - 15 10 20 25 15 20 25 - 201 20 30 40 3() 40 50 5( 10) 7(0 150 200
(RIs/hIa) - 63 57 115 144 63 115 144 - 84 115 172 230 125 230 287 209 418 402 861 1148
P (Kg/I,.)) - 25 20 25 30 25 30 40 - 15 15 20 3() 30 40 50 15 30 20 50 100
(Ks/l,a) - 118 99 124 149 118 149 199 - 71 75 99 149 149 199 249 75 149 99 249 4'i7
K (Kg/ha) - 25 20 25 30 25 40 60 - 20 20 30 40 30 41) 60 10 20 15 30 60
(Rs/lha) - 43 38 48 58 43 77 115 - 35 38 58 77 52 71 115 16 35 29 58 115
Manur, (cart-load) 7 7 7 7 7 7 7 7 10 10 10 10 10 10 10 10 Z5 25 25 25 25
(Rs/ha) 70 70 70 70 70 70 70 70 100 100 100 100 100 100 100 100 250 250 250 250 250
Planit P'rorection (Rs/ha) - - - 40 45 40 45 65 - 40 40 60 80 80 105 130 145 245 200 300 345
other Inputs
Animal Power (ad/hIa) 20 23 21 23 24 22 23 24 20 22 20 22 24 22 24 26 37 19 38 40 41
(Rs/ha) 160 184 168 184 192 176 184 192 160 176 160 176 192 176 192 208 296 312 304 320 328
Seed (Kg/h1a) 50 50 50 50 50 50 50 50 0.5 0.5 0.5 0.5 (.5 0.5 0.5 0.5 3001) 30)(J0 3()O( 3000 3000
(Rs/ha) 165 165 165 165 165 165 165 165 50 50 50 50 50 50 5O 65 65 65 fi5 65 65
Miscellaneous (Rs/ha) 30 40 35 45 50 40 45 55 20 25 25 30 35 30 35 40 30 150 140 160 17O
NOTE: RF - rainfedlRI = Irrigated yields under existing standard
JR2 - irrigated yields under improved standard
-I
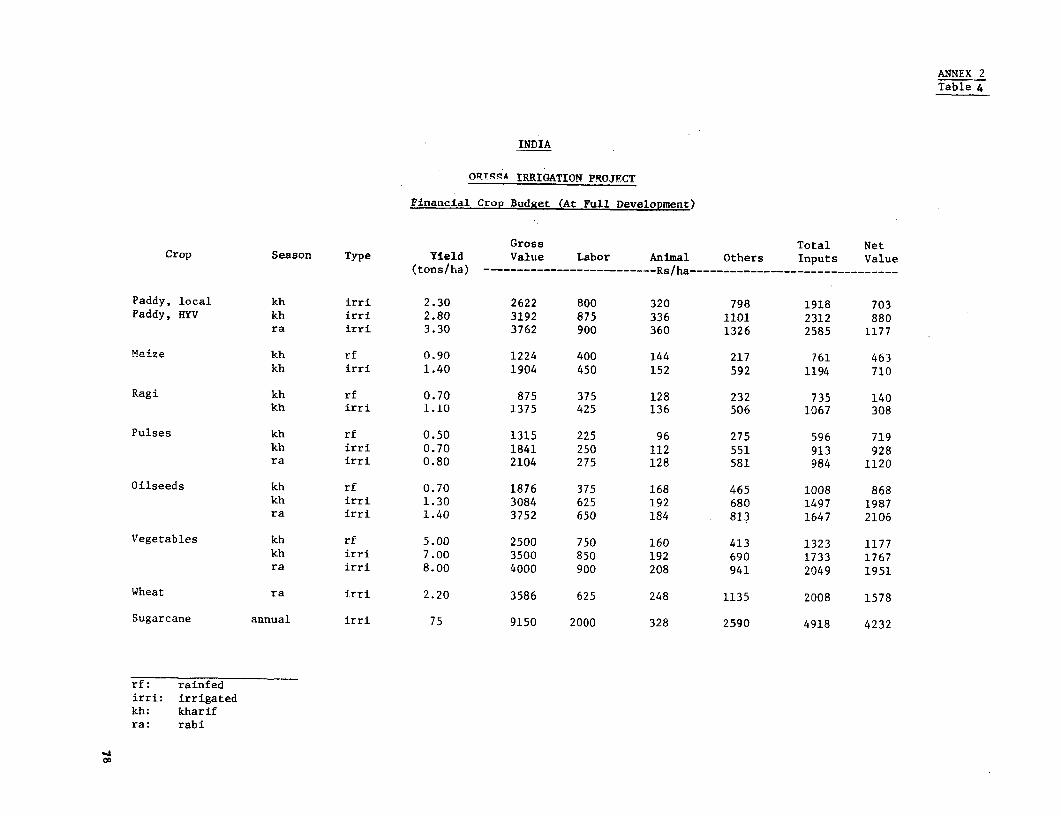
ANNEX 2Table 4
INDIA
ORTqqA IRRIGATION PROJFCT
Financial Crop Budget (At Full Development)
Gross Total NetCrop Season Type Yield Value Labor Animal Others Inputs Value
(tons/ha) --------------------------Rs/ha-------------------------------
Paddy, local kh irri 2.30 2622 800 320 798 1918 703Paddy, HYV kh irri 2.80 3192 875 336 1101 2312 880
ra irri 3.30 3762 900 360 1326 2585 1177
Maize kh rf 0.90 1224 400 144 217 761 463kh irri 1.40 1904 450 152 592 1194 710
Ragi kh rf 0.70 875 375 128 232 735 140kh irri 1.10 1375 425 136 506 1067 308
Pulses kh rf 0.50 1315 225 96 275 596 719kh irri 0.70 1841 250 112 551 913 928ra irri 0.80 2104 275 128 581 984 1120
Oilseeds kh rf 0.70 1876 375 168 465 1008 868kh irri 1.30 3084 625 192 680 1497 1987ra irri 1.40 3752 650 184 813 1647 2106
Vegetables kh rf 5.00 2500 750 160 413 1323 1177kh irri 7.00 3500 850 192 690 1733 1767ra irri 8.00 4000 900 208 941 2049 1951
Wheat ra irri 2.20 3586 625 248 1135 2008 1578
Sugarcane annual irri 75 9150 2000 328 2590 4918 4232
rf: rainfedirri: irrigatedkh: kharifra: rabi
-a
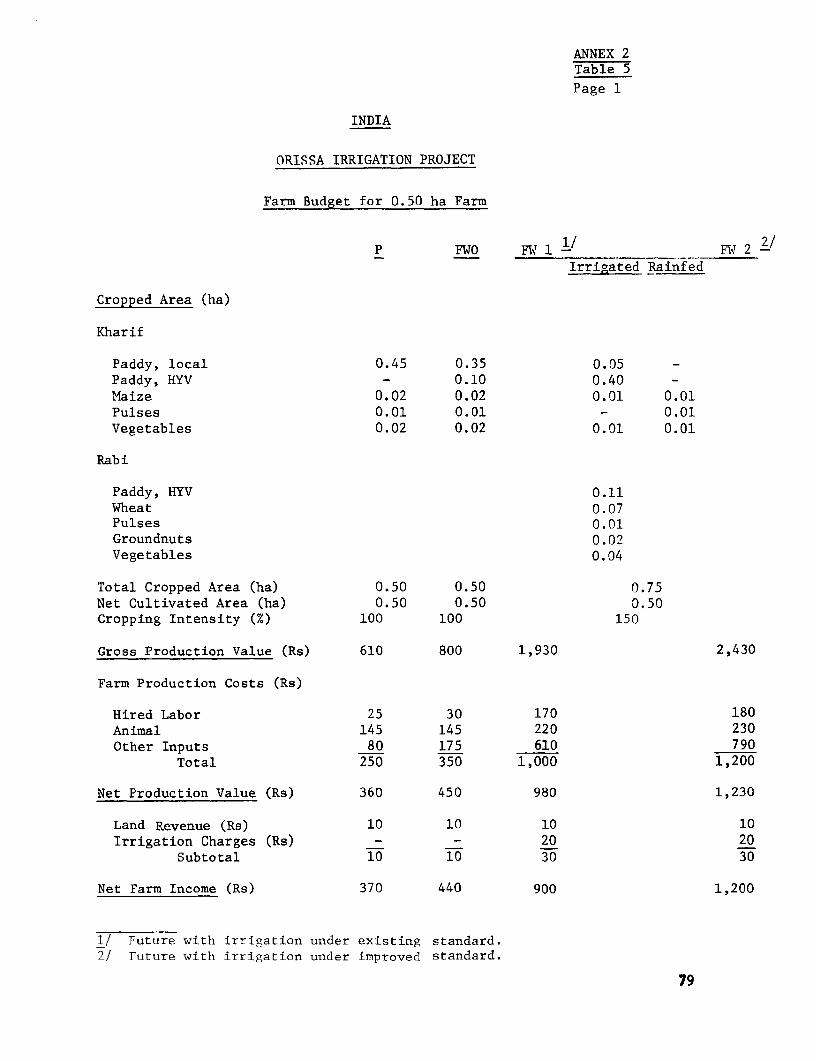
ANNEX 2Table 5Page 1
INDIA
ORISSA IRRIGATION PROJECT
Farm Budget for 0.50 ha Farm
P FWO FW 1 "/ FW 2-
Irrigated Rainfed
Cropped Area (ha)
Kharif
Paddy, local 0.45 0.35 0.05 -
Paddy, HYV - 0.10 0.40 -Maize 0.02 0.02 0.01 0.01Pulses 0.01 0.01 - 0.01Vegetables 0.02 0.02 0.01 0.01
Rabi
Paddy, HYV 0.11Wheat 0.07Pulses 0.01Groundnuts 0.02Vegetables 0.04
Total Cropped Area (ha) 0.50 0.50 0.75Net Cultivated Area (ha) 0.50 0.50 0.50Cropping Intensity (%) 100 100 150
Gross Production Value (Rs) 610 800 1,930 2,430
Farm Production Costs (Rs)
Hired Labor 25 30 170 180Animal 145 145 220 230Other Inputs 80 175 610 790
Total 250 350 1,000 1,200
Net Production Value (Rs) 360 450 980 1,230
Land Revenue (Rs) 10 10 10 10Irrigation Charges (Rs) - - 20 20
Subtotal 10 10 30 30
Net Farm Income (Rs) 370 440 900 1,200
1/ Future with irrigation under existing standard.2/ Future with irrigation under improved standard.
79
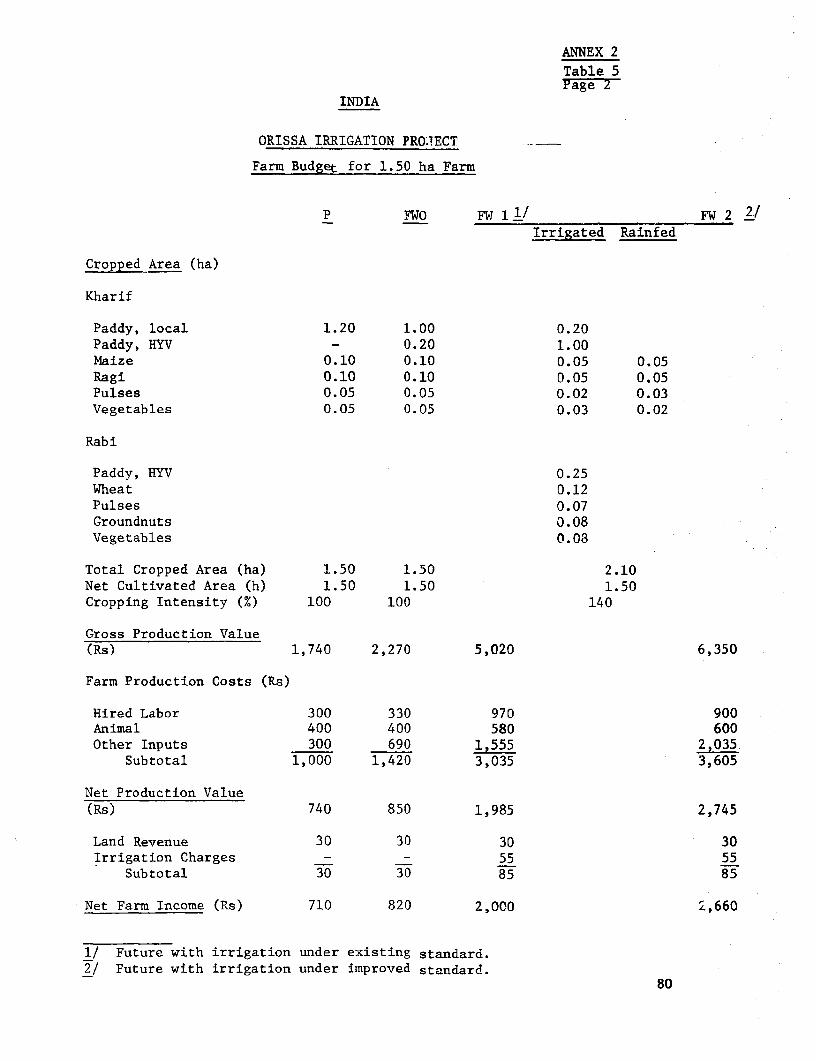
ANNEX 2
Table 5Page 2
INDIA
ORISSA IRRIGATION PRO.TECT _
Farm Budget for 1.50 ha Farm
P FWO FW I1 / FW 2!Irrigated Rainfed
Cropped Area (ha)
Kharif
Paddy, local 1.20 1.00 0.20Paddy, HYV - 0.20 1.00Maize 0.10 0.10 0.05 0.05Ragi 0.10 0.10 0.05 0.05Pulses 0.05 0.05 0.02 0.03Vegetables 0.05 0.05 0.03 0.02
Rab i
Paddy, HYV 0.25Wheat 0.12Pulses 0.07Groundnuts 0.08Vegetables 0.08
Total Cropped Area (ha) 1.50 1.50 2.10Net Cultivated Area (h) 1.50 1.50 1.50Cropping Intensity (%) 100 100 140
Gross Production Value(Rs) 1,740 2,270 5,020 6,350
Farm Production Costs (Rs)
Hired Labor 300 330 970 900Animal 400 400 580 600Other Inputs 300 690 1,555 2,035
Subtotal 1,000 1,420 3,035 3,605
Net Production Value(Rs) 740 850 1,985 2,745
Land Revenue 30 30 30 30Irrigation Charges - - 55 55
Subtotal 30 30 85 85
Net Farm Income (Rs) 710 820 2,000 .,660
1/ Future with irrigation under existing standard.2/ Future with irrigation under improved standard.
80
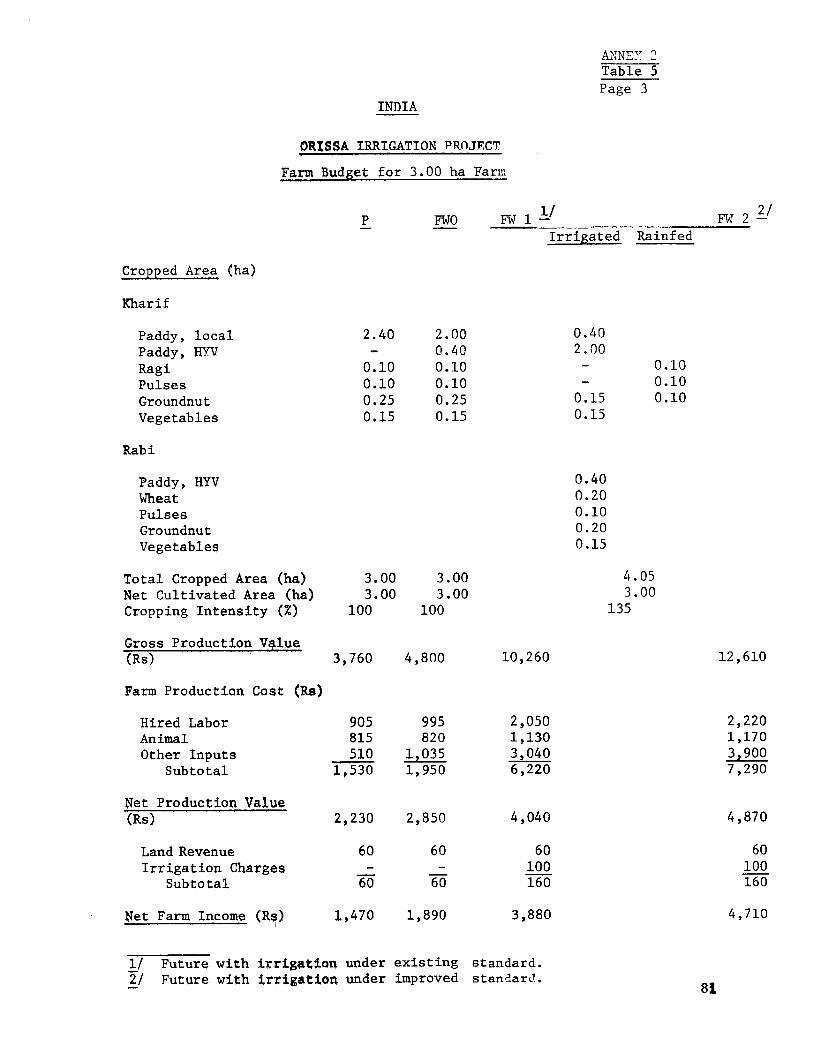
ANNEY 2Table 5
Page 3
INDIA
ORjSSA IRRIGATION PROJECT
Farm Budget for 3.00 ha Farm
P FWO FW 1- FW 2 -/
Irrigated Rainfed
Cropped Area (ha)
Kharif
Paddy, local 2.40 2.00 0.40
Paddy, HYV - 0.40 2.00
Ragi 0.10 0.10 - 0.10
Pulses 0.10 0.10 - 0.10
Groundnut 0.25 0.25 0.15 0.10
Vegetables 0.15 0.15 0.15
Rabi
Paddy, HYV 0.40
Wheat 0.20Pulses 0.10
Groundnut 0.20
Vegetables 0.15
Total Cropped Area (ha) 3.00 3.00 4.05Net Cultivated Area (ha) 3.00 3.00 3.00
Cropping Intensity (%) 100 100 135
Gross Production V4aue(Rs) 3,760 4,800 10,260 12,610
Farm Production Cost (Re)
H-ired Labor 905 995 2,050 2,220Animal 815 820 1,130 1,170
Other Inputs 510 1,035 3,040 3,900
Subtotal 1,530 1,950 6,220 7,290
Net Production Value(Rs) 2,230 2,850 4,040 4,870
Land Revenue 60 60 60 60
Irrigation Charges - - 100 100
Subtotal 60 160 160
Net Farm Income (Rq) 1,470 1,890 3,880 4,710
1/ Future with irrigation under existing standard.2/ Future with irrigation under improved stanc-ard.
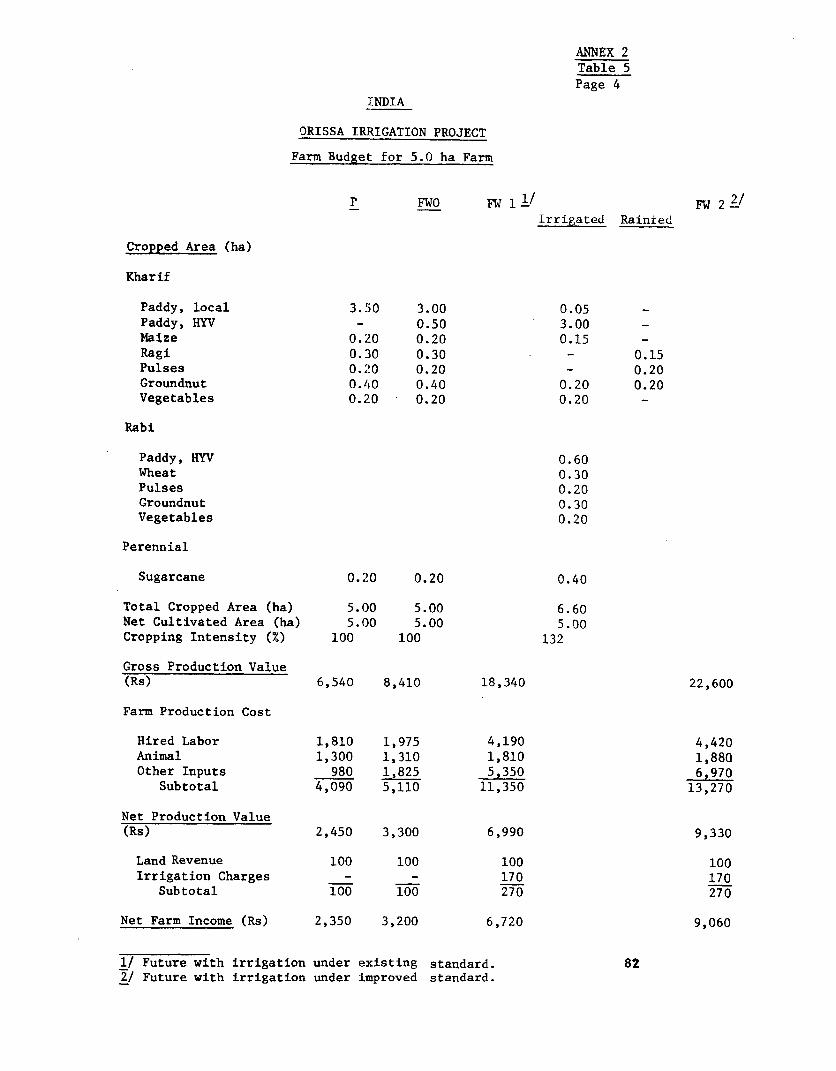
ANNEX 2Table 5Page 4
INDIA
ORISSA IRRIGATION PROJECT
Farm Budget for 5.0 ha Farm
P FWO FW i l FW 2 2Irrigated Rainied
Cropped Area (ha)
Kharif
Paddy, local 3.50 3.00 0.05
Paddy, HYV - 0.50 3.00
Maize 0.20 0.20 0.15 -
Ragi 0.30 0.30 - 0.15
Pulses 0.20 0.20 - 0.20
Groundnut 0.40 0.40 0.20 0.20
Vegetables 0.20 0.20 0.20 -
Rabi
Paddy, HYV 0.60
Wheat 0.30
Pulses 0.20Groundnut 0.30Vegetables 0.20
Perennial
Sugarcane 0.20 0.20 0.40
Total Cropped Area (ha) 5.00 5.00 6.60
Net Cultivated Area (ha) 5.00 5.00 5.00
Cropping Intensity (X) 100 100 132
Gross Production Value(Rs) 6,540 8,410 18,340 22,600
Farm Production Cost
Hired Labor 1,810 1,975 4,190 4,420
Animal 1,300 1,310 1,810 1,880
Other Inputs 980 1,825 5,350 6,970
Subtotal 4,090 5,110 11,350 13,270
Net Production Value(Rs) 2,450 3,300 6,990 9,330
Land Revenue 100 100 100 100
Irrigation Charges - - 170 170
Subtotal 100 100 270 270
Net Farm Income (Rs) 2,350 3,200 6,720 9,060
1/ Future with irrigation under existing standard. 822/ Future with irrigation under improved standard.
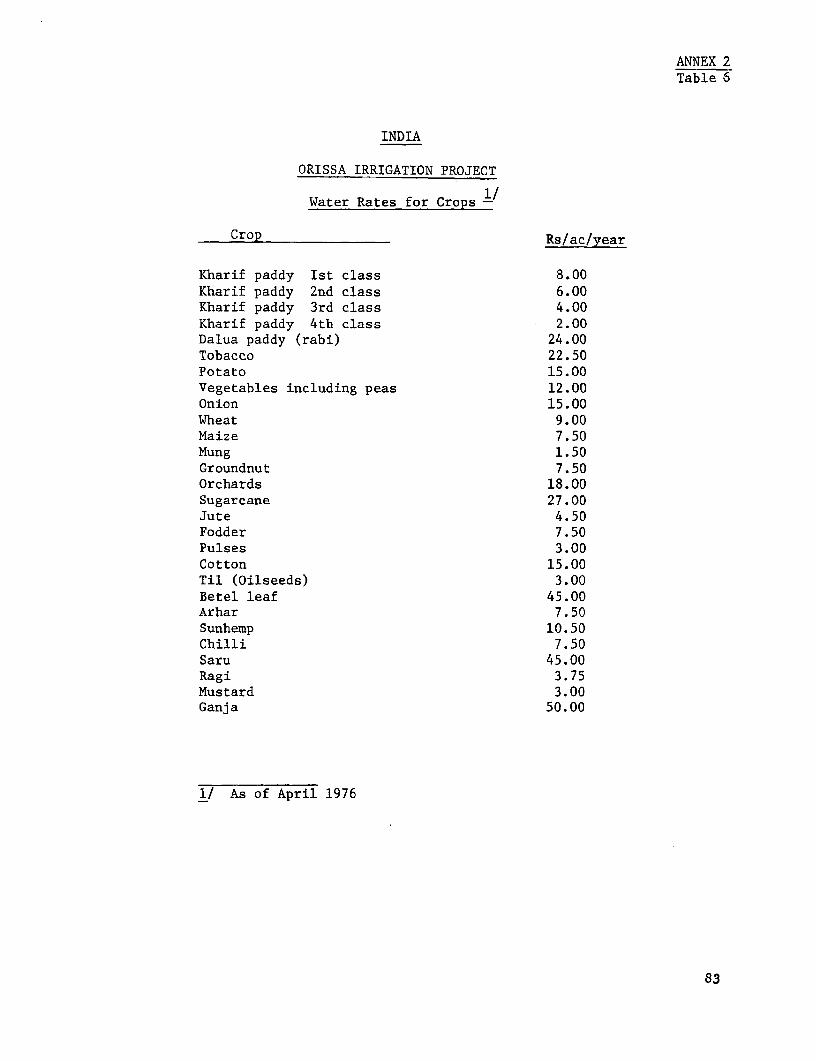
ANNEX 2Table 6
INDIA
ORISSA IRRIGATION PROJECT
Water Rates for Crops -/
Crop Rs/ac/year
Kharif paddy Ist class 8.00Kharif paddy 2nd class 6.00Kharif paddy 3rd class 4.00Kharif paddy 4th class 2.00Dalua paddy (rabi) 24.00Tobacco 22.50Potato 15.00Vegetables including peas 12.00Onion 15.00Wheat 9.00Maize 7.50Mung 1.50Groundnut 7.50Orchards 18.00Sugarcane 27.00Jute 4.50Fodder 7.50Pulses 3.00Cotton 15.00Til (Oilseeds) 3.00Betel leaf 45.00Arhar 7.50Sunhemp 10.50Chilli 7.50Saru 45.00Ragi 3.75Mustard 3.00Ganja 50.00
1/ As of April 1976
83
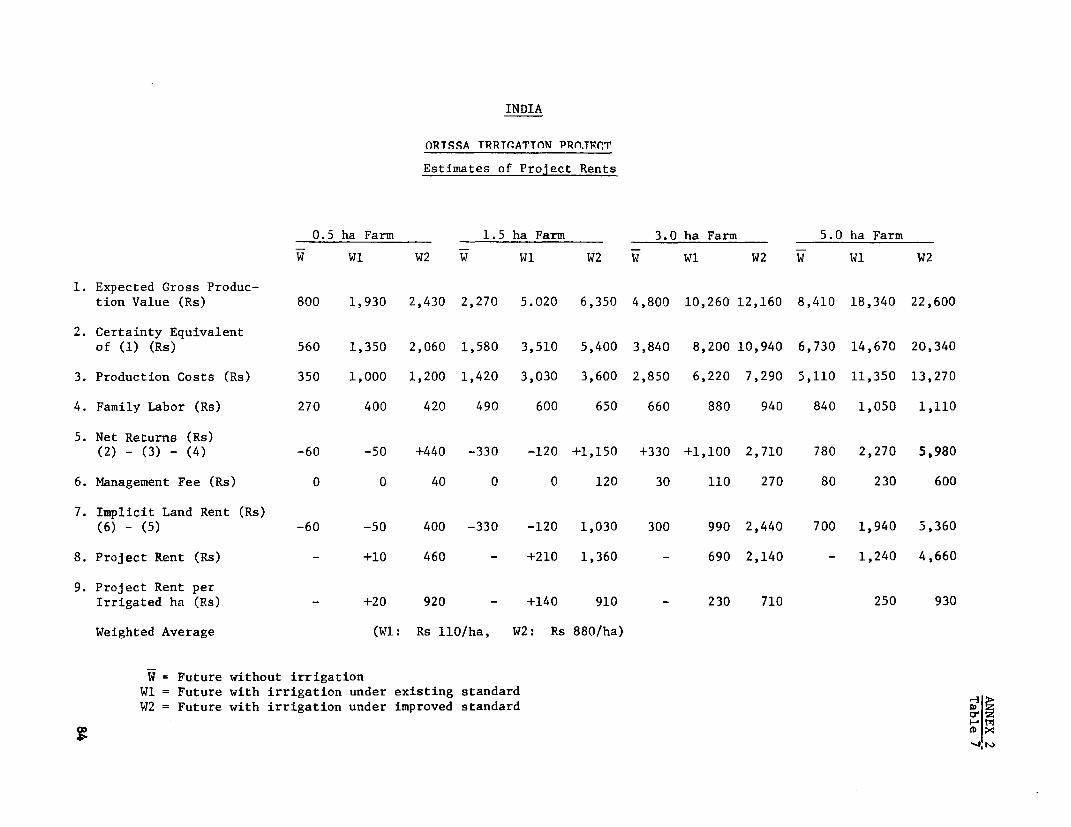
INDIA
ORTSSA TRRT(ATTON PRnOTFCT
Estimates of Project Rents
0.5 ha Farm 1.5 ha Farm 3.0 ha Farm 5.0 ha Farm
W WI W2 W Wi W2 W Wi W2 W Wi W2
1. Expected Gross Produc-tion Value (Rs) 800 1,930 2,430 2,270 5.020 6,350 4,800 10,260 12,160 8,410 18,340 22,600
2. Certainty Equivalentof (1) (Rs) 560 1,350 2,060 1,580 3,510 5,400 3,840 8,200 10,940 6,730 14,670 20,340
3. Production Costs (Rs) 350 1,000 1,200 1,420 3,030 3,600 2,850 6,220 7,290 5,110 11,350 13,270
4. Family Labor (Rs) 270 400 420 490 600 650 660 880 940 840 1,050 1,110
5. Net Returns (Rs)(2) - (3) - (4) -60 -50 +440 -330 -120 +1,150 +330 +1,100 2,710 780 2,270 5,980
6. Management Fee (Rs) 0 0 40 0 0 120 30 110 270 80 230 600
7. Implicit Land Rent (Rs)(6) - (5) -60 -50 400 -330 -120 1,030 300 990 2,440 700 1,940 5,360
8. Project Rent (Rs) - +10 460 - +210 1,360 - 690 2,140 - 1,240 4,660
9. Project Rent perIrrigated ha (Rs) - +20 920 - +140 910 - 230 710 250 930
Weighted Average (WI: Rs 110/ha, W2: Rs 880/ha)
W = Future without irrigationWl = Future with irrigation under existing standardW2 = Future with irrigation under improved standard
m x
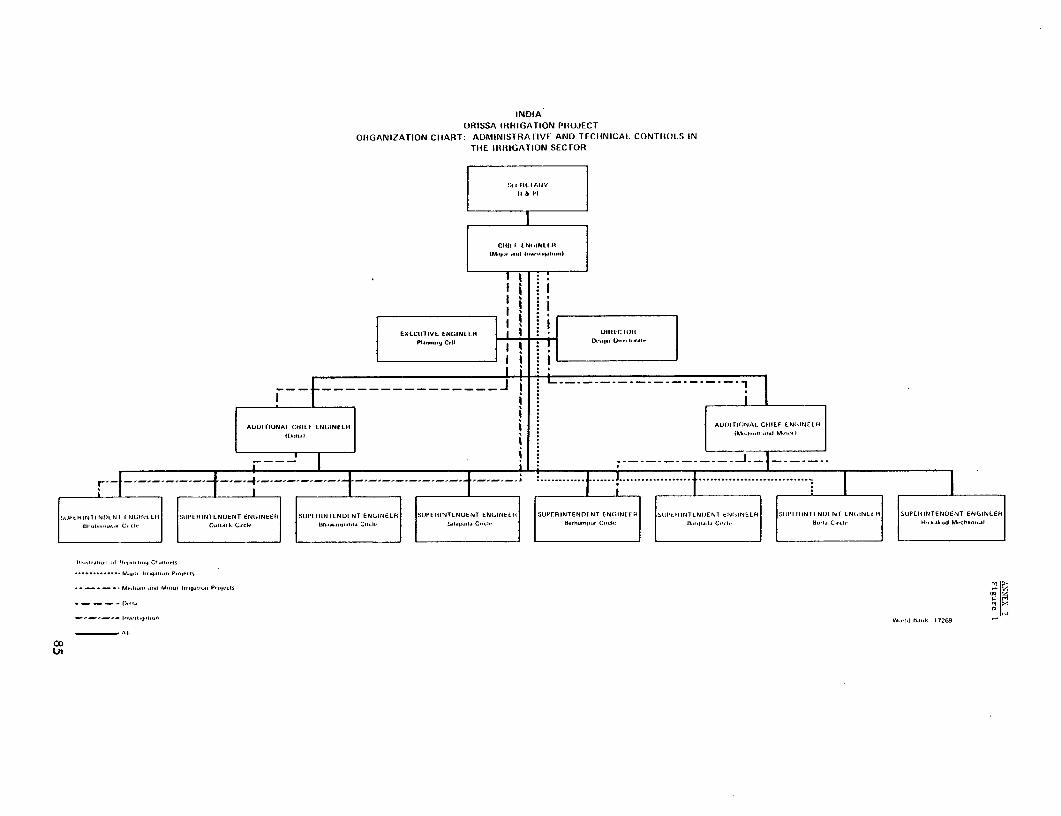
INDIAORISSA IRRIGATION PR(OJECT
ORGANIZATION CIfART: ADMINISTRAIIVE AND TECHNICAL CONTHIOLS IN
THE IHRIGATION SECTOR
I ;IILI. IAIIY
It
II It f tL
EXLCUI1IVIL ENGINtLH IIHI-CIU311 I
Pi|XafI Iy Oi U I
C~~~~~~~~~~~~~~~~~~~ -u ----- - -------AUDITIONAI CHILF ENGINEER AUIIIVINAL CHIEF LNGIlNEER
r-~|--~'~'~'~'~'~'4l~'~'~'~~'~'t s ..........- ----- -- .... ''''''''. ......SUPLHINII NILN1 ENGINLEII sIIFERINTLN DENT ENGINLEEI SUPEHINILNDI NT ENGINELR SUPEI11NTENUENT ENGINEEti SUPERINTENDENT ENGINEER SI IN DENI EN(GINELR| SIPLIUINIENOENT ENGINELE SUPIL1INTENOENT ENGINLEH
| I I.'.oW ClCII I I CUIIAF k CullI,.I I ,hDW I I II I CiI, ul C-tI,! BurHa,el , C C,,OI! I I . C., I B/I., C-1, II,,k ,u,I MCcI ,, I
............. i.. I,Y.,II,ecIs
D ,,I,,Ol 3Id
_._._._ nV{^SIl99x$(/n Wl a. H . l.k 172G9 ~~~~~~~~~~~~~~~~~~~~~~~~~~~~~~~~~MO 126
02 I.n~~~~~~l
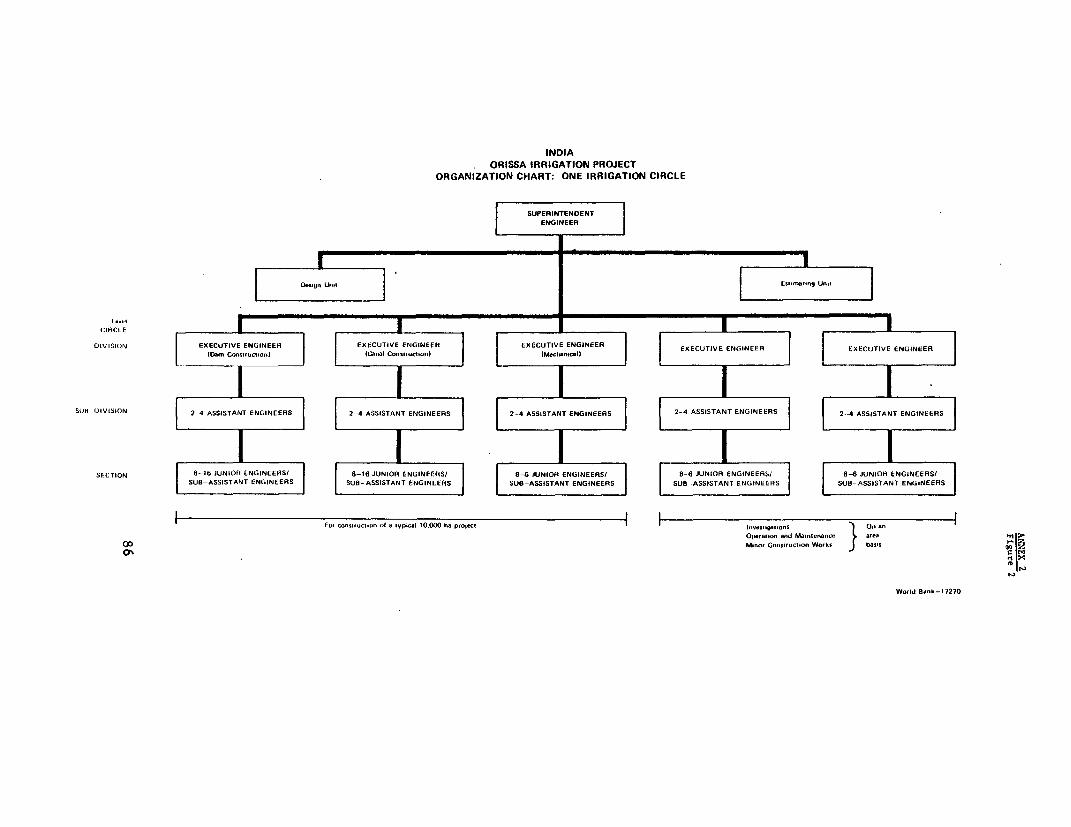
INDIAORISSA IRRIGATION PROJECT
ORGANIZATION CHART: ONE IRRIGATION CIRCLE
SUPERINENDENTENGINEER
I o'. | I' I -AuWu CI RCLE
DIVISION EXECUTIVE ENGINEE ExNEER EXECUTIVE ENGINEER EXECUTIVE ENGINEER EXECUTIVE ENGINEER
(ck..~~~~~~~~~~~~~~~~~~~~~~~~~~~
SUns DIVISION 2 4 ASSISTANT ENGINEEHS 2--4 ASSISTANT ENGINEERS 2-4 ASSISTANT ENGINEERS 2-4 ASSISTANT ENGINEERS 2--4 ASSISTANT ENGINEERS
SFCTION 8--16 JUNIOR ENGINEERS/ 8-16 JUNIOR ENGINEERS/ 8-6 JUNIOR ENGINEERS/ 8-6 JUNIOR ENGINEERS/ 8-6 JUNIOR ENGINEERS/|SUB-ASSISTANT ENGINEERS| | SUB-ASSISTANT ENGINEERES | SUB-ASSISTANT ENGINEERS | |S8-SSISTANT ENGINEERS | SUB-ASSISTANT ENGINEERS|
Eot construction ri1
a lvpical 10,000 h.a pm1.01 Iuivesriations Ott an
Op.,. "noniru tind WorEs basis d
Wotld Banlk-t7270
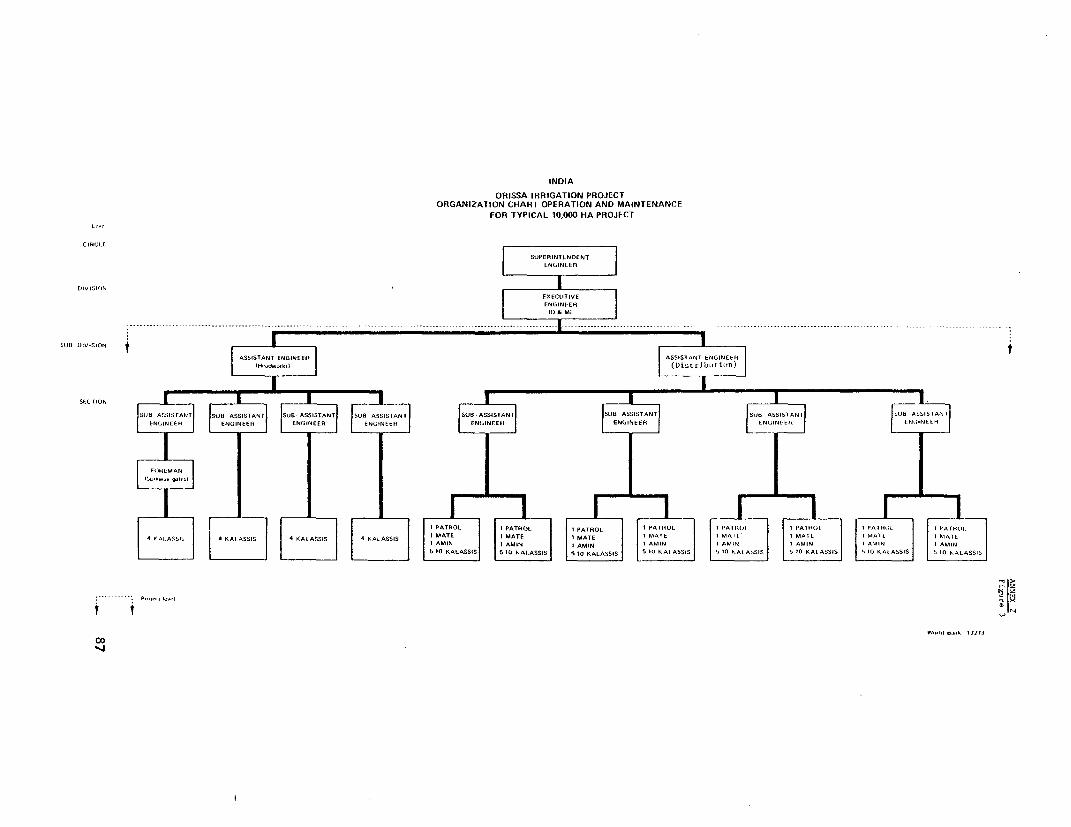
INDIA
ORISSA IRRIGATION PROJECTORGANIZATION CHART OPERATION AND MAINTENANCE
FOR TYPICAL 10,000 HA PROJECT
C IIRCLE
DIVISIONI
~Ijn DIVISION
SEC rIOlI
1W. ASSWANT 1'.. A~sIsAANN A AMN 'MI AI ASSAMIND A 1 AMIN A M I A
WA A .0.L171
0,
ANNEX 2APPENDIX 1Page 1
WORLD BANK LINE OF CREDIT FORMEDIUM IRRIGATION PROJECTS
STATE
XXDDC PROJECT
PROJECT SUMMARY
Date Approved by CWC:Approving Officer:Project Summary Prepared by:
88
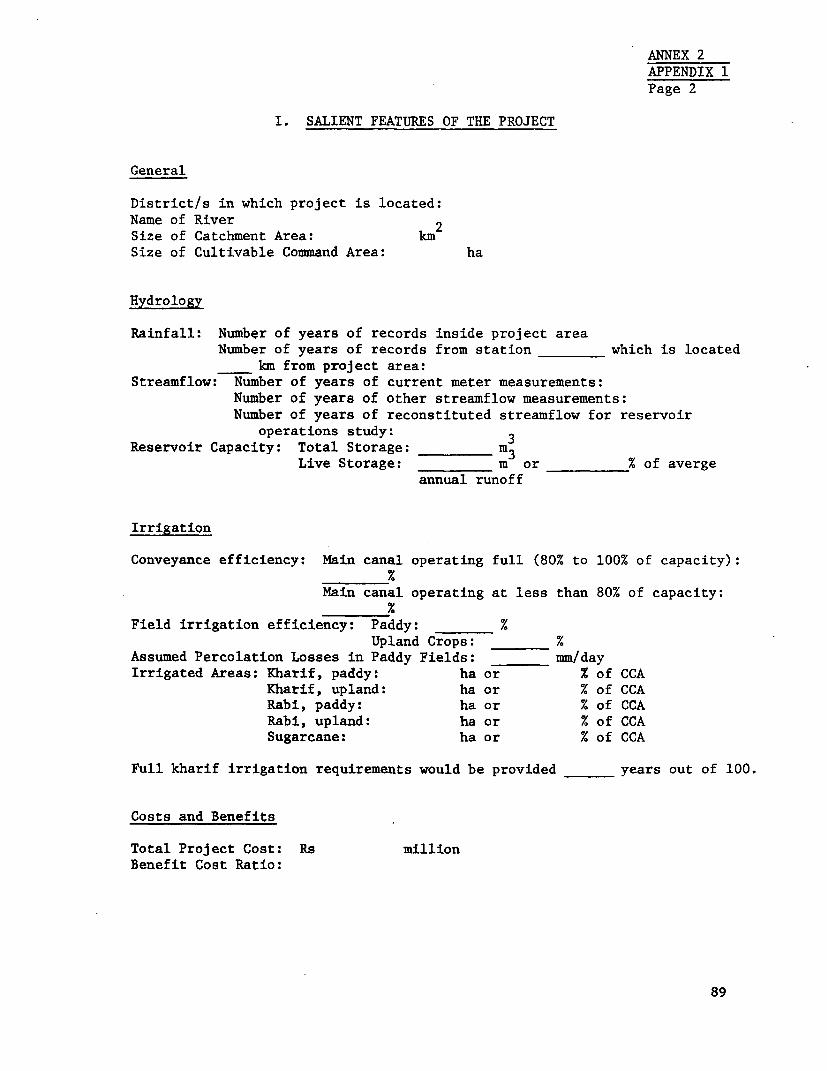
ANNEX 2APPENDIX 1Page 2
I. SALIENT FEATURES OF THE PROJECT
General
District/s in which project is located:Name of River 2Size of Catchment Area: kmSize of Cultivable Command Area: ha
Hydrology
Rainfall: Number of years of records inside project areaNumber of years of records from station which is located
km from project area:Streamflow: Number of years of current meter measurements:
Number of years of other streamflow measurements:Number of years of reconstituted streamflow for reservoir
operations study: 3Reservoir Capacity: Total Storage: m3
Live Storage: m or % of avergeannual runoff
Irrigation
Conveyance efficiency: Main canal operating full (80% to 100% of capacity):
Main canal operating at less than 80% of capacity:
Field irrigation efficiency: Paddy: %Upland Crops: __ %
Assumed Percolation Losses in Paddy Fields: mm/day
Irrigated Areas: Kharif, paddy: ha or % of CCAKharif, upland: ha or % of CCARabi, paddy: ha or % of CCARabi, upland: ha or % of CCASugarcane: ha or % of CCA
Full kharif irrigation requirements would be provided years out of 100.
Costs and Benefits
Total Project Cost: Rs millionBenefit Cost Ratio:
89
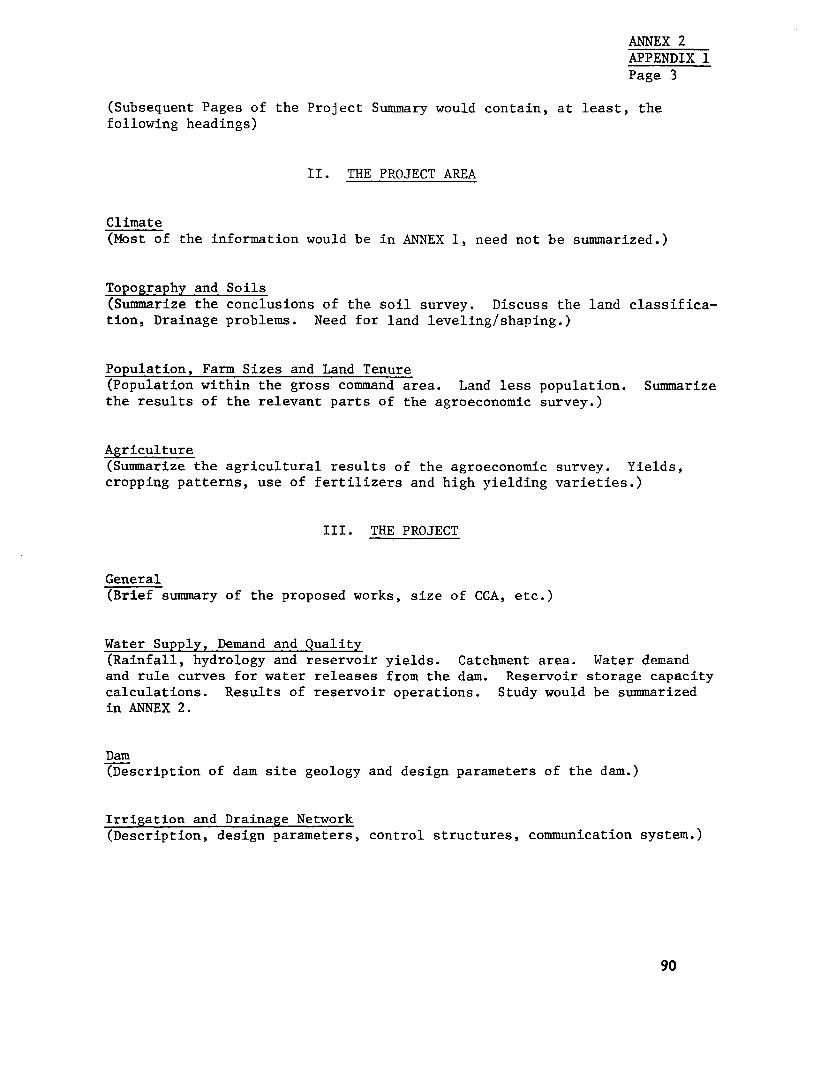
ANNEX 2APPENDIX 1Page 3
(Subsequent Pages of the Project Summary would contain, at least, thefollowing headings)
II. THE PROJECT AREA
Climate(Most of the information would be in ANNEX 1, need not be summarized.)
Topography and Soils(Summarize the conclusions of the soil survey. Discuss the land classifica-tion, Drainage problems. Need for land leveling/shaping.)
Population, Farm Sizes and Land Tenure(Population within the gross command area. Land less population. Summarizethe results of the relevant parts of the agroeconomic survey.)
Agriculture(Summarize the agricultural results of the agroeconomic survey. Yields,cropping patterns, use of fertilizers and high yielding varieties.)
III. THE PROJECT
General(Brief summary of the proposed works, size of CCA, etc.)
Water Supply, Demand and Quality(Rainfall, hydrology and reservoir yields. Catchment area. Water demandand rule curves for water releases from the dam. Reservoir storage capacitycalculations. Results of reservoir operations. Study would be summarizedin ANNEX 2.
Dam(Description of dam site geology and design parameters of the dam.)
Irrigation and Drainage Network(Description, design parameters, control structures, communication system.)
90
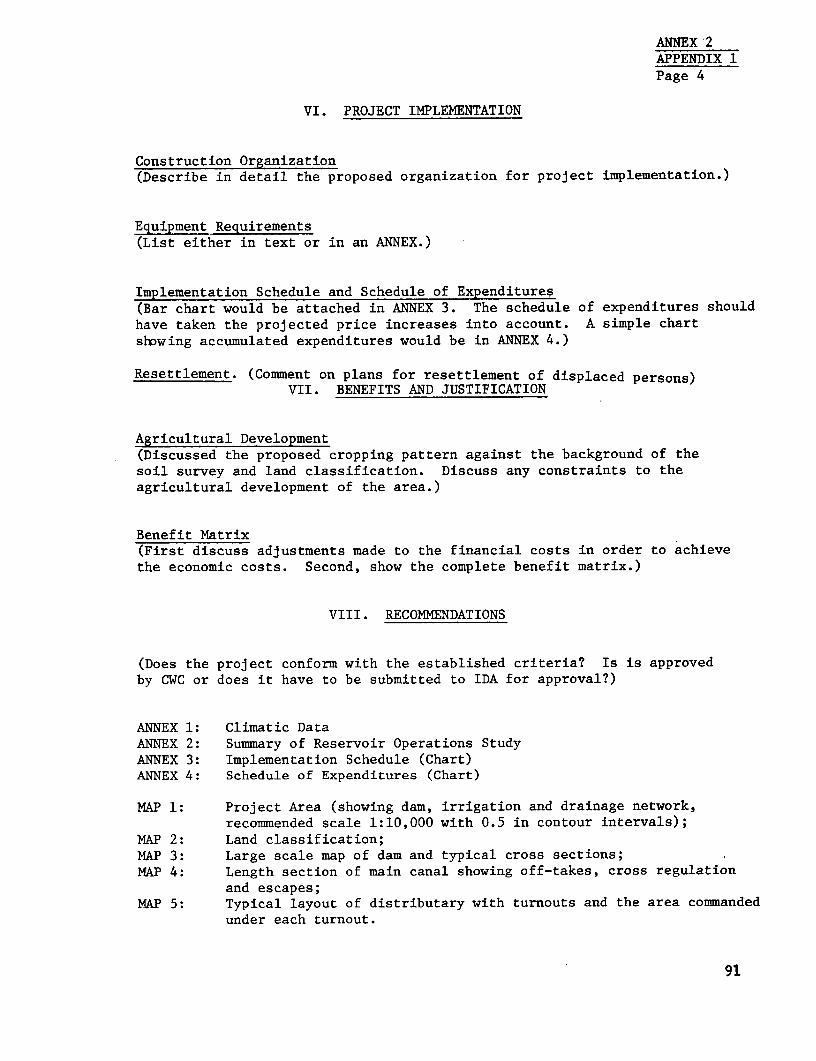
ANNEX 2APPENDIX 1Page 4
VI. PROJECT IMPLEMENTATION
Construction Organization(Describe in detail the proposed organization for project implementation.)
Equipment Requirements(List either in text or in an ANNEX.)
Implementation Schedule and Schedule of Expenditures(Bar chart would be attached in ANNEX 3. The schedule of expenditures shouldhave taken the projected price increases into account. A simple chartslhwing accumulated expenditures would be in ANNEX 4.)
Resettlement. (Comment on plans for resettlement of displaced persons)VII. BENEFITS AND JUSTIFICATION
Agricultural Development(Discussed the proposed cropping pattern against the background of thesoil survey and land classification. Discuss any constraints to theagricultural development of the area.)
Benefit Matrix(First discuss adjustments made to the financial costs in order to achievethe economic costs. Second, show the complete benefit matrix.)
VIII. RECOMMENDATIONS
(Does the project conform with the established criteria? Is is approvedby CWC or does it have to be submitted to IDA for approval?)
ANNEX 1: Climatic DataANNEX 2: Summary of Reservoir Operations StudyANNEX 3: Implementation Schedule (Chart)ANNEX 4: Schedule of Expenditures (Chart)
MAP 1: Project Area (showing dam, irrigation and drainage network,recommended scale 1:10,000 with 0.5 in contour intervals);
MAP 2: Land classification;MAP 3: Large scale map of dam and typical cross sections;MAP 4: Length section of main canal showing off-takes, cross regulation
and escapes;MAP 5: Typical layout of distributary with turnouts and the area commanded
under each turnout.
91
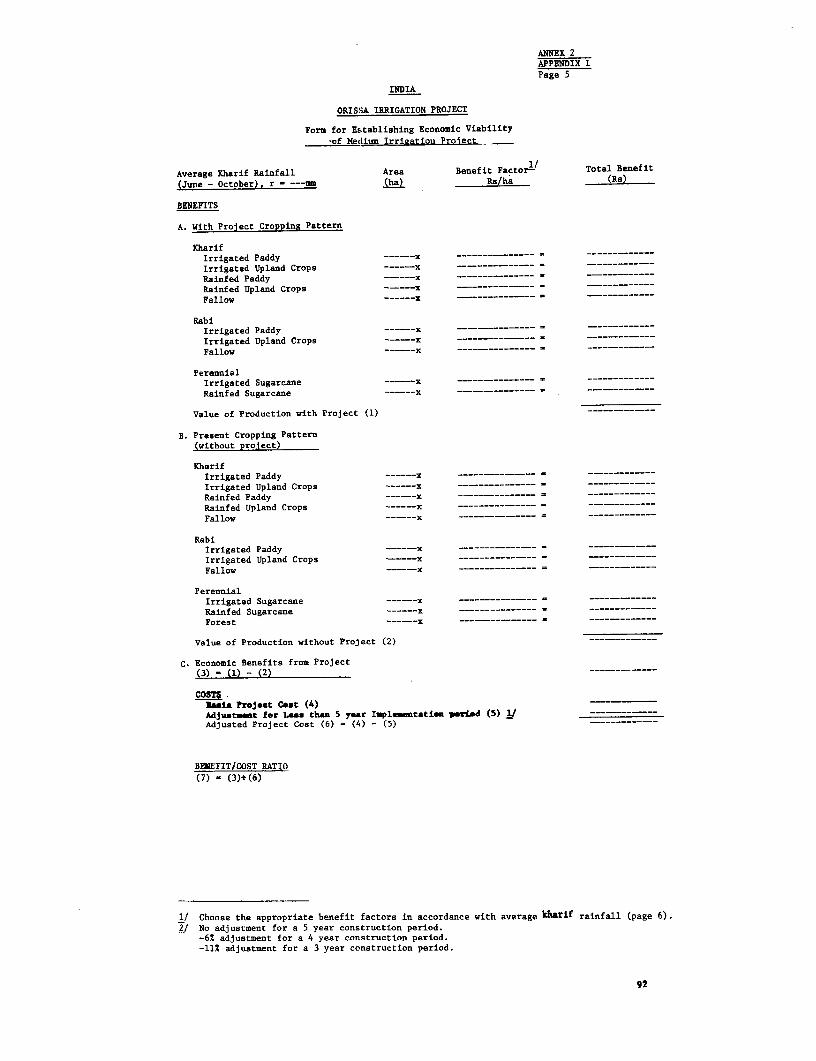
ANNEX 2APPENDIX 1Page 5
INDIA
ORISSA IRRIGATION PROJECT
Form for Establishing Economic Viability
-of Medium Irrigation Project - _
Average Rharif Rainfall Area Benefit Factor- Total Benefit
(June - October), r - (ha) Rs/ha (Rs)
BENEFITS
A. With Project Cropping Pattern
RharifIrrigated Paddy ----- x --------------- -------------
Irrigated Upland Crops ------x - -----------
Rainfed Paddy ----- x -------------- - -------------
Rainfed Upland Crops ----- x -------------- = ------------
Fallow ------x -------------- - -------------
RabiIrrigated Paddy ------x ------------
Irrigated Upland Crops ------x -------------- -…
Fallow ------x ------ -------- - ----------- -
PerennialIrrigated Sugarcane ----- x -- ----------
Rainfed Sugarcane ------x =
Value of Production with Project (1) ------------
B. Present Cropping Pattern(without project)
KharifIrrigated Paddy ------x --------------- - ------------
Irrigated Upland Crops ------x ---------…----- - -------------
Rainfed Paddy ------x -------------- = -----------
Rainfed Upland Crops ------x --------------- = ------------
Fallow ------Kx --- - --------
RabiIrrigated Paddy ----- ------------- ---
Irrigated Upland Crops ------x -- - ------- - -- -
Fallow ----- x --------------- -------
PerennialIrrigated Sugarcane ------Kx -------------
Rainfed Sugarcane ------x --------------- - ------------
Forest ------x -------------- - --------
Value of Production without Project (2) ------------
C. Economic Benefits from Project(3) - (1) - (2) -------------
COST5Xane Projeat Cost (4)Adjustunt for Less than 5 y.ar Iupl.eitati-n parted (5) 1/ --- - ----- -Adjusted Project Cost (6) - (4) - (5) -----------
BENEFIT/COST RATIO(7) - (3)t(6)
1/ Choose the appropriate benefit factors in accordance with average kharif rainfall (page 6).
2/ No adjustment for a 5 year construction period.-6% adjustment for a 4 year construction period.-11% adjustment for a 3 year construction period.
92
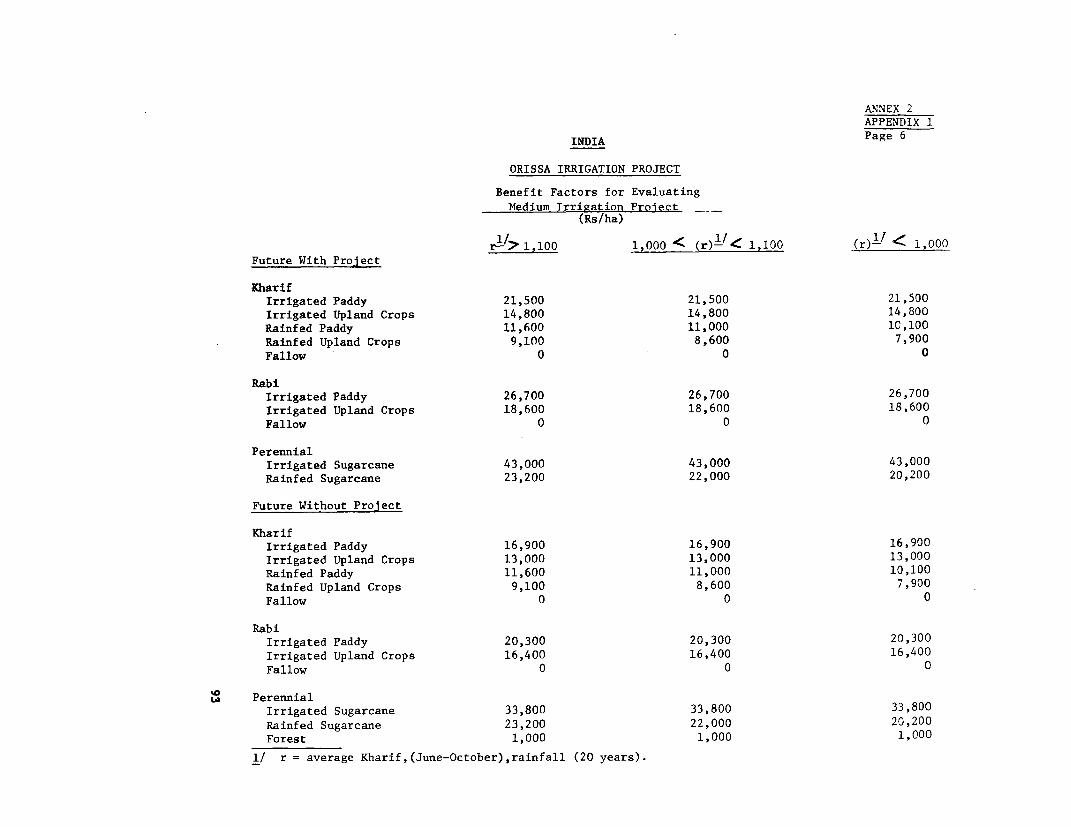
ANNEX 2APPENDIX 1
INDIA Page 6
ORISSA IRRIGATION PROJECT
Benefit Factors for EvaluatingMedium Irrigation Prolect __
(Rs/ha)
r I/> 1,100 1,000 < Cr)-'.. 1,100 (r)- < 1,000Future With Project
KharifIrrigated Paddy 21,500 21,500 21,500Irrigated Upland Crops 14,800 14,800 14,800Rainfed Paddy 11,600 11,000 1C,100Rainfed Upland Crops 9,100 8,600 7,900Fallow 0 0 0
RabiIrrigated Paddy 26,700 26,700 26,700Irrigated Upland Crops 18,600 18,600 18,600Fallow 0 0 0
PerennialIrrigated Sugarcane 43,000 43,000 43,000Rainfed Sugarcane 23,200 22,000 20,200
Future Without Project
KharifIrrigated Paddy 16,900 16,900 16,900Irrigated Upland Crops 13,000 13,000 13,000Rainfed Paddy 11,600 11,000 10,100Rainfed Upland Crops 9,100 8,600 7,900Fallow 0 0 0
RabiIrrigated Paddy 20,300 20,300 20,300Irrigated Upland Crops 16,400 16,400 16,400Fallow 0 0 0
L PerennialIrrigated Sugarcane 33,800 33,800 33,800Rainfed Sugarcane 23,200 22,000 20,200Forest 1,000 1,000 1,000
1/ r = average Kharif,(June-October),rainfall (20 years).
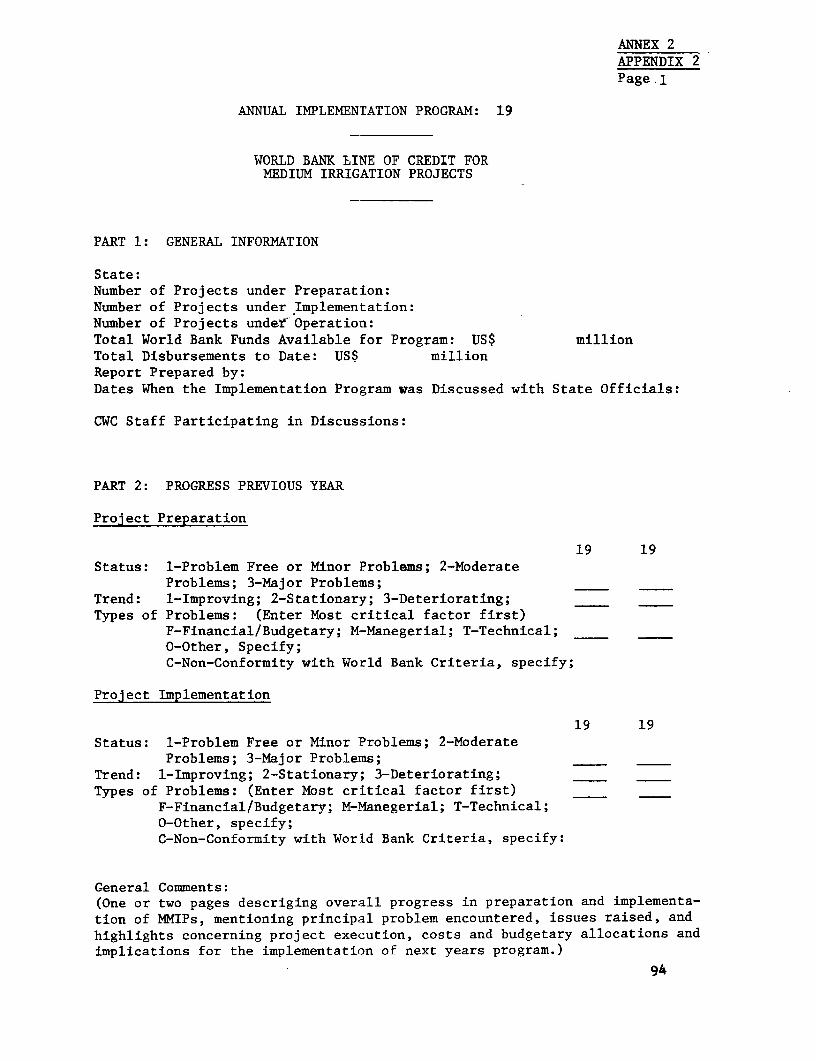
ANNEX 2APPENDIX 2Page.l
ANNUAL IMPLEMENTATION PROGRAM: 19
WORLD BANK LI'NE OF CREDIT FORMEDIUM IRRIGATION PROJECTS
PART 1: GENERAL INFORMATION
State:Number of Projects under Preparation:Number of Projects under Implementation:Number of Projects undef'Operation:Total World Bank Funds Available for Program: US$ millionTotal Disbursements to Date: US$ millionReport Prepared by:Dates When the Implementation Program was Discussed with State Officials:
CWC Staff Participating in Discussions:
PART 2: PROGRESS PREVIOUS YEAR
Project Preparation
19 19Status: 1-Problem Free or Minor Problems; 2-Moderate
Problems; 3-Major Problems;Trend: 1-Improving; 2-Stationary; 3-Deteriorating;Types of Problems: (Enter Most critical factor first)
F-Financial/Budgetary; M-Manegerial; T-Technical;O-Other, Specify;C-Non-Conformity with World Bank Criteria, specify;
Project Implementation
19 19Status: 1-Problem Free or Minor 'Problems; 2-Moderate
Problems; 3-Major Problems; _
Trend: 1-Improving; 2-Stationary; 3-Deteriorating;Types of Problems: (Enter Most critical factor first)
F-Financial/Budgetary; M-Manegerial; T-Technical;O-Other, specify;C-Non-Conformity with World Bank Criteria, specify:
General Comments:(One or two pages descriging overall progress in preparation and implementa-tion of MMIPs, mentioning principal problem encountered, issues raised, andhighlights concerning project execution, costs and budgetary allocations andimplications for the implementation of next years program.)
94
ANNEX 2APPENDIX 2Page 2
PART 3: GENERAL COMMENTS REGARDING THE IMPLEMENTATION PROGRAM FOR 19_(Including summary of projected quarterly expenditures for each project.)
PART 4: PROGRAMS FOR INDIVIDUAL PROJECTS
Project 1(A short summary of key events for the following year. Exhibit 1 from the"Supervision Summary" should be updated and attached. Comments on thefeasibility of the proposed schedule.)
Project 2 etc.
95
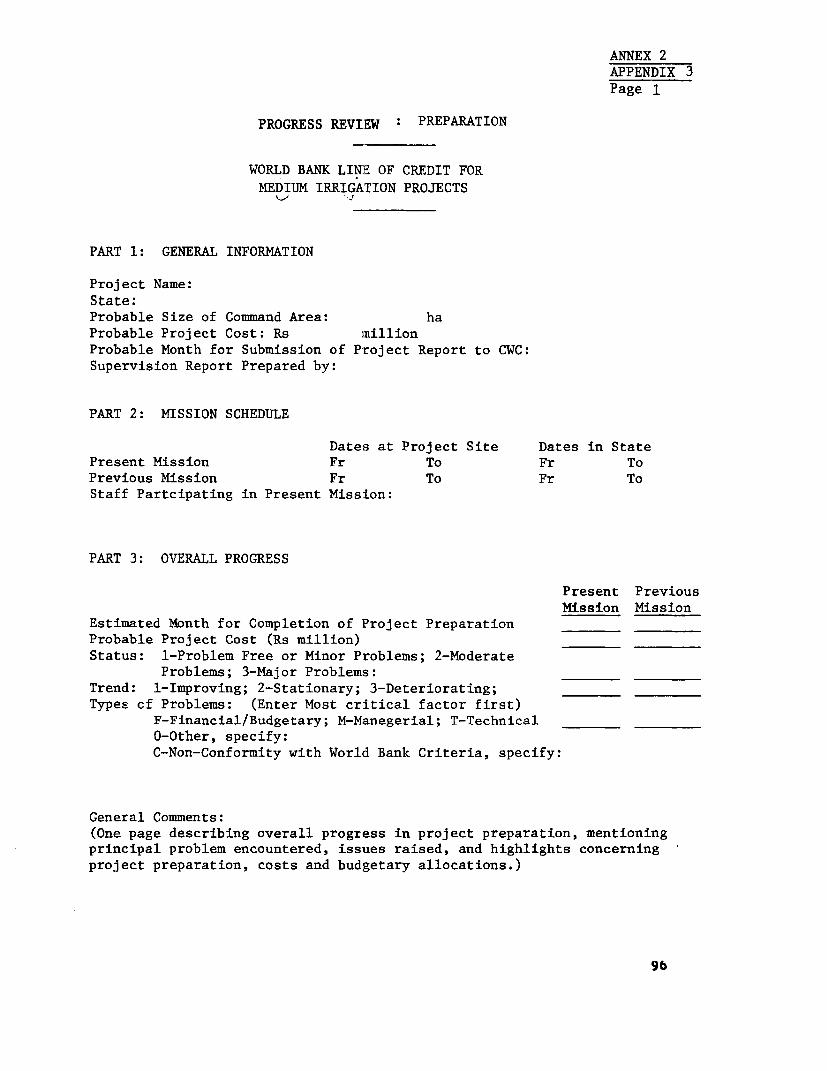
ANNEX 2APPENDIX 3Page 1
PROGRESS REVI:EW : PREPARATION
WORLD BANK LINE OF CREDIT FOR
MEDIUM IRRIGATION PROJECTS
PART 1: GENERAL INFORMATION
Project Name:
State:Probable Size of Command Area: ha
Probable Project Cost: Rs millionProbable Month for Submission of Project Report to CWC:Supervision Report Prepared by:
PART 2: MISSION SCHEDULE
Dates at Project Site Dates in StatePresent Mission Fr To Fr To
Previous Mission Fr To Fr ToStaff Partcipating in Present Mission:
PART 3: OVERALL PROGRESS
Present PreviousMission Mission
Estimated Month for Completion of Project Preparation
Probable Project Cost (Rs million) _ __=
Status: 1-Problem Free or Minor Problems; 2-ModerateProblems; 3-Major Problems:
Trend: 1-Improving; 2-Stationary; 3-Deteriorating;Types cf Problems: (Enter Most critical factor first)
F-Financial/Budgetary; M-Manegerial; T-TechnicalO-Other, specify:C-Non-Conformity with World Bank Criteria, specify:
General Comments:(One page describing overall progress in project preparation, mentioningprincipal problem encountered, issues raised, and highlights concerning
project preparation, costs and budgetary allocations.)
96
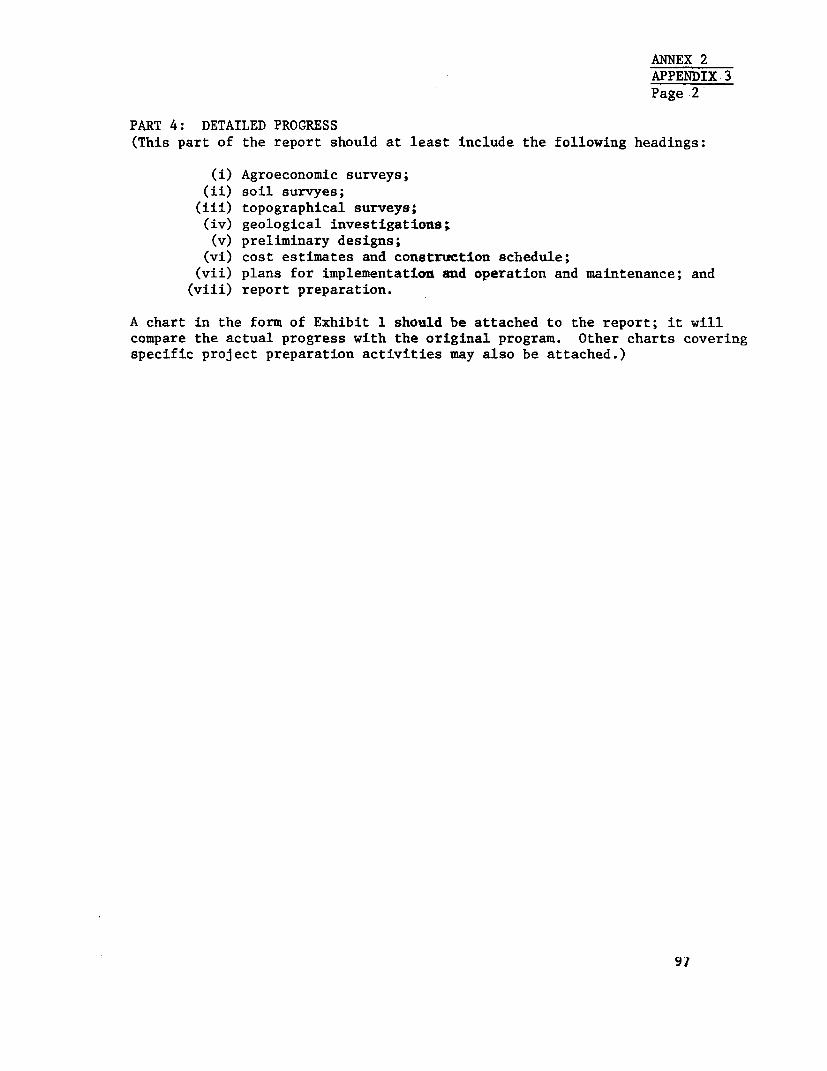
ANNEX 2APPENDIX 3Page 2
PART 4: DETAILED PROGRESS(This part of the report should at least include the following headings:
(i) Agroeconomic surveys;(ii) soil survyes;(iii) topographical surveys;(iv) geological investigations;(v) preliminary designs;(vi) cost estimates and construction schedule;
(vii) plans for implementation and operation and maintenance; and
(viii) report preparation.
A chart in the form of Exhibit 1 should be attached to the report; it will
compare the actual progress with the original program. Other charts covering
specific project preparation activities may also be attached.)
97
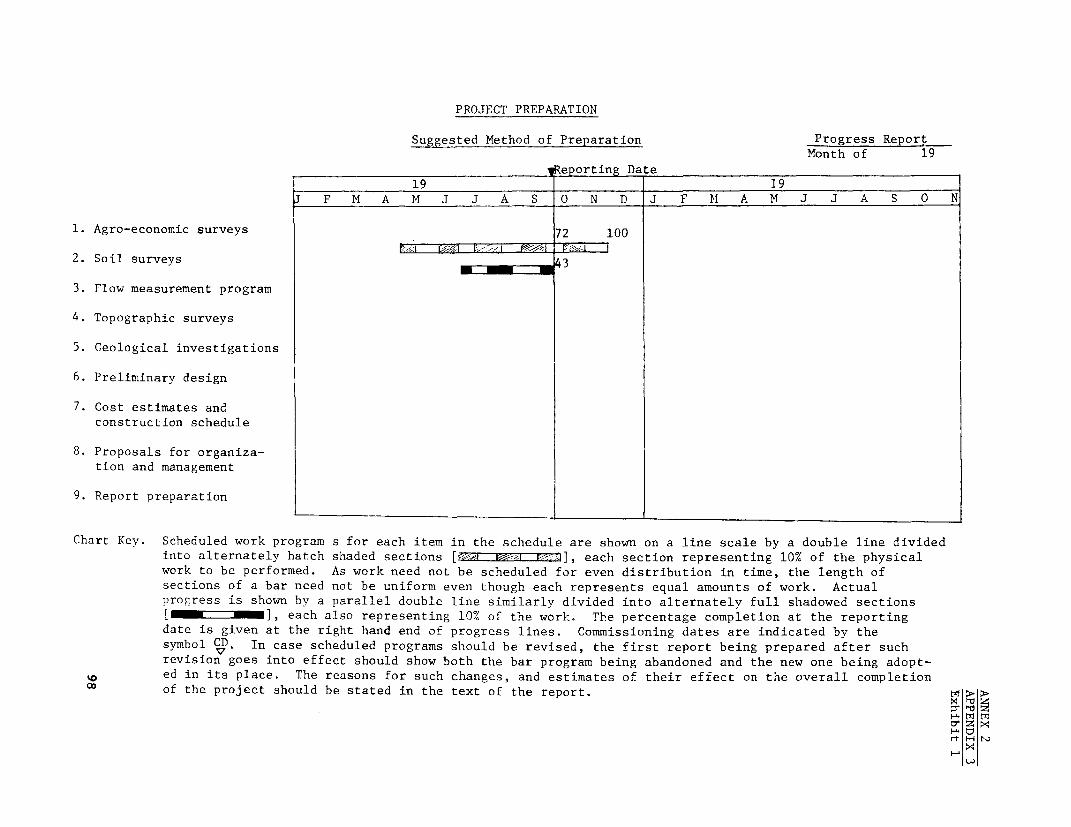
PROJECT PREPARATION
Suggested Method of Preparation Progress ReportMonth of 19
19_______________ _ teporting Date19 ____________ 19
J F M A M J J A S 0 N D J F M A M J J A S 0 N
1. Agro-economic surveys 72 100
2. Soil surveys 43
3. Flow measurement program
4. Topographic surveys
5. Geological investigations
6. Preliminary design
7. Cost estimates andconstruction schedule
8. Proposals for organiza-tion and management
9. Report preparation
Chart Key. Scheduled work program s for each item in the schedule are shown on a line scale by a double line dividedinto alternately hatch shaded sections [ ], each section representing 10% of the physicalwork to be performed. As work need not be scheduled for even distribution in time, the length ofsections of a bar need not be uniform even though each represents equal amounts of work. Actualprogress is shown by a parallel double line similarly divided into alternately full shadowed sections[I r- -1 ], each also representing 10% of the work. The percentage completion at the reportingdate is given at the right hand end of progress lines. Commissioning dates are indicated by thesymbol CD. In case scheduled programs should be revised, the first report being prepared after suchrevision goes into effect should show both the bar program being abandoned and the new one being adopt-ed in its place. The reasons for such changes, and estimates of their effect on the overall completion
X0 of the project should be stated in the text of the report. > >
Y- x
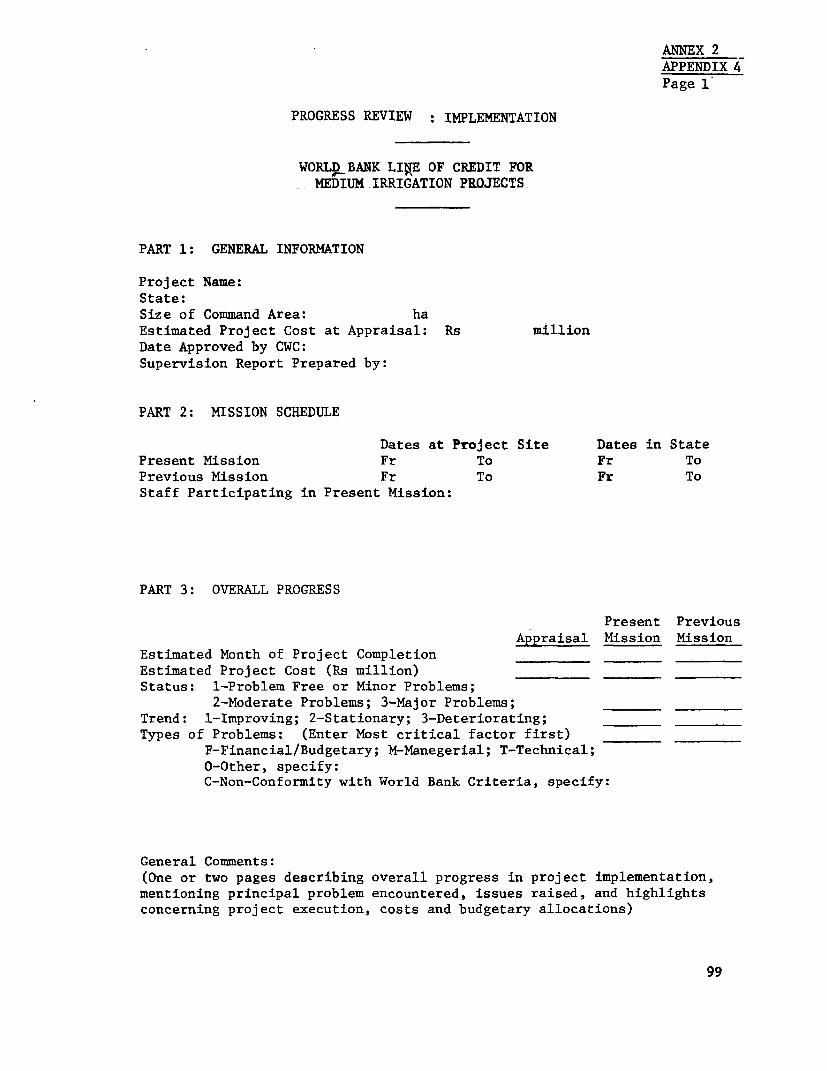
ANNEX 2APPENDIX 4Page 1
PROGRESS REVIEW : IMPLEMENTATION
WORL9. BANK LIME OF CREDIT FORMEDIUM IRRIGATION PROJECTS-
PART 1: GENERAL INFORMATION
Project Name:State:Size of Command Area: haEstimated Project Cost at Appraisal: Rs millionDate Approved by CWC:Supervision Report Prepared by:
PART 2: MISSION SCHEDULE
Dates at Project Site Dates in StatePresent Mission Fr To Fr To
Previous Mission Fr To Fr ToStaff Participating in Present Mission:
PART 3: OVERALL PROGRESS
Present PreviousAppraisal Mission Mission
Estimated Month of Project CompletionEstimated Project Cost (Rs million)Status: 1-Problem Free or Minor Problems;
2-Moderate Problems; 3-Major Problems;Trend: 1-Improving; 2-Stationary; 3-Deteriorating;Types of Problems: (Enter Most critical factor first)
F-Financial/Budgetary; M-Manegerial; T-Technical;O-Other, specify:C-Non-Conformity with World Bank Criteria, specify:
General Comments:(One or two pages describing overall progress in project implementation,mentioning principal problem encountered, issues raised, and highlightsconcerning project execution, costs and budgetary allocations)
99
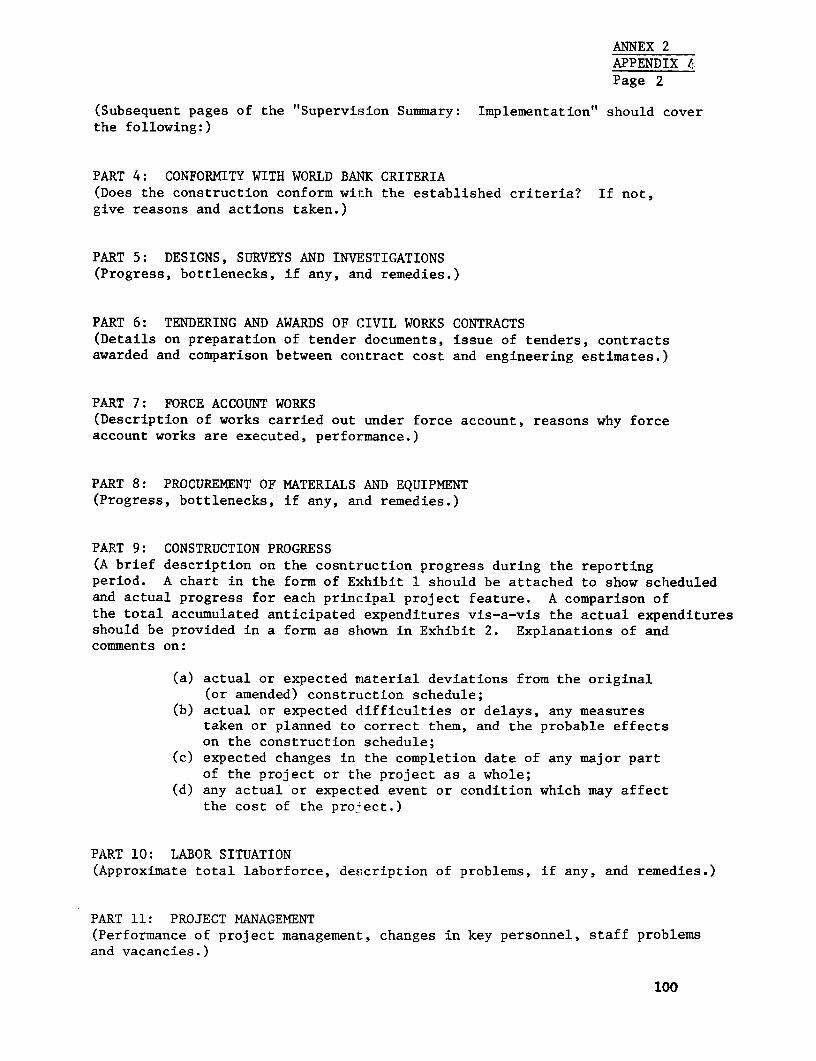
ANNEX 2APPENDIX 4Page 2
(Subsequent pages of the "Supervision Summary: Implementation" should coverthe following:)
PART 4: CONFORMITY WITH WORLD BAN4K CRITERIA(Does the construction conform with the established criteria? If not,give reasons and actions taken.)
PART 5: DESIGNS, SURVEYS AND INVESTIGATIONS(Progress, bottlenecks, if any, and remedies.)
PART 6: TENDERING AND AWARDS OF (CIVIL WORKS CONTRACTS(Details on preparation of tender documents, issue of tenders, contractsawarded and comparison between contract cost and engineering estimates.)
PART 7: FORCE ACCOUNT WORKS(Description of works carried out under force account, reasons why forceaccount works are executed, performance.)
PART 8: PROCUREMENT OF MATERIALS AND EQUIPMENT(Progress, bottlenecks, if any, arid remedies.)
PART 9: CONSTRUCTION PROGRESS(A brief description on the cosntruction progress during the reportingperiod. A chart in the form of Exhibit 1 should be attached to show scheduledand actual progress for each principal project feature. A comparison ofthe total accumulated anticipated expenditures vis-a-vis the actual expendituresshould be provided in a form as shown in Exhibit 2. Explanations of andcomments on:
(a) actual or expected material deviations from the original(or amended) constrlction schedule;
(b) actual or expected dlifficulties or delays, any measurestaken or planned to correct them, and the probable effectson the construction schedule;
(c) expected changes in the completion date of any major partof the project or the project as a whole;
(d) any actual or expected event or condition which may affectthe cost of the project.)
PART 10: LABOR SITUATION(Approximate total laborforce, description of problems, if any, and remedies.)
PART 11: PROJECT MANAGEMENT(Performance of project management, changes in key personnel, staff problemsand vacancies.)
100
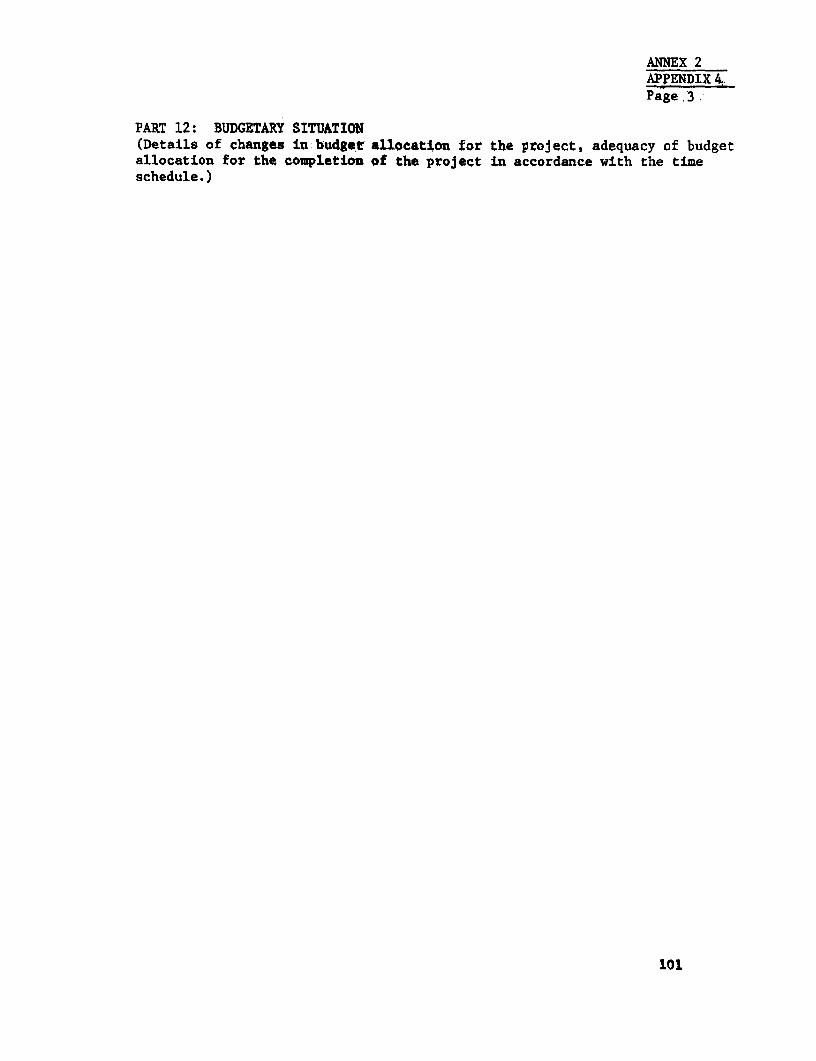
ANNEX 2APPENDIX 4.Page 3.
PART 12: BUDGETARY SITUATION(Details of changes in bu4get allocation for the project, adequacy of budgetallocation for the completion of the project in accordance with the timeschedule.)
101
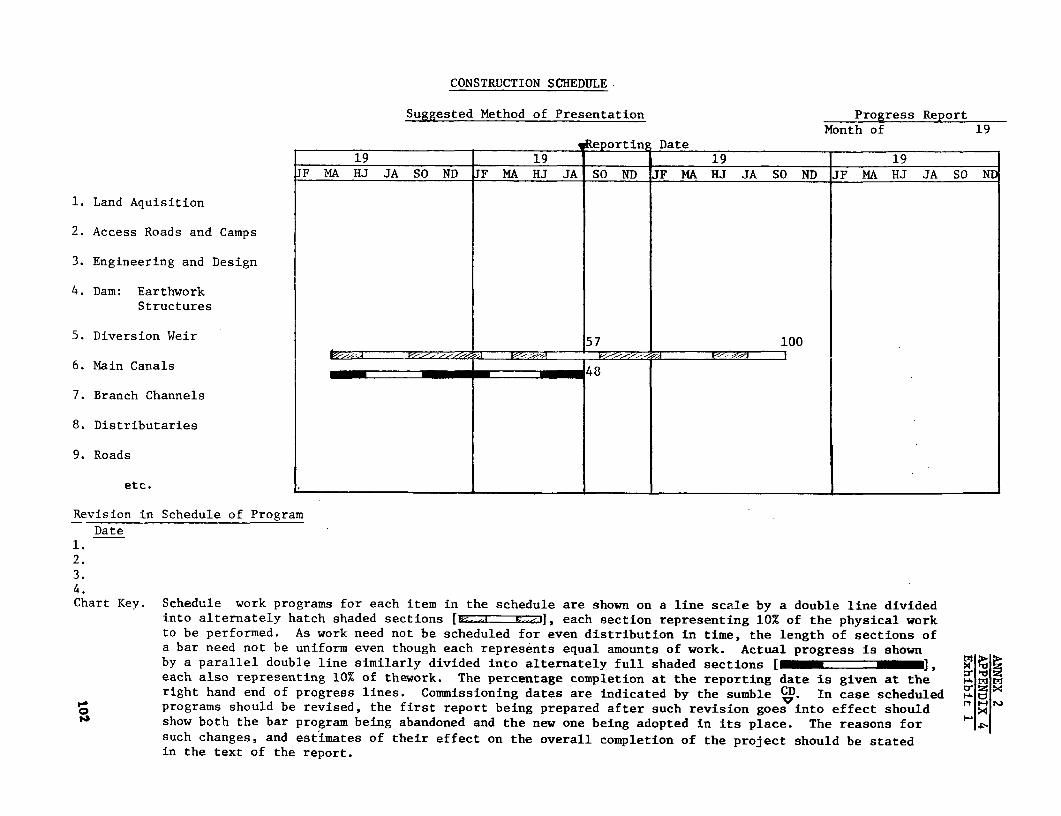
CONSTRUCTION SCHEDULE
Suggested Method of Presentation Progress ReportMonth of 19
p eportin Date19 19 _____19 19
JF MA HJ JA SO ND JF MA HJ JA SO ND JF MA HJ JA SO ND JF MA HJ JA SO ND
1. Land Aquisition
2. Access Roads and Camps
3. Engineering and Design
4. Dam: EarthworkStructures
5. Diversion Weir 57 100
6. Main Canals ___r4v_-_-__ *_ ee 48
7. Branch Channels
8. Distributaries
9. Roads
etc. _ _ _ _ _ _ _ _ _ _ _ _ _ _ _ _ _
Revision in Schedule of ProgramDate
1.2.3.4.Chart Key. Schedule work programs for each item in the schedule are shown on a line scale by a double line divided
into alternately hatch shaded sections II - r-31, each section representing 10% of the physical workto be performed. As work need not be scheduled for even distribution in time, the length of sections ofa bar need not be uniform even though each represents equal amounts of work. Actual progress is shownby a parallel double line similarly divided into alternately full shaded sections [ ], M each also representing 10% of thework. The percentage completion at the reporting date is given at the i. M Miright hand end of progress lines. Commissioning dates are indicated by the sumble CD. In case scheduled '- toprograms should be revised, the first report being prepared after such revision goes into effect shouldshow both the bar program being abandoned and the new one being adopted in its place. The reasons for -LIsuch changes, and estimates of their effect on the overall completion of the project should be statedin the text of the report.
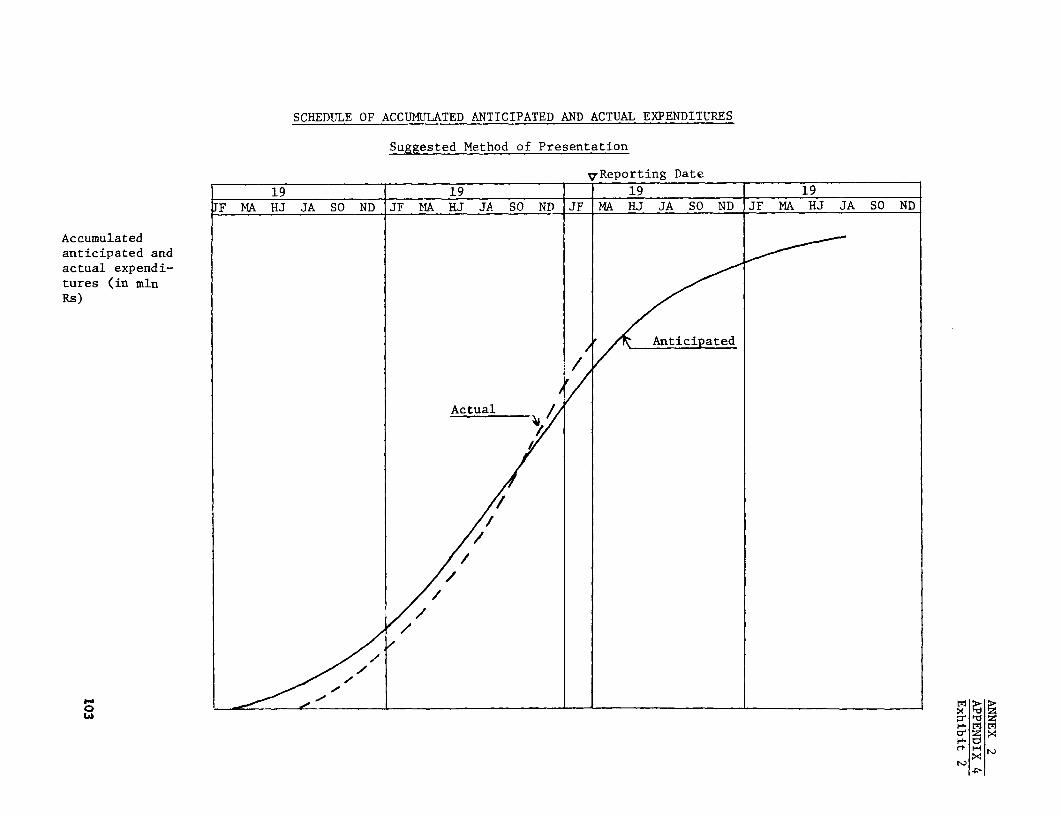
SCHEDULE OF ACCUMULATED ANTICIPATED AND ACTUAL EXPENDITURES
Suggested Method of Presentation
RP.eporting Date
19 19 19 19__ __ _ _ _ __ _ _ _
JF MA HJ JA SO ND JF MA HJ JA SO ND JF MA HJ JA SO ND JF MA HJ JA SO ND
Accumulatedanticipated andactual expendi-tures (in mlnRs)
x
icipated ~ ~ ~ ~ S
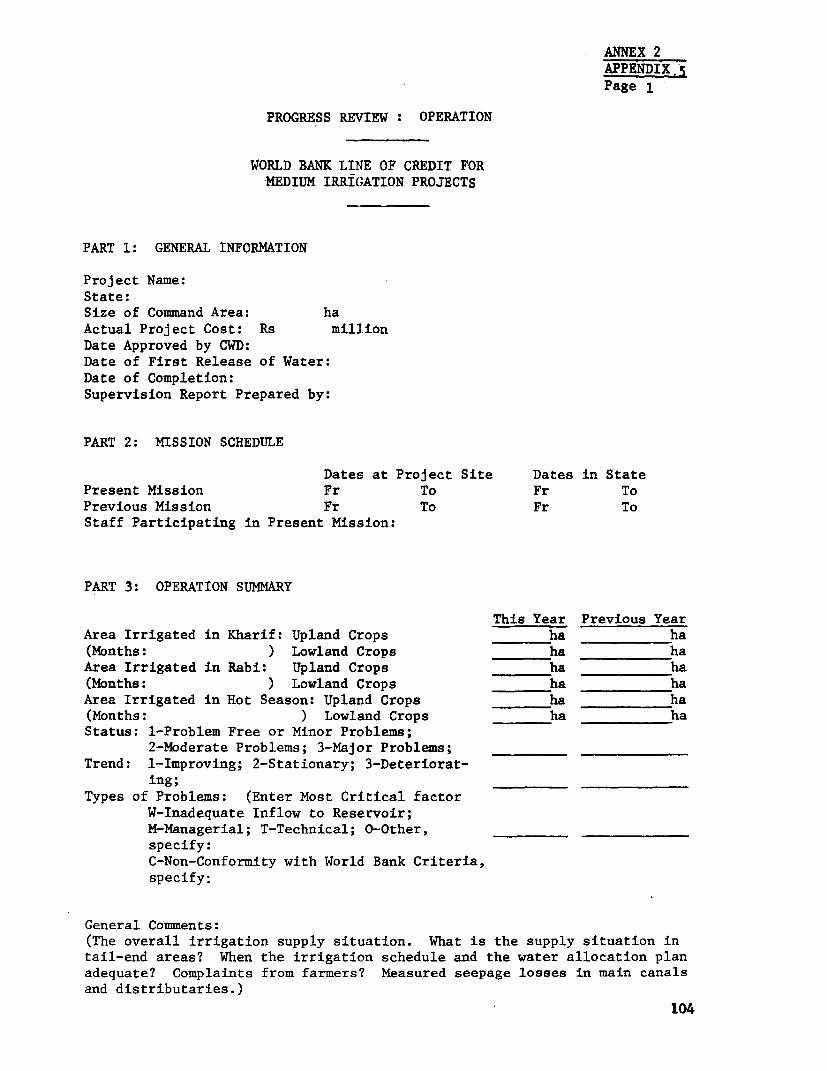
ANNEX 2APPENDIX. Page 1
PROGRESS REVIEW : OPERATION
WORLD BANK LINE OF CREDIT FORMEDIUM IRRIfGATION PROJECTS
PART 1: GENERAL INFORMATION
Project Name:State:Size of Command Area: haActual Project Cost: Rs millionDate Approved by CWD:Date of First Release of Water:Date of Completion:Supervision Report Prepared by:
PART 2: MISSION SCHEDULE
Dates at Project Site Dates in StatePresent Mission Fr To Fr ToPrevious Mission Fr To Fr ToStaff Participating in Present Mission:
PART 3: OPERATION SUMMARY
This Year Previous YearArea Irrigated in Kharif: Upland Crops __ ha ha(Months: ) Lowland Crops ha haArea Irrigated in Rabi: Upland Crops ha ha(Months: ) Lowland Crops ha haArea Irrigated in Hot Season: Upland Crops ha ha(Months: ) Lowland Crops ha haStatus: 1-Problem Free or Minor Problems;
2-Moderate Problems; 3-Major Problems;Trend: 1-Improving; 2-Stationary; 3-Deteriorat-
ing;Types of Problems: (Enter Most Critical factor
W-Inadequate Inflow to Reservoir;M-Managerial; T-Technical; O-Other,specify:C-Non-Conformity with World Bank Criteria,specify:
General Comments:(The overall irrigation supply situation. What is the supply situation intail-end areas? When the irrigation schedule and the water allocation planadequate? Complaints from farmers? Measured seepage losses in main canalsand distributaries.)
104
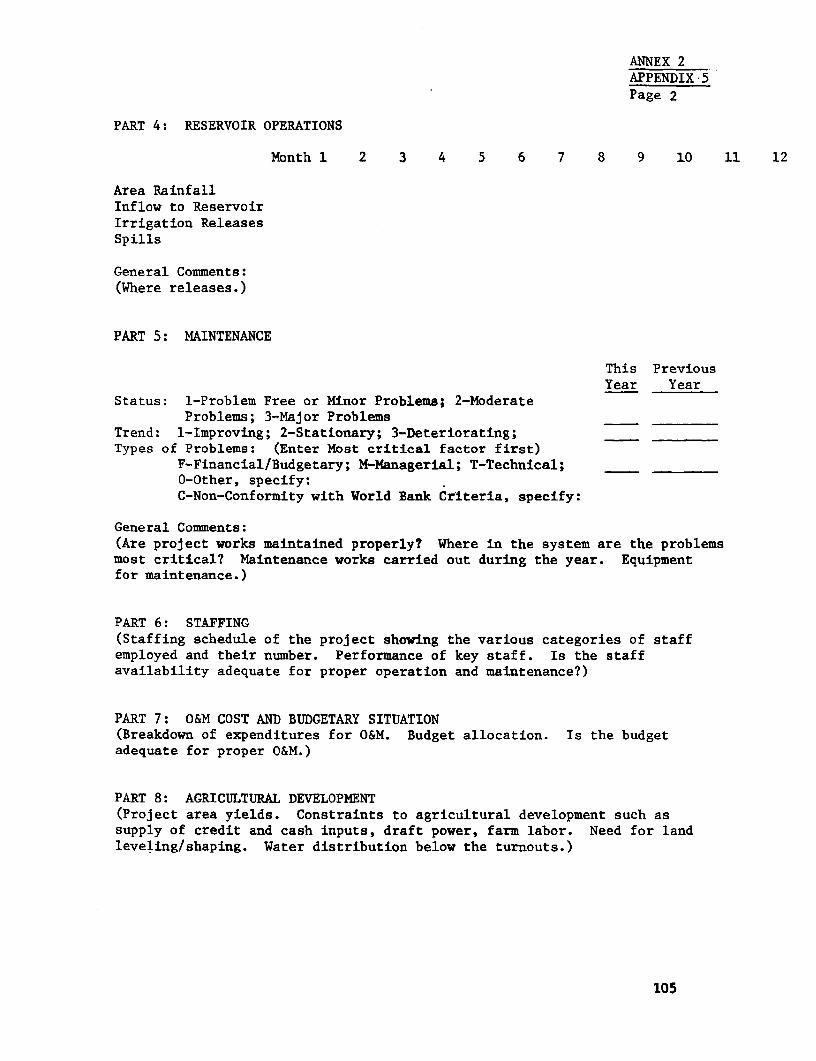
ANNEX 2APPENDIX 5Page 2
PART 4: RESERVOIR OPERATIONS
Month 1 2 3 4 5 6 7 8 9 10 11 12
Area RainfallInflow to ReservoirIrrigation ReleasesSpills
General Comments:(Where releases.)
PART 5: MAINTENANCE
This PreviousYear Year
Status: 1-Problem Free or Minor Problems; 2-ModerateProblems; 3-Major Problems
Trend: 1-Improving; 2-Stationary; 3-Deteriorating;Types of Problems: (Enter Most critical factor first)
F-Financial/Budgetary; M-Managerial; T-Technical;0-Other, specify:C-Non-Conformity with World Bank Criteria, specify:
General Comments:(Are project works maintained properly? Where in the system are the problemsmost critical? Maintenance works carried out during the year. Equipmentfor maintenance.)
PART 6: STAFFING(Staffing schedule of the project showing the various categories of staffemployed and their number. Performance of key staff. Is the staffavailability adequate for proper operation and maintenance?)
PART 7: O&M COST AND BUDGETARY SITUATION(Breakdown of expenditures for O&M. Budget allocation. Is the budgetadequate for proper O&M.)
PART 8: AGRICULTURAL DEVELOPMENT(Project area yields. Constraints to agricultural development such assupply of credit and cash inputs, draft power, farm labor. Need for landleveling/shaping. Water distribution below the turnouts.)
105
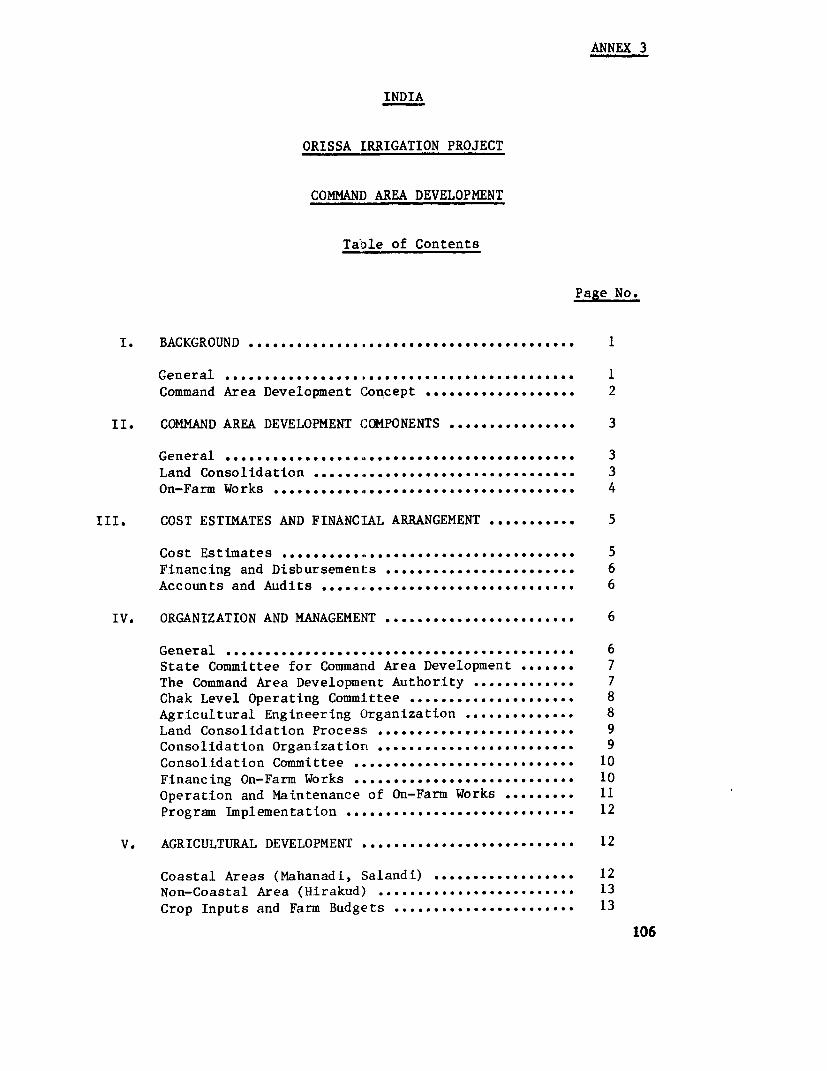
ANNEX 3
INDIA
ORISSA IRRIGATION PROJECT
COMMAND AREA DEVELOPMENT
Table of Contents
Page No.
I. BACKGROUND I.................. ..... *......*.. 1
General ............. 1...************e*********** 1Command Area Development Concept ..... .............. 2
II. COMMAND AREA DEVELOPMENT COMPONENTS ................ 3
General ........................ ********..****..*** 3Land Consolidation ...... ... .......... . 3On-Farm Works .... 0........0.......**.. ,,,* *....*** 4
III. COST ESTIMATES AND FINANCIAL ARRANGEMENT o ........... 5
Cost Estimates .......... ., .. 0.*.*************** * 5Financing and Disbursements .. o........ .oo...... 6Accounts and Audits ............. *. ...... 00 ... ....... 6
IV. ORGANIZATION AND MANAGEMENT 6...................... 6
General .0.0 .....*.... , 0 6State Committee for Command Area Development ooo.... 7The Command Area Development Authority 7............ 7Chak Level Operating Committee 8.............. .... 8Agricultural Engineering Organization .......... 8Land Consolidation Process ........................ 9Consolidation Organization ................ 9Consolidation Committee ... .. ............... ........ 10Financing On-Farm Works . ... .. .. ..... .o-oo.. . ... . . . . .... 10Operation and Maintenance of On-Farm Works ......... 11Program Implementation o ... o....... . . .*..... 0.0...0..... 12
V. AGRICULTURAL DEVELOPMENT ........................... 12
Coastal Areas (Mahanadi, Salandi) .................. 12Non-Coastal Area (Hirakud) .. .. ..................... 13Crop Inputs and Farm Budgets o ................... 13
106
ANNEX 3
Table of Contents (cont'd) - 2 -
Page No.
VI. BENEFITS AND JUSTIFICATION ........... .............. 15
General ................................... 15Employment Benefits ................................ 15Income Distribution ................................ 15Economic Evaluation .............................. .. 15Risk and Uncertainty ............................... 16
107
ANNEX 3Page 1
COMMAND AREA DEVELOPMENT
I. BACKGROUND
General
1. The traditional approach to irrigation development in India, underwhich some 42 M ha have been brought under irrigation, is to end the publiclyconstructed canal system at outlets serving a block of land of 40 ha or more,leaving the cultivators within the block to arrange water distribution amongthemselves. The present practice of water distribution on the farm in mostcases is field to field irrigation, which leaves the "tail-end" cultivatorswithin a 40 ha block with either too much water which results in water log-ging or with too little water for intensive cropping. Furthermore, the cul-tivators generally have not been able to reach agreement on the constructionof on-farm works and have not had adequate "know how", training or creditavailability to complete these works successfully. Generally, the standardof development has been considerably less than desirable, resulting in lowaverage crop yields and a wasteful use of irrigation water. Consequently,in most completed projects, there is a significant difference between theirrigation potential that has been created and actual utilization.
2. The Command Area Development (CAD) program being undertaken by theGovernment of India and the World Bank is aimed at bridging this gap. Itembraces both new irrigation projects, where land is coming under service bycanals for the first time, and older projects which have been served by canalsfor some years but where the taking up of irrigation has been slow or tech-nically unsatisfactory or the deterioration of lands has occurred. Althougha CAD program already has been initiated in several other states in India,this is the first such project to be undertaken by the Bank Group in theState of Orissa.
3. A number of pilot projects for on-farm works, covering a total of5,000 ha, have been carried out in the major command areas in Orissa (MahanadiII, Salandi and Hirakud) in order to experiment with various design parameters,establish unit costs, test implementation procedures and refine survey andplanning works. The results have been encouraging, with an increase inirrigated area of 20% to 30%.
4. Experience from other states of India, where large scale on-farmdevelopment has been attempted, suggests that the major obstacles to CAD are:
(a) the alignment of field channels and drains and obtainingthe right of way for these without payment of compensationfor land; and
108
ANNEX 3Page 2
(b) the large number of farmers ineligible for bank loansdue to unclear titles.
Both of these obstacles would be removed in the course of the land consoli-dation program which was initiated by the GOO in 1973. As the Bank Grouphas encouraged many states in India to do land consolidation before CAD,the support of the program under IDA financing would set a precedent forfuture Bank involvement.
Command Area Development Concept
5. The proposed CAD project in Orissa is built on experience gainedfrom a number of pilot projects in various command areas (para 3) as wellas from CAD programs in other states in India. The project sets a patternthat can be replicated throughout Orissa in the future. Primary considera-tions in project formulation have been:
(a) Optimal use of available water resources. This would beachieved through the provision of irrigation and drainagefacilities for each farm with adequate control structures,lining of critical canal sections and proper land develop-ment (paras 11-16);
(b) Ensuring the distribution of water. On-farm development woulddeliver water to each farm and proper drainage would removewater logging from "tail-end" farms in low-lying areas. Con-sequently, irrigation benefits would be more evenly distri-buted;
(c) Institutional building. The various steps of CAD: topographicsurvey, border realignment, planning and execution of fieldschannels and drains would be done by different agencies, suchas the Consolidation Unit of the Revenue Department and theAgricultural Engineering Organization of DAFP. Although theseagencies are technically competent to carry out the works,inter-departmental coordination would be essential to ensureeffective implementation and supervision of the CAD program.A CAD Authority (CADA) has been established in each commandarea for this purpose (paras 25-27); and
(d) Farmer's participation in CAD. This is achieved through theConsolidation Committee which advises the consolidationofficers at various stages and through the "Chak LevelOperating Committee" which decides on water allocationwithin an outlet (paras 28, 35).
109
ANNEX 3Page 3
II. COMMAND AREA DEVELOPMENT COMPONENTS
General
6. Since many steps required for planning, design and constructionof field channels and drains (topographical and cadastral surveys, borderrealignment, land records clearing) are included in the consolidation process,the land consolidation program is a pre-requisite for the implementation ofon-farm works. Consequently, the construction of field channels and drainswithin a chak (outlet) would be phased after consolidation is completedfor that particular chak.
Land Consolidation
7. For many years, land fragmentation has been a serious constraint tointensive agriculture in Orissa. The median farm size is about I ha, with anaverage of 10-12 farm plots per holding. In order to promote more efficientand intensive agricultural development, land consolidation has been taken upin the State with the legal support provided by the "Orissa Consolidation ofHoldings and Prevention of Fragmentation Act of 1972".
8. The scheme envisages rearrangement and redistribution of land incompact rectangular blocks. In the course of land consolidation, land recordsare cleared and land is set aside for communal purposes such as field channelsand drains. The alignment of field channels and drains would be coordinatedwith layout of the chakas (consolidated plots) so that each of the chakas wouldbe ensured to have direct and independent access to an irrigation and drain-age channel. Topographical surveys of the areas to be consolidated are there-fore undertaken simultaneously with the updating of records and the proposedchannel alignments are marked on the maps.
9. It is estimated that 4.5 M ha out of 6.7 M ha of the total culti-vated area in the State can be consolidated, of which 915,000 ha are irrigated.Priority has been given to major irrigation command areas in view of theirproduction potential and immediate needs for proper water management. So far,an area of 250,000 ha has been included in the State consolidation programcovering 1,751 villages, of which 1,085 are located in Mahanadi Delta in anarea of 158,000 ha. About 666 villages, accounting for 88,000 ha, are locatedin the Salandi and Hirakud commandL areas.
10. The GOO is intending to carry out land consolidation of about250,000 ha within six years. Given the efficient organization for consoli-dation, this is a realistic estimate. However, since this is the first timethe Bank Group has been involved in a land consolidation program in India, afour year program would be included under the project to consolidate an areaof 200,000 ha in the four command areas: Mahandi I and II, Salandi andHirakud. Since the start of program in 1974, about 15,000 ha are consolidatedin the three command areas, and wcrks are underway for 160,000 ha in MahanadiI and II.
110
ANNEX 3Page 4
On-Farm Works
11. The deficiencies of the field to field irrigation practice inOrissa (para 1) have constrained the development of intensive agriculture
and the adoption of modern agricultural techniques. In order to better
utilize available water resources, on-farm works would be undertaken for
a total area of 57,000 ha in the four command areas of Mahanadi I and II,
Salandi and Hirakud. The works would include field channels, field drains,
necessary control structures and land leveling and shaping where necessary.
12. Planning and Design. Topographical and cadastral surveys would be
carried out during the consolidation process. The topographical surveys
would be carried out on a 15m x 15m grid with contours of 0.30 m intervals.Layout plans and cost estimates would be made for each chak. The design of
field channels and drains would be undertaken on the basis of the topography
and rights of way for these would be provided along the realigned boundaries
of the holdings. All works would be carried out by the staff of the Agri-culture Engineering Organization (paras 29-30).
13. The field channels would be constructed as an extension of the main
canal system. They would be provided with masonry checks, turnouts and drop
structures. Lining would be provided for about 20% of the total length of the
field channels, principally in the main section near the head reaches of the
channels, which often are in raised embankments to gain command of downstreamareas. Such lining would reduce seepage losses in these reaches and improve
the reliability of water supply to tail end areas.
14. Where natural drainage is inadequate, field drains would be provided
to: (i) reduce the area, depth and duration of flooding during heavy rains;
(ii) remove drainage of paddy fields when needed; (iii) provide drainageof paddy fields when needed, and (iv) intercept groundwater flow, particu-
larly the seepage from irrigation.
15. Principal field channels would have an escape to a drain and each
farm would be provided with an outlet to a field drain. Access to fields is
traditionally available by informal rights-of-way, which connect with public
tracks and roads. Permanent structures would be provided where field channels
and drains cross access roads and tracks.
16. Land shaping requirements generally vary from one command area to
another, depending upon the topography, the depth and texture of soils, thesize of holdings, pre-project conditions -- whether already shaped or leveledor relatively undeveloped -- the amount of rainfall, and the type of crops to
be grown. In Hirakud, Salandi and the Mahanadi delta, virtually the entirearea is already bunded and leveled. Some leveling still continues in Hirakud,
generally as an off-season occupation of cultivators with marginal areas of
particularly irregular topography on their holdings. Where land development
111
ANNEX 3Page 5
would be carried out in conjuction with land consolidation, the land is anti-cipated to be leveled by the cultivators. This would consist principally ofre-leveling portions of isolated fields cut off during alignment to bringthem to the level of adjacent fields. The change in level would be only afew inches in most cases, and the cultivators would be able to carry out thiswork in the course of cultivation.
17. Construction Methods. Construction of field channels and drains,which is mostly earthwork and masonry (drop structures, division boxes,farm outlets), would be let to small village contractors. All excavationwould be done by manual labor. The construction would be supervised by thestaff of the Agricultural Engineering Organization. Land leveling and shap-ing, which is negligible, would be carried out by the cultivators.
III. COST ESTIMATES AND FINANCIAL ARRANGEMENT
Cost Estimates
18. The cost of land consolidation which mainly covers the establishmentexpenditure is estimated at Rs 300 per ha.
19. Based on the experiences from the CAD pilot projects in Orissa,costs of on-farm works are estimated as follows:
Rs/ha
Field ChannelsUnlined (80%) 110Lined (20%) 220Structures 50
Field Drains 60Structures 10
Access Crossings (channels and drains) 10
Sub-total 460
Physical Contingencies (20%) 92
Administration, Engineering andSupervision (20%) 92
Rounded 650
112
ANNEX 3Page 6
20. Total CAD costs would be US$10.8 M equivalent, including physicalcontingencies and establishment costs but net of price contingencies. Sincemost of the works would be carried out by manual labor with a small amountof materials, taxes, duties and the foreign exchange component of the proj-ect are negligible. Price contingencies are based on an estimated annualinflation rate of 8%. This would give an estimated cost for CAD of US$13.3 Mequivalent.
Financing and Disbursements
21. The proposed credit of US$2.4 M for the CAD would finance 40% ofthe four-year program of land consolidation and on-farm works. In most on-going CAD programs, IDA disburses against the cost of civil works. However,since consolidation is a time consuming operation (2 1/2 to 3 years) and theGOO would incur the costs for consolidation long before the on-farm worksare implemented, two disbursement categories would be established for the CAD:one for land consolidation and another for on-farm works. Disbursement forland consolidation would be made at a rate of Rs 150 per ha against Commis-sioner of Land Register and Resettlement's certificate of completion ofconsolidation works. Disbursement for on-farm works would be made for 55%of the ARDC's refinance for on-farm works against a certificate of expendi-ture. The documentation for CAD would be retained by GOO and ARDC forinspection during project supervision. The estimated schedule of expenditure,the proposed allocation of the proceeds of the credit and an annual disburse-ment schedule are presented in Annex 4.
Accounts and Audits
22. The implementing agencies of CAD would prepare and maintain separateaccounts and financial statements on expenditures for CAD works under IDAfinancing in accordance with sound accounting practice. Such accounts andfinancial statements would be audited annually by the Auditor General ofOrissa. Complete accounts, financial statements would be available for inspec-tion during project supervision. Audit summaries would be submitted to IDAwithin nine months after each fiscal year. ARDC would require participatingbanks to maintain separate accounts for project lending which would be auditedand submitted to IDA within four months after the end of each year, togetherwith an audited ARDC statement of project lending to such banks.
IV. ORGANIZATION AND MANAGEMENT
General
23. The success of command area development is largely dependent on aneffective organizational structure. In Orissa, the organization extends fromthe Cabinet level down to village committee.
113
ANNEX 3Page 7
State Committee for Command Area Development
24. In May 1976, GOO constituted three Command Area Development Auth-orities (CADAs) for the three major irrigation systems of Hirakud, Salandiand Mahanadi Delta. In order to ensure effective supervision of the CADprograms in all three systems as well as to bring about inter-departmentalcoordination, the GOO has set up a State Committee presided over by the ChiefMinister. Members are ministers, secretaries and heads of departments andagencies connected with CAD, the Chief Secretary, the Additional ChiefSecretary, the Agricultural Production Commissioner, the Commissioner,CAD and the Chairmen of the three CADAs. The CAD Commissioner, who isalso Special Secretary to Government in the Agricultural and Cooperation,Irrigation and Power and Revenue Departments, is appointed as the convenorof the State Committee. The Agriculture and Cooperation Department is theadministrative department for CAD.
The Command Area Development Authority (CADA)
25. The CADA is the main management unit at the project level. It isregistered as a "Society" in order to enable the CADA to take up loans onbehalf of the ineligible farmers. The main functions of the CAD would be:
(a) formulation of a plan, program or scheme for maximizingagricultural production in the concerned command area;
(b) implementation of such a plan, program or scheme as maybe necessary for the integrated development of the area;
(c) modernization, maintenance and efficient operation of theirrigation system up to the outlet of one cusec capacity;
(d) construction and development of field channels and drainswithin the command of each outlet;
(e) development and maintenance of the drainage system;
(f) land leveling on an outlet command basis for the typeof irrigated crop that is to be grown;
(g) fair distribution of water to individual fields;
(h) consolidation of holdings and redrawing of fieldboundaries on an outlet command basis;
(i) development of groundwater to supplement surfaceirrigation;
(j) selection and introduction of suitable croppingpattern;
114
ANNEX 3Page 8
(k) supply of all inputs and services including credit;
(1) development of marketing, processing facilities andcommunication;
(m) preparing individual programs of action for small andmarginal farmers and agricultural laborers;
(n) diversification of agriculture and development ofactivities like animal husbandry, farm forestry,poultry; and
(o) soil conservation and afforestation where necessary.
26. In respect of these functions, CADA acts as the coordinatingagency. However, it has the power to direct, subject to broad guidelinesindicated by the Government, the manner in which programs relating toAgriculture, Cooperation and Animal Husbandry would be executed. It alsoexercises administrative control and in some cases, financial control overagencies responsible for implementation of on-farm development works.
27. The CADA would be provided with working capital initially from theGOO (through the Agriculture and Cooperation Department) to execute on-farmworks through the Agricultural Engineering Organization. The beneficiarieswhile applying for loans would authorize the commercial and cooperative banksto place the amount with the CAD for executing CAD works.
Chak Level Operating Committee
28. The operation and maintenance of field channels and drains wouldrest with the farmers. A Chak Level Operating Committee, consisting ofnominees from the cultivators, is established within one chak for this pur-pose.
Agricultural Engineering Organization (AEO)
29. The AEO is a unit established in the DAFP and headed by the JointDirector of Agriculture, Engineering. The unit is responsible for planning,design and execution of on-farm works. Two special Divisions would be estab-lished for the sole purposes of topographical survey, alignment of fieldchannels and drains, preparation of outlet-wise detailed estimates and super-vision of on-farm works carried out by small contractors (para 17). EachDivision is headed by an Executive Engineer who is assisted by four AssistantAgriculture Engineers and 16 Junior Agriculture Engineers.
30. The AEO would be suitable for implementing on-farm works since ithas staff with training in both agriculture and engineering. They also haveexperiences from planning, design and supervision of on-farm works in thepilot projects (para 3). Surveys of on-farm works would be carried out duringthe non-construction season.
115
ANNEX 3Page 9
Land Consolidation Process
31. The process of land consoLidation would be conducted through variousstages, such as
(a) cadastral survey, topographical survey, preparationof maps and layout of irrLgation, drainage and roadsystems;
(b) determination of land rights, valuation of differentland classes, and settlement of rent and cess wherevernecessary;
(c) preparation of a new plan for the village, includingallocation of lands for communal purposes (such asfield channels and drains, access roads and otherpublic uses);
(d) reallocation of lands in compact holdings to each landowner; and
(e) preparation of land ownership records and maps basedon the new land allocations.
32. The consolidation process is a lengthy one since ample provision ismade for objections and appeals by the farmers concerned at each stage in theprocess. Completion of consolidation in a camp (para 34) will take about2 1/2 to 3 years.
33. Fragmentation of the consolidated plots is prevented under the pro-vision of the Act. Transfer of land ownership is allowed for holdings largerthan 1 ac. Holdings less than 1 ac can only be sold to the adjoining farmer.
Consolidation Organization (Figure L)
34. The responsibility for consolidation works rests with the Consolida-tion Unit, established in the Revenue Department and headed by a Director ofConsolidation (DC). The basic operating unit for the scheme is a consolidationcamp (normally covering 1,500-2,500 ha of consolidable area), consisting of anAssistant Consolidation Officer (ACO), an amin (surveyor) and two consolidators.Each camp is responsible for cadastral surveys, field inquiries for determina-tion of valuation of land, preparation of land records and maps, carving outnew consolidated plots and alloting them to landowners. About 5 to 8 campsconstitute a circle (covering about 15,000 to 25,000 ha of consolidable area),headed by a Consolidation Officer (CO). He has supervision responsibility andthe power to resolve disputes concerning allotment of consolidated lands andthe determination of land value. About three circles constitute a range,headed by a Deputy Director, Consolidation (DDC), who also has jurisdiction
116
ANNEX 3Page 10
over the appeal made by landowners. The Director of Consolidation (DC) hasoverall administrative control and supervision responsibility. He also hasauthority to reverse decisions made by the DDC. The Consolidation Commissioner(CC), who is responsible for the formulation of the program, has final juris-diction over the appeals made by farmers against the decision of lower con-solidation authorities. The budgetary provision for consolidation workswould come from the Revenue Department. The Act provides for cost recoverynot more than Rs 25 ha from the owners of consolidated units.
Consolidation Committee (CC)
35. A special feature of the scheme is the involvement of the villagecommunity in all stages of operation. A CC, comprised of at least one land-less agricultural laborer, one representative of each category of landownersand one person from the Scheduled Castes/Tribes, is constituted under thestatute for this purpose in the area covered by a camp. The CC would advisethe consolidation officers on matters such as determination of value of landand structures as well as on the allotment of consolidated holdings.
Financing On-Farm Works
36. On-farm works in the consolidated area would be voluntary as landwould be already acquired for this purpose within one chak (outlet) under theConsolidation Scheme. The costs would be apportioned among the beneficiariesaccording to the extent of holdings owned by them.
37. Financing of CAD works would be available to all farmers from theLand Development Banks (LDBs) and Commercial Banks (CBs). It is roughlyestimated that 80% of the loan requirements would be made by the LDBs and CBs.Long-term loans secured by mortgages on the land scheduled for development,would be provided for a maximum 15 years at a minimum interest rate of about10.5% with a grace period of two years. Farmers who are ineligible to applyfor loans due to defective land titles or because of overdues on debts tolocal authorities, cooperative or commercial financing institutions wouldbe provided with unsecured special loans (para 38) at 14% for 12 years withthe same grace period. However, in the consolidated area, land titles wouldbe cleared in the course of land consolidation. Consequently, the financingproblems for ineligible farmers would be minimal.
38. Secured LDB and CB loans would be refinanced at a rate of 90% bythe Agricultural Refinance Development Corporation (ARDC). The financialpositions of the LDBs and CBs have improved over the years. In 1975-76, theaverage recovery rate was about 60%-70%. Unsecured loans would be fullyrefinanced by the CAD Special Loans Fund administered by ARDC. Financialresponsibility for these Special Loans Fund would be shared by GOI, GOO and
117
ANNEX 3Page 11
ARDC. The conditions of the fund would be negotiated between ARDC, GOI andGOO. The main features of the fund would be as follows:
(a) The Fund would be utilized for financing the expenditurein connection with on-farm development in respect ofineligible farmers (farmers who are not able to getfunds from banks for on-farm development for one reasonor the other);
(b) The requirements of finances for on-farm development worksin respect of ineligible farmers would be estimated at thecommencement of every financial year and would be contri-buted in two stages; 50% of the estimated requirements willbe contributed in advance by the three agencies, namely,GOI, GOO and ARDC in the proportions of 50%, 25% and 25%,respectively, the remaining 50% will be contributed by allthe three agencies in the same proportion as soon as 80% ofthe contributions made in advance are fully utilized;
(c) The Fund would be maintained by the ARDC;
(d) The Fund would be administered by a committee consistingof the representatives of GOI, ARDC and GOO;
(e) The accounts of the Fund would be maintained by ARDC;
(f) The Fund would be a revolving fund and all recoveriesin respect of lending out of this Fund shall be creditedto the Fund;
(g) The GOO shall not withdraw their contributions from theFund until all command area projects in the State arecompleted and until the loans from uneligible farmersare fully repaid;
(h) The contribution from GOI shall not be withdrawn so longas contributions from ARDC are withdrawn; and
(i) The GOO would guarantee the loans given by the Fund.
Operation and Maintenance of On-Farm Works
39. A warabundi (rotational) system of irrigation would be followed toreduce seepage losses and to improve operation. Under rotational irrigation,the full flow from the one cusec outlet would be delivered to one farm ditchor one cultivator at time fixed intervals, with the remainder of the farmdelivery system remaining unused. This would largely concentrate seepage inthe upstream section of the field channels, which would be lined (para 13).
118
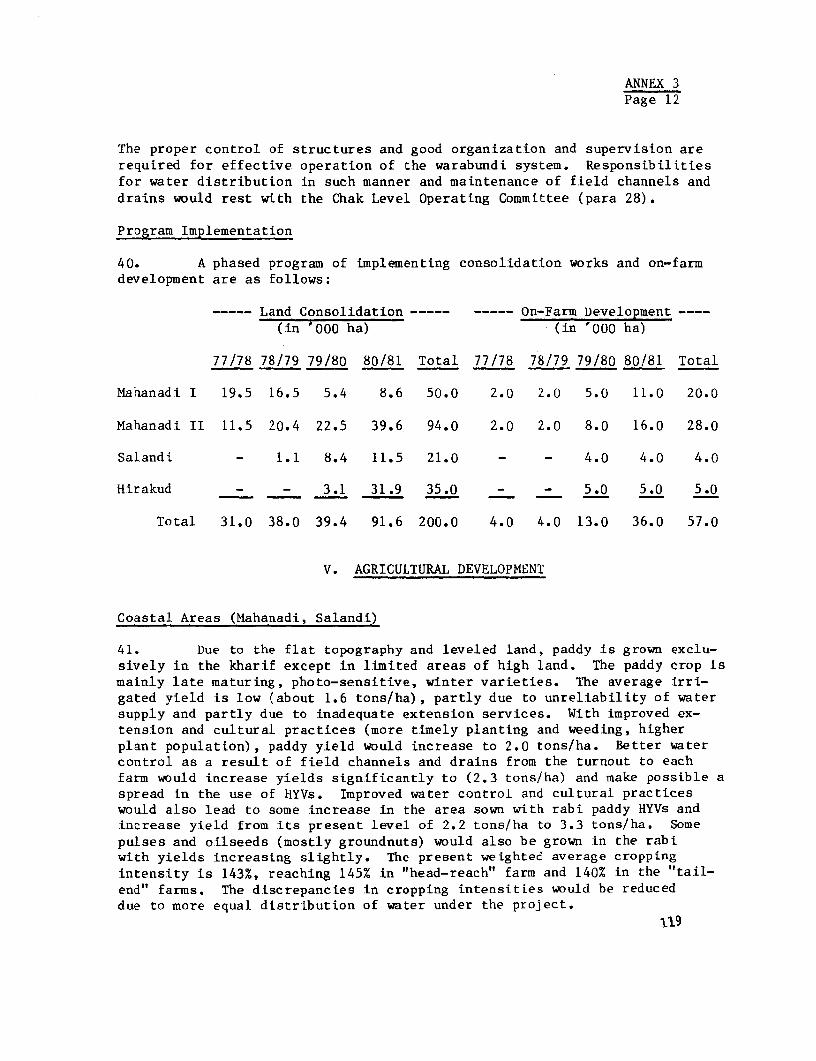
ANNEX 3Page 12
The proper control of structures and good organization and supervision arerequired for effective operation of the warabundi system. Responsibilitiesfor water distribution in such manner and maintenance of field channels anddrains would rest with the Chak Level Operating Committee (para 28).
Program Implementation
40. A phased program of implementing consolidation works and on-farmdevelopment are as follows:
----- Land Consolidation ----- On-Farm Development ----(in '000 ha) (in '000 ha)
77/78 78/79 79/80 80/81 Total 77/78 78/79 79/80 80/81 Total
Mahanadi I 19.5 16.5 5.4 8.6 50.0 2.0 2.0 5.0 11.0 20.0
Mahanadi II 11.5 20.4 22.5 39.6 94.0 2.0 2.0 8.0 16.0 28.0
Salandi - 1.1 8.4 11.5 21.0 - - 4.0 4.0 4.0
Hirakud - - 3.1 31.9 35.0 - - 5.0 5.0 5.0
Total 31.0 38.0 39.4 91.6 200.0 4.0 4.0 13.0 36.0 57.0
V. AGRICULTURAL DEVELOPMENT
Coastal Areas (Mahanadi, Salandi)
41. Due to the flat topography and leveled land, paddy is grown exclu-sively in the kharif except in limited areas of high land. The paddy crop ismainly late maturing, photo-sensitive, winter varieties. The average irri-gated yield is low (about 1.6 tons/ha), partly due to unreliability of watersupply and partly due to inadequate extension services. With improved ex-tension and cultural practices (more timely planting and weeding, higherplant population), paddy yield would increase to 2.0 tons/ha. Better watercontrol as a result of field channels and drains from the turnout to eachfarm would increase yields significantly to (2.3 tons/ha) and make possible aspread in the use of HYVs. Improved water control and cultural practiceswould also lead to some increase in the area sown with rabi paddy HYVs andincrease yield from its present level of 2.2 tons/ha to 3.3 tons/ha. Somepulses and oilseeds (mostly groundnuts) would also be grown in the rabiwith yields increasing slightly. The present weighted average croppingintensity is 143%, reaching 145% in "head-reach" farm and 140% in the "tail-end" farms. The discrepancies in cropping intensities would be reduceddue to more equal distribution of water under the project.
119
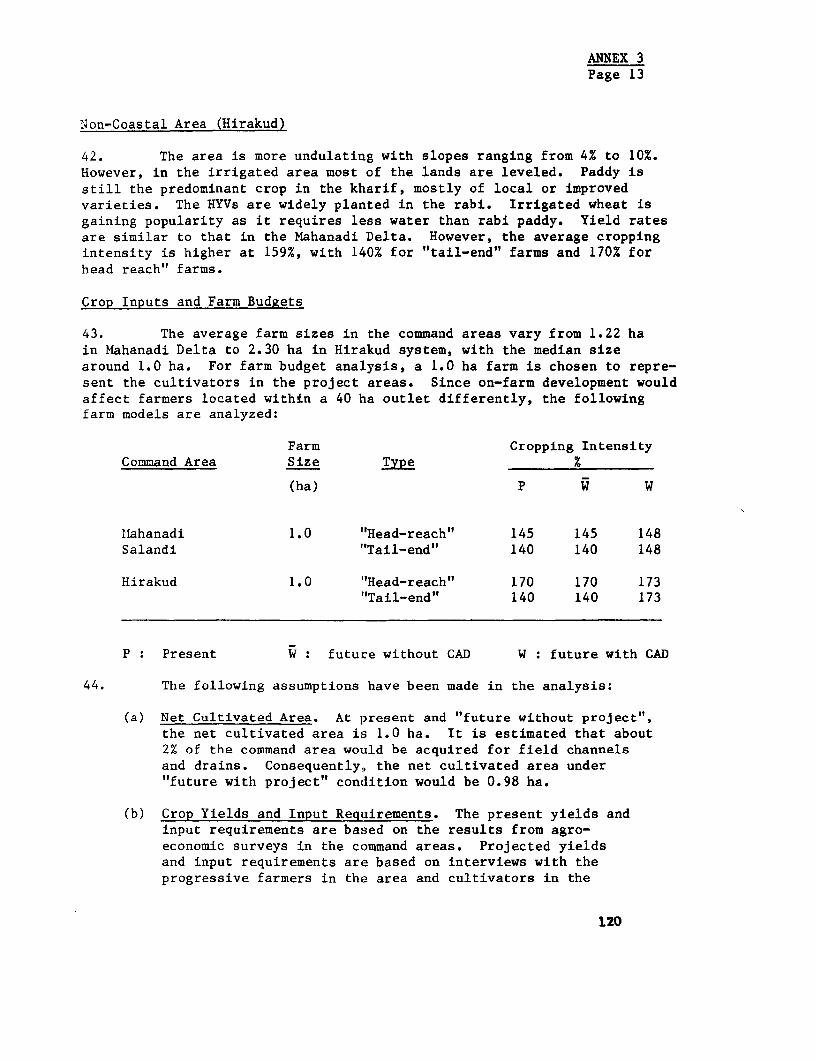
ANNEX 3Page 13
"ion-Coastal Area (Hirakud)
42. The area is more undulating with slopes ranging from 4% to 10%.However, in the irrigated area most of the lands are leveled. Paddy isstill the predominant crop in the kharif, mostly of local or improvedvarieties. The HYVs are widely planted in the rabi. Irrigated wheat isgaining popularity as it requires less water than rabi paddy. Yield ratesare similar to that in the Mahanadi Delta. However, the average croppingintensity is higher at 159%, with 140% for "tail-end" farms and 170% forhead reach" farms.
Crop Inputs and Farm Budgets
43. The average farm sizes in the command areas vary from 1.22 hain Mahanadi Delta to 2.30 ha in Hirakud system, with the median sizearound 1.0 ha. For farm budget analysis, a 1.0 ha farm is chosen to repre-sent the cultivators in the project areas. Since on-farm development wouldaffect farmers located within a 40 ha outlet differently, the followingfarm models are analyzed:
Farm Cropping IntensityCommand Area Size Type %
(ha) P W W
Qfahanadi 1.0 "Head-reach" 145 145 148Salandi "Tail-end" 140 140 148
Hirakud 1.0 "Head-reach" 170 170 173"Tail-end" 140 140 173
P : Present W : future without CAD W : future with CAD
44. The following assumptions have been made in the analysis:
(a) Net Cultivated Area. At present and "future without project",the net cultivated area is 1.0 ha. It is estimated that about2% of the command area would be acquired for field channelsand drains. Consequently, the net cultivated area under"future with project" condition would be 0.98 ha.
(b) Crop Yields and Input Requirements. The present yields andinput requirements are based on the results from agro-economic surveys in the command areas. Projected yieldsand input requirements are based on interviews with theprogressive farmers in the area and cultivators in the
120
ANNEX 3Page 14
pilot projects on water management. Detailed descrip-tions are presented in Annex 2, Table 2. Projectedfuture yields are partly based on improved extensionand cultural practices resulting from Orissa Agricul-tural Development Project.
(c) Hired Labor. Based on the results from the agro-economicsurveys, it is assumed that "head-reach" farmers wouldhire about 58% of annual labor requirements and tailend farmers about 44%. Under project condition, sinceyields would be similar for both types of farms due tobetter water control, the proportion of hired laborwould be the same. Because of increased yields, it isassumed that about 60% of labor requirements would behired.
(d) Cropping Pattern. Results from the agro-economic surveyindicate that the discrepancies between "head-reach" and"tail-end" farms are less in the M4ahanadi and Salandicommand areas than in the Hirakud system. This may bedue to more un'leveled lands in the latter. Consequently,the benefits of on-farm development would be more forfarmers in Hirakud than in Mlahanadi and Salandi areas.Furthermore, since the "tail-end" farmers would then beassured of more timely supply and no longer suffer fromwater logging, their irrigated areas and yields wouldrise more substantially than those of "head reach"farmers.
(e) Land Revenue Taxes. A weighted average of Rs 20 per hafor different types of land is included as land revenuetaxes in the farm budgets.
(f) Irrigation Charges: The prevailing water charges, whichvary depending on crops, are assumed for future situa-tions. A detailed list of water rates is presented inAnnex 2, Table 6.
(g) Loan Repayment: The investment costs for CAD works(excluding consolidation costs) are estimated at Rs 600per ha (in July 1977 price level). At an interest rateof 11% for 12 years, the annual payment for the loanwould be Rs 180 ha. These costs have been included inthe analysis. Since the CAD loan and its terms arefixed in constant terms (i.e. at 1977 price level),the repayment would decline in real terms. Conse-quently, the farm budgets would give an exaggeratedpicture of relative income change (i.e. from presentand "future without" to "future with").
Present and projected farm incomes are presented in Table 2.121
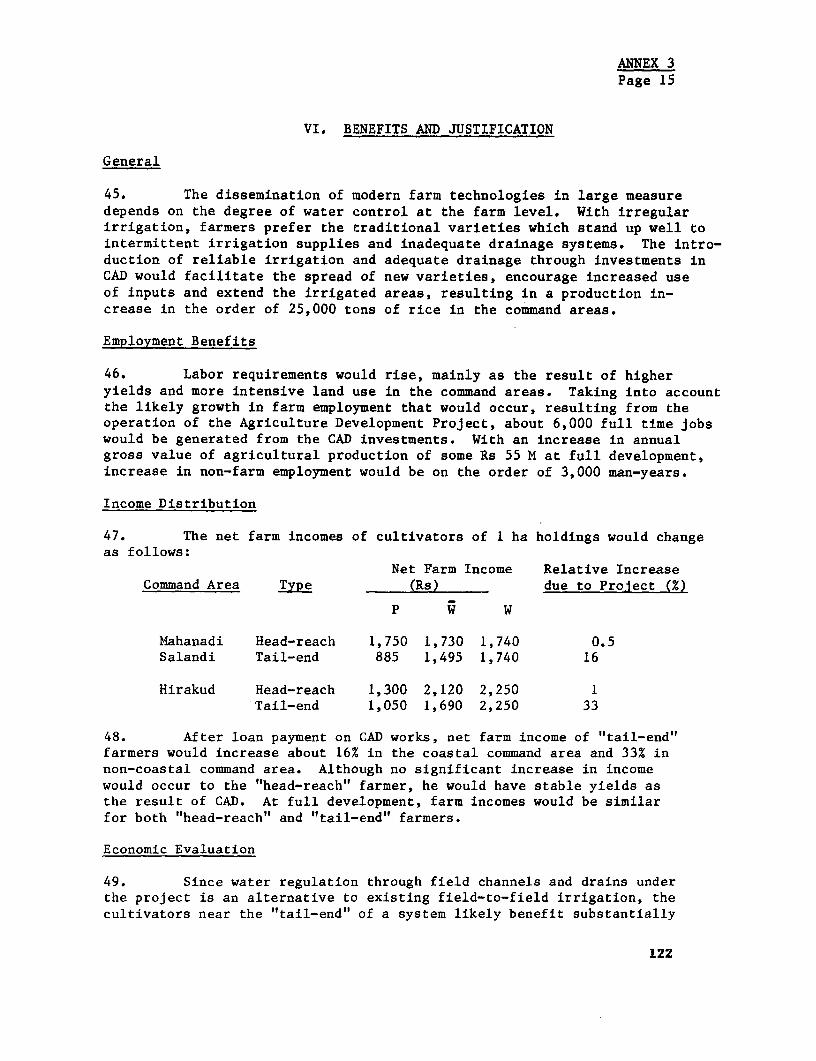
ANNEX 3Page 15
VI. BENEFITS AND JUSTIFICATION
General
45. The dissemination of modern farm technologies in large measuredepends on the degree of water control at the farm level. With irregularirrigation, farmers prefer the traditional varieties which stand up well tointermittent irrigation supplies and inadequate drainage systems. The intro-duction of reliable irrigation and adequate drainage through investments inCAD would facilitate the spread of new varieties, encourage increased useof inputs and extend the irrigated areas, resulting in a production in-crease in the order of 25,000 tons of rice in the command areas.
Employment Benefits
46. Labor requirements would rise, mainly as the result of higheryields and more intensive land use in the command areas. Taking into accountthe likely growth in farm employment that would occur, resulting from theoperation of the Agriculture Development Project, about 6,000 full time jobswould be generated from the CAD investments. With an increase in annualgross value of agricultural production of some Rs 55 M at full development,increase in non-farm employment would be on the order of 3,000 man-years.
Income Distribution
47. The net farm incomes of cultivators of 1 ha holdings would changeas follows:
Net Farm Income Relative IncreaseCommand Area Type (Rs) due to Project (%)
P W
Mahanadi Head-reach 1,750 1,730 1,740 0.5Salandi Tail-end 885 1,495 1,740 16
Hirakud Head-reach 1,300 2,120 2,250 1Tail-end 1,050 1,690 2,250 33
48. After loan payment on CAD works, net farm income of "tail-end"farmers would increase about 16% in the coastal command area and 33% innon-coastal command area. Although no significant increase in incomewould occur to the "head-reach" farmer, he would have stable yields asthe result of CAD. At full development, farm incomes would be similarfor both "head-reach" and "tail-end" farmers.
Economic Evaluation
49. Since water regulation through field channels and drains underthe project is an alternative to existing field-to-field irrigation, thecultivators near the "tail-end" of a system likely benefit substantially
122
ANNEX 3Page 16
from CAD works while those nearest the outlet would benefit less from watersavings generated from better water control. Based on the agro-economicsurveys of the command areas, it is assumed that about 65% of the area would beclassified as "head and middle reach" and the remainder as "tail-end". Theeconomic evaluation of CAD is based on the following assumptions:
(a) Prices. The economic prices of agricultural outputs andinputs are discussed in Annex 5.
(b) Net Benefits. The net benefits per ha are the weightedaverage of benefits accruing to the two types of farms.Since land leveling would be minimal, soil fertilitywould not be affected. The following pattern of build-up is assumed:
Year 0 1 2 3 4 5 6-10
Benefits % 0 40 65 85 95 100 100
(c) Investment Costs. Since many of the steps involved inland consolidation (i.e. topographic surveys, clearingof land records, border realignment) are needed for theplanning and design of CAD works, the cost of the landconsolidation program (estimated at Rs 200/ha) consti-tutes a part of the investment costs of the CAD. Theeconomic cost for land consolidation is derived byadjusting the financial cost to the SCF of 0.75. Thecost of on-farm works is estimated at Rs 600 per ha.The construction conversion factor 0.70 is applied tofinancial costs.
50. A summary of costs and benefits of CAD works is described in Table3. The economic rates of return would be 34% and 35% for Mahanadi, Salandicommand area and Hirakud system, respectively.
Risk and Uncertainty
51. Given the estimated high rate of return and the experiences gainedfrom the pilot operations in Puri and Sambalpur districts, the investment riskassociated with the CAD is small.
August 1977
L'z'5
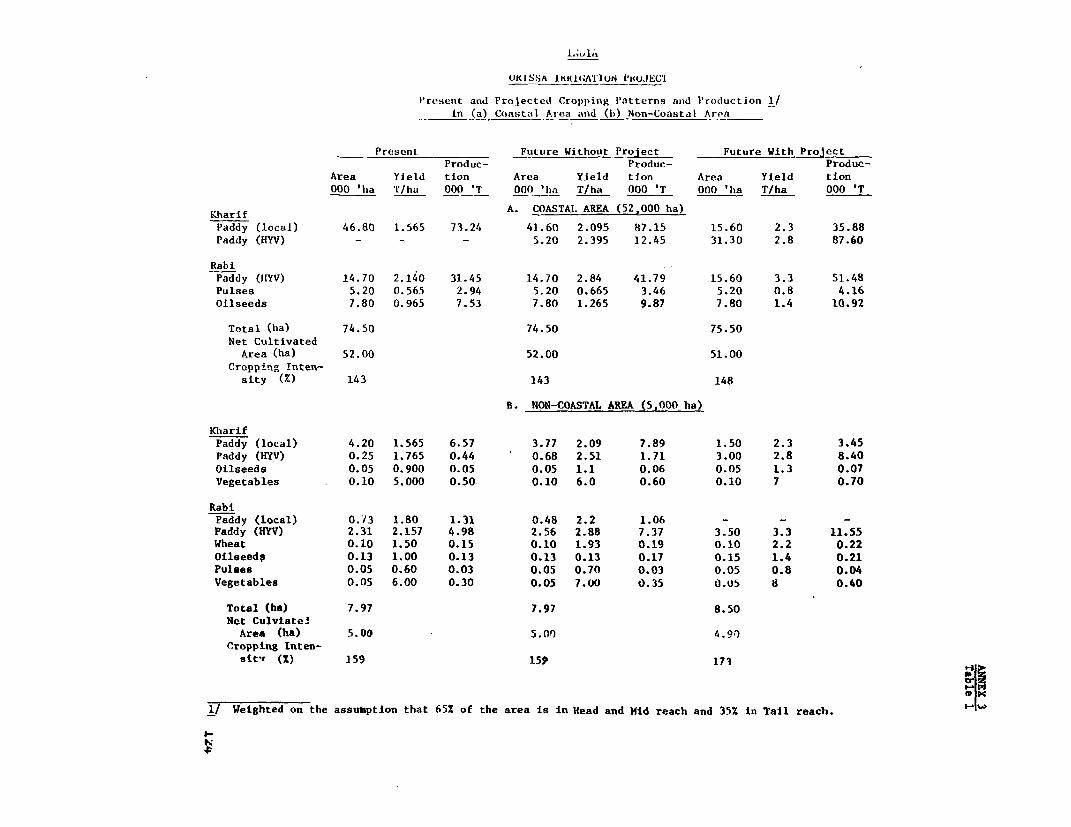
(OKISSA iKI (GATIUN PI1UJEECI
P'resent and Projected Cropping Patterns aud Pro(luction 1/
in (a) Coastal Area and (b) Non-Coastal Area
Present Future Without Project Future With Proiect
Produc- Produc- Produc-
Area Yield tion Area Yield tion Area Yield tion
000 'ha T/ha 000 'T 000 'Ia T/ha 000 'T 000 'ha T/ha 000 'T
Kharif A. COASTAI. AREA (52,000 ha)
Paddy (local) 46.80 1.565 73.24 41.60 2.095 87.15 15.60 2.3 35.88
Paddy (HYV) - - - 5.20 2.395 12.45 31.30 2.8 87.60
RabiPaddy (IIYV) 14.70 2.140 31.45 14.70 2.84 41.79 15.60 3.3 51.48
Pulses 5.20 0.565 2.94 5.20 0.665 3.46 5.20 0.8 4.16
Oilseeds 7.80 0.965 7.53 7.80 1.265 9.87 7.80 1.4 10.92
Total (ha) 74.50 74.50 75.50
Net CultivatedArea (ha) 52.00 52.00 51.00
Cropping Inten-sity (Z) 143 143 148
B. NON-COASTAL AREA (5,000 ha)
KharifPaddy (local) 4.20 1.565 6.57 3.77 2.09 7.89 1.50 2.3 3.45
Paddy (HYV) 0.25 1.765 0.44 0.68 2.51 1.71 3.00 2.8 8.40
Oilseeds 0.05 0.900 0.05 0.05 1.1 0.06 0.05 1.3 0.07
Vegetables 0.10 5.000 0.50. 0.10 6.0 0.60 0.10 7 0.70
RabiPaddy (local) 0.l3 1.80 1.31 0.48 2.2 1.06 - - -
Paddy (HYV) 2.31 2.157 4.98 2.56 2.88 7.37 3.50 3.3 11.55
Wheat 0.10 1.50 0.15 0.10 1.93 0.19 0.10 2.2 0.22
Oilseeds 0.13 1.00 0.13 0.13 0.13 0.17 0.15 1.4 0.21
Pulses 0.05 0.60 0.03 0.05 0.70 0.03 0.05 0.8 0.04
Vegetables 0.05 6.00 0.30 0.05 7.00 0.35 0.05 8 0.40
Total (ha) 7.97 7.97 8.50
Not Culviate'Area (ha) 5.00 5.00) 4.90)
Cropping Inten-sitv (%) 159 15P 173
1/Weighted on the assumption that 65% of the area is in Head and Mid reach and 35% in Tail reach. '
I-~~~~~~~~~~~~~~~~~~~~~~~~~~~~~~~I
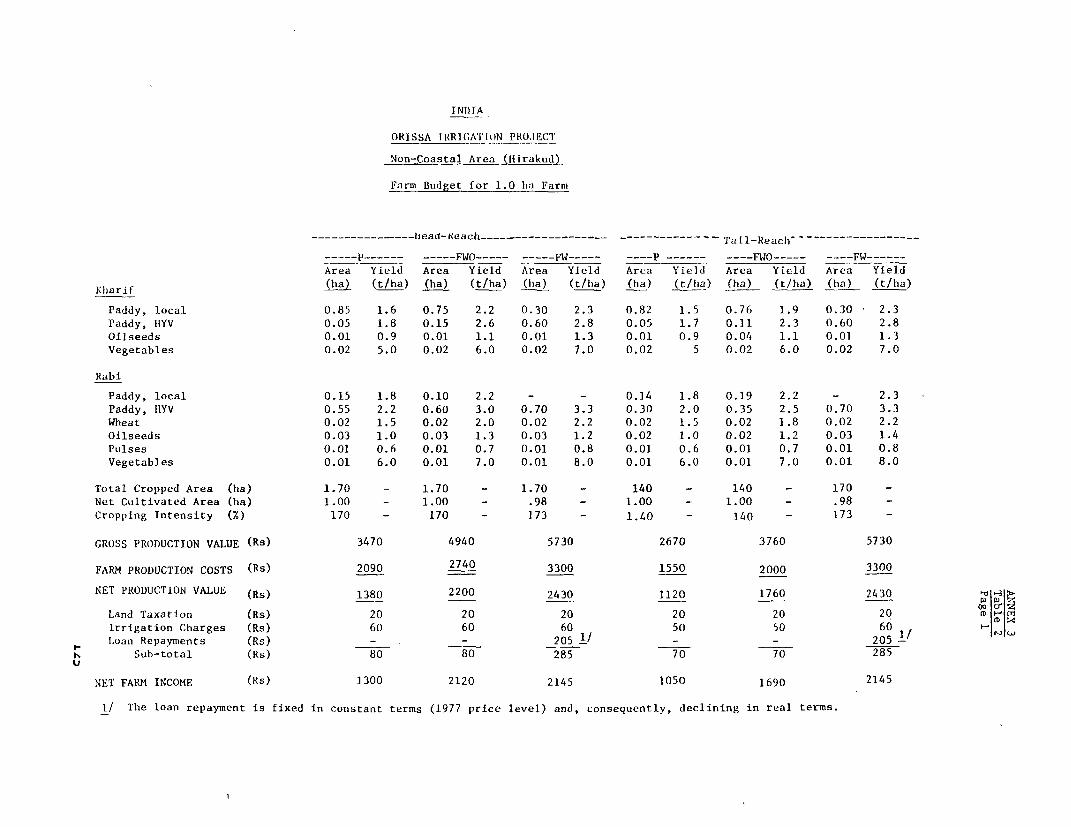
INDTIA
ORISSA IRRICA'T[ON PROJECT
Non-Coastal Area (Ilirakud)
Farm Budget for 1.0 l1a Farm
----------------kiead-Keach…------ -------------- Tail-Reacli -------------
-----P----- -----FWO----- ----- W----- P ------ ----FWO----- ---- rw------Area Yield Area Yield Area Yield Area Yield Area Yield Area Yield
RKlarif (ha) (t/ha) (ha) (t/ha) (11a) (t/ha) (ha) (t/ha) (ha) (t/ha) (ha) (t/ha)
Paddy, local 0.85 1.6 0.75 2.2 0.30 2.3 0.82 1.5 0.76 1.9 0.30 2.3
Paddy, IIYV 0.05 1.8 0.15 2.6 0.60 2.8 0.05 1.7 0.11 2.3 0.60 2.8
Oilseeds 0.01 0.9 0.01 1.1 0.01 1.3 0.01 0.9 0.04 1.1 0.01 1.3
Vegetables 0.02 5.0 0.02 6.0 0.02 7.0 0.02 5 0.02 6.0 0.02 7.0
Rabi
Paddy, local 0.15 1.8 0.10 2.2 - - 0.14 1.8 0.19 2.2 - 2.3
Paddy, HYV 0.55 2.2 0.60 3.0 0.70 3.3 0.30 2.0 0.35 2.5 0.70 3.3
Wheat 0.02 1.5 0.02 2.0 0.02 2.2 0.02 1.5 0.02 1.8 0.02 2.2
Oilseeds 0.03 1.0 0.03 1.3 0.03 1.2 0.02 1.0 0.02 1.2 0.03 1.4
Pulses 0.01 0.6 0.01 0.7 0.01 0.8 0.01 0.6 0.01 0.7 0.01 0.8
Vegetables 0.01 6.0 0.01 7.0 0.01 8.0 0.01 6.0 0.01 7.0 0.01 8.0
Total Cropped Area (ha) 1.70 - 1.70 - 1.70 - 140 - 140 - 170 -
Net Cultivated Area (ha) 1.00 - 1.00 - .98 - 1.00 - 1.00 - .98 -
Cropping Intensity (%) 170 - 170 - 173 - 1.40 - 140 - 173 -
GROSS PRODUCTION VALUE (Rs) 3470 4940 5730 2670 3760 5730
FARM PRODUCTION COSTS (Rs) 2090 2740 3300 1550 2000 3300
NET PRODUCTION VALUE (Rs) 1380 2200 2430 1120 1760 2430 11
Land Taxation (Rs) 20 20 20 20 20 20 m F _
Irrigation Charges (Rs) 60 60 60 50 50 60 1 X
Loan Repaynments (Rs) -_ . - 205_1/ - - 205
Sub-total (Rs) 80 80 285 70 70 285u
NET FARM INCOME (Rs) 1300 2120 2145 1050 1690 2145
1/ The loan repayment is fixed in constant terms (1977 price level) and, consequently, declining in real terms.
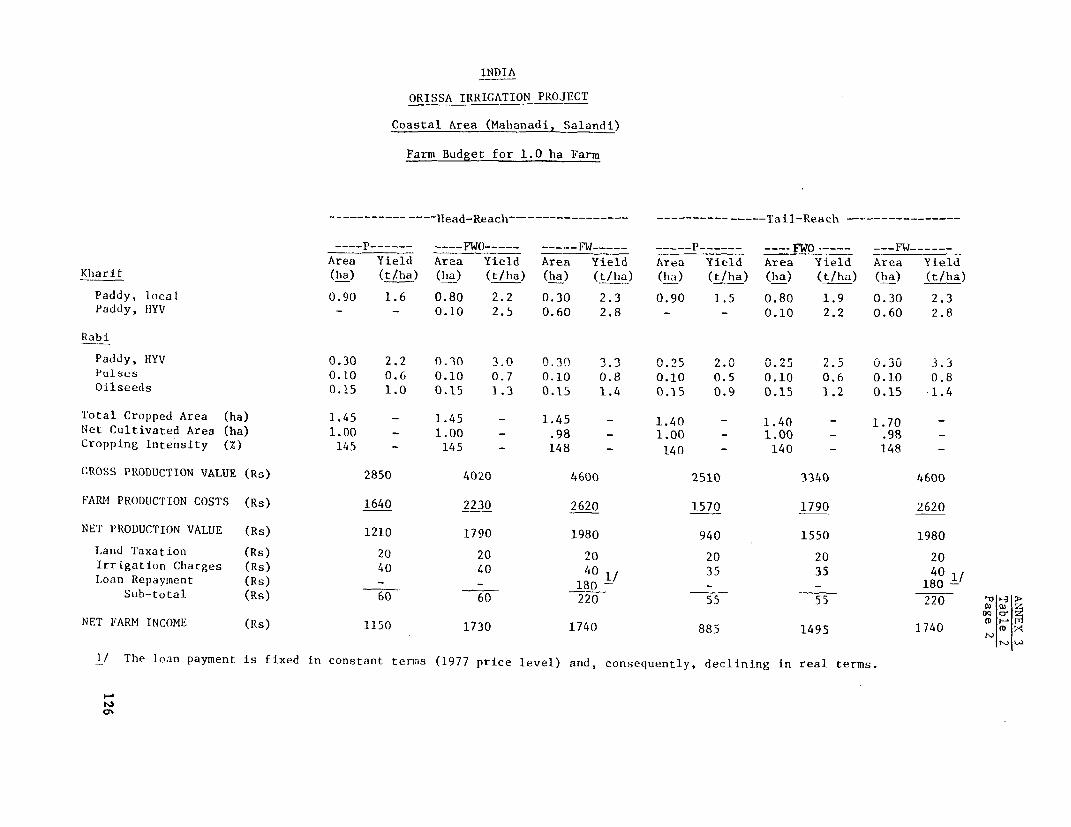
INDIA
ORISSA IRRIGATION PROJECT
Coastal Area (Mahanadi, Salandi)
Farm Budget for 1.0 ha Farm
------------- llead-Reaclh…--------------- ---------------Tail-Reach ---------------
-P------ ----FWO-____ ----- PW…----- -- FWo- - --- ___F------Area Yield Area Yield Area Yield Area Yield Area Yield Area Yield
Kharif (lha) (t/ha) (ha) Ct/ha) (ha) (t/ha) (ha) Ct/ha) (lha) (t/ha) (ha) (t/ha)
Paddy, local 0.90 1.6 0.80 2.2 0.30 2.3 0.90 1.5 0.80 1.9 0.30 2.3Paddy, IIYV - - 0.10 2.5 0.60 2.8 - - 0.10 2.2 0.60 2.8
Rabi
Paddy, HYV 0.30 2.2 0.30 3=0 0.30 3.3 0.25 2.5 0.30 3.3Pulses 0.10 0.6 0.10 0.7 0.10 0.8 0.10 0.5 0.10 0.6 0.10 0.8Oilseeds 0.15 1.0 0.15 1.3 0.15 1.4 0.15 0.9 0.15 1.2 0.15 1.4
Total Cropped Area (ha) 1.45 - 1.45 - 1.45 - 1.40 - 1.40 - 1.70 -
Net Cultivated Area (ha) 1.00 - 1.00 - .98 - 1.00 - 1.00 - .98 -
Cropping Intensity (%) 145 - 145 - 148 - 140 - 140 - 148 -
CROSS PRODUCTION VALUE (Rs) 2850 4020 4600 2510 3340 4600
FARM PRODUCTION COSTS (Rs) 1640 2230 2620 1570 1790 2620
NET PRODUCTION VALUE (Rs) 1210 1790 1980 940 1550 1980
Land Taxation (Rs) 20 20 20 20 20 20Irrigation Charges (Rs) 40 40 40 35 35 40Loan Repayinent - l~~~~~~~~~~/ l/I.oan Repayment (Rs) - 180- - - 180-
Sub-total (Rs) 60 60 220 55 55 220
NET FARM INCOME (Rs) 1150 1730 1740 885 1495 1740 w
1/ The loan payment is fixed in constant terms (1977 price level) and, consequently, declining in real terms.
0'
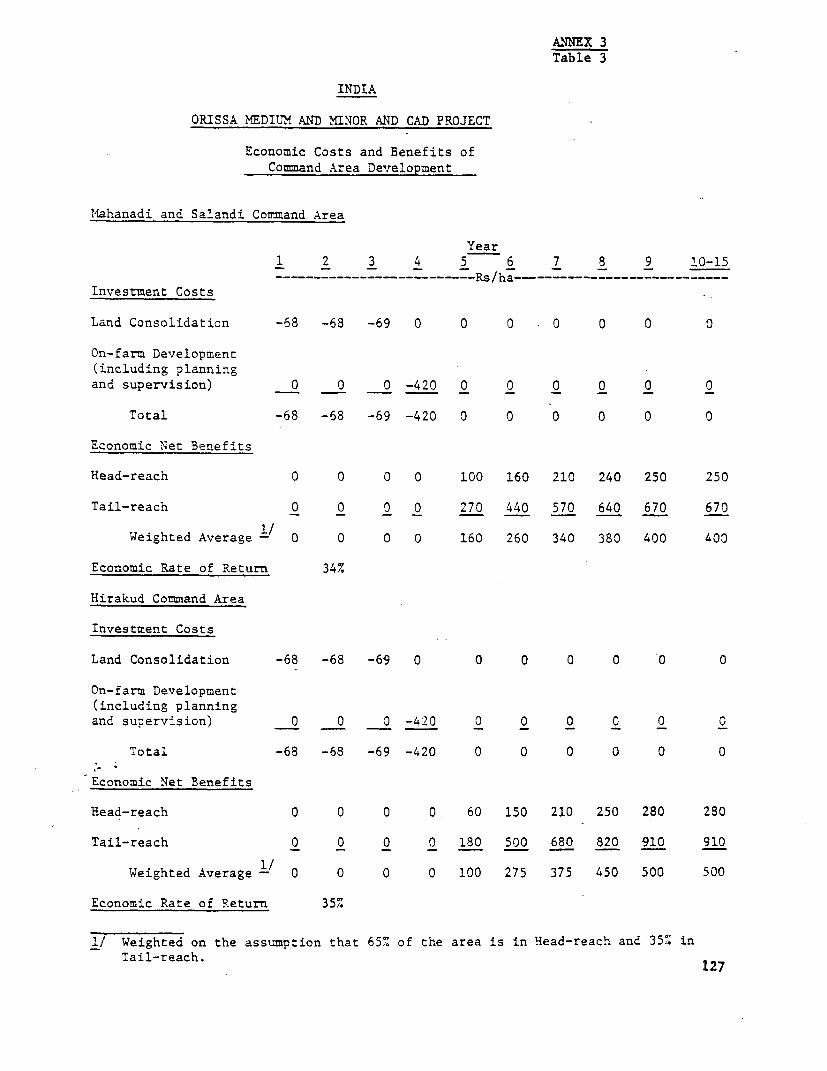
ANIEX 3Table 3
INDIA
ORISSA MEDIUM AND MINOR AND CAD PROJECT
Economic Costs and Benefits ofCommand Area Development
M.ahanadi and Salandi Command Area
Year1 2 3 4 5 6 7 8 9 20-15
…_____________ ---------… Rs/ha--…--------- …- ----
Investment Costs
Land Consolidation -68 -68 -69 0 0 0 0 0 0 0
On-farm Development(including planningand supervision) 0 0 0 -420 0 0 0 0 0 0
Total -68 -68 -69 -420 0 0 0 0 0 0
Economic Net Benefits
Head-reach 0 0 0 0 100 160 210 240 250 250
Tail-reach 0 0 0 0 270 440 570 640 670 670
Weighted Average -/ 0 0 0 0 160 260 340 380 400 400
Economic Rate of Return 34%
Hirakud Command Area
Investment Costs
Land Consolidation -68 -68 -69 0 0 0 0 0 0 0
On-farm Development(including planningand supervision) 0 0 0 -420 0 0 0 C 0 0
Total -68 -68 -69 -420 0 0 0 0 0 0
Economic Net Benefits
Head-reach 0 0 0 0. 60 150 210 250 280 280
Tail-reach 0 0 0 0 180 500 680 820 910 910
Weighted Average -/ 0 0 0 0 100 275 375 450 500 500
Economic Rate of Return 35%
1/ Weighted on the assumption that 65% of the area is in Hqead-reach and 35%. in
Tail-reach. 127
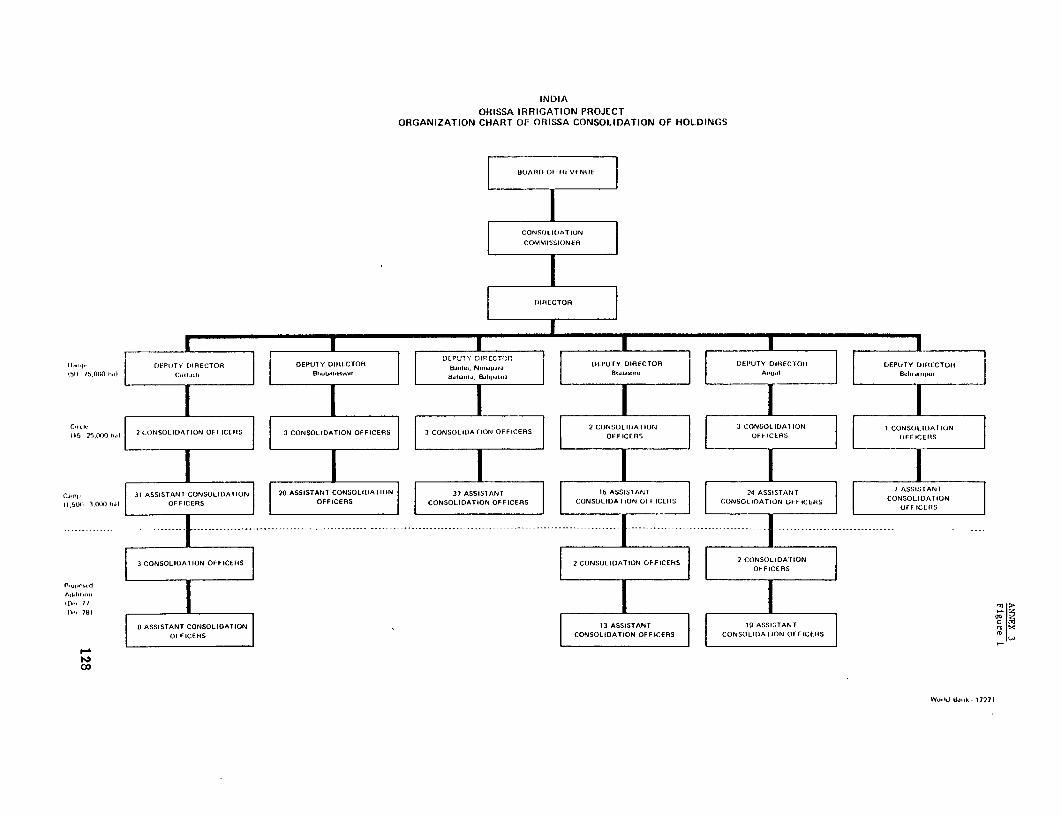
INDIAORISSA IRRIGATION PROJECT
ORGANIZATION CHART OF ORISSA CONSOLIDATION OF HOLDINGS
HOARD Of IHfVENIIE
CONSO)ItIATION
COMMISSIONER
DIFiECTOR
R.Itql. DIIPFITY DIRECTOR DEPUTY DIRECTOH 8-11IpI Nin,ip,rI DEPUTY DIRECTOR DEPUTY DIIRECTOFR DEPUTY DIRECTOR
ISII 150(l 1 I. C;li.0eS BNOiIoAAii Bl .IrO | A-;-W BOd,ii'i
2 CONSOLDATIO 3 CONSOLIDATION I CONSOLIDATION115 25.0110 hd) 2 CONSOLIDATION OFFICERS 3 CONSOLIDATION OFFICERS 3 CONSOLIDATION OFFICERS OFFICERS UFOFIC RS OFFICEFIS
Csnlx 31 ASSISTANT ONSOLIDATION 20 ASSISTANT CONSOLIDATION 37 ASSISTANT I6 ASSISTANT S 24 ASSISTANT 7 ASSIT AN1
11.5131 3,000 hil OFFICERS OFFICERS CONSOLIDATION OFFICERS CONSOLIDATION OFFICERS CONSOLIDATION OFI-ICEFiS CONSOLIDATIONI OfF~~~~~~~~~~~~~~~~~~~~~~~~~~~~~DEICLR
-- --------- --- -- -- ------------- ---------- ---- - ------ -- -------------------I -- -- -- -- -- --- - --- ---- --- -- I - ---------------------------
3 CONSOLIDATION OFFICEFIS 2 CONSOLIDATION OFFICERS 2 CONSOLIDATFION01-F ICERS
I),. 781 21
F[)' ' 781 | 8 ASSISTANTC CNSOLIDATION | , 13 ASSISTANT 19 ASSISTANT | 5|
OFFICERIS| CONSOLIDATION OFF ICERS CONSOLIDATION OFFICERS rD
W0,1d 3-k- 17271
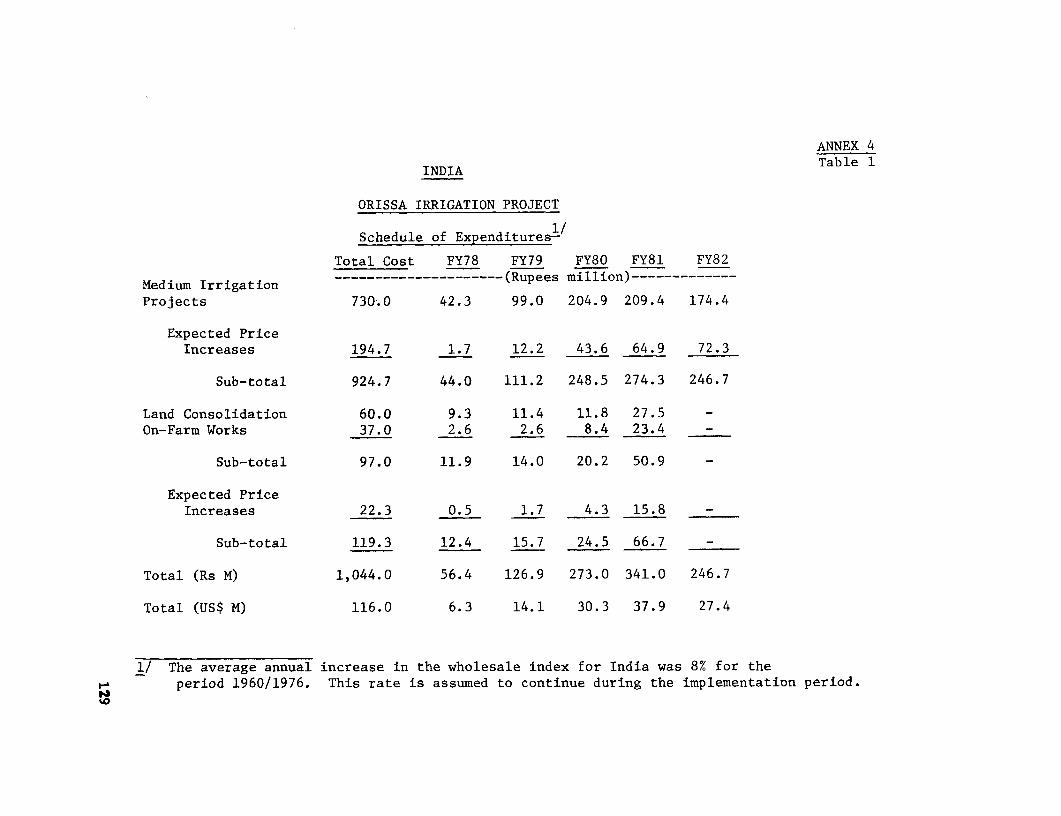
ANNEX 4
INDIA Table 1
ORISSA IRRIGATION PROJECT
Schedule of Expenditures-/
Total Cost FY78 FY79 FY80 FY81 FY82
MduIriain---------------(Rupees mi;lllion) -------------Medium Irrigation …(Rpemilo)Projects 730.0 42.3 99.0 204.9 209.4 174.4
Expected PriceIncreases 194.7 1.7 12.2 43.6 64.9 72.3
Sub-total 924.7 44.0 111.2 248.5 274.3 246.7
Land Consolidation 60.0 9.3 11.4 11.8 27.5 -On-Farm Works 37.0 2.6 2.6 8.4 23.4 -
Sub-total 97.0 11.9 14.0 20.2 50.9 -
Expected PriceIncreases 22.3 0.5 1.7 4.3 15.8 -
Sub-total 119.3 12.4 15.7 24.5 66.7 -
Total (Rs M) 1,044.0 56.4 126.9 273.0 341.0 246.7
Total (US$ M) 116.0 6.3 14.1 30.3 37.9 27.4
1/ The average annual increase in the wholesale index for India was 8% for theperiod 1960/1976. This rate is assumed to continue during the implementation period.
o0
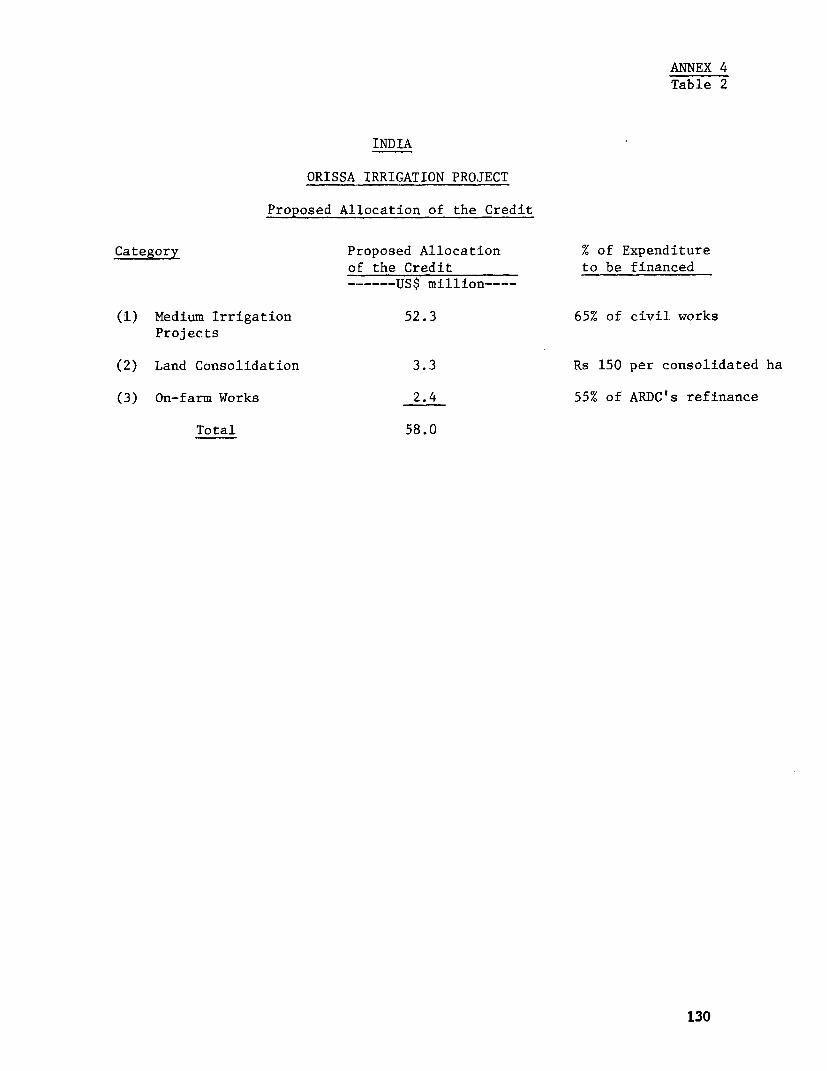
ANNEX 4Table 2
INDIA
ORISSA IRRIGATION PROJECT
Proposed Allocation of the Credit
Category Proposed Allocation % of Expenditureof the Credit to be financed------- US$ million----
(1) Medium Irrigation 52.3 65% of civil worksProjects
(2) Land Consolidation 3.3 Rs 150 per consolidated ha
(3) On-farm Works 2.4 55% of ARDC's refinance
Total 58.0
130
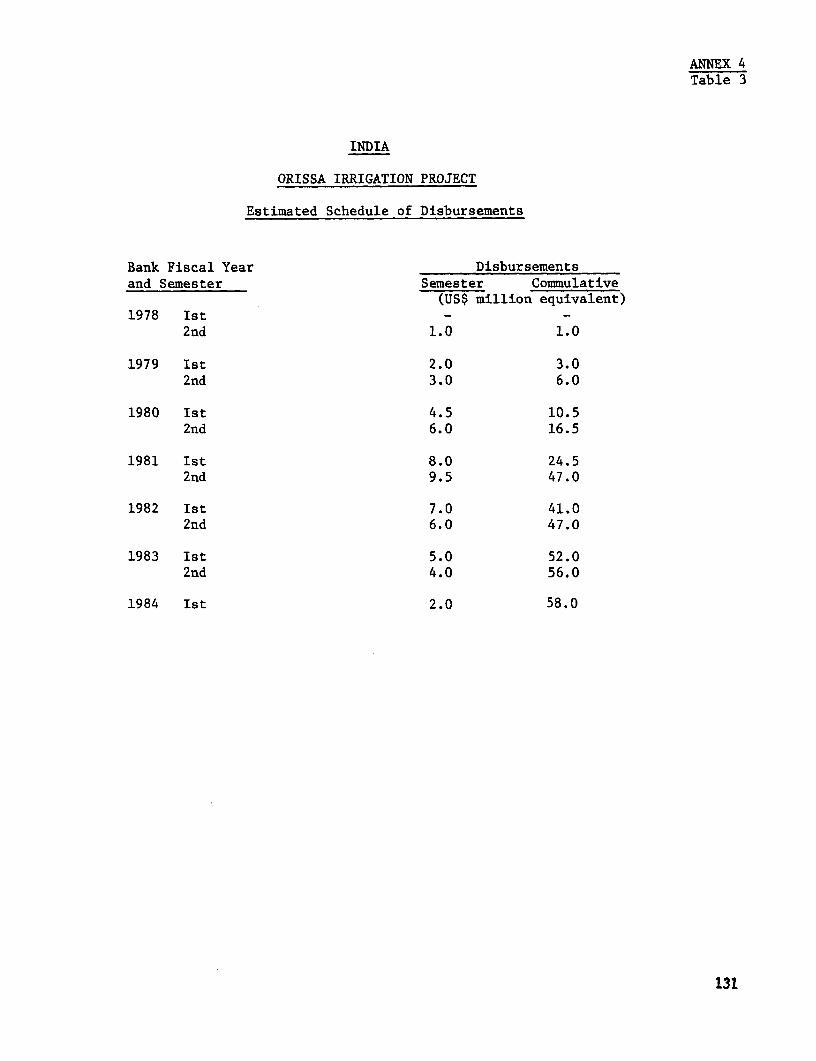
ANNEX 4Table 3
INDIA
ORISSA IRRIGATION PROJECT
Estimated Schedule of Disbursements
Bank Fiscal Year Disbursementsand Semester Semester Commulative
(US$ million equivalent)1978 Ist - -
2nd 1.0 1.0
1979 Ist 2.0 3.02nd 3.0 6.0
1980 Ist 4.5 10.52nd 6.0 16.5
1981 Ist 8.0 24.52nd 9.5 47.0
1982 Ist 7.0 41.02nd 6.0 47.0
1983 Ist 5.0 52.02nd 4.0 56.0
1984 Ist 2.0 58.0
131
ANNEX 5
INDIA
ORISSA IRRIGATION PROJECT
SUPPORT MATERIALS FOR ECONOMIC AND FINANCIAL ANALYSES
Table of Contents
Pare No.
I. PRICES FOR ECONOMIC AND FINANCIAL ANALYSIS ......... 1
General ................. .00..............0.00........ Official Exchange Rate (OER) ....... ................ 1Standard Conversion Factor (SCF) .... ............... 1Prices of Agricultural Outputs ..................... 1Prices of Agricultural. Inputs . ..................... 2Construction Conversion Factor ..................... 2
II. LABOR ANALYSIS ...*********.......... ............... 3
General ... o..... .... .... . o............................. 3Labor Supply .* ............................. ... 4Labor Demand ....................... o ......... o...... ...* 4Construction Labor .**.*..* ...................... 5
III. DEVELOPMENT OF BENEFIT MATRIX FOR MEDIUMIRRIGATION PROJECTS ... *......................... 6
General .........,6Basic Assumptions ... *0****... *........ ......... 0. 6
Benefit Factors .................... 8Adjustment to Benefit Factors ............................ 8
132
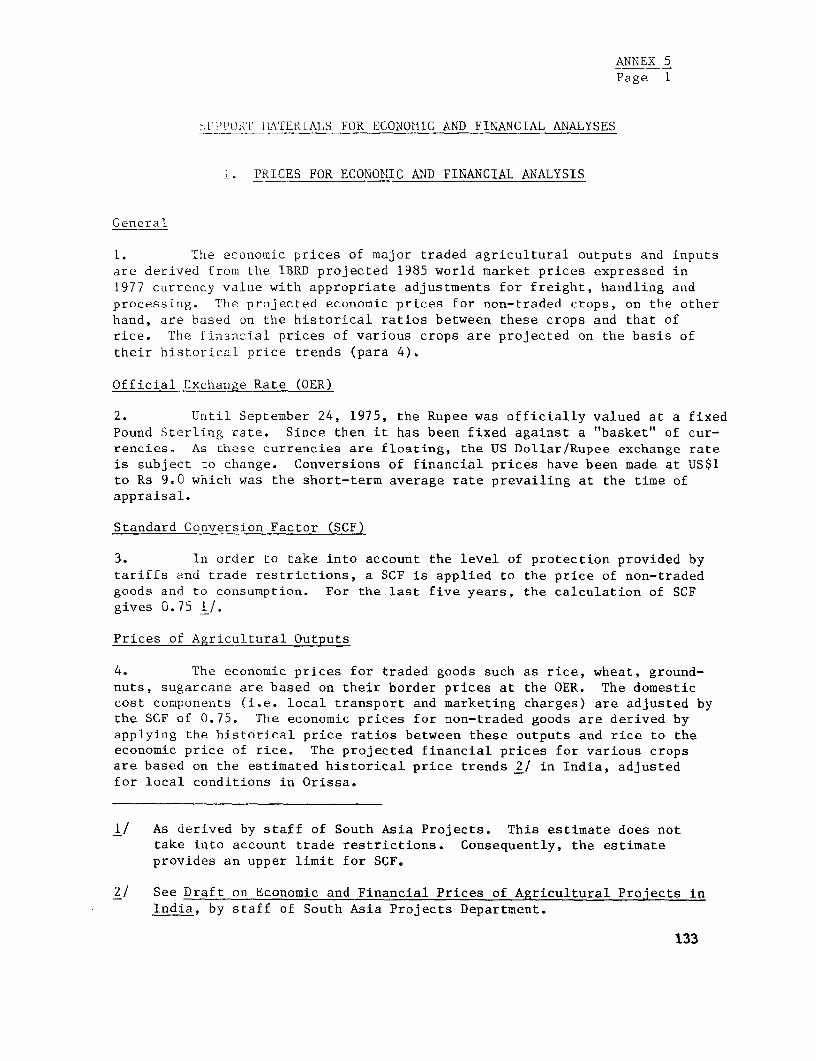
ANNEX 5Page 1
,AlPOQRT iLATERIALS FOR ECONOIIIC AND FINANCIAL ANALYSES
i. PRICES FOR ECONOMIC ANID FINANCIAL ANALYSIS
General
1. The economic prices of major traded agricultural outputs and inputsare derived from the IBRD projected 1985 world market prices expressed in1977 currency value with appropriate adjustments for freight, handling andprocessing. The projected economic prices for non-traded crops, on the otherhand, are based on the historical ratios between these crops and that ofrice. The financial prices of various crops are projected on the basis oftheir historical price trends (para 4).
Official Exchange Rate (OER)
2. Until September 24, 1975, the Rupee was officially valued at a fixedPound Sterling rate. Since then it has been fixed against a "basket" of cur-rencies. As chese currencies are floating, the US Dollar/Rupee exchange rateis subject to change. Conversions of financial prices have been made at US$1to Rs 9.0 which was the short-term average rate prevailing at the time ofappraisal.
Standard Conversion Factor (SCF)
3. In order to take into account the level of protection provided bytariffs and trade restrictions, a SCF is applied to the price of non-tradedgoods and to consumption. For the last five years, the calculation of SCFgives 0.75 1/.
Prices of Agricultural Outputs
4. The economic prices for traded goods such as rice, wheat, ground-nuts, sugarcane are based on their border prices at the OER. The domesticcost components (i.e. local transport and marketing charges) are adjusted bythe SCF of 0.75. The economic prices for non-traded goods are derived byapplying the historical price ratios between these outputs and rice to theeconomic price of rice. The projected financial prices for various cropsare based on the estimated historical price trends 2/ in India, adjustedfor local conditions in Orissa.
1/ As derived by staff of South Asia Projects. This estimate does nottake into account trade restrictions. Consequently, the estimateprovides an upper limit for SCF.
2/ See Draft on Economic and Financial Prices of Agricultural Projects inIndia, by staff of South Asia Projects Department.
133
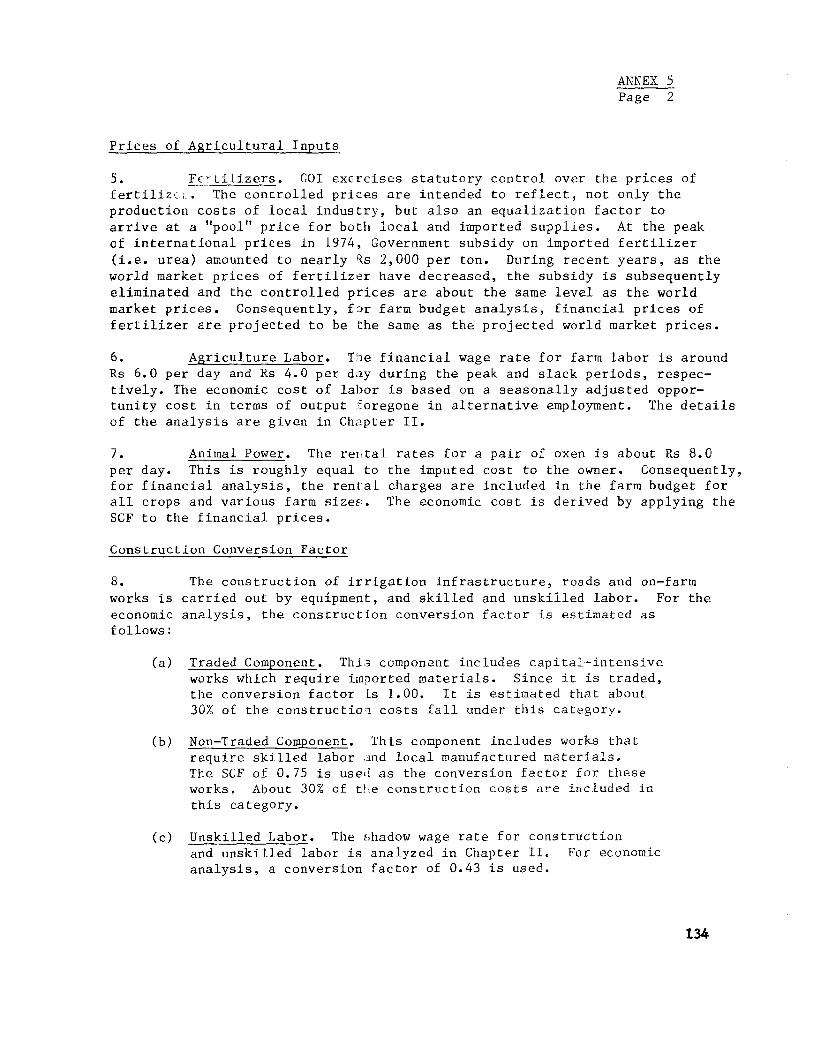
ANNEX 5Page 2
Prices of Agricultural Inputs
5. Fe-tilizers. GOI exercises statutory control over the prices offertiliz.L. The controlled prices are intended to reflect, not only theproduction costs of local industry, but also an equalization factor toarrive at a "pool" price for both local and imported supplies. At the peakof international prices in 1974, Government subsidy on imported fertilizer(i.e. urea) amounted to nearly Rs 2,000 per ton. During recent years, as theworld market prices of fertilizer have decreased, the subsidy is subsequentlyeliminated and the controlled prices are about the same level as the worldmarket prices. Consequently, fDr farm budget analysis, financial prices offertilizer are projected to be the same as the projected world market prices.
6. Agriculture Labor. The financial wage rate for farm labor is aroundRs 6.0 per day and Rs 4.0 per day during the peak and slack periods, respec-tively. The economic cost of labor is based on a seasonally adjusted oppor-tunity cost in terms of output :foregone in alternative employment. The detailsof the analysis are given in Chapter II.
7. Animal Power. The rental rates for a pair of oxen is about Rs 8.0per day. This is roughly equal to the imputed cost to the owner. Consequently,for financial analysis, the rental charges are included in the farm budget forall crops and various farm sizes. The economic cost is derived by applying theSCF to the financial prices.
Construction Conversion Factor
8. The construction of irrigation infrastructure, roads and on-farmworks is carried out by equipment, and skilled and unskilled labor. For theeconomic analysis, the construction conversion factor is estimated asfollows:
(a) Traded Component. This component includes capital-intensiveworks which require imported materials. Since it is traded,the conversion factor is 1.00. It is estimated that about30% of the construction costs fall under this category.
(b) Non-Traded Component. This component includes works thatrequire skilled labor and local manufactured materials.The SCF of 0.75 is used as the conversion factor for theseworks. About 30% of the construction costs are included irnthis category.
(c) Unskilled Labor. The shadow wage rate for constructionand unskilled labor is analyzed in Chapter II. For economicanalysis, a conversion factor of 0.43 is used.
134
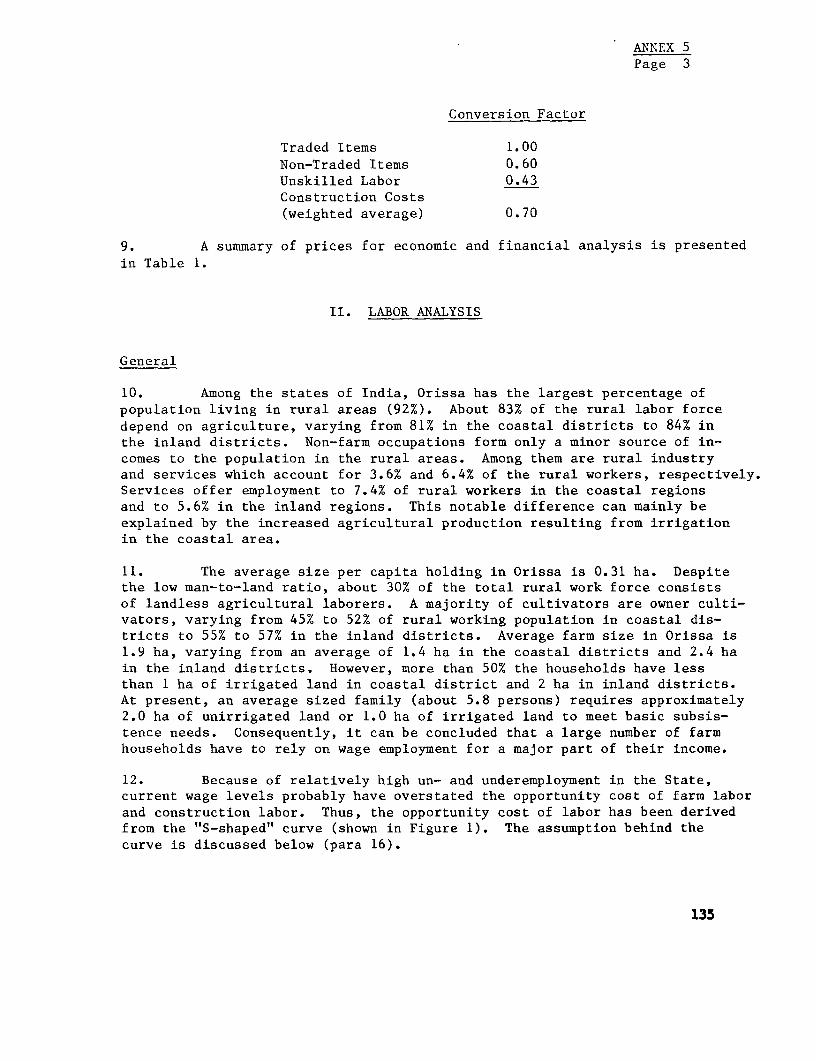
ANNEX 5Page 3
Conversion Factor
Traded Items 1.00
Non-Traded Items 0.60Unskilled Labor 0.43Construction Costs(weighted average) 0.70
9. A summary of prices for economic and financial analysis is presented
in Table 1.
II. LABOR ANALYSIS
General
10. Among the states of India, Orissa has the largest percentage ofpopulation living in rural areas (92%). About 83% of the rural labor forcedepend on agriculture, varying from 81% in the coastal districts to 84% inthe inland districts. Non-farm occupations form only a minor source of in-comes to the population in the rural areas. Among them are rural industryand services which account for 3.6% and 6.4% of the rural workers, respectively.Services offer employment to 7.4% of rural workers in the coastal regionsand to 5.6% in the inland regions. This notable difference can mainly beexplained by the increased agricultural production resulting from irrigationin the coastal area.
11. The average size per capita holding in Orissa is 0.31 ha. Despitethe low man-to-land ratio, about 30% of the total rural work force consistsof landless agricultural laborers. A majority of cultivators are owner culti-vators, varying from 45% to 52% of rural working population in coastal dis-tricts to 55% to 57% in the inland districts. Average farm size in Orissa is1.9 ha, varying from an average of 1.4 ha in the coastal districts and 2.4 hain the inland districts. However, more than 50% the households have lessthan 1 ha of irrigated land in coastal district and 2 ha in inland districts.At present, an average sized family (about 5.8 persons) requires approximately2.0 ha of unirrigated land or 1.0 ha of irrigated land to meet basic subsis-tence needs. Consequently, it can be concluded that a large number of farmhouseholds have to rely on wage employment for a major part of their income.
12. Because of relatively high un- and underemployment in the State,current wage levels probably have overstated the opportunity cost of farm laborand construction labor. Thus, the opportunity cost of labor has been derivedfrom the "S-shaped" curve (shown in Figure 1). The assumption behind thecurve is discussed below (para 16).
135
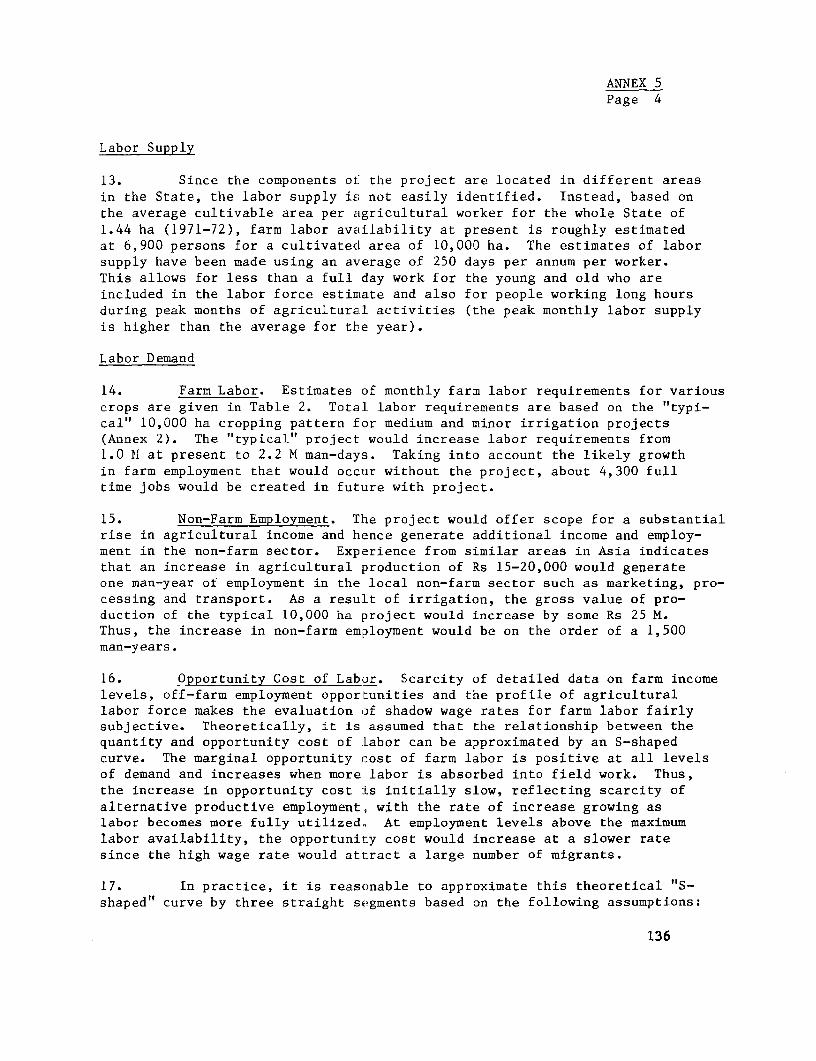
ANNEX 5Page 4
Labor Supply
13. Since the components oi: the project are located in different areasin the State, the labor supply is not easily identified. Instead, based onthe average cultivable area per agricultural worker for the whole State of1.44 ha (1971-72), farm labor availability at present is roughly estimatedat 6,900 persons for a cultivated area of 10,000 ha. The estimates of laborsupply have been made using an average of 250 days per annum per worker.This allows for less than a full day work for the young and old who areincluded in the labor force estimate and also for people working long hoursduring peak months of agricultural activities (the peak monthly labor supplyis higher than the average for the year).
Labor Demand
14. Farm Labor. Estimates of monthly farm labor requirements for variouscrops are given in Table 2. Total labor requirements are based on the "typi-cal" 10,000 ha cropping pattern for medium and minor irrigation projects(Annex 2). The "typical" project would increase labor requirements from1.0 bI at present to 2.2 M man-days. Taking into account the likely growthin farm employment that would occur without the project, about 4,300 fulltime jobs would be created in future with project.
15. Non-Farm Employment. The project would offer scope for a substantialrise in agricultural income and hence generate additional income and employ-ment in the non-farm sector. Experience from similar areas in Asia indicatesthat an increase in agricultural production of Rs 15-20,000 would generateone man-year of employment in the local non-farm sector such as marketing, pro-cessing and transport. As a result of irrigation, the gross value of pro-duction of the typical 10,000 ha project would increase by some Rs 25 M.Thus, the increase in non-farm employment would be on the order of a 1,500man-years.
16. Opportunity Cost of Labor. Scarcity of detailed data on farm incomelevels, off-farm employment opportunities and the profile of agriculturallabor force makes the evaluation of shadow wage rates for farm labor fairlysubjective. Theoretically, it is assumed that the relationship between thequantity and opportunity cost of Labor can be approximated by an S-shapedcurve. The marginal opportunity cost of farm labor is positive at all levelsof demand and increases when more labor is absorbed into field work. Thus,the increase in opportunity cost is initially slow, reflecting scarcity ofalternative productive employment, with the rate of increase growing aslabor becomes more fully utilized, At employment levels above the maximumlabor availability, the opportunity cost would increase at a slower ratesince the high wage rate would attract a large number of migrants.
17. In practice, it is reasonable to approximate this theoretical "S-shaped" curve by three straight segments based on the following assumptions:
136
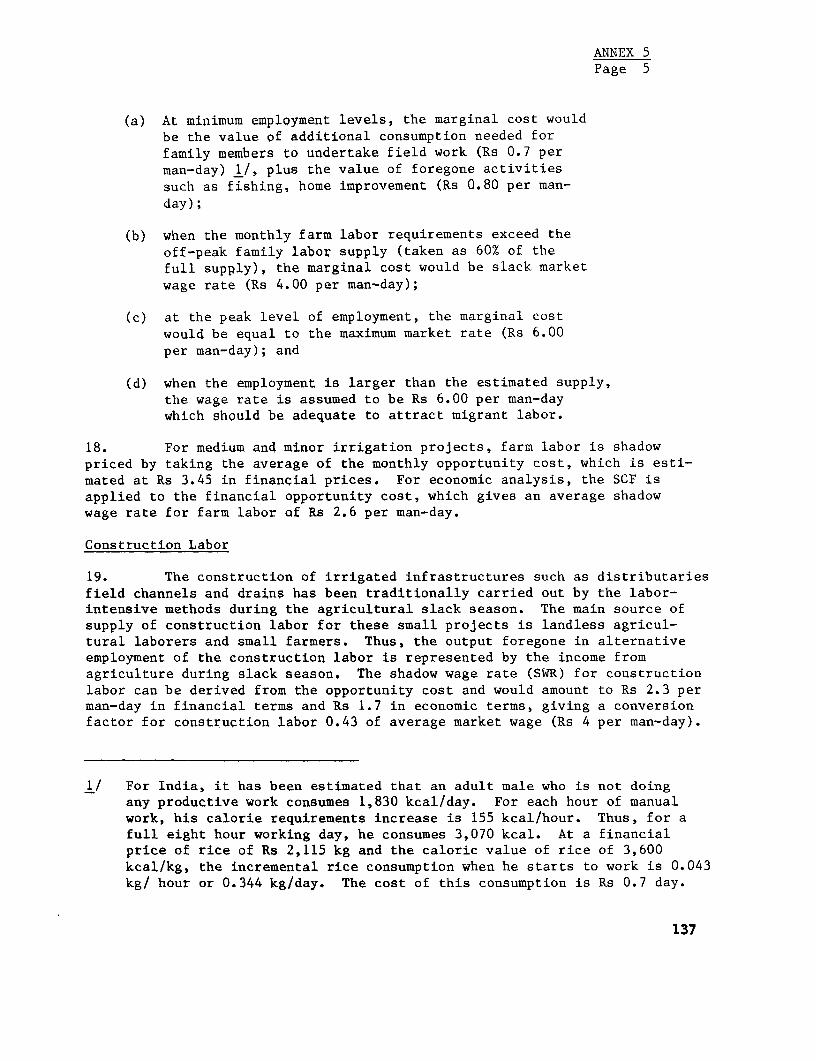
ANNEX 5Page 5
(a) At minimum employment levels, the marginal cost wouldbe the value of additional consumption needed forfamily members to undertake field work (Rs 0.7 perman-day) 1/, plus the value of foregone activitiessuch as fishing, home improvement (Rs 0.80 per man-day);
(b) when the monthly farm labor requirements exceed theoff-peak family labor supply (taken as 60% of thefull supply), the marginal cost would be slack marketwage rate (Rs 4.00 per man-day);
(c) at the peak level of employment, the marginal costwould be equal to the maximum market rate (Rs 6.00per man-day); and
(d) when the employment is larger than the estimated supply,the wage rate is assumed to be Rs 6.00 per man-daywhich should be adequate to attract migrant labor.
18. For medium and minor irrigation projects, farm labor is shadowpriced by taking the average of the monthly opportunity cost, which is esti-mated at Rs 3.45 in financial prices. For economic analysis, the SCF isapplied to the financial opportunity cost, which gives an average shadowwage rate for farm labor of Rs 2.6 per man-day.
Construction Labor
19. The construction of irrigated infrastructures such as distributariesfield channels and drains has been traditionally carried out by the labor-intensive methods during the agricultural slack season. The main source ofsupply of construction labor for these small projects is landless agricul-tural laborers and small farmers. Thus, the output foregone in alternativeemployment of the construction labor is represented by the income fromagriculture during slack season. The shadow wage rate (SWR) for constructionlabor can be derived from the opportunity cost and would amount to Rs 2.3 perman-day in financial terms and Rs 1.7 in economic terms, giving a conversionfactor for construction labor 0.43 of average market wage (Rs 4 per man-day).
1/ For India, it has been estimated that an adult male who is not doingany productive work consumes 1,830 kcal/day. For each hour of manualwork, his calorie requirements increase is 155 kcal/hour. Thus, for afull eight hour working day, he consumes 3,070 kcal. At a financialprice of rice of Rs 2,115 kg and the caloric value of rice of 3,600kcal/kg, the incremental rice consumption when he starts to work is 0.043kg/ hour or 0.344 kg/day. The cost of this consumption is Rs 0.7 day.
137
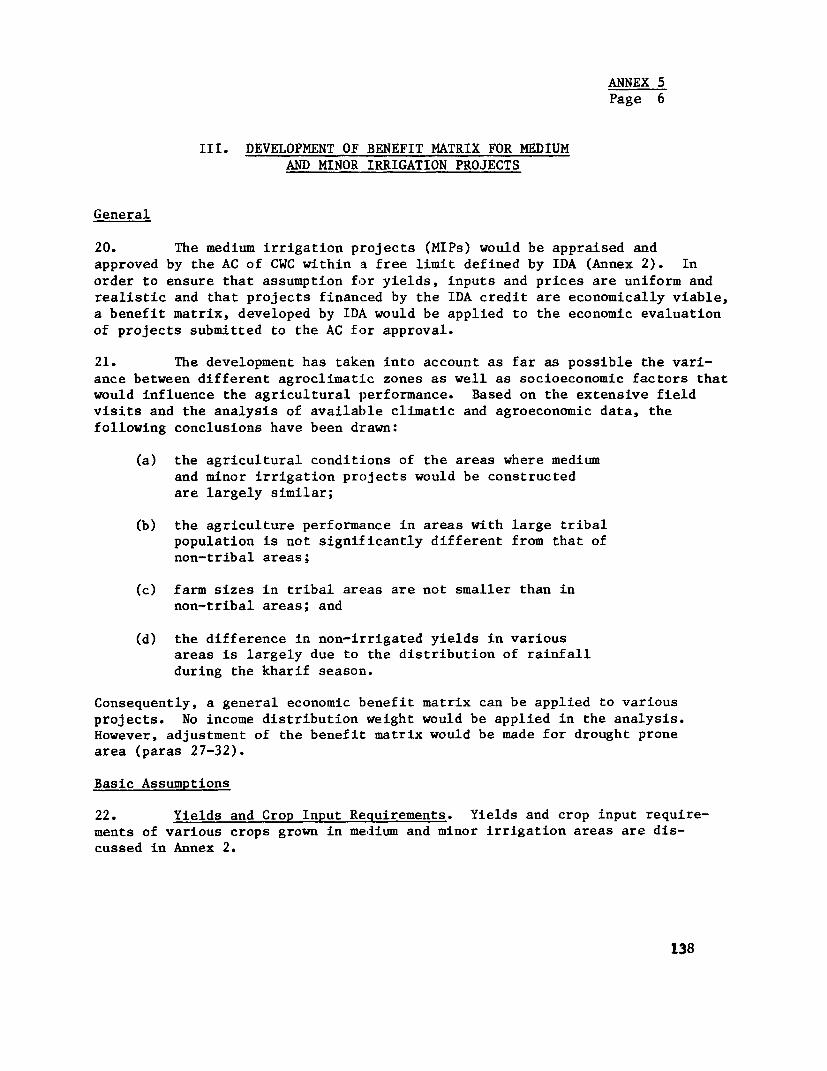
ANNEX 5Page 6
III. DEVELOPMENT OF BENEFIT MATRIX FOR MEDIUMAND MINOR IRRIGATION PROJECTS
General
20. The medium irrigation projects (MIPs) would be appraised andapproved by the AC of CWC within a free limit defined by IDA (Annex 2). Inorder to ensure that assumption for yields, inputs and prices are uniform andrealistic and that projects financed by the IDA credit are economically viable,a benefit matrix, developed by IDA would be applied to the economic evaluationof projects submitted to the AC for approval.
21. The development has taken into account as far as possible the vari-ance between different agroclimatic zones as well as socioeconomic factors thatwould influence the agricultural performance. Based on the extensive fieldvisits and the analysis of available climatic and agroeconomic data, thefollowing conclusions have been drawn:
(a) the agricultural conditions of the areas where mediumand minor irrigation projects would be constructedare largely similar;
(b) the agriculture performance in areas with large tribalpopulation is not significantly different from that ofnon-tribal areas;
(c) farm sizes in tribal areas are not smaller than innon-tribal areas; and
(d) the difference in non-irrigated yields in variousareas is largely due to the distribution of rainfallduring the kharif season.
Consequently, a general economic benefit matrix can be applied to variousprojects. No income distribution weight would be applied in the analysis.However, adjustment of the benefit matrix would be made for drought pronearea (paras 27-32).
Basic Assumptions
22. Yields and Crop Input Requirements. Yields and crop input require-ments of various crops grown in medlium and minor irrigation areas are dis-cussed in Annex 2.
138
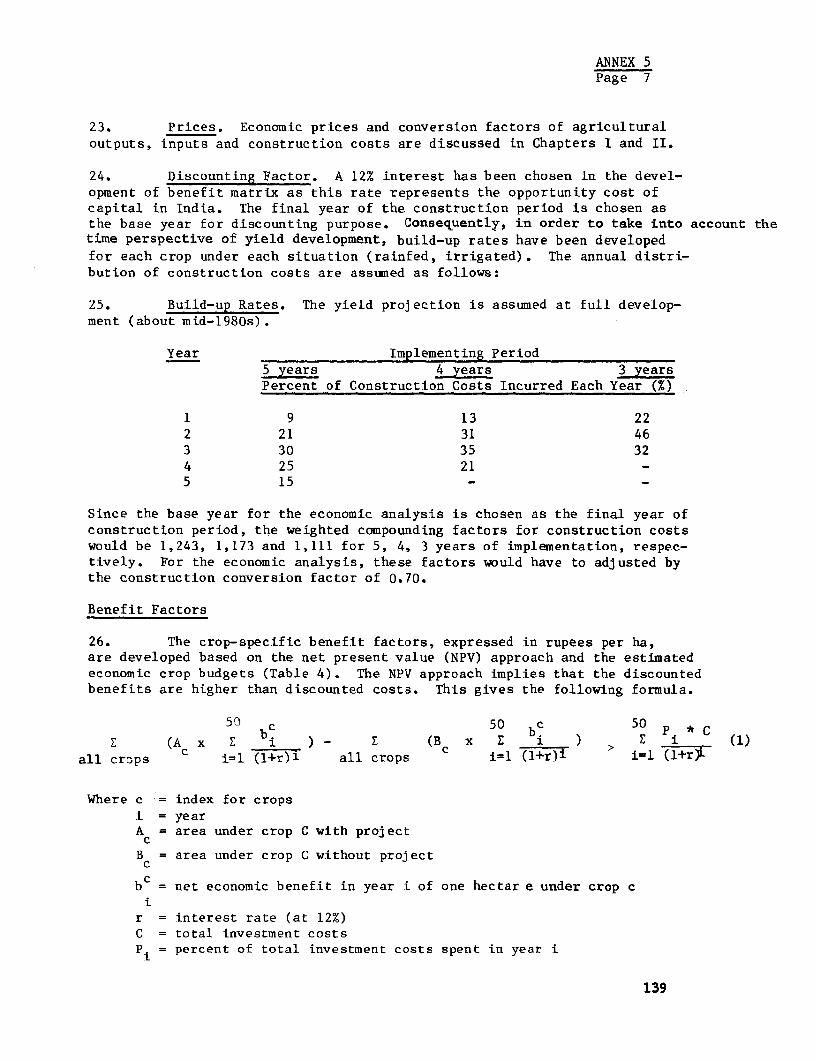
ANNEX 5Page 7
23. Prices. Economic prices and conversion factors of agriculturaloutputs, inputs and construction costs are discussed in Chapters I and II.
24. Discounting Factor. A 12% interest has been chosen in the devel-opment of benefit matrix as this rate represents the opportunity cost ofcapital in India. The final year of the construction period is chosen asthe base year for discounting purpose. Consequently, in order to take into account thetime perspective of yield development, build-up rates have been developedfor each crop under each situation (rainfed, irrigated). The annual distri-bution of construction costs are assumed as follows:
25. Build-up Rates. The yield projection is assumed at full develop-ment (about mid-1980s).
Year Implementing Period5 years 4 years 3 yearsPercent of Construction Costs Incurred Each Year (%)
1 9 13 222 21 31 463 30 35 324 25 215 15
Since the base year for the economic analysis is chosen as the final year ofconstruction period, the weighted compounding factors for construction costswould be 1,243, 1,173 and 1,111 for 5, 4, 3 years of implementation, respec-tively. For the economic analysis, these factors would have to adjusted bythe construction conversion factor of 0.70.
Benefit Factors
26. The crop-specific benefit factors, expressed in rupees per ha,are developed based on the net present value (NPV) approach and the estimatedeconomic crop budgets (Table 4). The NPV approach implies that the discountedbenefits are higher than discounted costs. This gives the following formula.
50 50 bc 50 P. * C(A cb c b> _ _ 1i0 c - (B x I 1 ) > ____ (l
all crops c i=l (l+r)i all crops i=l (1+r)i i=l (l+r)L
Where c = index for cropsi = yearA = area under crop C with project
B = area under crop C without projectcb = net economic benefit in year i of one hectar e under crop c
ir = interest rate (at 12%)C = total investment costsP. = percent of total investment costs spent in year i
139
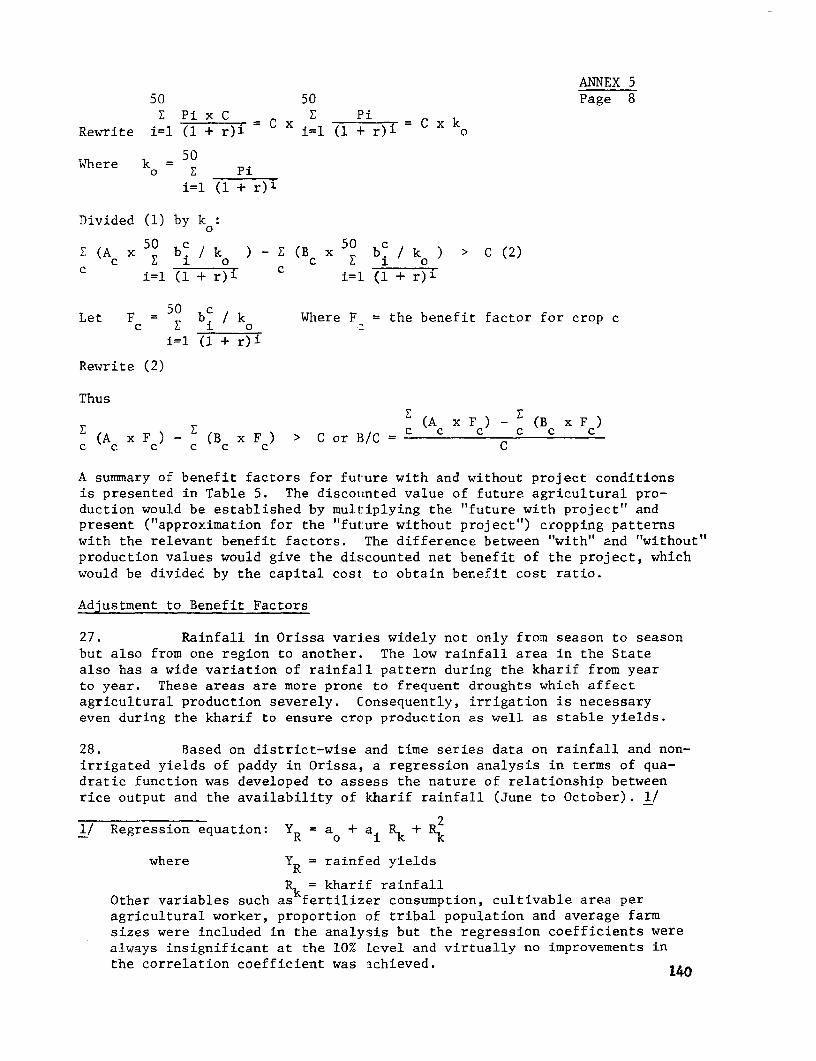
ANNEX 550 50 Page 8
E Pi x C E PiRewrite i=l (1 + r)i C x i=l (1 + r)i o
Where k = E P0 ____Pi _
i=l (1 + r)i
Divided (1) by ko:
E (A x b / k ) - E (B x£ b. / k ) ' C (2)C j 0 C 1 0
c i=l(1 + r)i c i=1 (1 + r)i
Let F = bi / k Where F = the benefit factor for crop c
il (1 + r)i
Rewrite (2)
Thus
(A x F) (B x F(A x F) (B x F) > C or }3/C = c c c c c c
c c, c c c c C
A summary of benefit factors for future with and without project conditionsis presented in Table 5. The discointed value of future agricultural pro-duction would be established by multiplying the "future with project" andpresent ("approximation for the "fut:ure without project") cropping patternswith the relevant benefit factors. The difference between "with" and "without"production values would give the discounted net benefit of the project, whichwould be divided by the capital cost to obtain benefit cost ratio.
Adjustment to Benefit Factors
27. Rainfall in Orissa varies widely not only from season to seasonbut also from one region to another. The low rainfall area in the Statealso has a wide variation of rainfall pattern during the kharif from yearto year. These areas are more prone to frequent droughts which affectagricultural production severely. Consequently, irrigation is necessaryeven during the kharif to ensure crop production as well as stable yields.
28. Based on district-wise and time series data on rainfall and non-irrigated yields of paddy in Orissa, a regression analysis in terms of qua-dratic function was developed to assess the nature of relationship betweenrice output and the availability of kharif rainfall (June to October). 1/
21/ Regression equation: Y = a + a. R 2
R = Rk + R
where YR = rainfed yields
Rk = kharif rainfallOther variables such as fertilizer consumption, cultivable area peragricultural worker, proportion of tribal population and average farmsizes were included in the analysis but the regression coefficients werealways insignificant at the 10% level and virtually no improvements inthe correlation coefficient was achieved. 140
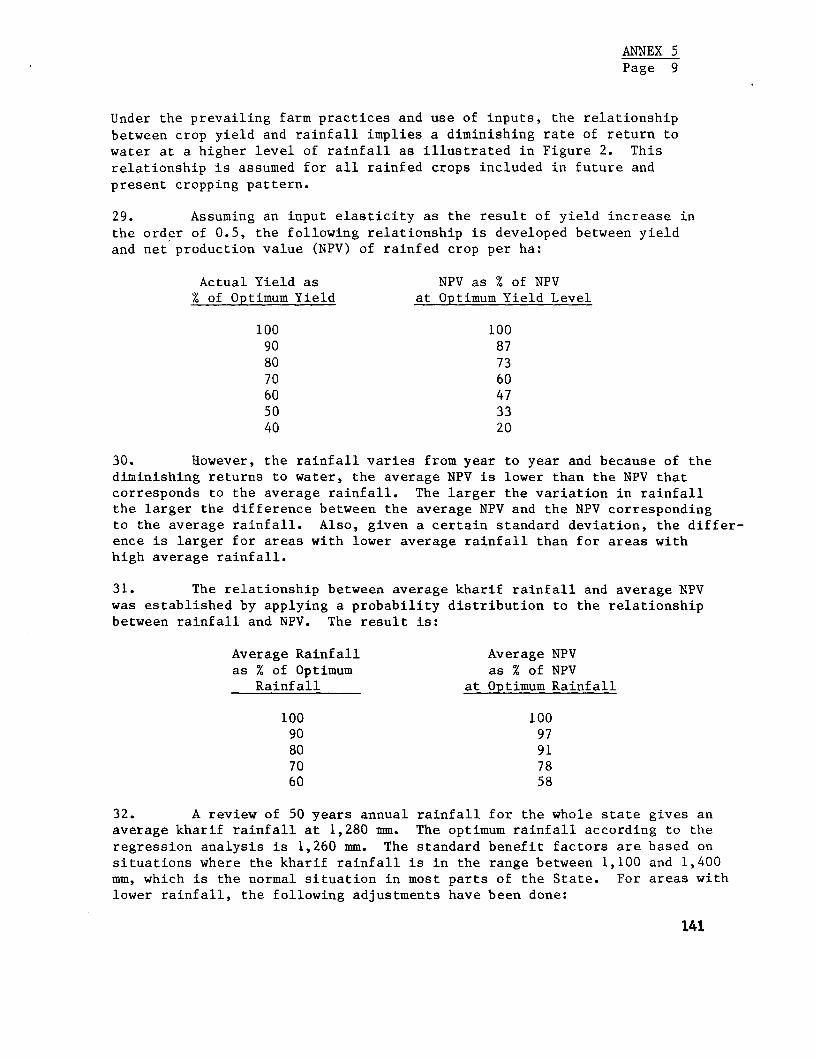
ANNEX 5Page 9
Under the prevailing farm practices and use of inputs, the relationshipbetween crop yield and rainfall implies a diminishing rate of return towater at a higher level of rainfall as illustrated in Figure 2. Thisrelationship is assumed for all rainfed crops included in future and
present cropping pattern.
29. Assuming an input elasticity as the result of yield increase inthe order of 0.5, the following relationship is developed between yieldand net production value (NPV) of rainfed crop per ha:
Actual Yield as NPV as % of NPV% of Optimum Yield at Optimum Yield Level
100 10090 8780 7370 6060 4750 3340 20
30. However, the rainfall varies from year to year and because of thediminishing returns to water, the average NPV is lower than the NPV thatcorresponds to the average rainfall. The larger the variation in rainfallthe larger the difference between the average NPV and the NPV correspondingto the average rainfall. Also, given a certain standard deviation, the differ-ence is larger for areas with lower average rainfall than for areas withhigh average rainfall.
31. The relationship between average kharif rainfall and average NPVwas established by applying a probability distribution to the relationshipbetween rainfall and NPV. The result is:
Average Rainfall Average NPVas % of Optimum as % of NPV
Rainfall at Optimum Rainfall
100 10090 9780 9170 7860 58
32. A review of 50 years annual rainfall for the whole state gives anaverage kharif rainfall at 1,280 mm. The optimum rainfall according to theregression analysis is 1,260 mm. The standard benefit factors are based onsituations where the kharif rainfall is in the range between 1,100 and 1,400mm, which is the normal situation in most parts of the State. For areas withlower rainfall, the following adjustments have been done:
141
ANNEX 5Page 10
Adjustment to Benefit FactorsAverage Kharif Rainfall Level of Rainfed Crops
(at least 20 years) (%)
Above 1,100 mm 0
1,000 - 1,100 mm -5
Less than 1,000 mm -13
August 1977
142
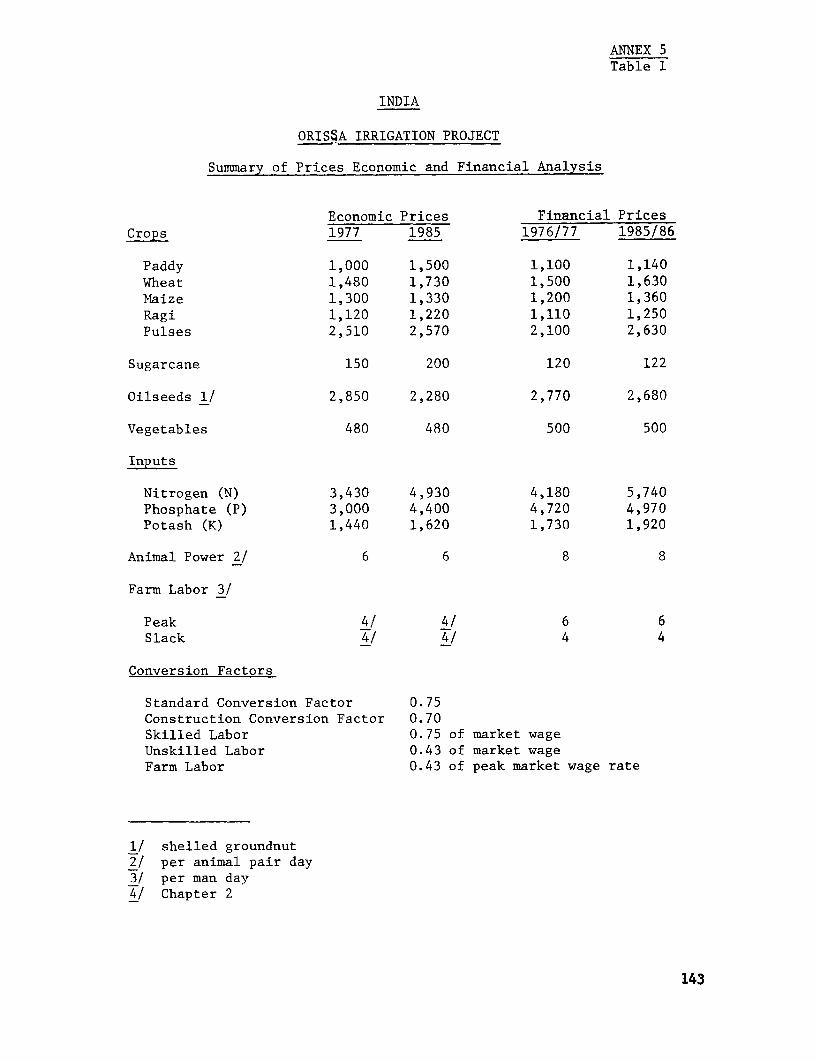
ATNEX 5Table 1
INDIA
ORISSA IRRIGATION PROJECT
Summary of Prices Economic and Financial Analysis
Economic Prices Financial PricesCrops 1977 1985 1976/77 1985/86
Paddy 1,000 1,500 1,100 1,140Wheat 1,480 1,730 1,500 1,630Maize 1,300 1,330 1,200 1,360Ragi 1,120 1,220 1,110 1,250Pulses 2,510 2,570 2,100 2,630
Sugarcane 150 200 120 122
Oilseeds 1/ 2,850 2,280 2,770 2,680
Vegetables 480 480 500 500
Inputs
Nitrogen (N) 3,430 4,930 4,180 5,740Phosphate (P) 3,000 4,400 4,720 4,970Potash (K) 1,440 1,620 1,730 1,920
Animal Power 2/ 6 6 8 8
Farm Labor 31
Peak 4/ 4/ 6 6Slack /4 4
Conversion Factors
Standard Conversion Factor 0.75Construction Conversion Factor 0.70Skilled Labor 0.75 of market wageUnskilled Labor 0.43 of market wageFarm Labor 0.43 of peak market wage rate
1/ shelled groundnut2/ per animal pair day3/ per man day4/ Chapter 2
143
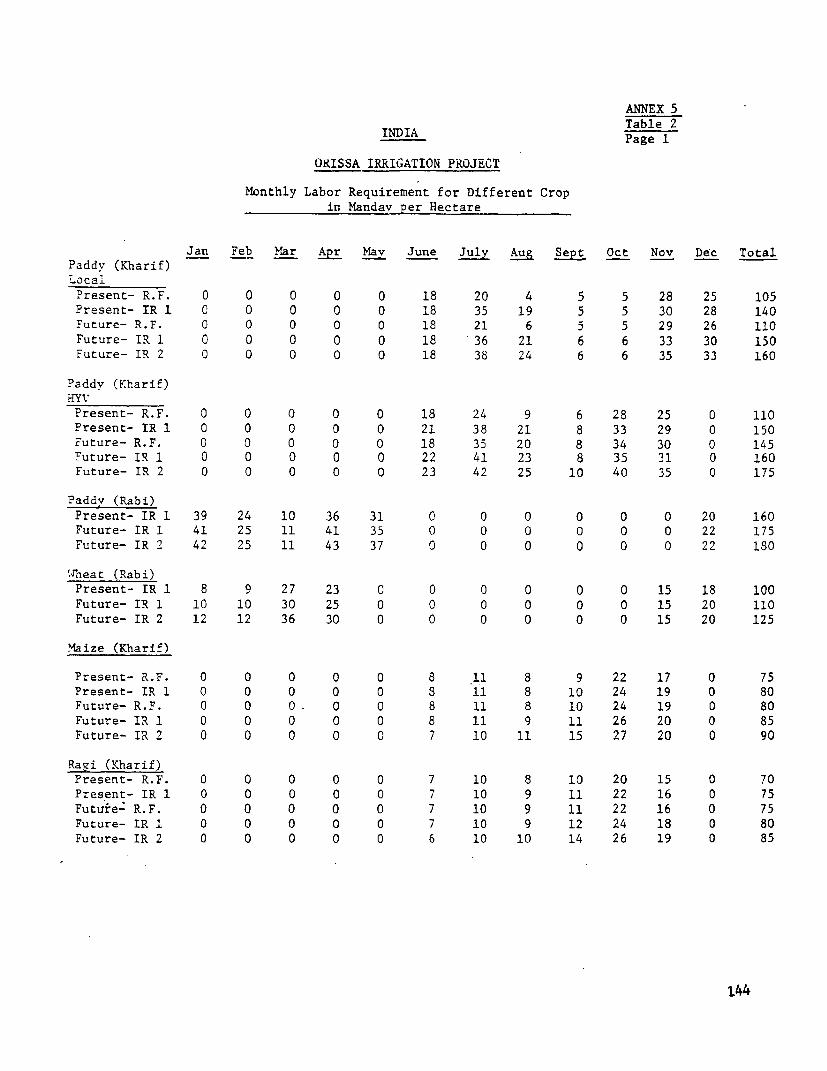
ANNEX 5
Table 2INDIA Page 1
ORISSA IRRIGATION PROJECT
Monthly Labor Requirement for Different Cropin Mandav per Hectare
Jan Feb Mar Apr Mav June July Aug Sept Oct Nov Dec TotalPaddy (Kharif)Local
Present- R.F. 0 0 0 0 0 18 20 4 5 5 28 25 105Present- IR 1 0 0 0 0 0 18 35 19 5 5 30 28 140Future- R.F. 0 0 0 0 0 18 21 6 5 5 29 26 110Future- IR l 0 0 0 0 0 18 36 21 6 6 33 30 150Future- IR 2 0 0 0 0 0 18 38 24 6 6 35 33 160
Paddy (Kharif)HYVPresent- R.F. 0 0 0 0 0 18 24 9 6 28 25 0 110Present- IR 1 0 0 0 0 0 21 38 21 8 33 29 0 150Future- R.F. 0 0 0 0 0 18 35 20 8 34 30 0 145Future- IR 1 0 0 0 0 0 22 41 23 8 35 31 0 160
Future- IR 2 0 0 0 0 0 23 42 25 10 40 35 0 175
Paddv (Rabi)Present- IR 1 39 24 10 36 31 0 0 0 0 0 0 20 160Future- IR 1 41 25 11 41 35 0 0 0 0 0 0 22 175
Future- IR 2 42 25 11 43 37 0 0 0 0 0 0 22 1S0
Wheat (Rabi)Present- IR 1 8 9 27 23 0 0 0 0 0 0 15 18 100
Future- IR I 10 10 30 25 0 0 0 0 0 0 15 20 110
Future- IR 2 12 12 36 30 0 0 0 0 0 0 15 20 125
Maize (Kharif)
Present- R.F. 0 0 0 0 0 8 11 8 9 22 17 0 75
Present- IR 1 0 0 0 0 0 8 11 8 10 24 19 0 80
Future- R.F. 0 0 0. 0 0 8 11 8 10 24 19 0 80
Future- IR 1 0 0 0 0 0 8 11 9 11 26 20 0 85
Future- IR 2 0 0 0 0 0 7 10 11 15 27 20 0 90
Ragi (Kharif)Present- R.F. 0 0 0 0 0 7 10 8 10 20 15 0 70Present- IR 1 0 0 0 0 0 7 10 9 11 22 16 0 75Future -R.F. 0 0 0 0 0 7 10 9 11 22 16 0 75
Future- IR 1 0 0 0 0 0 7 10 9 12 24 18 0 80
Future- IR 2 0 0 0 0 0 6 10 10 14 26 19 0 85
144
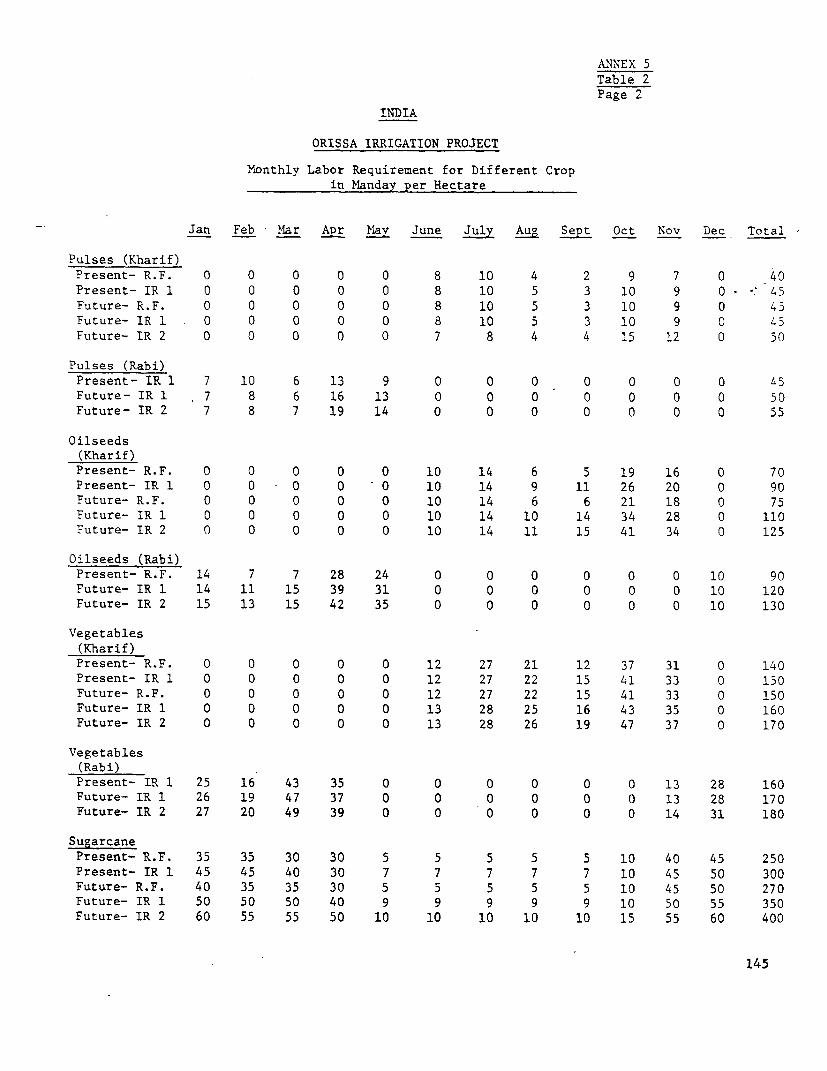
AN`NEX 5Table 2Page 2
INDIA
ORISSA IRRIGATION PROJECT
Monthly Labor Requirement for Different Cropin Manday per Hectare
Jan Feb liar Apr Mav June July Aug Oct Nov Dec Total
Pulses (Kharif)Present- R.F. 0 0 0 0 0 8 10 4 2 9 7 0 40Present- IR 1 0 0 0 0 0 8 10 5 3 10 9 0 45Future- R.F. 0 0 0 0 0 8 10 5 3 10 9 0 45Future- IR 1 0 0 0 0 0 8 10 5 3 10 9 0 45Future- IR 2 0 0 0 0 0 7 8 4 4 15 12 0 50
Pulses (Rabi)Present- IR 1 7 10 6 13 9 0 0 0 0 0 0 0 45
Future- IR 1 7 8 6 16 13 0 0 0 0 0 0 0 50Future- IR 2 7 8 7 19 14 0 0 0 0 0 0 0 55
Oilseeds(Kharif)Present- R.F. 0 0 0 0 0 10 14 6 5 19 16 0 70Present- IR 1 0 0 0 0 0 10 14 9 11 26 20 0 90Future- R.F. 0 0 0 0 0 10 14 6 6 21 18 0 75Future- IR 1 0 0 0 0 0 10 14 10 14 34 28 0 110Future- IR 2 0 0 0 0 0 10 14 11 15 41 34 0 125
Oilseeds (Rabi)Present- R.F. 14 7 7 28 24 0 0 0 0 0 0 10 90Future- IR 1 14 11 15 39 31 0 0 0 0 0 0 10 120Future- IR 2 15 13 15 42 35 0 0 0 0 0 0 10 130
Vegetables(Kharif)Present- R.F. 0 0 0 0 0 12 27 21 12 37 31 0 140Present- IR 1 0 0 0 0 0 12 27 22 15 41 33 0 150Future- R.F. 0 0 0 0 0 12 27 22 15 41 33 0 150Future- IR 1 0 0 0 0 0 13 28 25 16 43 35 0 160Future- IR 2 0 0 0 0 0 13 28 26 19 47 37 0 170
Vegetables(Rabi)Present- IR 1 25 16 43 35 0 0 0 0 0 0 13 28 160Future- IR 1 26 19 47 37 0 0 0 0 0 0 13 28 170Future- IR 2 27 20 49 39 0 0 0 0 0 0 14 31 180
SugarcanePresent- R.F. 35 35 30 30 5 5 5 5 5 10 40 45 250Present- IR l 45 45 40 30 7 7 7 7 7 10 45 50 300Future- R.F. 40 35 35 30 5 5 5 5 5 10 45 50 270Future- IR 1 50 50 50 40 9 9 9 9 9 10 50 55 350Future- IR 2 60 55 55 50 10 10 10 10 10 15 55 60 400
145
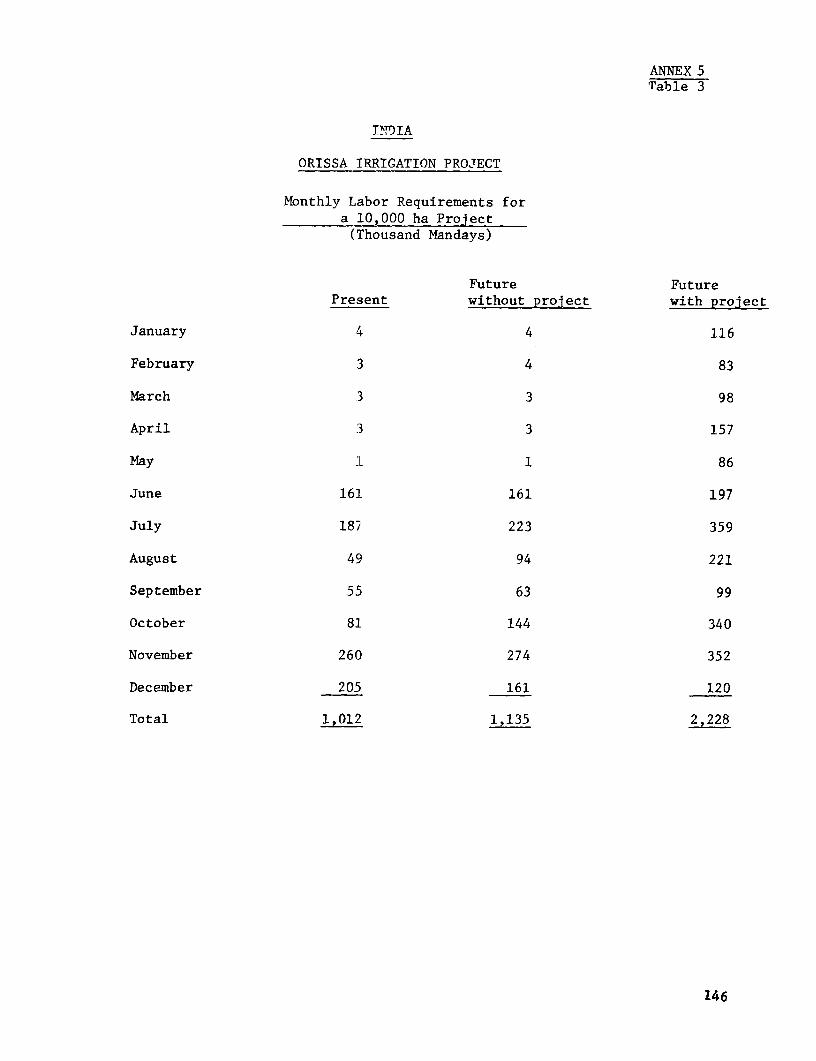
ANNEX 5Table 3
TPDTA
ORISSA IRRIGATION PROJECT
Monthly Labor Requirements fora 10,000 ha Project(Thousand Mandays)
Future FuturePresent without project with project
January 4 4 116
February 3 4 83
March 3 3 98
April 3 3 157
May 1 1 86
June 161 161 197
July 187' 223 359
August 49 94 221
September 55 63 99
October 81 144 340
November 260 274 352
December 205 161 120
Total 1,012 1,135 2,228
146
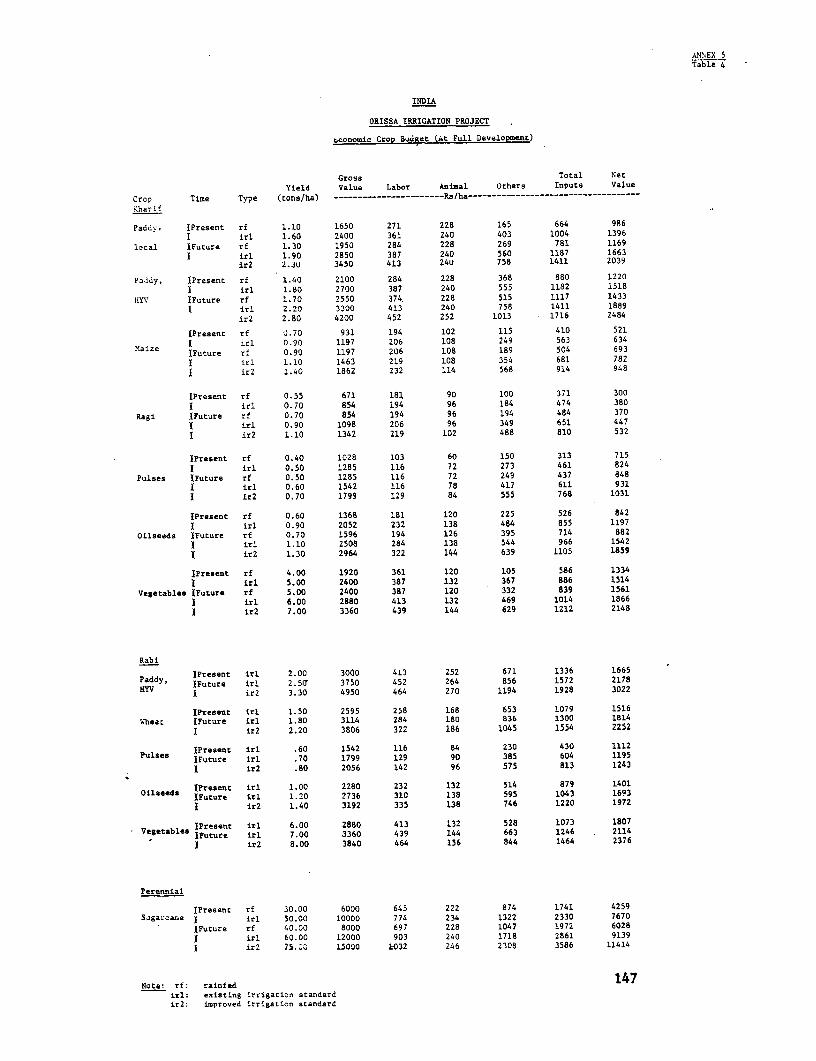
AN' EX STable 4
INDIA
ORISSA IRRIGATION PROJECT
tconomic Crop Buuget (At Full DeveloPment)
Gross Total Net
Yield Value Labor Animal Others Inputs Value
Crop Time Type (tons/ha) ----------------------- Rs/ha… ------------------------------
Kharif
Paddv, [Present rf 1.10 1650 271 228 165 664 986
I irl 1.60 2400 361 240 403 1004 1396
local IFuture rf 1.30 1950 284 228 269 781 1169
irl 1.90 2850 387 240 560 1187 1663
ir2 2.3U 3450 413 24u 758 1411 2039
Paddy, IPresent rf 1.40 2100 284 228 368 880 1220
I irl 1.80 2700 387 240 555 1182 1518
HYV IFuture rf 1.70 2550 374 228 515 1117 1433
Irl 2.20 3300 413 240 758 1411 1889
ir2 2.80 4200 452 252 1013 1716 2484
[Present rf 0.70 931 194 102 115 410 521
I irl 0.90 1197 206 108 249 563 634
M4aize IFuture rf 0.90 1197 206 108 189 504 693
irl 1.10 1463 219 108 354 681 782
ir2 1.40 1862 232 114 568 914 948
[Present rf 0.55 671 181 90 100 371 300
I irl 0.70 854 194 96 184 474 380
Ragi IFuture rf 0.70 854 194 96 194 484 370
I irl 0.90 1098 206 96 349 651 447
I ir2 1.10 1342 219 102 488 810 532
[Present rf 0.40 1028 103 60 150 313 715
I irl 0.50 12B5 116 72 273 461 824
Pulses IFuture rf 0.50 1285 116 72 249 437 848
irl 0.60 1542 116 78 417 611 931
I ir2 0.70 1799 129 84 555 768 1031
[Present rf 0.60 1368 181 120 225 526 842
I irl 0.90 2052 232 138 484 855 1197
Oilseeds IFuture rf 0.70 1596 194 126 395 714 882
irl 1.10 2508 284 138 544 966 1542
ir2 1.30 2964 322 144 639 1105 1859
IPresent rf 4.00 1920 361 120 105 586 1334
I irl 5.00 2400 387 132 367 886 1514
Vegetables |Future rf 5.00 2400 387 120 332 839 1561
irl 6.00 2880 413 132 469 1014 1866
I ir2 7.00 3360 439 144 629 1212 2148
Rab i
IPresent irl 2.00 3000 413 252 671 1336 1665Paddy, iFuture irl 2.50J 3750 452 264 856 1572 2178
I ir2 3.30 4950 464 270 1194 1928 3022
[Present irl 1.50 2595 258 168 653 1079 1516
Wheat [Future irl 1.80 3114 284 180 836 1300 1814
I ir2 2.20 3806 322 186 1045 1554 2252
[Present irl .60 1542 116 84 230 430 1112Pulses [Future irl .70 1799 129 90 385 604 1195
I ir2 .80 2056 142 96 575 813 1243
lPresent irl 1.00 2280 232 132 514 879 1401Oilseeds [Future irl 1.20 2736 310 138 595 1043 1693
I ir2 1.40 3192 335 138 746 1220 1972
lPresent irl 6.00 2880 413 132 528 1073 1807Vegetables IFuture irl 7.00 3360 439 144 663 1246 2114
I ir2 8.00 3840 464 156 844 1464 2376
Perennial
[Present rf 30.00 6000 645 222 874 1741 4259
Sigarcane I irl 50.00 10000 774 234 1322 2330 7670
IFuture rf 40.00 8000 697 228 1047 1972 6028
mirl 60.00 12000 903 240 1718 2861 9139
ir2 75. 15000 1032 246 2308 3586 11414
Note: rf: rainfed 147irl: existing irrigation standardir2: improved irrigation standard
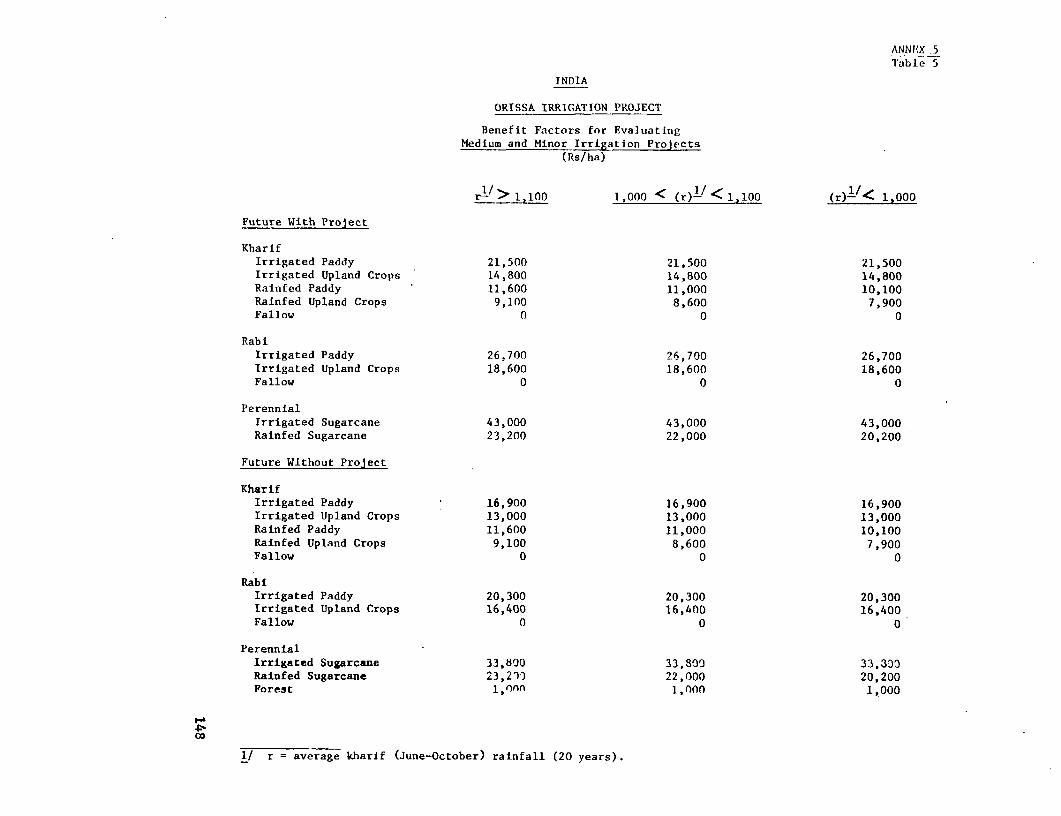
ANNEX .5Tlable 5
INDIA
ORISSA IRRIGATION PROJECT
Benefit Factors for EvaltuatingMedium and Minor Irrigation Prolects
(Rs/ha)
r"> 1,lO0 1,000 < (r)'< 1,100 (r)l/< 1,000
Future With Project
KharifIrrigated Paddy 21,500 21,500 21,500Irrigated Upland Crops 14,800 14,800 14,800Rainfed Paddy 11,600 11,000 10,100Rainfed Upland Crops 9,100 8,600 7,900Fallow 0 0 0
RabiIrrigated Paddy 26,700 26,700 26,700Irrigated Upland Crops 18,600 18,600 18,600Fallow 0 0 0
PerennialIrrigated Sugarcane 43,000 43,000 43,000Rainfed Sugarcane 23,200 22,000 20,200
Future Wlthout Project
KharifIrrigated Paddy 16,900 16,900 16,900Irrigated Upland Crops 13,000 13,000 13,000Rainfed Paddy 11,600 11,000 10,100Rainfed Upland Crops 9,100 8,600 7,900Fallow 0 0 0
RabiIrrigated Paddy 20,300 20,300 20,300Irrigated Upland Crops 16,400 16,400 16,400Fallow 0 0 0
PerennialIrrigated Sugarcane 33,800 33,803 33.333Rainfed Sugarcane 23,2') 22,000 20,200Forest 1,0nn 1,000 1,000
I/ r = average kharif (June-October) rainfall (20 years).
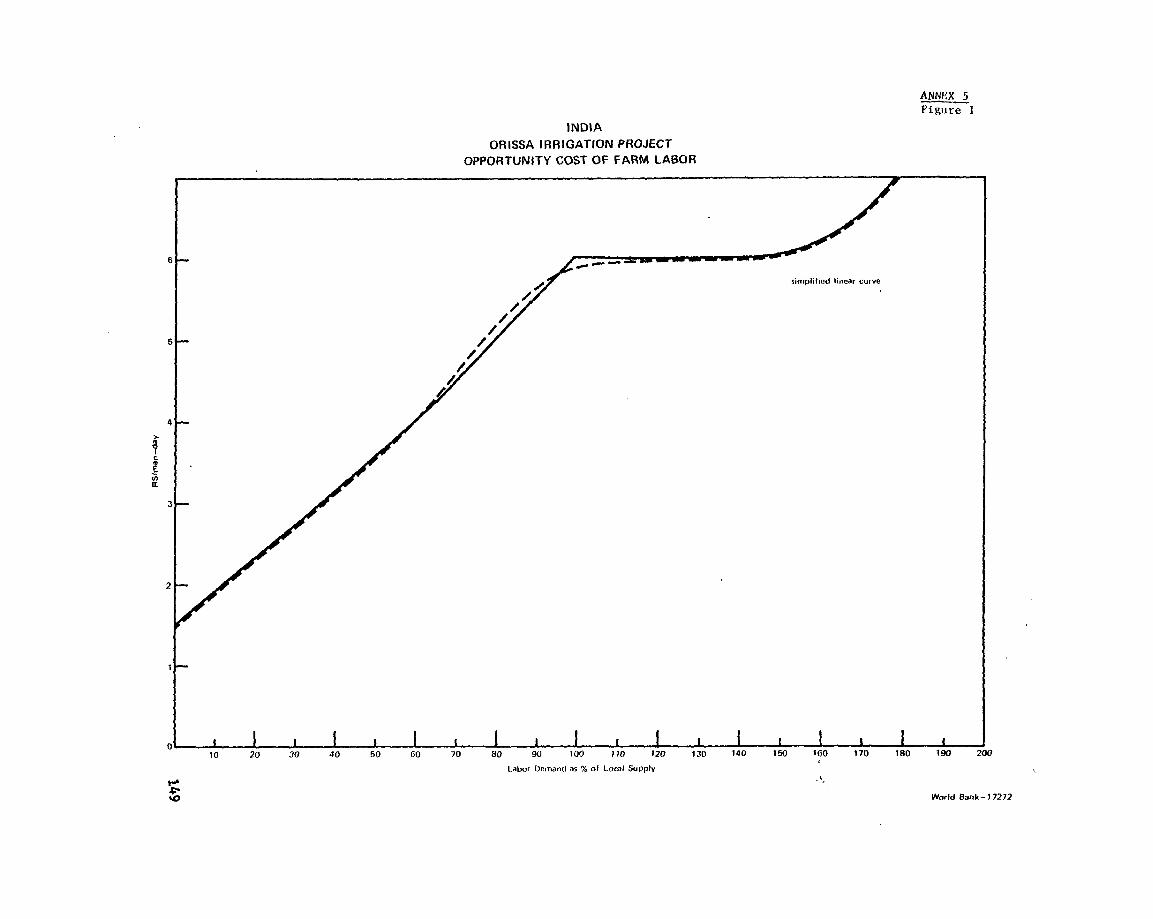
ANNEX 5Figure 1
INDIAORISSA IRRIGATION PROJECT
OPPORTUNITY COST OF FARM LABOR
simplified linear curve
//
5 /
/~~~~~~
10 20 30 40 50 60 70 80 90 100 t10 120 130 140 150 160 170 180 190 200
Labor Demar,d as % of Loczal Supplv
4 W n
,cWrd8ak 77
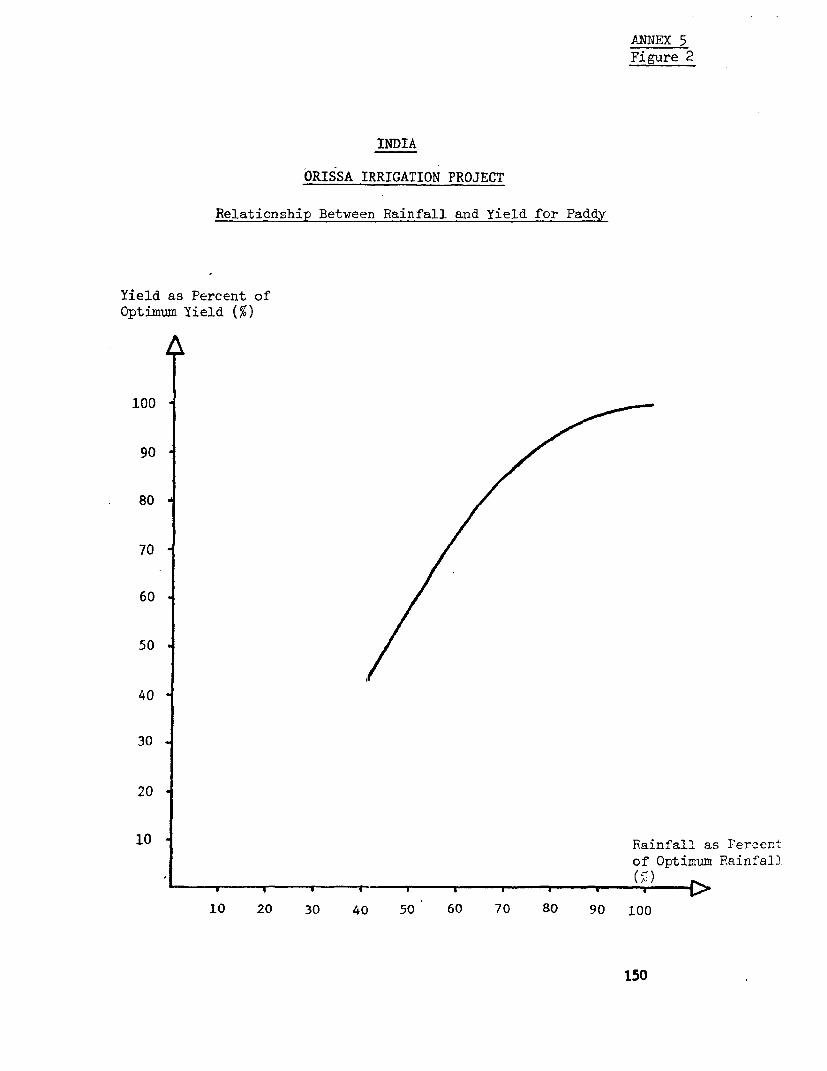
ANTIEX 5Figure 2
INDIA
ORISSA IRRIGATION PROJECT
Relationship Between Rainfall and Yield for Paddy
Yield as Percent of
Optimum Yield (%)
100 \
90
80
70
60
50
40
30
20
10 Rainfall as rercent
of Optimum Rainfall
(5:)
10 20 30 40 50 60 70 80 90 100
150
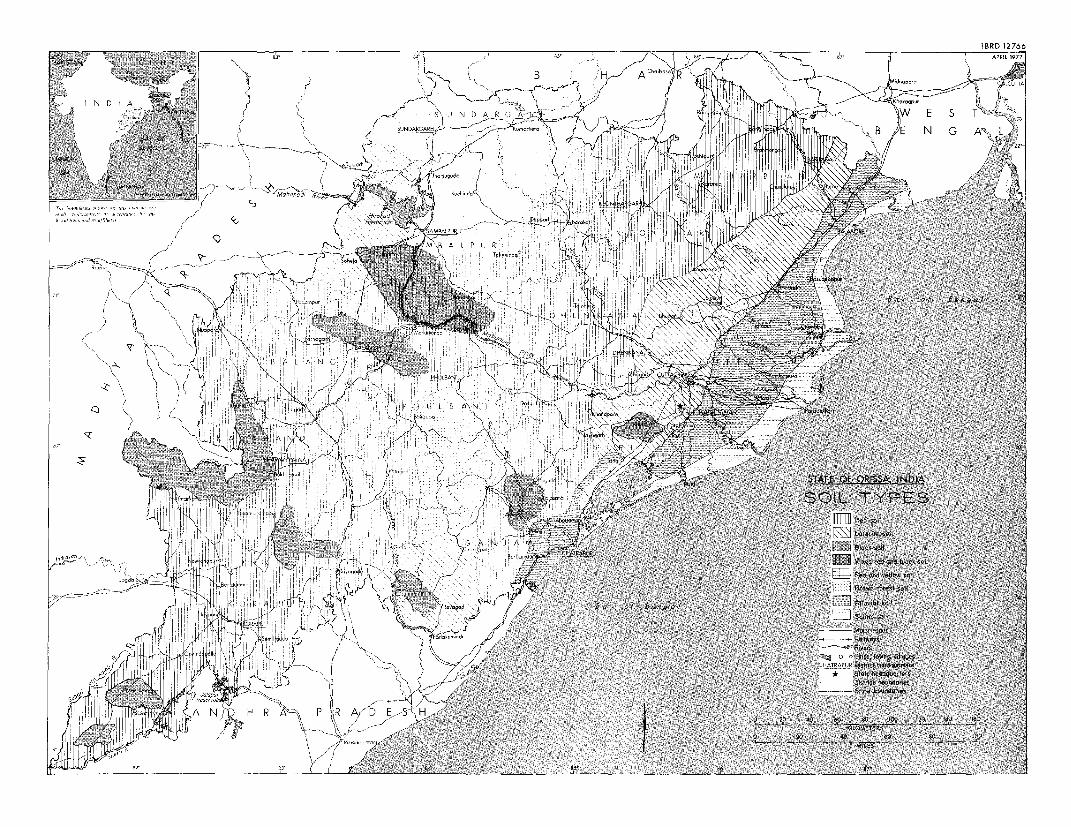
IBRD 12766
T 8Y APRIL 1977
I H ALCUTTA
N D AJ N 1) A C
T'
IIIIIAIIIII
A
N
K.4 1,
A L F' L R'- - -----------
�SC
T f
H[�LBAN;
K%"
AI
UA OF ordsSA, �NDIA'n
IL F�)
td-'
A KI-T Al�-- d
J,,d
q.dLi
116 d.
17,� o - cftga� towm vilwQes
-CHATRAPUR Dwritt he*04�orwr
St-fV
Stott bowdones
A D EA N
f4a 16
-01
OP,

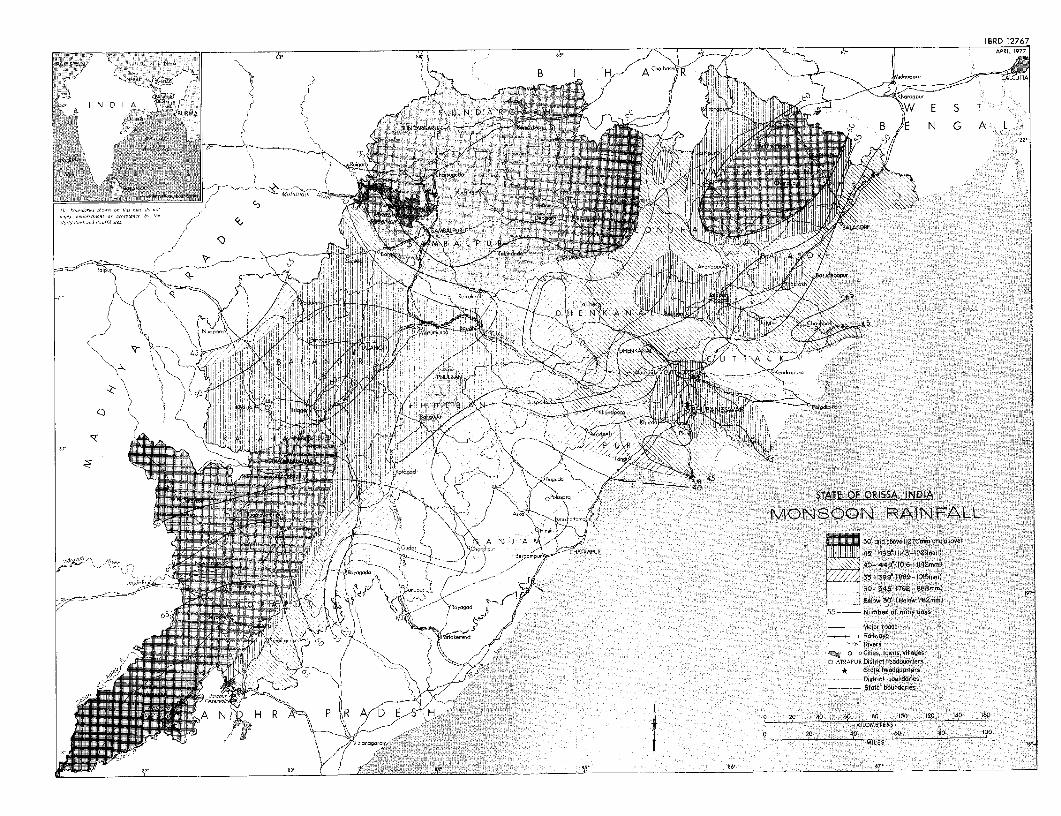
[BRD 12767
at 54 85 80 APRIL 1977~~~~~~~~~~~~~~~~~~~~~~~~~~~~~~~~~~~~~~~~~~~~~~~~~~PIL17
PAKISTA4] CKI N A
I N D I A 5G B Mdro- ~LUS ~~~~~~~~~~JN ~ ~ ~ ~
~~~~> INDIA K Shersapur~~~~~~~~~~~~~~~~~~~~~~~~~~~~~~~~~~~~~~~~BN
22~
ArWCAt-~ ~ ~ ~ ~ ~ ~ ~ ~ ~ ~ ~ ~ ~ ~ ~ ~ ~ ~~~~~~~~~~~TT OFORSA, NM
R RE~~~MNOO AiFL
4~~~~~~0 adsoekhormaraot
30- 3491762- 856mm)~~~~~~~20-J')J~~~~~~~~~~~~~~~~~~~~~~~~~~~~~~~~~~~~~~~~~~Blw3 Blw72m
Td,~~~~~~~~~~55 ubrofriydyt I WH~~~~~~~~~~~~~~~~~~~~~~~~~~~~~~~~~~~~~~~ao os
45~~~~~~~~~35 00Cte,lwsaIae
CTATEOFPI DRIStrcthaduater
MONSOON~Sat heAdquarter
A N A' A 50' aild abvm (1270M. Qnd…Dstrict aurdaemup 45~~~~~~~~~~~~~~~~~~~~tt -b4undaries29m
40487 t 112.
82 83' I 2P 49 rio to~~~~~~~~~~~~~~~~~~~~~~~~~~~~~~~~~~3 I'Ss ita0 140 l

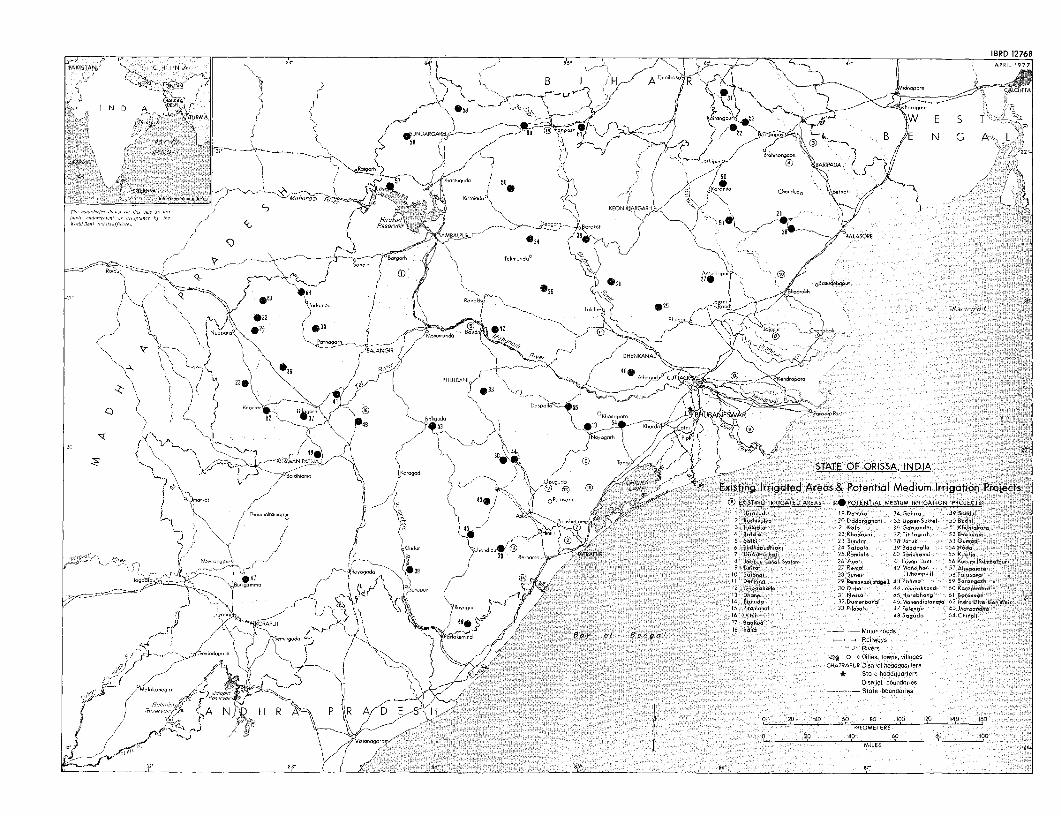
54, 661 54' 5" -~~~~~~~~~~~~~~~~~~~~~~~~~~~~~~~~~~~~~~ ~~I BRD 12768PAKISTAN,, - C H I N A
AP .RL 1977
0 t SRINK A w 9 I'. B Ilu H A C56R -t -t ( t" Misnvrn CALCdUTIAaB H R
>\ J 2 > \ t : ; r G < Q < 0 r e X / FN > -, } =X-'4< :; . 9\ ,,,, , ) g (' t STAIE OF OR SSA, IND A E
,!>A $v ,, -g~->>%-. N 1'.' >3u(vuo7ee Eitn Ir dAes&Ptnil eimIrgto rjcs
& b / < i- /J 3
' 'L._' V EitlSTiNG IRRiGtEDAREAS E4-POtENTIL MtDIUMDIRRiGATiO B E N G, APA r or~~~~~~~~~~~~~~~~~~~~~~~~~N A 2 C
400/ ' ' \ 7 y---'---- t 1 6/ c2a -'C Rro,onee * ii4Si-ol3 son 4
URNA 9 =---~ 90 6680 / *R & '4
U %V 0Slni ESelIJrmu; SRTIs
A 6o,gv / 1 / - (
o>, ? mkrulr v i .' 0 t <, g < CHATRAPUR iA4t,icthaeAdquArt-,~~~~~~~~~~~~~~~~~~~~~~~~~~~h, AD
JIF ,/50 yA t y D / S > 0 2 0 6 0 10 10 1, 6
K/ -- ortv,se J"4182 K/SIIOOCn 1rrd i ILS
C: j2 N 3' ( r ,fv Et' 8j' Ej'47'21
f. Thsr,,r-514 u4
026 2
*32 Bh.L~~~~~~~~~~~~~~~o' 5244 36
35 442
40 N~~~~~~~~~~~~~~~~~~~~~ -~~~~~~~0
x I I 00
' i . C43/ASAE FO ISA N I/2
/ / '-> ~~~~~~2/ ® 0 7 as'tijj-~~~~~UR Existing Irrigated Areas & Potential Medium Irrigation Projects/ N / ~ ~ ~ ~ ~ ~ ~ ,- C I <)(/%4r0 90 ~~~~~~~~4 3P,ElISRaN IRRIGATED) AREAS: 6450PTENTIAL MEDIUM IRRIGATION 8R60ECT15I Shoovrropvo C 10 Desuse 34 GoOse AoSendv~~~~~~~~~~~~~~~~~~~~~~~~~~~~~~~~~~~~~~I Dhk 3 .h 4s-~4 v ~ ~ ~ ~ ~ ~ ~ , ~~~~ UK Dodosegeosi 35 Unner Ovorel 03 SuShi~~~~~~~~~~ R,hkd. 0 .d.g~t 3 U -uk.1 boS.h
a 45 3 H.I.V ~~~~~~~ ~ ~~~~~~~~~~~~~~~~~~~~24 Knipe 34 B-i-deree 54 Kb-de
A B. ill 12~~3 Pileei,- /7 Teler--r v3 Jrerbnedt( r~~~~~~~~~vo, 3 Segoije 64 Chilire~~~~~~~~~~~~~~~~~~~~~~~~~~~~5 .kiS . 3 -1 ,G d
0468.1 Seelios~~~~~~~~~~~~~~~~~~~~~~~~~~~~~~~~~~~~~~~8J..'C"lS~-2 A,, 4 L-L1 5~~ N orlolerec Bay ci Bengal IA~~~~~~~~~~~~~~~~~~~~~~~~1 5,ehed 28 S- Mitor rvvvsI.-
( lOsIsot Dovndflr 65~~~~~~~~~~~~~~~~~~~~~~~~~~~~~~~~~~~~~~~~~~~~~~~~~G..h.30Dh 4 .- k.d~~~ ?o~~~~~~~~~r~- 14 -.-- 46 ote boun-dories, .!,< ~~~~~~~~~~~~~~~~~~ R~~~~~~~~~~~~~~~~~A H-'> ~ ~ ~ ~ ~ ~ ~~~~~~~~~~~3D-"31 .. 4 Hb-i.
,'/'>7".- 2 A 6 6 lTD 12.d 64 Ch 6-l
~~~~~ 0 20 44~~~~~~~~~~~~~~~~~~~~~~~~~~~
694 83 0Ct."-L .e3) I "~~~'~
CHATeoeAPO9O 6/lED,C he0w
"'0) I /~~~~~~~~~~~~~~~~~~~~~~~~~~~~~~~~~~~~~~~~~~~~~~~~~~~~~~~~~~~~~~~~~~~~~~ta~h.q.otrso. Se' 54'~~~~~~~~~~~~~~~~~~b d,,e

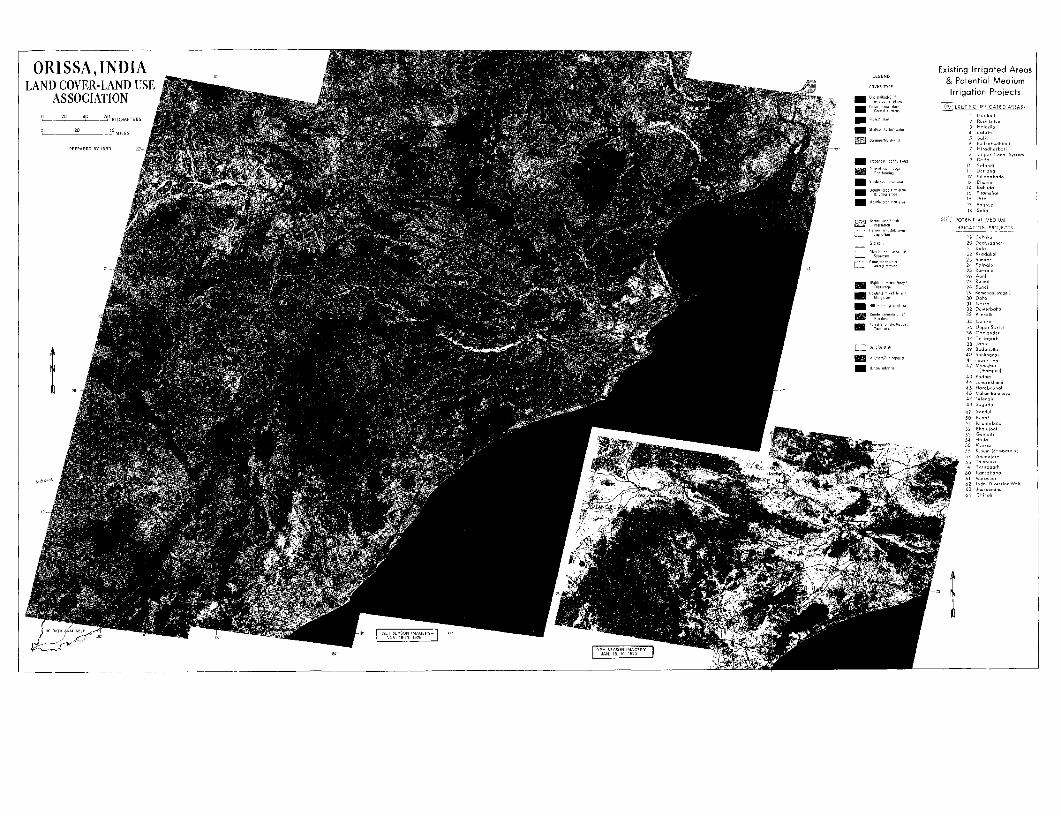
ORISSA, INDIA LAND) COVER-LAkND USE &PtnilMdu
ASSOCIATION ..- iaonPjet
4 5 4,4~~~~~~~~~~~~~~~~~~~~~~~~~~~~~~~~~~~~~~~~~~~~~~41
44~~~~~~~~~~~~~~~~~ , 4
m~~~~~~~~~~~~~~~~~~1m 5 6~~~~~~~~~~3
,wo~~~~~~~~~~~~~~~~~~~~~~~~~~~D3446
Sq ,H35Th '4.445.~~~~~~~~~~~~~~~~
Y2d4.44444
C.~~~~~~~~~~~~~2