
An Analysis of Section 529 College Savings and Prepaid Tuition Plans
43
Transcript of An Analysis of Section 529 College Savings and Prepaid Tuition Plans

AN ANALYSIS OF SECTION 529 COLLEGE SAVINGS AND PREPAID TUITION PLANS
A REPORT PREPARED BY THE DEPARTMENT OF TREASURY FOR THE
WHITE HOUSE TASK FORCE ON MIDDLE CLASS WORKING FAMILIES
SEPTEMBER 9, 2009
1
EXECUTIVE SUMMARY1 Making college education more affordable is a central goal of the Obama Administration and has been a focus of Vice-President Biden’s Taskforce on the Middle Class. To that end, the Task Force asked U.S. Treasury Department to prepare this report on how to make Section 529 college savings plans a more effective and reliable tool for families to save for college. The report discusses the benefits of 529s as a way to build savings for this critically important investment, the extent to which Section 529 plans serve various income groups, and how well the plans keep costs low so to maximize returns to savers. In addition, as requested by the Vice President, the report highlights exemplary practices and makes a set of recommendations on how to make Section 529 plans more effective and reliable. The report relies on information from a variety of sources, including academic research, an extensive database maintained by the College Savings Network (CSPN) on Section 529 plan features and investment options, and 66 submissions that were received in response to Treasury’s request for information posted in the Federal Registry.
BACKGROUND • A Section 529 plan is formally a “qualified tuition program.” These programs are
generally administered by the states. Currently, Section 529 plans are offered by the District of Columbia and all states except Wyoming, and one non-profit consortium of 127 private colleges that operates the Independent 529 Plan.
• Section 529 plans are of two general types, prepaid tuition plans and college savings
plans. In a prepaid tuition plan, tuition credits are purchased that entitle the beneficiary to a specified number of credit hours of future attendance at designated educational institutions. In a college savings plan, contributions are made to an investment account in which investment earnings accumulate free of federal tax, and from which account distributions are free of federal tax if used for qualified higher educational expenses. Both types of Section 529 plans receive the same federal tax benefits, which are analogous to a Roth Individual Retirement Account (IRA). In both cases, prepayments (or contributions) are made out of after-tax dollars, investment returns are untaxed, and the value of the education the investments finance is also untaxed.
• Distributions from college savings accounts are not subject to federal tax only if used
for the beneficiary’s qualified higher education expenses. Those expenses include tuition, fees, books, supplies, and equipment required for the enrollment or attendance at an eligible educational institution, and room and board expenses if the beneficiary is enrolled at least half time. In 2009 and 2010 only, computer purchases are also a qualified educational expense. Distributions not used to pay for qualified higher
1 This report can be found at www.treas.gov/press/releases/docs/529.pdf.

2
education expenses can be made to either the beneficiary or the account owner, but the portion of distributions constituting investment earnings are taxed at a penalty rate equal to the recipient’s ordinary tax rate plus 10 percentage points.
• Section 529 plans also convey substantial state tax benefits. All states except
Alabama do not tax Section 529 plan investment returns or Section 529 distributions to the extent that they are used for qualified higher education expenses, and a majority of states offer either a deduction or a credit for contributions to their own Section 529 plan.
• In order to avoid misuse, Section 529 savings plan contributions are limited to what is
necessary to finance the qualified education expenses of the beneficiary. States satisfy this requirement by refusing additional contributions to accounts once the account balance exceeds a dollar limit. This limit currently varies from $224,465 to $368,600 among the states, and equals or exceeds $300,000 in 29 states. These limits are per beneficiary per state. However, because 43 of the 48 states offering a Section 529 savings plans are open to non-residents, a particular beneficiary can have accounts in as many as 44 states, each with a contribution limit of $224,465 or more.
• Section 529 savings plans are of two general types—advisor sold plans offered
through financial advisors, and direct sold plans for which individuals sign up and select investment options without a financial advisor as intermediary. For advisor sold plans, fees include periodic charges levied as a percent of account balances, “loads” levied either as a percent of asset purchases (front-load fees) or asset sales (back-load fees), and fixed-dollar annual account maintenance fees that are generally $50 or less. Direct sold plans assess only periodic charges on account balances and possibly annual maintenance fees; they do not impose load fees on purchases or sales. Advisor sold plan fees include compensation for the advisors, which contributes to fees being higher for advisor sold plans that for direct sold plans.
• Section 529 savings plans tend to offer a variety of investment options that
accommodate a wide variety of tastes concerning the tradeoff between risk and expected return. The investment options are almost always retail mutual funds offered to the general public, or combinations of such funds. Fees are higher than for the underlying retail funds because they include a program manager fee and most often a state fee as well.
• The most popular Section 529 investment option is an age-based fund with an asset
mix that is heavily weighted toward equities when the beneficiary is young but automatically becomes more weighted toward fixed income assets as the beneficiary approaches college age. Forty-nine of the 55 direct sold plans, and 22 of the 27 advisor sold plans, offer age-based options. About 60 percent of Section 529 assets managed by one financial services company that manages six direct sold plans are in age-based funds. Only 23 states offer age-based index funds, however.
3
PRINCIPAL FINDINGS • Section 529 plans are an attractive and convenient means of saving for college that
offer substantial tax benefits. Illustrative calculations indicate that existing tax benefits can increase the effectiveness of saving by between 6 percent and 39 percent depending on the tax bracket of the saver, the length of the savings period, and whether there is a state deduction or credit for contributions. Other factors might influence the relative after-tax returns earned in taxed accounts and Section 529 accounts, such as investment management fees.
• Not surprisingly, Section 529 account balances and annual contributions appear to be
skewed toward higher income families than is income. Possible explanations for this distributional outcome include: the tax benefits are greater for high-income families as they face higher tax rates; the savings rate in general increases with income as wealthier households need to spend a smaller share of their income on necessities such as food and clothing, and the likelihood of a child attending college increases with family income.
• The current distribution of Section 529 account balances and contributions across
income groups may not be problematic. It could be argued, for example, that the most effective way to help low income families with college expenses is through direct student aid, and that Section 529 plans are therefore naturally targeted to higher income families. It is for this reason that the report focuses on making Section 529 plans more accessible, effective and reliable for the middle class.
• Age-based index funds are offered by only 24 plans in 23 states. Index funds are
passively managed so as to mirror the performance of a specific asset bundle, such as the 500 stocks making up the S&P 500 index. Since portfolio decisions are automatic and transactions are infrequent, expenses tend to be lower than those of actively managed funds. Index funds have been found to have two major advantages over actively managed funds. First, because of their low fees, they on average perform well relative to actively managed funds and have a large following in the investment community. Second, they are well suited to investors who do not wish to spend time acquiring information and evaluating the investment philosophy and track records of the various actively managed funds that are offered.
• There is substantial variation in investment management fees across the 24 age-based
index funds, likely reflecting variance in the administrative efficiency across plans that persists because limited inter-plan competition.
• A major reason for this lack of competition between state plans is that currently 34 of
the 42 states that both have an income tax and sponsor Section 529 savings plans offer either a state income tax deduction or a credit for contributions to their own Section 529 plan, but only five of those states offer a corresponding deduction or credit for contributions by in-state residents to Section 529 plans sponsored by other states. In addition, 13 states exclude all or some Section 529 account balances from

4
assets for purposes of calculating eligibility for state student financial aid, but none of those states offer a similar exclusion for the Section 529 account balances held by residents in the plans of other states. As a result of this “home-state bias,” families have strong incentives to choose their home state plan even if other plans offer preferable investment choices.
RECOMMENDATIONS
The report recommends five approaches to making Section 529 savings plans more attractive, effective and reliable for middle class families, and those who aspire to join the middle class through college attendance. Among the recommendations are the following: • Provision of Age-Based Index Funds. Age-based investment funds are very popular
and are well suited to the circumstances of many middle class families that are saving for college. Yet five of the 48 states offering a direct sold savings plan do not offer an age-based fund. Moreover, only 23 of the 43 states that do offer an age-based fund offer it in the form of index funds. Historically, index funds have performed well relative to actively managed funds because they have low fees, and they are especially well suited for investors who do not wish to spend time acquiring information and evaluating the investment philosophy and track records of actively managed funds.
• Eliminate Home-State Bias. If home-state bias in state tax and student aid policies
were eliminated, the result would be more investment options for consumers, more intense competition between plans, and very likely lower fees. To the extent that there are economies of scale in plan administration, consumers will also benefit from additional scale and lower costs.
• Per Beneficiary Contribution Limits. Currently there are effectively no limits on
Section 529 account balances. Because 43 states offer plans open to residents in other states, a beneficiary can have accounts in as many as 44 states, each state with a limit exceeding $224,465. Putting an effective limit on Section 529 contributions requires making the limits per beneficiary rather than per beneficiary per state. Per beneficiary limits would reduce the tax benefits to high income families and, by lowering federal tax expenditures for the program, would potentially free up federal resources for education aid that could be targeted to low and middle income families. Per beneficiary limits would best be enforced at the time distributions are made. Specifically, each distribution for a particular beneficiary’s qualified educational expenses would be divided into a principal portion counting against the contribution limit and an earnings portion. At such time as a beneficiary reaches the contribution limit, distributions would be nonqualified and subject to penalty.
1
I. INTRODUCTION As part of its investigation into how to make college more affordable for middle class families, the Vice President’s Middle Class Task Force asked that the U.S. Department of the Treasury study ways of making Section 529 plans more effective and reliable. This report is the culmination of that study. It discusses the extent to which Section 529 plans serve various income groups, and how well the plans keep costs low and offer prudent investment choices so as to maximize returns and minimize risk to savers. In addition, as requested by the Vice President, the report highlights exemplary practices. The report relies on information from a variety of sources, including academic research, an extensive database maintained by the College Savings Network (CSPN) on Section 529 plan features and investment options, and 66 submissions that were received in response to Treasury’s request for information posted in the Federal Registry. Treasury met with representatives of CSPN, the College Savings Foundation (CSF), the New America Foundation, the Center for Social Development at Washington University in St. Louis and several individuals to hear their views on the value of Section 529 plans and how they might be made more effective and reliable for middle class families.2
II. HOW SECTION 529 PLANS WORK A Section 529 plan is formally a “qualified tuition program.” Section 529 refers to a section of the tax code that gives rules by which qualified tuition programs must abide in order to receive favorable federal tax treatment. Such programs can be administered by the 50 states and the District of Columbia, and by one or more eligible educational institutions. Currently, Section 529 plans are offered by the District of Columbia, and all states except Wyoming, and one non-profit consortium of 127 private colleges that operates the Independent 529 Plan. Section 529 plans are of two general types, prepaid tuition plans, and college savings plans. In a prepaid tuition plan, tuition credits or certificates are purchased on behalf of a beneficiary that entitle the beneficiary to a specified number of credit hours of future attendance at designated educational institutions, and the plan sponsor maintains a Trust that invests the prepayments and uses the proceeds to finance the tuition promised. In a college savings plan, contributions are made to an investment account with a designated owner and a designated beneficiary, the investment earnings accumulate free of federal tax, and account distributions are also free of federal tax if used for the beneficiary’s qualified higher educational expenses. While the two types of Section 529 plans appear dissimilar, they in fact receive the same federal tax benefits, which are analogous to a Roth Individual Retirement Account (IRA). In both cases, prepayments (or contributions) are made out of after-tax dollars, investment returns are untaxed, and the value of the education the investments finance is also untaxed.
2 Treasury also worked with the CSPN and CSF to devise a survey questionnaire that was distributed to Section 529 plan administrators. Unfortunately the survey data were not available in time to include in this report. Those data should be valuable for future follow-up analyses of Section 529 plans, however.
2
While Section 529 plans are overseen by the states, all except five states contract out all or most of the management and recordkeeping functions to financial services companies, and all states contract out investment management services to financial services companies. Distributions from college savings accounts are not subject to federal tax if used for the beneficiary’s qualified higher education expenses. Those expenses include tuition, fees, books, supplies, and equipment required for the enrollment or attendance at an eligible educational institution, and room and board expenses if the beneficiary is enrolled at least half time. In 2009 and 2010 only, computer purchases are also a qualified educational expense. Distributions not used to pay for qualified higher education expenses can be made to either the beneficiary or the account owner, but the portion of distributions constituting investment earnings are taxed at a penalty rate equal to the recipient’s ordinary tax rate plus 10 percentage points. Section 529 plans also convey substantial state tax benefits. The District of Columbia and all states except Alabama do not tax Section 529 plan investment returns or Section 529 distributions to the extent that they are used for qualified higher educations expenses. (Alabama does not tax distributions taken from its own plan, but does tax distributions taken from plans administered by other states.) In addition, 34 of the 42 states that both have an income tax and sponsor Section 529 savings plans offer either a deduction or a credit for contributions to their own Section 529 plan, and five of those states offer a deduction for their taxpayers who make contributions to Section 529 plans regardless of the state that administers the plan. State tax treatment of Section 529 savings plans is summarized in Table 1. Section 529 savings plans are required to provide safeguards to prevent contributions on behalf of the designated beneficiary that exceed what is necessary to finance the qualified education expenses of the beneficiary. States offering savings plans (all except Tennessee, Washington, and Wyoming) satisfy this requirement by refusing contributions to accounts once the account balance exceeds a dollar limit. This limit currently varies between $224,465 and $368,600, and equals or exceeds $300,000 in 29 states.3 These limits are per beneficiary per state. Because 43 of the 48 states offering a Section 529 savings plans are open to non-residents, a particular beneficiary can have accounts in as many as 44 states, each with a contribution limit of $224,465 or more. Contributions to Section 529 accounts can be made by anyone and constitute completed gifts to the beneficiary for purposes of estate and gift tax. Unlike other gifts, however, it can be elected that contributions be treated as if they were made over a five year period; hence, gift tax is avoided if contributions over a five year period do not exceed $65,000 for single taxpayers and $130,000 for married couples (the current annual threshold multiplied by five). 3 Most states base their limit on the cost of four years of undergraduate education and three years of graduate education, an approach sanctioned in a IRS private letter ruling to the New York State 529 savings plan.

3
A Section 529 account must have one and only one beneficiary designated at all times. But the account owner can designate another family member as the beneficiary at any time, and can transfer balances to another account with a different same-family beneficiary. Hence a family with several children might have one account while the children are young, and could use that account to spawn others at such time as more than one child incurs qualified education expenses. Section 529 plans came about as a result of Michigan’s introduction of the first prepaid tuition plan in 1988. After much legal wrangling over the tax implications of the plan, the Internal Revenue Code was amended in 1996 to explicitly convey favorable tax treatment to Qualified Tuition Programs, albeit less favorable than today’s tax treatment. Earnings on investments financed with prepayments and held in trust by state sponsors of prepaid plans were treated like returns earned on municipal securities and hence were free from federal tax, but beneficiaries were made subject to tax on any difference between the value of education received and the amount of prepayments made. Similarly, the law made possible college savings plans where earnings were untaxed until withdrawn. In both cases, the tax benefit derives from the fact that tax on investment earnings is deferred and so compounding of earnings can accrue tax free. It was not until 2001 that the current tax rules making distributions entirely tax free were put in place with passage of the Economic Growth and Tax Reconciliation Act of 2001. Those provisions, which were set to sunset in 2010, were later made permanent with passage of the Pension Protection Act of 2006. Because Section 529 assets are considered municipal securities, they are not subject to the same regulations as other investments. Specifically, Section 529 plans are exempt from the Investment Company Act of 1940, the Securities Act of 1933, and the Exchange Act. Thus, fees, returns, and other standard disclosures are not required, and Section 529 brokers are subject to the oversight of the Municipal Securities Rulemaking Board (MSRB) rather than the SEC. In response to concerns that disclosures were inadequate, the College Savings Plans Network (CSPN), in cooperation with the SEC and the MSRB, has developed voluntary disclosure agreements covering Section 529 plan returns, fees, and state tax benefits. The most recent agreement was agreed to by all plans in July 2005.4
III. THE GROWTH OF SECTION 529 PLANS Section 529 assets have grown rapidly since qualified distributions were made tax-free in 2001. Between the fourth quarter of 2001 and 2007, total assets grew nearly nine-fold to $130 billion from $14 billion (see Figure 1). The collapse of asset prices in the latter part of 2008 caused total assets to fall 19 percent to $105 billion at year end. More recent data are not available, but total assets have undoubtedly risen in tandem with the stock market (the total return on the S&P500 was 14 percent between 12/31/2008 and 8/28/2009).
4 Alexander and Luna (2009).
4
At the end of 2008, about 88 percent of Section 529 assets were in savings plans and 12 percent were in prepaid plans. Those shares at the end of 2001 were 82 percent and 18 percent, respectively.
IV. QUANTIFYING THE TAX BENEFITS OF SECTION 529 PLANS
The tax benefits of Section 529 plans are similar to those of a Roth IRA. Savings are financed with after-tax dollars, and investment returns and distributions are untaxed if used to finance qualified education expenses. Relative to saving for college in an ordinary investment account, the benefits of this tax treatment depend on the taxpayer’s tax rates and the extent to which an ordinary taxed account yields interest, which is taxed at ordinary income tax rates, as opposed to dividends and capital gains, which are taxed at lower rates. To illustrate the tax benefits of Section 529 plans, the amount of future real college expenses that can be financed with a given amount of savings will be compared for the case where the saving is done in an ordinary taxed account and where it is done in a Section 529 account. For this illustration, it is assumed that annual pretax investment returns are 6.5 percent (4 percent real), and that the breakdown of pretax returns is 40 percent interest, 24 percent qualified dividends, and 36 percent qualified capital gains. An initial $1,000 investment is assumed to accumulate for a set number of years before four annual distributions are taken that exhaust the account and that, after taxes are paid, finance a constant real amount of college expenses. During the account’s accumulation phase, it is assumed that asset reallocation results in 10 percent of capital gains earned each year to be realized and subject to capital gains tax. During the four-year payout phase, capital gains realizations subject to tax are entirely due to asset sales financing college expenses. The comparisons depend importantly on the account owners’ tax rates. Three different sets of assumptions are considered, each corresponding to a different level of income. The tax rates assumed are shown in Table 2. Because the comparisons assume that all account types earn the same pre-tax return, they reveal only relative tax benefits of Section 529 plans. Other factors might influence the relative after-tax returns earned in taxed accounts and Section 529 accounts. One such factor is account management fees, which are analyzed in Section VIII. The comparisons reported in Table 3 show that Section 529 savings plans potentially offer very substantial tax benefits. Consider, for example, the last row of the table that concerns a high income person and a 15 year accumulation period. Under the assumptions stated, $1,000 contributed to a fully taxed account in Year 1 would finance $1,465 of real college expenditures if taken in four equal annual installments beginning in in year 16 (see column 2). If the $1,000 were instead invested in a Section 529 account not receiving a state tax deduction, the real expenditures the investment would finance during college would increase 30 percent to $1,908 (see columns 3 and 6). With a state

5
tax deduction for Section 529 contributions, the Section 529 account would finance $122 more real college expenses ($2,030 total), or 39 percent more than would be financed by a taxed account. Table 3 shows that the tax benefits of Section 529 accounts increases with income and with the length of the accumulation period. Higher income means higher tax rates apply to the taxed account, which increases the value of earning tax free returns. And the benefit of tax-free returns relative to taxed returns is of course larger the longer the money is invested. Relative to a taxed account, the incremental value a Section 529 account without a state tax deduction for contributions varies from 6 percent for the low income person and a 5 year accumulation phase to 30 percent for the high income person and a 15 year accumulation phase. In the case of a Section 529 account with a state tax deduction, the incremental value ranges from 13 percent to 39 percent. As has been noted, distributions from Section 529 plans are tax free only if they finance qualified education expenses of the beneficiary. In the alternative case, distributions are taxed to the extent that they represent account earnings, and those earnings are taxed as ordinary income to the recipient (either the account owner or the beneficiary), and in addition a penalty tax is imposed at the rate of 10 percent. Columns 5, 8, and 9 of Table 3 concern this possibility. In the case of the low income earner and a 5 year accumulation phase, for example, the constant real expenditure the account can finance in years 6-10 is reduced 5 percent relative to a taxed account (see column 8). When the tax penalty for “nonqualified distributions” is expressed as a percent of the value of a taxed account as in column 8 of Table 3, it rises with income. This is because the absolute tax penalty—the numerator—tends to rise with income, and the value of a taxed account—the denominator—declines with income. The absolute tax penalty tends to rise with income because it depends on the difference between the ordinary income tax rate (the only tax rate that matters in the tax penalty case) and the tax rate on qualified dividends and capital gains that are germane in the case of a taxed account—a difference that tends to rise with income.5 6 Parents not certain their child will go to college and deciding whether to open a Section 529 savings account must weigh the advantage of the account if the child goes to college against the disadvantage if the child does not go to college. One way of thinking about the decision is in terms of the expected value of the account, which is the gain if the child
5 The penalty for using Section 529 account monies for purposes other than to finance qualified education expenses is not entirely due to the 10 percent penalty rate. Relative to taxed account, a penalty account gets the advantage of deferring all taxes until money is withdrawn, but all earnings are taxed at the ordinary income tax rate (even if the accrue in the form of dividends and capital gains that ordinarily have relatively low tax rates). For the cases illustrated, there would be a penalty on net even if a 10 percent penalty rate were not imposed. 6 It is perhaps surprising that the column 8 entries increase with the length of the accumulation phase. Taxes are entirely deferred in the penalty case, and one might think that the tax penalty gets less severe the longer taxes are deferred. But taxes are also partly deferred in the ordinary tax case, and tax rates are lower. As a result, the column 8 entry initially rises with the accumulation phase length before ultimately declining.
6
goes to college times the probability of the child going to college minus the loss if the child does not go to college times the probability of that occurring. For example, in the case of a low income individual and a 10 year accumulation period, the potential gain from a Section 529 account—the difference between column 2 and 3 of the table—is $145 of real spending during college, and the loss if the child does not go to college—the difference between columns 5 and 2, is $100 of real spending during college. In this case, the expected value of the Section 529 account is zero or positive if the probability of the child not going to college is 59 percent or less (0.59 x $100 = 0.41 x $145). This break-even probability of taking nonqualified distributions from the account and incurring a penalty is shown in column (9) of the table. The breakeven probability tends to rise with income, meaning that the penalty for nonqualified distributions is more onerous, other things equal, the lower is the account owners income and tax rates. There is a slight exception between the medium and high income individuals. Continuing with the case of a 10 year accumulation period, the break-even penalty probability is 59 percent, 71 percent, and 68 percent for the low, medium, and high income individuals, respectively. This measure is lower for the high income individual than for the medium income individual because those two individuals differ only with regard to the tax rate on ordinary income (they face the same tax rates on qualified dividends and capital gains), and that tax rate is more important for the absolute tax penalty than it is for the potential gain from a Section 529 account. The Table 3 illustrations do not incorporate the matching grants some states provide for certain Section 529 account holders. Currently, ten states progressively matching contributions of low and middle income families. As shown in Table 4, the Louisiana grants are at relatively low rates but are uncapped, and those of the other nine states are at higher rates but with caps that range from $200 to $1,000 per year. Section 529 plans are especially attractive to families qualifying for matching contributions provided they are confident they will have qualifying educational expenses to finance.
V. OTHER TAX-PREFERRED VEHICLES FOR COLLEGE SAVINGS Section 529 plans are one of several tax-preferred options households have to save for college, and this section compares them to other existing alternatives. Coverdell Educational Savings Accounts A Coverdell Educational Savings Account (ESA) offers the same federal tax benefits as does a Section 529 account. Contributions are made out of after-tax income, investment earnings are untaxed, and withdrawals are untaxed if used for a special Coverdell definition of qualified educational expenses. Notable differences between Coverdell ESAs and Section 529 plans include:
• Annual Coverdell contributions cannot exceed $2,000 for any one beneficiary (aggregated across accounts), and the amount that can be contributed by any one contributor is also limited. The limit on an unmarried contributor’s contribution is $2,000 if modified adjusted gross income (MAGI) is less than $95,000, and is
7
gradually reduced to zero for modified adjusted gross income between $95,000 and $110,000. The modified adjusted gross income thresholds are doubled for married taxpayers filing jointly.
• Coverdell qualified education expenses include certain expenses for elementary and secondary education.
• The Coverdell ESA is necessarily owned by the beneficiary, in contrast to Section 529 accounts, which do not require the account owner and beneficiary to be the same person. If a Coverdell owner is a minor, a parent or guardian must be appointed the “responsible individual” who makes investment decisions, but that person can take distributions only to pay for the beneficiary’s qualified educational expenses. The beneficiary or “responsible individual” can designate another family member as beneficiary.
Education Savings Bonds Educations savings bonds (ESBs) are series EE and Series I U.S. Treasury bonds. Interest on these bonds is untaxed by state and local governments and, if the taxpayer satisfies certain income requirements at the time of redemption, is also untaxed by the federal government and to the extent that the bond redemption proceeds are used to finance qualified higher education expenses. Qualified educational expenses exclude room and board. In 2009, the interest exclusion was phased out for modified adjusted gross income (MAGI) between $100,650 and $130,650 if married filing jointly, and for MAGI between $67,100 and $82,100 if single. To the extent that redemptions of ESB interest are excluded from tax, aside from a possible state tax deductions or credits for Section 529 contributions, the tax benefits of these bonds are the same as for Section 529 accounts. However, Section 529 accounts have two major advantages over ESBs: They offer much more flexibility in the range of investment options that are available (this is documented in Section VIII), and they potentially reduce student financial aid less than ESBs. Regarding student financial aid, ESB interest raises the “expected family contribution” (EFC) to a child’s educational expenses, whereas Section 529 earnings and distributions have no effect on the EFC. Individual Retirement Accounts Normally distributions from Individual Retirement Accounts (IRAs) are subject to a penalty tax if taken prior to age 59-1/2. An exception to this rule occurs when the distributions are used to finance qualified educational expenses that are defined the same as for Section 529 plans. IRAs are usefully divided into three types, traditional IRAs for which contributions are deductible and distributions wholly taxed at ordinary income tax rates when taken (deductible traditional IRAs), Roth IRAs for which contributions are made with after-tax dollars and all distributions are untaxed, and traditional IRAs for which contributions are not deducted and the earnings portion of distributions are taxed at ordinary income tax
8
rates when taken (non-deductible traditional IRAs).7 The general annual contribution limit for IRAs is $5,000 ($6,000 if age 50 or older). Lower limits can apply as is discussed below. The tax advantages of financing educational expenses with a Roth IRA are identical to that of a Section 529 account provided the amount withdrawn does not exceed total contributions. In that case, after tax dollars are contributed and withdrawals are entirely untaxed. (The earnings accumulated in a Roth IRA must be withdrawn after Age 59-1/2 to escape taxation.) The tax advantages are quantitatively the same in the case of deductible traditional IRA provided the taxpayer’s income tax rate is the same at the time contributions are made as at the time distributions are taken. For example, consider a taxpayer with a 25 percent tax rate at all times. That taxpayer might contribute $750 to a Roth IRA that doubles in value over ten years to $1,500, and the entire balance would be available to finance college expenses. Alternatively, the taxpayer could invest $1,000 in a traditional deductible IRA and experience the exact same cash flows. At the time of the contribution, $1,000 would be invested but $250 of that is financed with the reduction in federal taxes that comes about because the $1,000 contribution deducts from taxable income. And after ten years, the account would be worth $2,000, 75 percent ($1,500) of which would be available to finance college expenses. Non-deductible traditional IRAs are a less tax favored means of financing college expenses than Section 529 plans. This type of IRA merely defers taxes on investment earnings rather than leaving them entirely untaxed as with a Section 529 plan. Deductible traditional IRAs and Roth IRAs are not available to everyone. The contribution limit for a deductible traditional IRA is the general limit for someone without an employer provided pension plan. For others, the annual contribution maximum starts at the general limit and is reduced gradually to zero for modified adjusted gross income (MAGI) between $55,000 and $65,000 (single) and $89,000 and $109,000 (married filing jointly). The Roth contribution limits are a limit that would apply if the taxpayer does not contribute to a traditional IRA (the Roth-only limit) less the amount contributed to a deductible and non-deductible traditional IRAs. The Roth-only limit is the general limit for someone without an employer provided pension plan. For others, the limit is the general limit gradually reduced to zero for MAGI between $105,000 and $120,000 (single) and $166,000 and $176,000 (married). The contribution limit for non-deductible traditional IRAs is the general limit less amounts contributed to deductible traditional IRAs.
7 Technically there are just two types of IRAs, traditional IRAs and Roth IRAs. A traditional IRA account can receive both deductible and non-deductible contributions, and the division between the two types of contributions is kept track of via the basis calculation. To simplify the exposition, this discussion imagines an IRA account that is 100 percent funded either with deductible contributions or with non-deductible contributions.
9
A major advantage of IRAs over Section 529 plans is that withdrawals can be taken without penalty for any reason after age 59-1/2. A parent therefore does not risk being penalized in the event that their child incurs fewer qualified educational expenses than expected. However, saving for college in an IRA is much more likely to reduce a student’s financial aid than is saving in a Section 529 account. IRA distributions raise the “expected family contribution” (EFC), whereas Section 529 distributions have no effect on the EFC. On the other hand, Section 529 account assets raise the EFC while IRA assets have no effect on the EFC. On balance, for families with income not so low that their EFC is negative, or so high that their EFC exceeds the cost of college attendance, the IRA reduces financial aid over four years of college much more than does a same-size Section 529 account.
VI. THE DISTRIBUTION OF SECTION 529 TAX BENEFITS This section first examines how participation in Section 529 plans vary with household income, and concludes that existing data—while limited—suggest that Section 529 usage is highly skewed toward higher income groups. Approaches to better target Section 529 benefits to the middle class are then considered.
A. THE EMPIRICAL EVIDENCE Participation in Section 529 plans is likely to increase with income for three principal reasons. First, the tax benefits of a Section 529 plan increase with a family’s tax rate, which increases with their annual income. Second, the savings rate in general increases with income as wealthier households need to spend a smaller share of their income on necessities such as food and rent. Finally, the likelihood of a child attending college increases with family income. Data relating Section 529 participation to income is limited because plan administrators generally have no need for it. Treasury was able to obtain such information from only two states, Lousiana and Kansas. Treasury also analyzed data from the 2007 Survey of Consumer Finances (SCF), which is collected by the Federal Reserve Board. Each of these datasets has its weaknesses. The Louisiana and Kansas data are likely to be highly accurate because they draw from actual administrative records, but may not be representative of all plans across the country. The SCF data are for a national sample, but the sample size is relatively small and responses are probably subject to substantial measurement error as they rely on individual self-reports of income and assets. For our purposes, the best of these three data sources may be Louisiana. Louisiana offers progressive matching contributions at rates ranging from 14 percent for families with federal adjusted gross income (AGI) less than $30,000 to 2 percent for families with AGI greater than $100,000. Because the plan administrator verifies the AGI of account contributors in order to determine the state’s matching contribution, it can tabulate
10
average account balances by AGI class as is done in Table 5. The table shows that Louisiana Section 529 account balances are substantially more skewed toward high income families than is income. In 2008, Louisiana taxpayers with 2007 federal AGI in excess of $200,000 accounted for 2 percent of Louisiana tax returns and 22 percent of Louisiana federal AGI, but fully 42 percent of Louisiana Section 529 account balances. For taxpayers with federal AGI $100,000 and higher, the shares were 9 percent of returns, 43 percent of federal AGI, and 72 percent of Section 529 account balances. The Louisiana data also demonstrate that Section 529 participation rates rise rapidly with income. Relative participation rates can be inferred by comparing the share of tax returns and the share of accounts falling into each AGI category. For example, taxpayers with federal AGI less than $100,000 account for 91 percent of taxpayers and 54 percent of accounts, while taxpayers with AGI greater than $100,000 account for 9 percent of taxpayers and 46 percent of accounts, meaning that the participation rate is about 9 times higher for the higher income group than the lower income group. Nevertheless, it is noteworthy that taxpayers with federal AGI less than $100,000 account for over half of Louisiana’s Section 529 accounts. Data from the Kansas Department of Revenue shown in Table 6 are similar to the Louisiana data except that they concern Section 529 contributions rather than account balances. Kansas offers a state income tax deduction for Section 529 contributions that is capped at $3,000 per beneficiary for a single taxpayer and $6,000 per beneficiary for a married couple filing jointly. The table shows Section 529 contributions deducted from 2007 Kansas taxable income by 2007 federal AGI category. Taxpayers with AGI in excess of $250,000 accounted for 1 percent of Kansas tax returns, 17 percent of federal AGI in Kansas, 18 percent of taxpayers claiming a Section 529 deduction, and 37 percent of deducted contributions. And for taxpayers with federal AGI $100,000 and higher, the shares were 11 percent of returns, 46 percent of federal AGI, 63 percent of taxpayers claiming a deduction, and 81 percent of deductions for Section 529 contributions. Comparing the above $100,000 findings to the Louisiana findings, it appears that deducted contributions in Kansas are somewhat more skewed toward high income taxpayers than are total Section 529 balances in Louisiana. But Kansas caps these deducted contributions at relatively low levels, so it is possible that total (uncapped) contributions in Kansas are even more skewed toward high income taxpayers than are account balances in Louisiana. Another source of information on the distribution of Section 529 account balances by income is the Survey of Consumer Finances (SCF), which is summarized in Table 7. This dataset suffers from a small sample size and probably substantial measurement error relative to state administrative data because it requires subjects to self-report income and asset information. While the SCF asked households about Section 529 accounts, the public database does not distinguish between a Section 529 account and a Coverdell ESA account. Hence the table concerns the aggregate of those two account types. The inclusion of Coverdell
11
ESAs almost certainly causes account balances and participation to be more equal across income groups due to the low Coverdell ESA contribution limits. The top part of Table 7 reports the percent of survey households with children that report having a Section 529/Coverdell account for six income groups: the 1st, 2nd, and 3rd income quartiles, and the top quartile subdivided into the 75-90th percentile range, the 90-95th percentile range, and the 95-100 percentile range. Participation grows rapidly from less than 1 percent in the lower half of the income distribution to over 30 percent in the 95-100 income percentile range. The standard errors reported below the estimates indicate that the differences are statistically significant. The lower part of Table 7 concerns account balances for households with children who report having a Section 529/Coverdell account. It shows that average account balances also rise rapidly with income. The average account balance is about $8,000 in the 0-75 percentile group, about $15,000 in the 75-90 percentile group, about $30,000 in the 90-95 percentile group, and over $100,000 in the 95-100 percentile group. While these averages have high standard errors, the differences are statistically significant between each of the top three groups. The SCF data suggest that account balances tend to rise with income in a manner consistent with the Louisiana and Kansas data. Account balances as a percent of income average about 10 percent in the 0-75 percentile group, about 13 percent in the 75-90 percentile group, about 16 percent in the 90-95 percentile group, and about 25 percent the 95-100 percentile group. But high standard errors indicate that the estimates are imprecise.
B. APPROACHES TO BETTER TARGET SECTION 529 BENEFITS TO MIDDLE CLASS FAMILIES
Make Section 529 Contribution Limits Per Beneficiary Section 529 savings plans are required to provide safeguards to prevent contributions on behalf of the designated beneficiary to exceed what is necessary to finance the qualified education expenses of the beneficiary. States offering savings plans satisfy this requirement by refusing contributions to accounts once the account balance exceeds a certain dollar limit. Most states base their limit on the cost of four years of undergraduate education and three years of graduate education, an approach sanctioned in an IRS private letter ruling to the New York State Section 529 savings program. As a result the limits are very high, varying between $224,465 and $368,600, and exceeding $300,000 in 29 states. Moreover, these limits are per beneficiary per state. Because 43 of the 48 states offering a Section 529 savings plans are open to non-residents, a particular beneficiary can have accounts in as many as 44 states, each with a contribution limit of $224,465 or more. In effect, there is currently no limit on Section 529 contributions. Putting a true limit on Section 529 contributions requires making the limits per beneficiary rather than per beneficiary per state. Per beneficiary limits would reduce the
12
tax benefits to high income families and, by lowering federal tax expenditures for the program, would potentially free up federal resources for education aid better targeted to low and middle income families. The current contribution limits are based on the account balance at the time a contribution is made, an approach that would be very difficult to administer if a beneficiary has accounts in more than one state and the limit were per beneficiary. A per beneficiary limit would be more workable if the limit were imposed on total contributions and if the limit were enforced at the time distributions are made. In such a scheme, each distribution for a particular beneficiary’s qualified educational expenses would be divided into a principle portion counting against the contribution limit and an earnings portion. At such time as a beneficiary reaches the contribution limit, distributions would be deemed nonqualified and subject to penalty. State Matching Grants Grants progressively matching Section 529 contributions are a promising means of increasing Section 529 savings plan participation of lower income families. Ten states offer such grants (Table 4). Those states’ experiences could be instructive to other state plans.
VIII. SECTION 529 SAVINGS ACCOUNT INVESTMENT OPTIONS AND FEES While Section 529 plans are overseen by the states, all except five states contract out all or most of the management and recordkeeping functions to financial services companies, and all states contract out investment management services to financial services companies. Service providers are presumably selected based on their proposals for investment options, services provided, and fees charged, as well as their reputations for quality service. Section 529 savings plans are of two general types—advisor sold plans offered through financial advisors, and direct sold plans that allow individuals to sign up and select investment options via the internet without the aid of a financial advisor. For advisor sold plans, fees include periodic charges levied as a percent of account balances, “loads” levied either as a percent of asset purchases (front-load fees) or asset sales (back-load fees), and fixed-dollar annual account maintenance fees that are generally $50 or less. Direct sold plans assess only periodic charges on account balances and possibly annual maintenance fees; they do not impose load fees on purchases or sales. Advisor sold plan fees include compensation for the advisors, which contributes to fees being higher for advisor sold plans that for direct sold plans. Currently 48 states offer direct sold plans—all except Tennessee, Washington, and Wyoming—and 27 states of those states also offer advisor sold plans. (Tennessee and Washington offer only prepaid plans, and Wyoming has partnered with Colorado’s plan.) Section 529 savings plans tend to offer a variety of investment options that accommodate a wide range of tastes concerning the tradeoff between risk and expected return. The
13
investment options are almost always retail mutual funds offered to the general public, or combinations of such funds. Fees are higher than for the underlying retail funds because they include a program manager fee and most often a state fee as well. The most popular Section 529 investment option is an age-based fund with an asset mix that is heavily weighted toward equities when the beneficiary is young but automatically becomes more weighted toward fixed income assets as the beneficiary approaches college age. The idea is that equities are very likely to outperform fixed income investments over a period of many years, so it is prudent to have a high exposure to equities when the investment horizon is long, but if the money is needed soon, it is best to have a more conservative portfolio that offers better principle protection. Forty-nine of the 55 direct sold plans, and 25 of the 31 advisor sold plans, offer age-based options (see Table 8). More than half of these plans offer more than one age-based option with varying degrees of risk. Vanguard reports that 60 percent of assets in six Section 529 plans supported by Vanguard’s full services were in age-based funds at the end of 2008.8 Age-based funds for Section 529 plans are similar to target retirement date funds. The essential difference is that the asset composition of target retirement date funds is gauged to time to retirement whereas the asset composition of Section 529 age-based funds are gauged to time to the beneficiary’s freshman year of college. The logic of target date retirement funds can be compelling; the potential for making up investment losses by working and saving more becomes less and less as the investor approaches retirement age, so it makes good sense for a worker’s overall investment portfolio to become more conservative as the retirement date approaches. To the extent that a Section 529 account comprises a large portion of an investor’s overall portfolio, this asset rebalancing must be done in the Section 529 account and an age-based fund is especially appropriate. Otherwise, the Section 529 account could have a static investment allocation and asset rebalancing could be done other parts of the investor’s portfolio. Also, to the extent that the interest rate on loans exceeds the risk-free return that can be earned on investments, parents have an especially strong interest in avoiding the necessity of borrowing to finance a child’s education. This consideration argues for an overall investment portfolio that is gauged to the date a child enters college, not the date the parent retires. The idea, once again, is that the possibilities for making up investment losses by working and saving more so as to avoid the necessity of borrowing becomes less and less as the child approaches college age. In this case, of course, an age-based Section 529 fund is appropriate. Section 529 plans also accommodate investors who wish to build a customized portfolio. Table 8 shows that the number of investment options averages 11 for direct sold plans and 18 for advisor sold plans. More than three-quarters of plans offer each of the five option types shown in Table 8: Age-based funds, blended (balanced) funds, pure equity funds, pure fixed income funds, and money market funds. About half of the plans offer all five options types. Table 8 also reports investment options by state, which differs 8 This data was submitted by Vanguard in a letter responding to Treasury’s Federal Registry request for information,.

14
from the by-plan numbers because some states offer more than one plan. Five states offering a direct sold plan do not offer an age-based option. Account Fees for Section 529 Direct Sold Plans Table 9 reports the distribution of account fees for 57 direct-sold moderate-risk age-based funds for a 5 year old beneficiary. These funds are chosen for analysis because nearly all plans offer them and they are popular with investors. Of the 57 funds, 24 are entirely or almost entirely made up of index funds. Index funds are passively managed so as to mirror the performance of a specific asset bundle, such as the 500 stocks making up the S&P 500 index. Since portfolio decisions are automatic and transactions are infrequent, expenses tend to be lower than those of actively managed funds. As is true for all direct-sold funds, fees for the age-based funds include periodic assessments levied as a percent of account balances (asset-based fees) and possibility a small fixed dollar account maintenance fee. Because the annual maintenance fees are generally $25 or less, and are often waived for home state residents and for high-balance accounts, annual maintenance fees are not considered in the table. Asset based fees are typically expressed as annual expenses divided by average annual net asset value, which is referred to as the expense ratio. Table 9 shows that there is substantial variation in fees across the 57 age-based funds analyzed. The expense ratio varies from 0.24 percent to 1.30 percent, and averages 0.78 percent. For the 24 index funds, the range is 0.24 percent to 1.03 percent, and the mean is 0.61 percent. Twenty of the 24 index funds have expense ratios in the lower half of the distribution for all 57 funds. Of the other four index funds, two have especially high program manager fees, and two have surprisingly high fees for the underlying mutual fund. The middle three columns of Table 9 reports the implications of the asset-based fees for the amount of saving that must be done to finance a given amount of college expenses. For a particular time pattern of account contributions, those columns of the table express fees as a percent of contributions made—that is, they report the equivalent front-load fee in percentage terms. For example, if fees are equivalent to 5 percent of contributions made, fees increase the amount of saving that must be done to achieve a given target account value by 5 percent. The estimates assume 17 years of monthly account contributions sufficient to fund 4 years of college expenses beginning 14 years in the future if there are no account fees, real annual college costs growth 2 percent annually from a current level of $11,000, and annual returns before fees are 7.0 percent in nominal terms and 4.5 percent in real terms. In this case, the table shows that the equivalent front-load fee ranges from 2.2 percent to 11.2 percent, and averages 6.9 percent. The last three columns of Table 9 give further perspective on the magnitude of Section 529 fees for direct-sold plans. It gives the percent of real account investment earnings that are absorbed by fees for the same scenario that underlies the calculations of the
15
equivalent front-load fee. For all 57 funds, this real return absorption measure ranges from 6.9 percent to 35.2 percent, and averages 21.6 percent. Assessing the reasonableness of Section 529 fees for actively managed funds is difficult because some of the fees compensate investment strategists with varying reputations and levels of talent.9 But the large variance in fees levied for index funds does suggest that there is wide variation in the efficiency of Section 529 plan administration. While the index funds analyzed do not all share the same asset composition targets, and hence should not be expected to have precisely the same fees, the underlying investment management costs undoubtedly vary much less than do the fees. The residual fee variance must reflect cross-subsidies between fees levied for actively managed funds and index funds, variance in plan administrative efficiency, or both. It is surprising that five states with a direct sold plan do not offer an age-based plan, and only 23 of the 43 states that do offer an age-based plan offer an index fund. (Table 9 shows 24 index funds, but two of those are offered by a Kansas plan.) Index funds have two major advantages over actively managed funds. First, because of their low fees, they on average perform well relative to actively managed funds and have a large following in the investment community.10 Second, they are well suited to investors who do not wish to spend time acquiring information and evaluating the investment philosophy and track records of the various actively managed funds that are offered. Account Fees for Section 529 Advisor Sold Plans Table 10 demonstrates that Section 529 account fees are much higher for advisor sold plans than for direct sold plans. The table shows the fee distribution for 29 moderate risk age-based plans for a 5-year-old that are currently offered by advisor plans, none of which are index funds. Account fees taken into account include asset-based fees and front-load fees levied on asset purchases. In order to combine these two types of fees into the equivalent front-load fee, it is necessary to assume a particular scenario for account contributions. That scenario is the same as was assumed for the calculations underlying Table 9--17 years of monthly account contributions are made that are sufficient to fund 4 years of college expenses beginning 14 years in the future if there are no account fees, real annual college costs growth 2 percent annually from a current level of $11,000, and annual returns before fees are 7.0 percent in nominal terms and 4.5 percent in real terms. In this scenario, the equivalent front-load fee averages 15.2 percent,
9 The distribution of fees for actively managed funds in Table 9 is not greatly different than the distribution of fees for similar retail mutual funds. Fee information on 15 no-load actively managed target retirement date 2020 and 2025 funds obtained from Morningstar indicates a fee distribution similar to that of the 33 actively managed age-based funds analyzed in Table 9. However, it could be argued that states should be better at weeding out low-value funds than are investors generally. 10 Over the five years ending June 30, 2009, only 41 percent of actively managed domestic equity funds analyzed by Standard and Poor’s outperformed their benchmark index. However, when weighted by assets managed, actively managed funds outperformed their benchmark in all categories except midcaps and emerging markets. Standard and Poor’s Indices Versus Active Funds Scorecard, Midyear 2009, http://www2.standardandpoors.com/spf/pdf/index/SPIVA_2009_Midyear.pdf

16
nearly twice the average for direct sold actively managed funds of the same type. The equivalent front load fee range is 12.3 percent to 17.9 percent. As is true for direct-sold actively managed funds, advisor sold actively managed funds vary in quality and the reasonableness of their fees is therefore difficult to assess. What can be said is that the distribution of fees shown in Table 10 is not greatly different than fees in similar retail mutual funds with front loads. This inference is based on fee information on 45 front-load actively managed target retirement date 2020 and 2025 funds obtained from Morningstar.11 Home-State Bias in State Tax Policies and Investment Management Fees There is widespread agreement that Section 529 fees have come down rapidly in recent years in part because of increased competition between plans.12 However, the wide variation in fees levied for essentially the same index funds suggests that competition is currently imperfect and more competition would be desirable. The essential benefit of competitive markets is that they squeeze out inefficiency and result in lower prices for consumers. A major impediment to competition between Section 529 plans is home-state bias in state tax policies. Currently 34 of the 42 states that both have an income tax and sponsor Section 529 savings plans offer either a state income tax deduction or a credit for contributions to their own Section 529 plan, but only five of those states offer a deduction for contributions to Section 529 plans sponsored by other states (see Table 1). In addition, 13 states exclude all or some Section 529 account balances from assets for purposes of calculating eligibility for state student financial aid, but none of those states offer a similar exclusion for the Section 529 account balances held in the plans of other states. As a result of this home-state bias, families have strong incentives to choose their home state plan even if other plans offer preferable investment choices. Some families may be deterred from even investigating other plans under the possibly false assumption that the state tax benefits of choosing the home plan necessarily outweigh any possible advantages other plans might offer. If these barriers to competition were eliminated, the result would be more investment options for consumers, more intense competition between plans, and lower fees. To the extent that there are economies of scale in plan administration, some state plans might be forced out of the market entirely so that remaining plans can benefit from additional scale and lower costs. Such exit from the industry would contribute to lower fees and would benefit consumers. 11 This data was provided in response to Treasury’s request for fee information for the largest 2020 and 2025 target date funds. 12 It would be very difficult to determine empirically the extent to which inter plan competition as opposed to other factor have brought down Section 529 fees. Industry observers tend to think competition is an important factor. For example, Capital Research and Management, the program manager for Virginia’s advisor sold plan, the single largest Section 529 savings plan, wrote the following in a letter responding to Treasury’s Federal Register request for information: “As 529 plans have become more broadly available and have attained reasonable scale, competition has promoted lower 529 plan fee structures.”
17
Home-state bias in state tax policies not only reduces competition, it is unfair. A state tax deduction or credit for Section 529 contributions lowers the net tax burden of individuals receiving the deduction or credit, and it raises the net tax burden of other state residents. Three groups of state residents are pertinent: Section 529 participants in the home state plan, participants in other state plans, and non-participants. While it might reasonably be decided that non-participants should subsidize participants, there would seem to be no compelling reason why residents choosing to invest in other states’ Section 529 plans should subsidize residents who choose the home state plan. Relative to a discriminating regime, it would be more equitable to offer financial incentives to all residents participating in Section 529 plans and scale back the incentive so that the credit/deduction is no more costly than in the discriminating regime. It is often argued that states cannot afford the additional revenue losses that would result from extending their current deduction or credit to participants in other state plans. But that is not the pertinent policy question; the pertinent policy question is whether or not it is better to give a large tax incentive to residents participating in the home state plan, or a smaller and equally costly incentive to residents participating in any plan. Another justification for home-state bias in state tax policies that is often given is that scholarships and matching grants for low income residents are often financed out of Section 529 fees, and that it would be unreasonable to expect a state to encourage its residents to pay other states’ fees that subsidize similar expenditures for other states’ residents only. However, to the extent this is true, states have the option to instead finance education subsidies for low income residents out of general revenues and to lower Section 529 plan fees accordingly. There seems to be no compelling reason why education subsidies for low income residents should be financed with higher fees imposed on Section 529 plan participants rather than by taxpayers generally.
IX. PREPAID TUITION PLANS Section 529 savings plans and Section 529 prepaid tuition plans are different means of saving for future college expenses. Most Section 529 plan beneficiaries have either one or the other type of plan, but there is no reason why the two types of plans can’t be combined. In a prepaid tuition plan, tuition credits or certificates are purchased on behalf of a beneficiary that entitle the beneficiary to a specified number of credit hours of future attendance at designated educational institutions, and the plan sponsor maintains a Trust that invests the prepayments and uses the proceeds to finance the tuition promised. Currently, 16 states operate such plans, but new enrollees are being accepted in just 13 of those plans. Table 11 lists prepaid plans and their features. Prepaid tuition plans are of three types. The most common is a “contract plan.” In contract plans, a set schedule of payments are made that entitle the beneficiary to a specified amount of future tuition and mandatory fees at in-state public colleges,

18
universities, and community colleges. For example, one contract offered by the Alabama plan in 2008 called for 148 monthly payments in the amount of $262 beginning in February 2009 that entitle the beneficiary to 4 years of payouts beginning in the Fall of 2021 that cover the weighted average of tuition and mandatory fees at all Alabama 4-year educational institutions. Contract plans provide for a variety of payout options and a variety of payment options. For example, the payout might be for only one year of college attendance, or the payment might be a single lump-sum payment. The second type of prepayment program is a “unit program.” For example, 100 units represents one year of tuition and mandatory fees at Washington State’s two flagship universities, the University and Washington (UW) and Washington State University (WSU) The unit price is revised once each year and is currently $101. Hence, $10,100 would secure a payout in any future year toward the cost of qualified educational expenses equal to the cost of one year of attendance at the UW or WSU. The unit price is not necessarily the current cost of tuition; the current Washington State unit price is in fact 33 percent higher than current tuition, perhaps reflecting the expectation of steep future tuition price increases. Washington State also offers contract plans. The third type of prepaid tuition plan is a “voucher plan” that operates in much the same way as a unit plan. The difference is that in a voucher plan, participating educational institutions rather than a state sell vouchers for future attendance at their own institutions. Massachusetts is the only state with a voucher program. The Independent 529 plan, which is sponsored by non-profit consortium of 127 private colleges and Universities, is also a voucher plan. While payouts of prepaid plans are based on in-state tuition and fees, those payouts can be directed to private and out-of-state educational institutions. In two cases, however, the payouts might be smaller than if an “in-network” institution is attended. If a beneficiary attends an out-of-network school, the Virginia plan payout is the lesser of what it would pay if an in-state school was attended and the sum of prepayments made plus actual returns earned on those prepayments, and the Massachusetts plan payout is equal to prepayments made adjusted for price inflation. The state tax deductions and credits listed in Table 1 apply to all contributions made to Section 529 plans, regardless of whether they are to a savings plan or to a prepaid plan. Estimates of the Value of Prepaid Plans Relative to Savings Plans Whether it is preferable to make contributions to a prepaid plan or to make the same contributions to a savings plan depends on the future returns that will be earned in the savings account and the future cost of tuition and fees that will be financed with the savings account. For example, in the simple case of a prepaid program of the unit type where units are currently priced in accordance with current tuition costs, the savings plan would outperform the prepaid plan if the average nominal savings plan return exceeds the average annual growth rate of tuition. The comparison is more complicated if the prepaid plan’s current unit price is based on tuition prices greater than current tuition prices; in

19
that case, the savings plan would not have to earn a return as high as annual rate of tuition increase in order to outperform the prepaid plan. It is important to distinguish the ex post value from the ex ante relative values of prepaid tuition plans and Section 529 savings plans. The ex post relative values are quantified below; they simply indicate the circumstances under which the investor does better with a prepaid plan than with a savings plan. The ex ante value includes the value of insurance; it is the expected ex post value plus a premium reflecting the value of knowing the price of future tuition now rather than later. Hence, in cases where the ex post value of a prepaid plan is equal to the value of a savings plan, the ex ante value of the prepaid plan exceeds the value of the savings plan by an amount that depends on the degree to which the investor is risk adverse. The value of insurance is not easily measured, but is important. For prepaid plans of the unit type, year to year unit price changes are entirely discretionary, and hence have no set relationship to actual changes in tuition prices. Hence, such plans cannot be easily compared with savings plans in the realistic case where a family purchases credits over a number of years. Contract plans, in contrast, do allow a family to commit to a set stream of monthly payments that secure a given number of semesters of schooling. The analysis that follows, therefore, is limited to contract plans. In particular, the ex post value of ten contract prepaid plans that are currently open to new enrollment will be compared to the ex post value of a generic Section 529 savings plan. The comparisons assume a family takes out an extended monthly-payment contract during the fall 2008 enrollment period to secure 4 years of University education for a 5-year-old who is expected to enter college in the fall of 2021. For each of the ten contract plans, the information necessary to make the comparison is the monthly payment, the number of monthly payments, the date the first payment is due, and the 2008 level of tuition and fees corresponding to the tuition and fees future contract payouts are tied to. (For example, the payout might be tied to the weighted average of tuition and fees at in-state 4-year public educational institutions.) In addition, to simplify the comparisons, it is assumed that the returns earned in a savings plan are constant between 2008 and the time of graduation (2024), and that annual tuition (and mandatory fee) growth in each of the years the child is attending school is the same as the average annual growth rate between 2008 and 2021. (In what follows, “tuition” is understood to include mandatory fees.) In this simple case, it is possible to determine whether a particular prepaid plan outperforms a saving plan based on two quantities—the average annual nominal return earned in the savings account, and the average annual growth rate of tuition. Other things equal, the relative value of the prepaid plan increases with the average growth rate of tuition, and decreases with the nominal return that can be earned in a Section 529 savings plan. While it would be possible to determine the relative value of a prepaid tuition plan and a savings plan for various assumptions for investment returns and tuition growth, assessing the likelihood of the various scenarios is complicated by the fact that each percentage

20
point of expected general price inflation causes both nominal investment returns and tuition growth to increase by a percentage point. Hence, the basic assumptions that will be varied in the comparisons are: (1) the average rate of general price inflation, (2) average nominal investment returns in excess of general price inflation (the “real” investment return), and (3) average annual growth in tuition in excess of general price inflation (“real” tuition growth). Tables 12 and 13 show the results of the comparisons. First, consider Table 12. For each combination of assumptions for real investment returns and general price inflation, and for each of the ten prepaid plans, there is an annual growth rate for real tuition that makes the prepaid plan equal in value to a Section 529 savings plan ex post. This real tuition growth rate will be referred to as the threshold real tuition growth rate. The cell entries in Table 12 give the threshold real tuition growth rate averaged across the ten prepaid plans. This average ranges from 3.5 percent if real investment returns are 2 percent and general price inflation is 6 percent, to 7.5 percent if real investment returns are 6 percent and general price inflation is 2 percent. Tuition growth higher than these values makes the ex post value of prepaid plans on average greater than the ex post value of a savings plan, and tuition growth below these amounts makes the ex post value of prepaid plans on average greater than the ex post value of a savings plan. The six cells of Table 12 that are equal to or less than 4.5 percent are shaded to indicate that they are within the range of historical experience for sustained real tuition growth. This judgment is based on Figures 2 and 3. The first figure shows average real annual tuition at 4-year public Universities for each academic year between 1976/77 and 2007/08. This average fell at a 1.7 percent rate between 1976/77 and 1981/82 before commencing a steady rise—growing at a 4.1 percent annual rate between 1981/82 and 1999/00 and at a 4.5 percent rate between 1999/00 and 2007/08. Figure 3 gives the average annual real tuition growth for ten-year periods ending in the year shown. Only in two ten-year periods did annual rate of real tuition growth average more than 4.5 percent, the periods 1981/82-1991/92 and 1982/83-992/93. And the exceptional growth in those two periods is explained in large part by depressed beginning-of-period real tuition levels resulting from real tuition declines between 1976/77 and 1981/82. Table 12 concerns threshold real tuition growth rates averaged over ten plans. Table 13 supplements that information by giving the share of the ten prepaid plans that outperforms a Section 529 savings plan if real annual tuition growth averages 4.5 percent. Only if real investment returns are 2 percent or less and general price inflation is 4 percent or greater do more than half the plans outperform a Section 529 savings plan when real tuition growth averages 4.5 percent.
X. CONCLUSION AND RECOMMENDATIONS Section 529 plans are an attractive and convenient means of saving for college. Direct sold savings accounts in particular can be easy to set up and require minimal initial investments. And the tax benefits can be substantial; this paper’s illustrative calculations indicate that existing tax benefits can increase the effectiveness of saving by between 6

21
percent and 39 percent depending on the marginal tax rates of the saver, the length of the savings period, and whether there is a state deduction or credit for contributions. While Section 529 plans offer tax benefits to any family with sufficient income to pay federal income tax, they are of greater benefit to high income families whose tax rates tend to be higher. This tax advantage is likely part of the reason why Section 529 account balances tend to increase disproportionately with increases in income. Whether this is undesirable is debatable. It could be argued, for example, that the most effective way to help low income families with college expenses is through direct student aid, and that Section 529 plans are therefore naturally targeted to higher income families. It is for this reason that the report has focused on making Section 529 plans more accessible, effective and reliable for the middle class. This report has identified six approaches that we recommend that states and others consider implementing to make Section 529 savings plans more attractive, effective and reliable for middle class families, and those who aspire to join the middle class through college attendance. Recommendation 1: Provision of Age-Based Index Funds. Section 529 savings plans tend to offer a wide array of investment options that accommodate a variety of families’ tastes for risk and expected return. The most popular option, and one that is well suited to the circumstances of many families, is an age-based fund that automatically sheds equities and adds fixed income assets as the beneficiary approaches college age. Yet five of the 48 states offering a direct sold savings plans do not offer an age-based fund. Equally troubling is the fact that only 23 of the 43 states that do offer an age-based fund offer it in the form of index funds. Historically, index funds have performed well relative to actively managed funds because they have low fees, and they are especially well suited to investors who do not wish to spend time acquiring information and evaluating the investment philosophy and track records of actively managed funds. Recommendation 2: Eliminate Home-State Bias. There is widespread agreement that Section 529 fees have declined substantially in recent years, and that increased plan competition is in large part responsible. Yet there remains surprisingly large variance in fees assessed for similar age-based index funds offered by the 24 plans across 23 states, suggesting that inter-plan competition is far from perfect. While the index funds analyzed do not all share the same asset composition targets, and hence should not be expected to have precisely the same fees, fees appear to be higher than necessary in at least some states. A potentially important hindrance to inter-plan competition is home-state bias in state tax policies. Currently 34 of the 42 states that both have an income tax and sponsor Section 529 savings plans offer either a deduction or a credit for contributions to their own Section 529 plan, but only five of those states—Arizona, Kansas, Maine, Missouri, and Pennsylvania—offer a deduction for contributions to Section 529 plans administered by other states. In addition, 13 states exclude all or some Section 529 account balances from assets for purposes of calculating eligibility for state student financial aid, but none of
22
those states offer a similar exclusion for the Section 529 account balances held in the plans of other states. As a result of this home-state bias, families have strong incentives to choose their home state plan even if other plans offer preferable investment choices. Some families may be deterred from even investigating other plans under the possibly false assumption that the state tax benefits of choosing the home plan necessarily outweigh any possible advantages other plans might offer. If these barriers to competition were eliminated —as they are currently in five states — the result would be more investment options for consumers, more intense competition between plans, and probably better service and lower fees for many customers. Recommendation 3: Per Beneficiary Contribution Limits. Currently there are effectively no limits on Section 529 account balances. States offering savings plans refuse contributions to accounts once the account balance exceeds a dollar limit that varies between $224,465 and $368,600, and averages $291,000. Because 43 states offer plans open to residents in other states, however, a beneficiary can have accounts in as many as 44 states, each state with a limit exceeding $224,465. Putting a true limit on Section 529 contributions requires making the limits per beneficiary rather than per beneficiary per state. Per beneficiary limits would reduce the tax benefits to high income families and, by lowering federal tax expenditures for the program, would potentially free up federal resources for education aid better targeted to low and middle income families. Per beneficiary limits would best be enforced at the time distributions are made. Specifically, each distribution for a particular beneficiary’s qualified educational expenses would be divided into a principle portion counting against the contribution limit and an earnings portion. At such time as a beneficiary reaches the contribution limit, distributions would be nonqualified and subject to penalty. Recommendation 4: Improved Transparency. The College Savings Plan Network (CSPN) has done a valuable service by collecting information on Section 529 savings plans and making it available in a convenient form on the internet. However, because there is no established format for reporting historical investment returns for the various investment options, CSPN can only offer links to historical return data for the various plans. It would be a great help to investors if a standard reporting format were developed and the information was available directly on the CSPN web site. Also, there is little information currently available on how Section 529 plan participation varies with income, on the distribution of annual contributions and account balances, and on how Section 529 plans are invested at the account level. Such information would help policymakers. To help fill this gap, Treasury worked with the CSPN and the College Savings Foundation to devise a survey questionnaire. Treasury will analyze these data when they become available and share further findings with relevant policymakers. Recommendation 5: Improved Monitoring and Compliance. Section 529 accounts are still relatively new. To reduce the potential for abuse, Congress and the states should work together to strengthen compliance and monitoring of Section 529 accounts and their disbursements.

23
REFERENCES Alexander, Raquel Meyer and LeAnn Luna (2009). “How Investors Respond to
Disclosures: The Case of 529 College Savings Plans,” Working Paper.
Boshara, Ray, Margaret Clancy, David Newville, and Michael Sherraden (2009). The Basics of Progressive 529s, February.
Dynarski, Susan. (2004). Who Benefits from the Education Saving Incentives? Income, Educational Expectations and the Value of the 529 and Coverdell. National Tax Journal, 57(2), 359-383.
Dynarski Susan. (2004). Tax Policy and Education Policy: Collision or Coordination? A Case Study of 529 and Coverdell Savings Vehicles. National Bureau of Economic Research, Inc, NBER Working Papers: 10357
Hurley, Joseph F. (2008). The Best Way to Save for College, A Complete Guide to 529 Plans, Bankrate Inc.
Internal Revenue Service (2008), Publication 970, Tax Benefits for Education, http://www.irs.gov/publications/p970/index.html.
Joint Committee on Taxation (2008), Present Law and Analysis Relating to Tax Benefits for Higher Education, April 29.
National Center for Education Statistics (2009), Digest of Education Statistics 2008, March.
Standard and Poor’s (2009). Standard and Poor’s Indices Versus Active Funds Scorecard, Midyear 2009, http://www2.standardandpoors.com/spf/pdf/index/SPIVA_2009_Midyear.pdf.
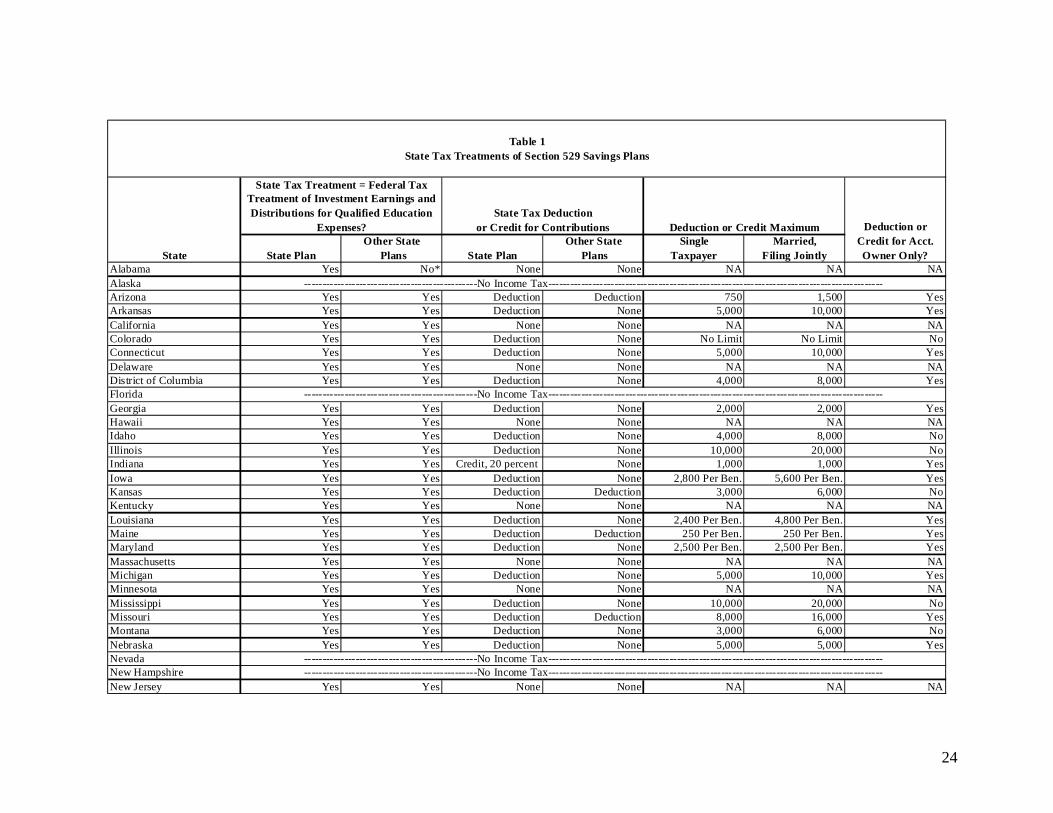
24
State PlanOther State
Plans State PlanOther State
PlansSingle
TaxpayerMarried,
Filing JointlyAlabama Yes No* None None NA NA NAAlaskaArizona Yes Yes Deduction Deduction 750 1,500 YesArkansas Yes Yes Deduction None 5,000 10,000 YesCalifornia Yes Yes None None NA NA NAColorado Yes Yes Deduction None No Limit No Limit NoConnecticut Yes Yes Deduction None 5,000 10,000 YesDelaware Yes Yes None None NA NA NADistrict of Columbia Yes Yes Deduction None 4,000 8,000 YesFloridaGeorgia Yes Yes Deduction None 2,000 2,000 YesHawaii Yes Yes None None NA NA NAIdaho Yes Yes Deduction None 4,000 8,000 NoIllinois Yes Yes Deduction None 10,000 20,000 NoIndiana Yes Yes Credit, 20 percent None 1,000 1,000 YesIowa Yes Yes Deduction None 2,800 Per Ben. 5,600 Per Ben. YesKansas Yes Yes Deduction Deduction 3,000 6,000 NoKentucky Yes Yes None None NA NA NALouisiana Yes Yes Deduction None 2,400 Per Ben. 4,800 Per Ben. YesMaine Yes Yes Deduction Deduction 250 Per Ben. 250 Per Ben. YesMaryland Yes Yes Deduction None 2,500 Per Ben. 2,500 Per Ben. YesMassachusetts Yes Yes None None NA NA NAMichigan Yes Yes Deduction None 5,000 10,000 YesMinnesota Yes Yes None None NA NA NAMississippi Yes Yes Deduction None 10,000 20,000 NoMissouri Yes Yes Deduction Deduction 8,000 16,000 YesMontana Yes Yes Deduction None 3,000 6,000 NoNebraska Yes Yes Deduction None 5,000 5,000 YesNevadaNew HampshireNew Jersey Yes Yes None None NA NA NA
-----------------------------------------------No Income Tax-------------------------------------------------------------------------------------------
-----------------------------------------------No Income Tax-------------------------------------------------------------------------------------------
-----------------------------------------------No Income Tax------------------------------------------------------------------------------------------------------------------------------------------No Income Tax-------------------------------------------------------------------------------------------
Table 1State Tax Treatments of Section 529 Savings Plans
State Tax Treatment = Federal Tax Treatment of Investment Earnings and Distributions for Qualified Education
Expenses?State Tax Deduction
or Credit for Contributions Deduction orCredit for Acct.Owner Only?State
Deduction or Credit Maximum
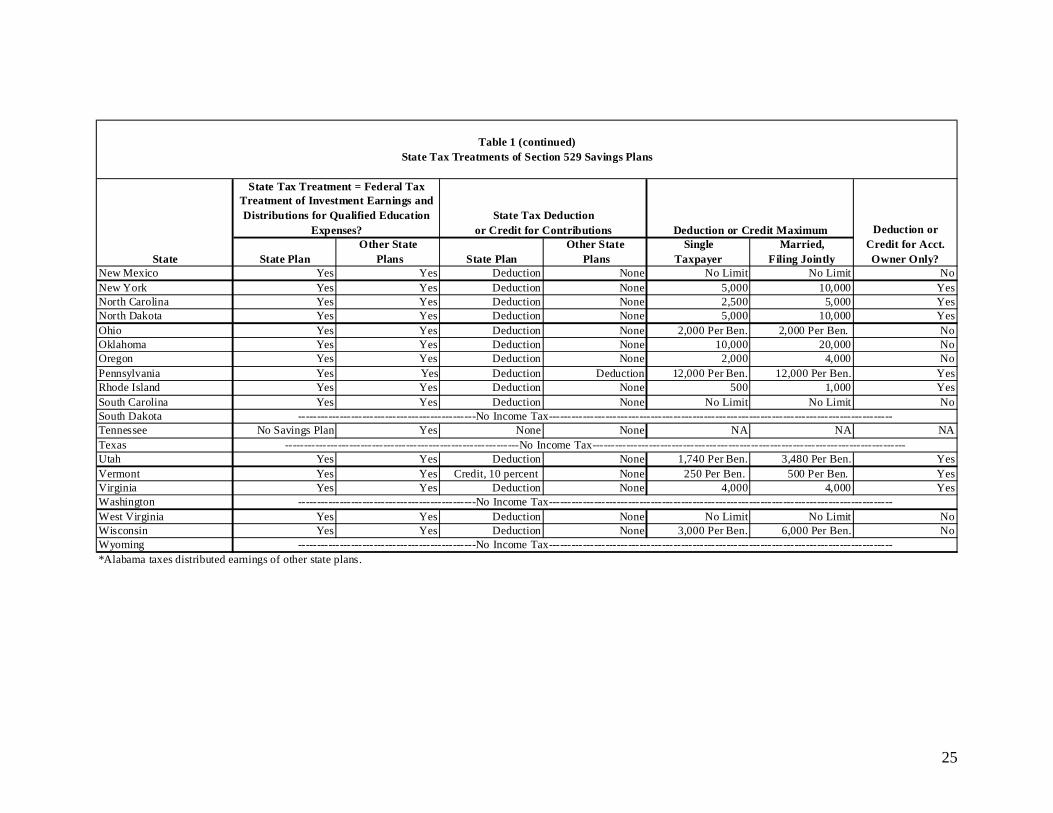
25
State PlanOther State
Plans State PlanOther State
PlansSingle
TaxpayerMarried,
Filing JointlyNew Mexico Yes Yes Deduction None No Limit No Limit NoNew York Yes Yes Deduction None 5,000 10,000 YesNorth Carolina Yes Yes Deduction None 2,500 5,000 YesNorth Dakota Yes Yes Deduction None 5,000 10,000 YesOhio Yes Yes Deduction None 2,000 Per Ben. 2,000 Per Ben. NoOklahoma Yes Yes Deduction None 10,000 20,000 NoOregon Yes Yes Deduction None 2,000 4,000 NoPennsylvania Yes Yes Deduction Deduction 12,000 Per Ben. 12,000 Per Ben. YesRhode Island Yes Yes Deduction None 500 1,000 YesSouth Carolina Yes Yes Deduction None No Limit No Limit NoSouth DakotaTennessee No Savings Plan Yes None None NA NA NATexasUtah Yes Yes Deduction None 1,740 Per Ben. 3,480 Per Ben. YesVermont Yes Yes Credit, 10 percent None 250 Per Ben. 500 Per Ben. YesVirginia Yes Yes Deduction None 4,000 4,000 YesWashingtonWest Virginia Yes Yes Deduction None No Limit No Limit NoWisconsin Yes Yes Deduction None 3,000 Per Ben. 6,000 Per Ben. NoWyoming
Table 1 (continued)State Tax Treatments of Section 529 Savings Plans
*Alabama taxes distributed earnings of other state plans.
State
State Tax Treatment = Federal Tax Treatment of Investment Earnings and Distributions for Qualified Education
Expenses?State Tax Deduction
or Credit for Contributions
-----------------------------------------------No Income Tax-------------------------------------------------------------------------------------------
--------------------------------------------------------------No Income Tax-----------------------------------------------------------------------------------
-----------------------------------------------No Income Tax-------------------------------------------------------------------------------------------
-----------------------------------------------No Income Tax-------------------------------------------------------------------------------------------
Deduction or Credit Maximum Deduction orCredit for Acct.Owner Only?
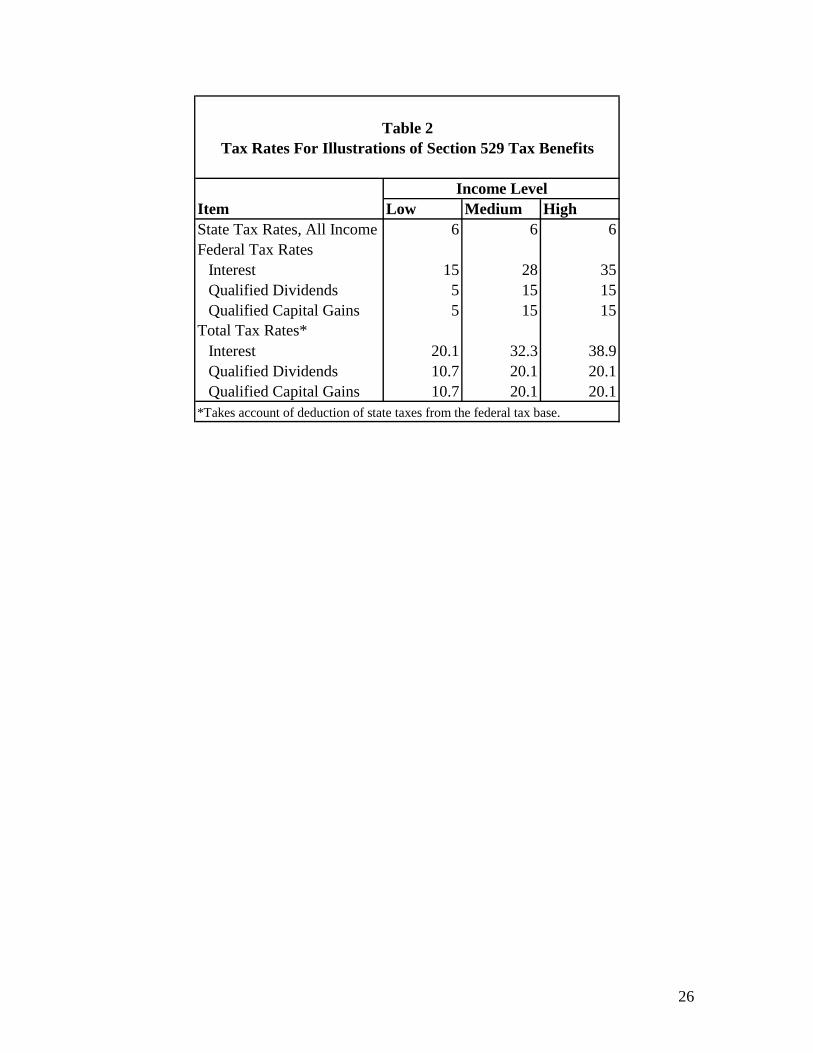
26
Low Medium HighState Tax Rates, All Income 6 6 6Federal Tax Rates
Interest 15 28 35Qualified Dividends 5 15 15Qualified Capital Gains 5 15 15
Total Tax Rates*Interest 20.1 32.3 38.9Qualified Dividends 10.7 20.1 20.1Qualified Capital Gains 10.7 20.1 20.1
Income LevelItem
Table 2Tax Rates For Illustrations of Section 529 Tax Benefits
*Takes account of deduction of state taxes from the federal tax base.
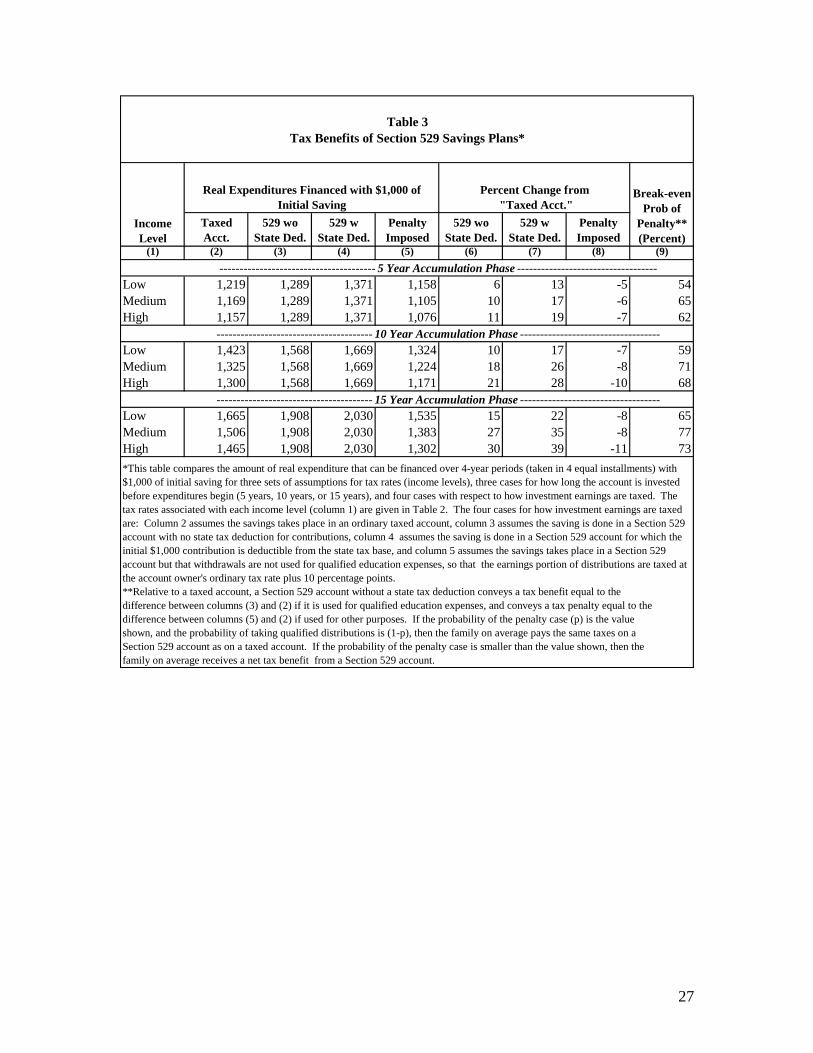
27
TaxedAcct.
529 wo State Ded.
529 wState Ded.
PenaltyImposed
529 wo State Ded.
529 wState Ded.
PenaltyImposed
(1) (2) (3) (4) (5) (6) (7) (8) (9)
Low 1,219 1,289 1,371 1,158 6 13 -5 54Medium 1,169 1,289 1,371 1,105 10 17 -6 65High 1,157 1,289 1,371 1,076 11 19 -7 62
Low 1,423 1,568 1,669 1,324 10 17 -7 59Medium 1,325 1,568 1,669 1,224 18 26 -8 71High 1,300 1,568 1,669 1,171 21 28 -10 68
Low 1,665 1,908 2,030 1,535 15 22 -8 65Medium 1,506 1,908 2,030 1,383 27 35 -8 77High 1,465 1,908 2,030 1,302 30 39 -11 73
--------------------------------------- 10 Year Accumulation Phase -----------------------------------
IncomeLevel
--------------------------------------- 15 Year Accumulation Phase -----------------------------------
Percent Change from "Taxed Acct."
Break-even Prob of
Penalty**(Percent)
*This table compares the amount of real expenditure that can be financed over 4-year periods (taken in 4 equal installments) with $1,000 of initial saving for three sets of assumptions for tax rates (income levels), three cases for how long the account is invested before expenditures begin (5 years, 10 years, or 15 years), and four cases with respect to how investment earnings are taxed. The tax rates associated with each income level (column 1) are given in Table 2. The four cases for how investment earnings are taxed are: Column 2 assumes the savings takes place in an ordinary taxed account, column 3 assumes the saving is done in a Section 529 account with no state tax deduction for contributions, column 4 assumes the saving is done in a Section 529 account for which the initial $1,000 contribution is deductible from the state tax base, and column 5 assumes the savings takes place in a Section 529 account but that withdrawals are not used for qualified education expenses, so that the earnings portion of distributions are taxed at the account owner's ordinary tax rate plus 10 percentage points. **Relative to a taxed account, a Section 529 account without a state tax deduction conveys a tax benefit equal to thedifference between columns (3) and (2) if it is used for qualified education expenses, and conveys a tax penalty equal to thedifference between columns (5) and (2) if used for other purposes. If the probability of the penalty case (p) is the value shown, and the probability of taking qualified distributions is (1-p), then the family on average pays the same taxes on a Section 529 account as on a taxed account. If the probability of the penalty case is smaller than the value shown, then the family on average receives a net tax benefit from a Section 529 account.
Real Expenditures Financed with $1,000 of Initial Saving
--------------------------------------- 5 Year Accumulation Phase -----------------------------------
Table 3Tax Benefits of Section 529 Savings Plans*
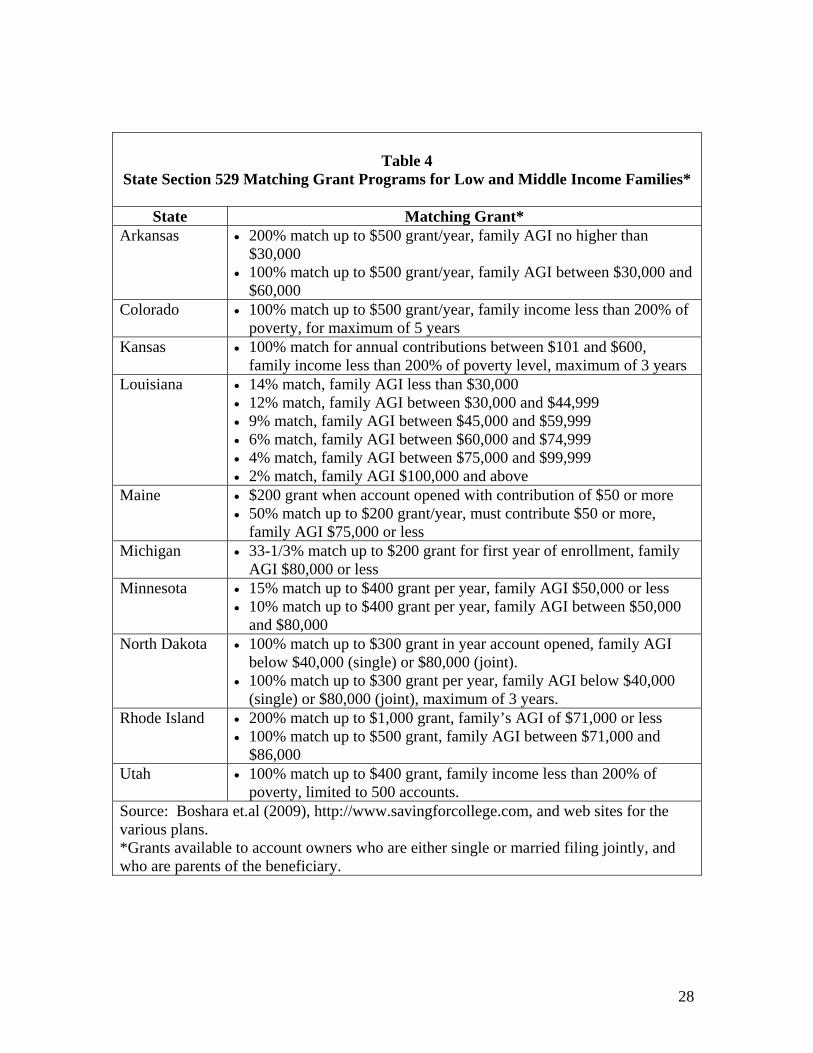
28
Table 4 State Section 529 Matching Grant Programs for Low and Middle Income Families*
State Matching Grant* Arkansas • 200% match up to $500 grant/year, family AGI no higher than
$30,000 • 100% match up to $500 grant/year, family AGI between $30,000 and
$60,000 Colorado • 100% match up to $500 grant/year, family income less than 200% of
poverty, for maximum of 5 years Kansas • 100% match for annual contributions between $101 and $600,
family income less than 200% of poverty level, maximum of 3 years Louisiana • 14% match, family AGI less than $30,000
• 12% match, family AGI between $30,000 and $44,999 • 9% match, family AGI between $45,000 and $59,999 • 6% match, family AGI between $60,000 and $74,999 • 4% match, family AGI between $75,000 and $99,999 • 2% match, family AGI $100,000 and above
Maine • $200 grant when account opened with contribution of $50 or more • 50% match up to $200 grant/year, must contribute $50 or more,
family AGI $75,000 or less Michigan • 33-1/3% match up to $200 grant for first year of enrollment, family
AGI $80,000 or less Minnesota • 15% match up to $400 grant per year, family AGI $50,000 or less
• 10% match up to $400 grant per year, family AGI between $50,000 and $80,000
North Dakota • 100% match up to $300 grant in year account opened, family AGI below $40,000 (single) or $80,000 (joint).
• 100% match up to $300 grant per year, family AGI below $40,000 (single) or $80,000 (joint), maximum of 3 years.
Rhode Island • 200% match up to $1,000 grant, family’s AGI of $71,000 or less • 100% match up to $500 grant, family AGI between $71,000 and
$86,000 Utah • 100% match up to $400 grant, family income less than 200% of
poverty, limited to 500 accounts. Source: Boshara et.al (2009), http://www.savingforcollege.com, and web sites for the various plans. *Grants available to account owners who are either single or married filing jointly, and who are parents of the beneficiary.
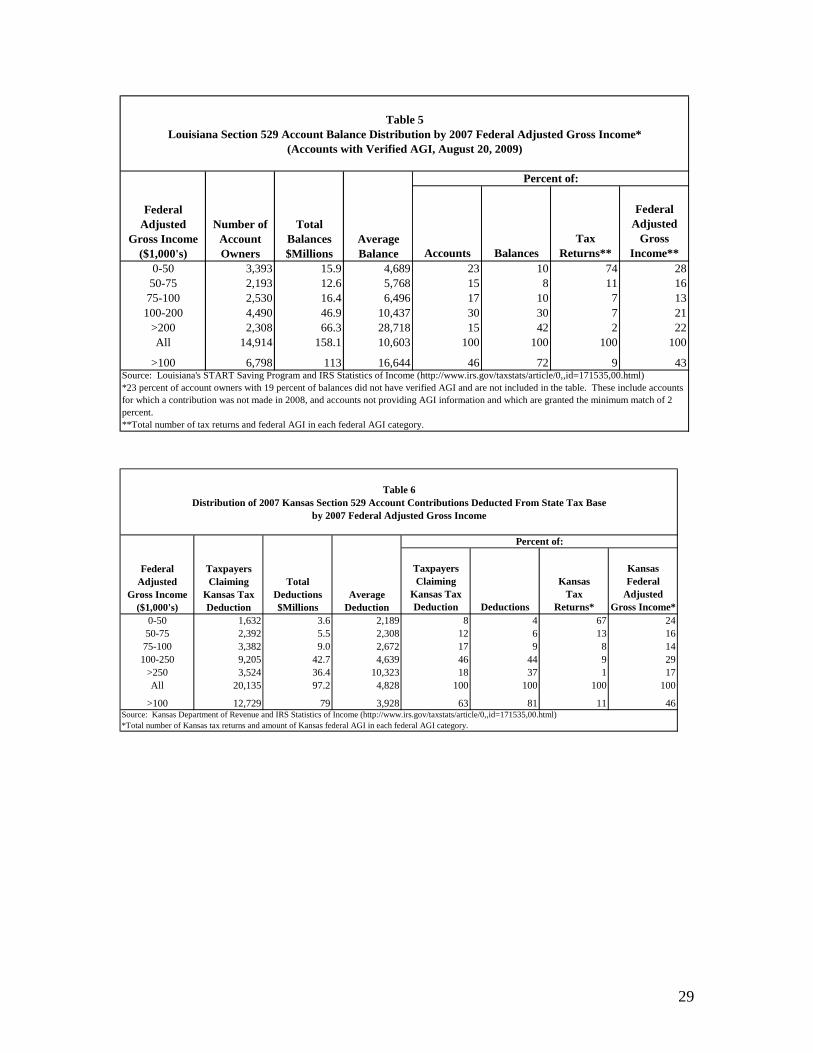
29
Accounts BalancesTax
Returns**
Federal Adjusted
Gross Income**
0-50 3,393 15.9 4,689 23 10 74 2850-75 2,193 12.6 5,768 15 8 11 16
75-100 2,530 16.4 6,496 17 10 7 13100-200 4,490 46.9 10,437 30 30 7 21
>200 2,308 66.3 28,718 15 42 2 22All 14,914 158.1 10,603 100 100 100 100
>100 6,798 113 16,644 46 72 9 43Source: Louisiana's START Saving Program and IRS Statistics of Income (http://www.irs.gov/taxstats/article/0,,id=171535,00.html)*23 percent of account owners with 19 percent of balances did not have verified AGI and are not included in the table. These include accounts for which a contribution was not made in 2008, and accounts not providing AGI information and which are granted the minimum match of 2 percent. **Total number of tax returns and federal AGI in each federal AGI category.
Percent of:
Table 5Louisiana Section 529 Account Balance Distribution by 2007 Federal Adjusted Gross Income*
(Accounts with Verified AGI, August 20, 2009)
Federal Adjusted
Gross Income($1,000's)
Number ofAccountOwners
TotalBalances$Millions
AverageBalance
TaxpayersClaiming
Kansas TaxDeduction Deductions
KansasTax
Returns*
KansasFederal
AdjustedGross Income*
0-50 1,632 3.6 2,189 8 4 67 2450-75 2,392 5.5 2,308 12 6 13 16
75-100 3,382 9.0 2,672 17 9 8 14100-250 9,205 42.7 4,639 46 44 9 29
>250 3,524 36.4 10,323 18 37 1 17All 20,135 97.2 4,828 100 100 100 100
>100 12,729 79 3,928 63 81 11 46Source: Kansas Department of Revenue and IRS Statistics of Income (http://www.irs.gov/taxstats/article/0,,id=171535,00.html)*Total number of Kansas tax returns and amount of Kansas federal AGI in each federal AGI category.
Percent of:
Table 6Distribution of 2007 Kansas Section 529 Account Contributions Deducted From State Tax Base
by 2007 Federal Adjusted Gross Income
Federal Adjusted
Gross Income($1,000's)
TaxpayersClaiming
Kansas TaxDeduction
TotalDeductions$Millions
AverageDeduction
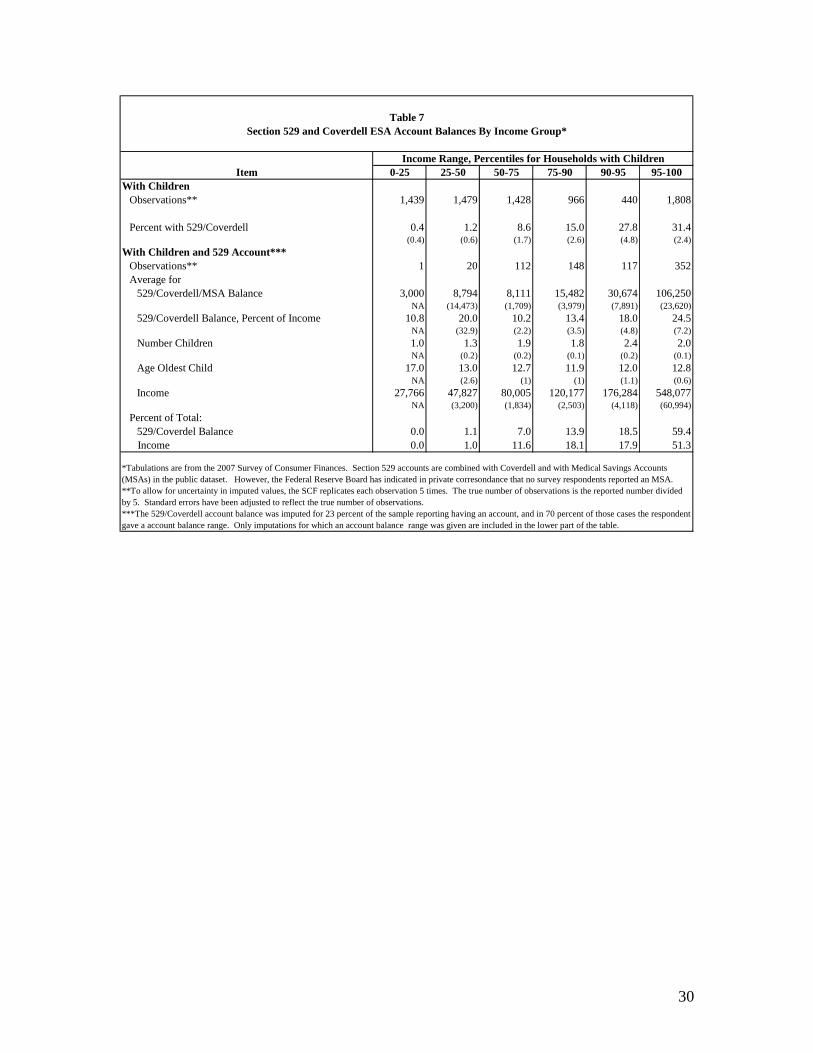
30
0-25 25-50 50-75 75-90 90-95 95-100With Children
Observations** 1,439 1,479 1,428 966 440 1,808
Percent with 529/Coverdell 0.4 1.2 8.6 15.0 27.8 31.4(0.4) (0.6) (1.7) (2.6) (4.8) (2.4)
With Children and 529 Account***Observations** 1 20 112 148 117 352Average for
529/Coverdell/MSA Balance 3,000 8,794 8,111 15,482 30,674 106,250NA (14,473) (1,709) (3,979) (7,891) (23,620)
529/Coverdell Balance, Percent of Income 10.8 20.0 10.2 13.4 18.0 24.5NA (32.9) (2.2) (3.5) (4.8) (7.2)
Number Children 1.0 1.3 1.9 1.8 2.4 2.0NA (0.2) (0.2) (0.1) (0.2) (0.1)
Age Oldest Child 17.0 13.0 12.7 11.9 12.0 12.8NA (2.6) (1) (1) (1.1) (0.6)
Income 27,766 47,827 80,005 120,177 176,284 548,077NA (3,200) (1,834) (2,503) (4,118) (60,994)
Percent of Total: 529/Coverdel Balance 0.0 1.1 7.0 13.9 18.5 59.4
Income 0.0 1.0 11.6 18.1 17.9 51.3
Table 7Section 529 and Coverdell ESA Account Balances By Income Group*
Income Range, Percentiles for Households with ChildrenItem
*Tabulations are from the 2007 Survey of Consumer Finances. Section 529 accounts are combined with Coverdell and with Medical Savings Accounts (MSAs) in the public dataset. However, the Federal Reserve Board has indicated in private corresondance that no survey respondents reported an MSA.**To allow for uncertainty in imputed values, the SCF replicates each observation 5 times. The true number of observations is the reported number divided by 5. Standard errors have been adjusted to reflect the true number of observations. ***The 529/Coverdell account balance was imputed for 23 percent of the sample reporting having an account, and in 70 percent of those cases the respondent gave a account balance range. Only imputations for which an account balance range was given are included in the lower part of the table.
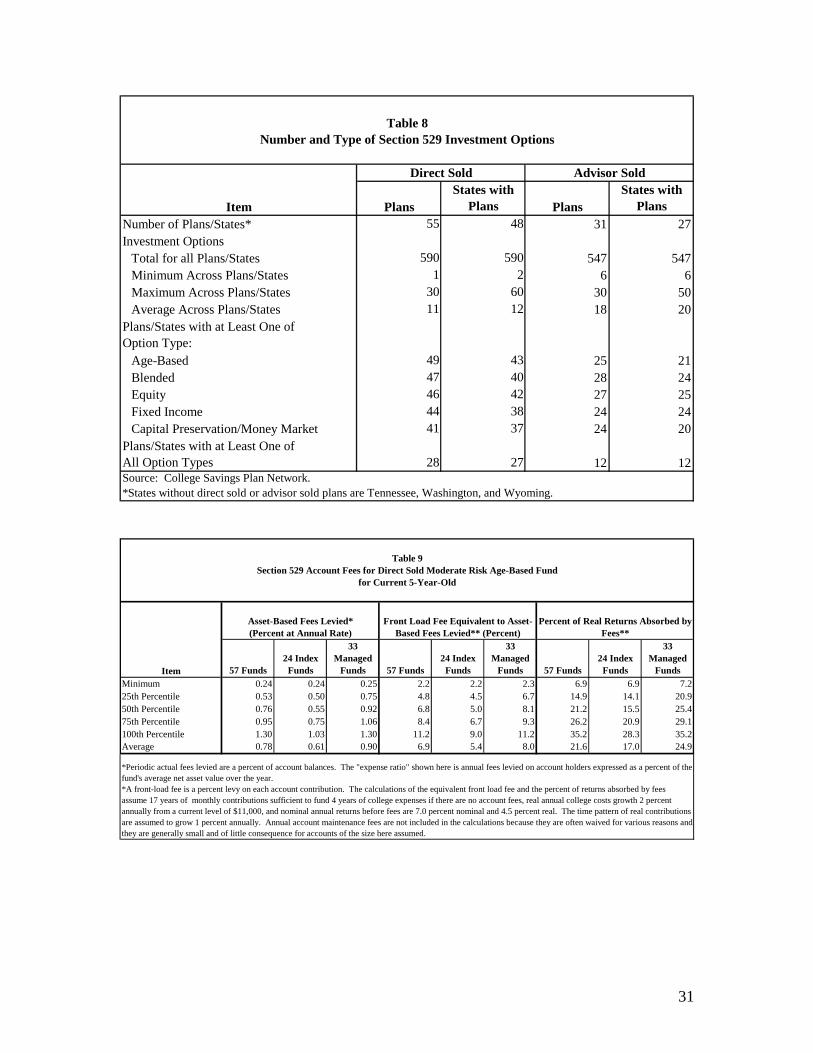
31
PlansStates with
Plans PlansStates with
PlansNumber of Plans/States* 55 48 31 27Investment Options
Total for all Plans/States 590 590 547 547Minimum Across Plans/States 1 2 6 6Maximum Across Plans/States 30 60 30 50Average Across Plans/States 11 12 18 20
Plans/States with at Least One of Option Type:
Age-Based 49 43 25 21Blended 47 40 28 24Equity 46 42 27 25Fixed Income 44 38 24 24Capital Preservation/Money Market 41 37 24 20
Plans/States with at Least One of All Option Types 28 27 12 12
Direct Sold Advisor Sold
Table 8Number and Type of Section 529 Investment Options
Item
Source: College Savings Plan Network.*States without direct sold or advisor sold plans are Tennessee, Washington, and Wyoming.
57 Funds24 Index
Funds
33 Managed
Funds 57 Funds24 Index
Funds
33 Managed
Funds 57 Funds24 Index
Funds
33 Managed
FundsMinimum 0.24 0.24 0.25 2.2 2.2 2.3 6.9 6.9 7.225th Percentile 0.53 0.50 0.75 4.8 4.5 6.7 14.9 14.1 20.950th Percentile 0.76 0.55 0.92 6.8 5.0 8.1 21.2 15.5 25.475th Percentile 0.95 0.75 1.06 8.4 6.7 9.3 26.2 20.9 29.1100th Percentile 1.30 1.03 1.30 11.2 9.0 11.2 35.2 28.3 35.2Average 0.78 0.61 0.90 6.9 5.4 8.0 21.6 17.0 24.9
*Periodic actual fees levied are a percent of account balances. The "expense ratio" shown here is annual fees levied on account holders expressed as a percent of the fund's average net asset value over the year. *A front-load fee is a percent levy on each account contribution. The calculations of the equivalent front load fee and the percent of returns absorbed by fees assume 17 years of monthly contributions sufficient to fund 4 years of college expenses if there are no account fees, real annual college costs growth 2 percent annually from a current level of $11,000, and nominal annual returns before fees are 7.0 percent nominal and 4.5 percent real. The time pattern of real contributions are assumed to grow 1 percent annually. Annual account maintenance fees are not included in the calculations because they are often waived for various reasons and they are generally small and of little consequence for accounts of the size here assumed.
Table 9Section 529 Account Fees for Direct Sold Moderate Risk Age-Based Fund
for Current 5-Year-Old
Asset-Based Fees Levied*(Percent at Annual Rate)
Front Load Fee Equivalent to Asset-Based Fees Levied** (Percent)
Percent of Real Returns Absorbed by Fees**
Item
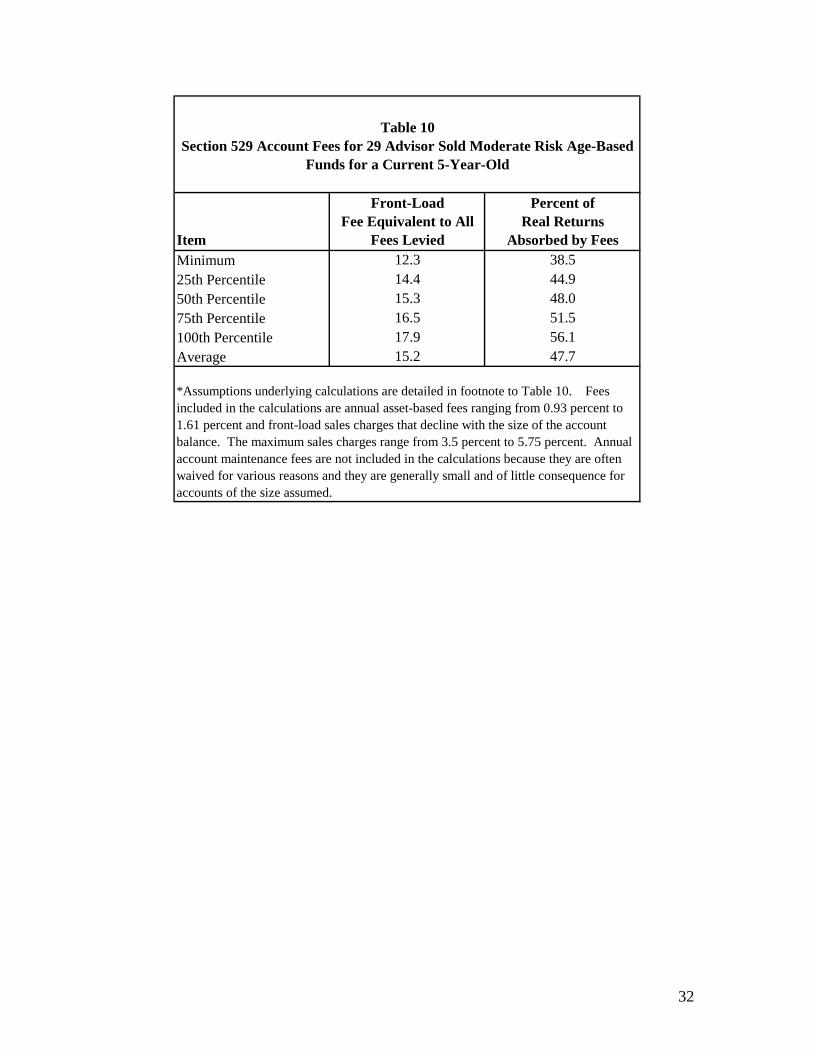
32
Item
Front-LoadFee Equivalent to All
Fees Levied
Percent ofReal Returns
Absorbed by FeesMinimum 12.3 38.525th Percentile 14.4 44.950th Percentile 15.3 48.075th Percentile 16.5 51.5100th Percentile 17.9 56.1Average 15.2 47.7
*Assumptions underlying calculations are detailed in footnote to Table 10. Fees included in the calculations are annual asset-based fees ranging from 0.93 percent to 1.61 percent and front-load sales charges that decline with the size of the account balance. The maximum sales charges range from 3.5 percent to 5.75 percent. Annual account maintenance fees are not included in the calculations because they are often waived for various reasons and they are generally small and of little consequence for accounts of the size assumed.
Table 10Section 529 Account Fees for 29 Advisor Sold Moderate Risk Age-Based
Funds for a Current 5-Year-Old

33
Plan Plan TypePayouts Can be Directed to Privateand Out-of-State Schools?
Alabama Contract YesFlorida Contract YesIllinois Contract YesMaryland Contract YesMassachusetts Voucher Payout to out-of-network schools equal to
contributions adjusted for general price inflationMichigan Contract YesMississippi Contract YesNevada Contract YesPennsylvania Unit YesTennessee Unit YesTexas Promise Contract YesVirginia Contract Payout is lesser payout at a Virginia school and sum
of contributions and actual earningsWashington Unit and Contract Yes
Table 11Prepaid Tuition Plans Currently Open to New Enrollment
Source: Internet web sites of the various plans, links to which are at http://www.collegesavings.org/index.aspx
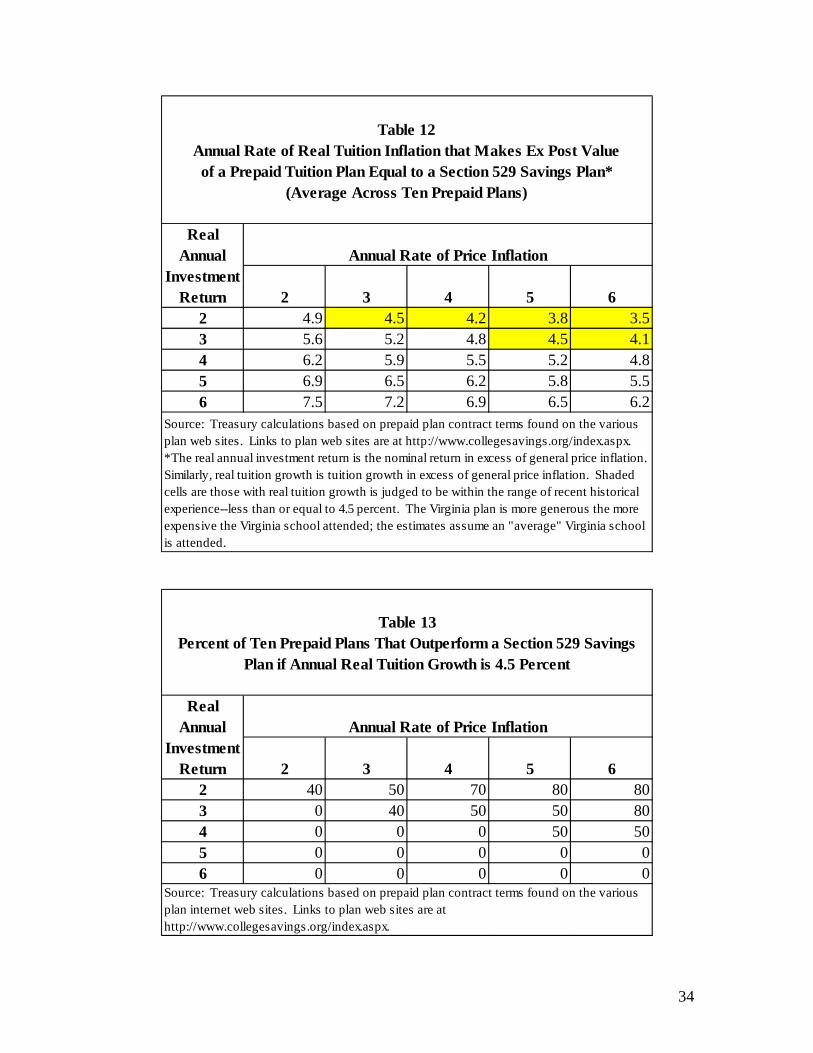
34
2 3 4 5 62 4.9 4.5 4.2 3.8 3.53 5.6 5.2 4.8 4.5 4.14 6.2 5.9 5.5 5.2 4.85 6.9 6.5 6.2 5.8 5.56 7.5 7.2 6.9 6.5 6.2
Table 12Annual Rate of Real Tuition Inflation that Makes Ex Post Value
of a Prepaid Tuition Plan Equal to a Section 529 Savings Plan*(Average Across Ten Prepaid Plans)
RealAnnual
InvestmentReturn
Annual Rate of Price Inflation
Source: Treasury calculations based on prepaid plan contract terms found on the various plan web sites. Links to plan web sites are at http://www.collegesavings.org/index.aspx.*The real annual investment return is the nominal return in excess of general price inflation. Similarly, real tuition growth is tuition growth in excess of general price inflation. Shaded cells are those with real tuition growth is judged to be within the range of recent historical experience--less than or equal to 4.5 percent. The Virginia plan is more generous the more expensive the Virginia school attended; the estimates assume an "average" Virginia school is attended.
2 3 4 5 62 40 50 70 80 803 0 40 50 50 804 0 0 0 50 505 0 0 0 0 06 0 0 0 0 0
Source: Treasury calculations based on prepaid plan contract terms found on the various plan internet web sites. Links to plan web sites are at http://www.collegesavings.org/index.aspx.
Table 13Percent of Ten Prepaid Plans That Outperform a Section 529 Savings
Plan if Annual Real Tuition Growth is 4.5 Percent
RealAnnual
InvestmentReturn
Annual Rate of Price Inflation
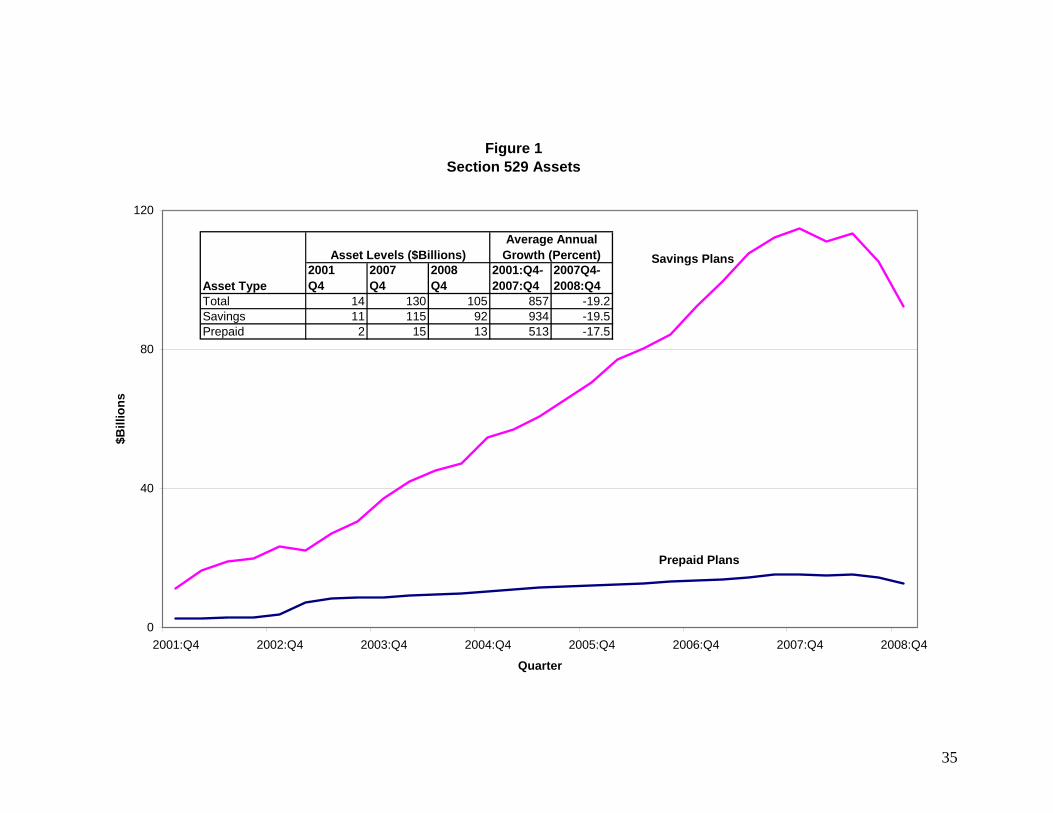
35
Figure 1Section 529 Assets
0
40
80
120
2001:Q4 2002:Q4 2003:Q4 2004:Q4 2005:Q4 2006:Q4 2007:Q4 2008:Q4
Quarter
$Bill
ions
Savings Plans
Prepaid Plans
2001Q4
2007Q4
2008Q4
2001:Q4-2007:Q4
2007Q4-2008:Q4
Total 14 130 105 857 -19.2Savings 11 115 92 934 -19.5Prepaid 2 15 13 513 -17.5
Asset Levels ($Billions)Average Annual
Growth (Percent)
Asset Type
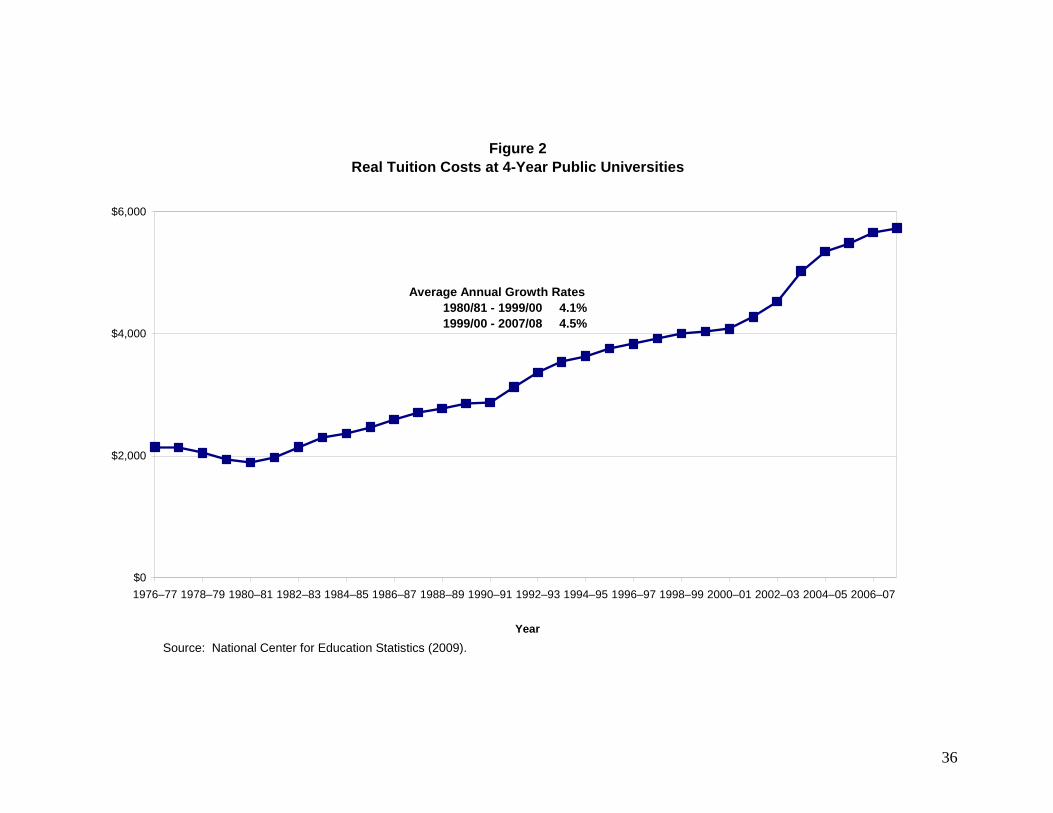
36
Figure 2Real Tuition Costs at 4-Year Public Universities
$0
$2,000
$4,000
$6,000
1976–77 1978–79 1980–81 1982–83 1984–85 1986–87 1988–89 1990–91 1992–93 1994–95 1996–97 1998–99 2000–01 2002–03 2004–05 2006–07
Year
Average Annual Growth Rates 1980/81 - 1999/00 4.1% 1999/00 - 2007/08 4.5%
Source: National Center for Education Statistics (2009).
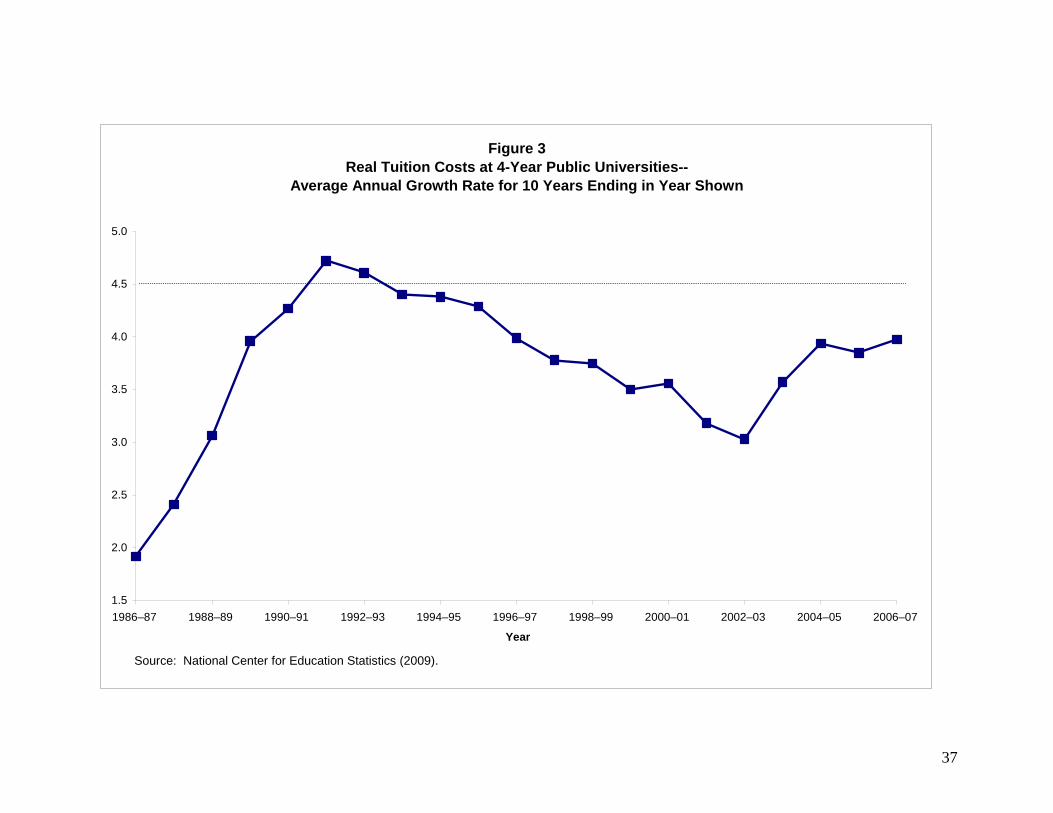
37
Figure 3Real Tuition Costs at 4-Year Public Universities--
Average Annual Growth Rate for 10 Years Ending in Year Shown
1.5
2.0
2.5
3.0
3.5
4.0
4.5
5.0
1986–87 1988–89 1990–91 1992–93 1994–95 1996–97 1998–99 2000–01 2002–03 2004–05 2006–07
Year
Source: National Center for Education Statistics (2009).


![Scholarship · 2021. 3. 15. · 5. PRIZES: Each winner will receive a Florida 529 scholarship from Florida Prepaid [Prize Actual Retail Value (ARV): $1,000]. Prize winners will be](https://static.fdocuments.us/doc/165x107/611b91a64d617d0ecb2891a3/scholarship-2021-3-15-5-prizes-each-winner-will-receive-a-florida-529-scholarship.jpg)

