Mortgage Backed Securities an Actuarial Approach to Cash ...
An Actuarial Approach to Measuring Media Effectiveness
Prepared by Adam Driussi, David Isaacs & Tony Davis
Presented to the Institute of Actuaries of Australia 2005 Biennial Convention 8 May – 11 May 2005
This paper has been prepared for the Institute of Actuaries of Australia’s (Institute) Biennial Convention 2005.
The Institute Council wishes it to be understood that opinions put forward herein are not necessarily those of the
Institute and the Council is not responsible for those opinions.
© The Quantium Group 2005
The Institute of Actuaries of Australia
Level 7 Challis House 4 Martin Place
Sydney NSW Australia 2000
Telephone: +61 2 9233 3466 Facsimile: +61 2 9233 3446
Email: [email protected] Website: www.actuaries.asn.au

An Actuarial Approach to Measuring Media Effectiveness
C:\Documents and Settings\kandis\Local Settings\Temporary Internet Files\OLKB2\An Actuarial Approach to Measuring Media Effectiveness_MortgageCo.doc - ii -
An Actuarial Approach to Measuring Media Effectiveness
1. The Media Market 1
2. Case Study – MortgageCo 7
3. Approach 12
4. Modelling Results 23
5. Model Applications 28
6. Conclusions 34
An Actuarial Approach to Measuring Media Effectiveness
C:\Documents and Settings\kandis\Local Settings\Temporary Internet Files\OLKB2\An Actuarial Approach to Measuring Media Effectiveness_MortgageCo.doc - 1 -
1. The Media Market
Advertising and promotion spend often represents one of the largest and most conspicuous lines of company expenditure, yet it is still relatively unaccountable. The financial results of advertising spend are rarely measured with the same degree of rigour and science as other lines of expenditure. Marketers have traditionally measured results in terms of the relatively qualitative brand measures of customer awareness and consideration. Quite often, very little science is applied to the planning of media investments going forward, whether it be the optimisation of media utilisation or simply the accurate forecasting of sales results. This is a problem which has been around for a long time. As Lord Leverhulme (one of the founders of Lever Brothers), famously commented:
“I know that half of my advertising is wasted, I just don’t know which half.”
1.1. Background
The Australian media market continues to increase in sophistication, complexity and competitiveness. Changing social behaviours, combined with the proliferation of consumer choice in media consumed, has led to the fragmentation of mass audiences into countless personal audiences or niches. An increasing demand for accountability of marketing investments compounds this complexity. Many media owners and agencies, however, have been slow in demonstrating the empirical strengths and weaknesses of different mediums and many existing models of media effectiveness within the marketplace have a number of limitations.
1.2. Media Spend
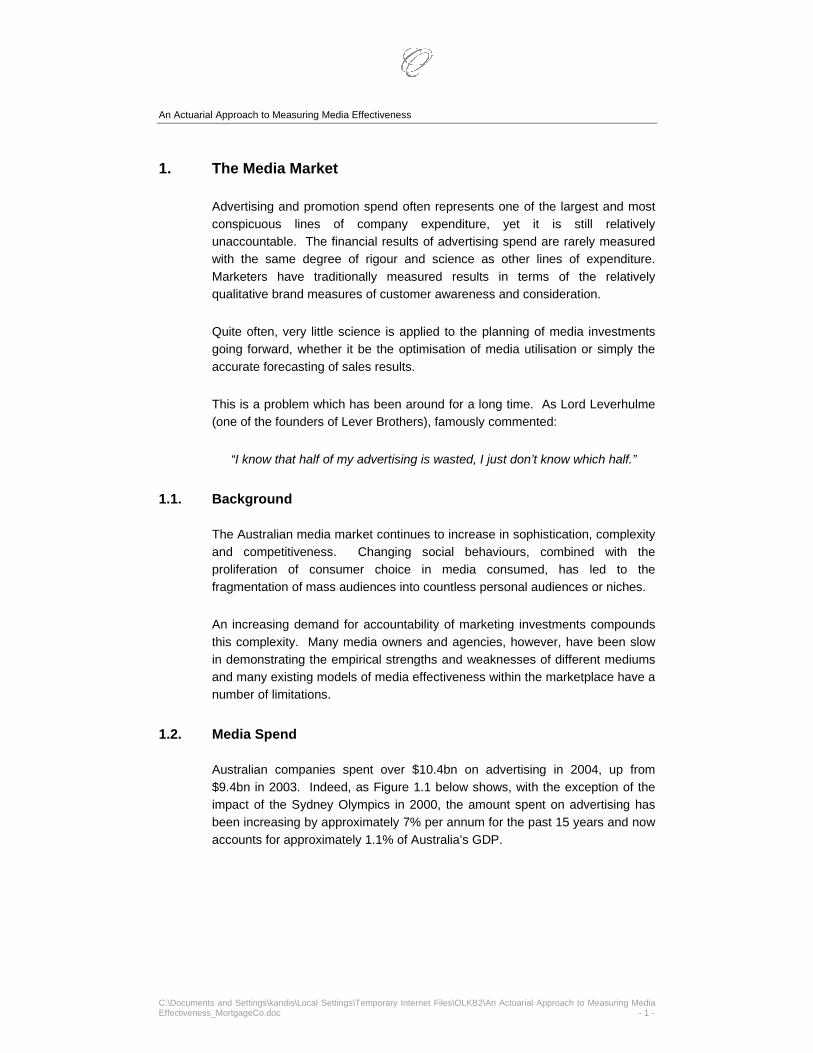
Australian companies spent over $10.4bn on advertising in 2004, up from $9.4bn in 2003. Indeed, as Figure 1.1 below shows, with the exception of the impact of the Sydney Olympics in 2000, the amount spent on advertising has been increasing by approximately 7% per annum for the past 15 years and now accounts for approximately 1.1% of Australia’s GDP.
An Actuarial Approach to Measuring Media Effectiveness
C:\Documents and Settings\kandis\Local Settings\Temporary Internet Files\OLKB2\An Actuarial Approach to Measuring Media Effectiveness_MortgageCo.doc - 2 -
Figure 1.1 – Annual Media Spend1 Source: Commercial Economic Advisory Service of Australia
1: Excludes online advertising
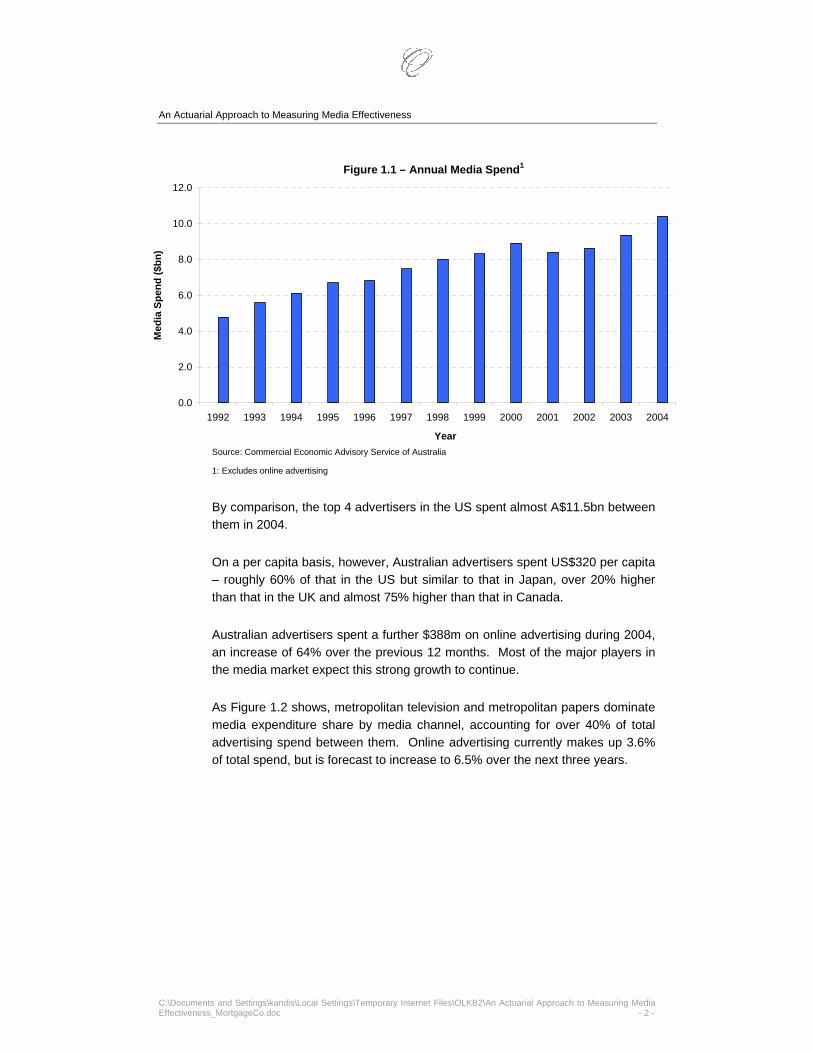
By comparison, the top 4 advertisers in the US spent almost A$11.5bn between them in 2004. On a per capita basis, however, Australian advertisers spent US$320 per capita – roughly 60% of that in the US but similar to that in Japan, over 20% higher than that in the UK and almost 75% higher than that in Canada. Australian advertisers spent a further $388m on online advertising during 2004, an increase of 64% over the previous 12 months. Most of the major players in the media market expect this strong growth to continue. As Figure 1.2 shows, metropolitan television and metropolitan papers dominate media expenditure share by media channel, accounting for over 40% of total advertising spend between them. Online advertising currently makes up 3.6% of total spend, but is forecast to increase to 6.5% over the next three years.
0.0
2.0
4.0
6.0
8.0
10.0
12.0
1992 1993 1994 1995 1996 1997 1998 1999 2000 2001 2002 2003 2004
Year
Med
ia S
pend
($bn
)
An Actuarial Approach to Measuring Media Effectiveness
C:\Documents and Settings\kandis\Local Settings\Temporary Internet Files\OLKB2\An Actuarial Approach to Measuring Media Effectiveness_MortgageCo.doc - 3 -
Figure 1.2 – Main Media Expenditure Share
Source: Commercial Economic Advisory Service of Australia
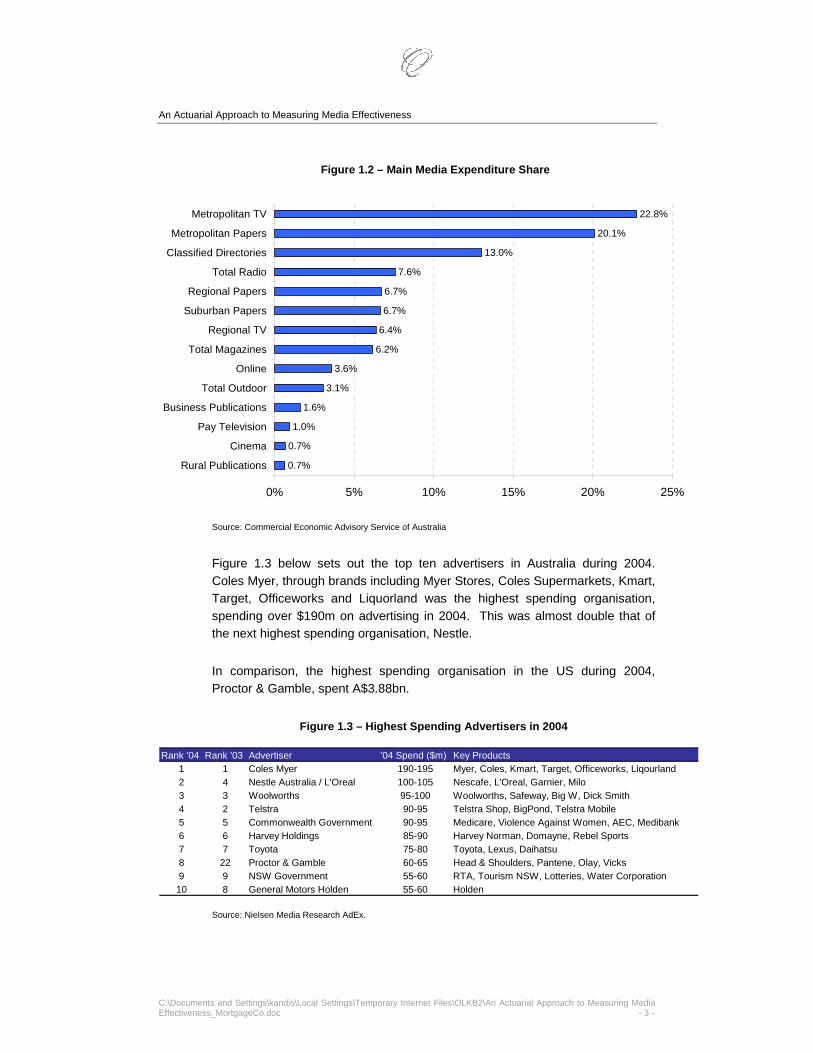
Figure 1.3 below sets out the top ten advertisers in Australia during 2004. Coles Myer, through brands including Myer Stores, Coles Supermarkets, Kmart, Target, Officeworks and Liquorland was the highest spending organisation, spending over $190m on advertising in 2004. This was almost double that of the next highest spending organisation, Nestle. In comparison, the highest spending organisation in the US during 2004, Proctor & Gamble, spent A$3.88bn.
Figure 1.3 – Highest Spending Advertisers in 2004 Source: Nielsen Media Research AdEx.
0.7%
0.7%
1.0%
1.6%
3.1%
3.6%
6.2%
6.4%
6.7%
6.7%
7.6%
13.0%
20.1%
22.8%
0% 5% 10% 15% 20% 25%
Rural Publications
Cinema
Pay Television
Business Publications
Total Outdoor
Online
Total Magazines
Regional TV
Suburban Papers
Regional Papers
Total Radio
Classified Directories
Metropolitan Papers
Metropolitan TV
Rank '04 Rank '03 Advertiser '04 Spend ($m) Key Products1 1 Coles Myer 190-195 Myer, Coles, Kmart, Target, Officeworks, Liqourland2 4 Nestle Australia / L'Oreal 100-105 Nescafe, L'Oreal, Garnier, Milo3 3 Woolworths 95-100 Woolworths, Safeway, Big W, Dick Smith4 2 Telstra 90-95 Telstra Shop, BigPond, Telstra Mobile5 5 Commonwealth Government 90-95 Medicare, Violence Against Women, AEC, Medibank6 6 Harvey Holdings 85-90 Harvey Norman, Domayne, Rebel Sports7 7 Toyota 75-80 Toyota, Lexus, Daihatsu8 22 Proctor & Gamble 60-65 Head & Shoulders, Pantene, Olay, Vicks9 9 NSW Government 55-60 RTA, Tourism NSW, Lotteries, Water Corporation10 8 General Motors Holden 55-60 Holden

An Actuarial Approach to Measuring Media Effectiveness
C:\Documents and Settings\kandis\Local Settings\Temporary Internet Files\OLKB2\An Actuarial Approach to Measuring Media Effectiveness_MortgageCo.doc - 4 -
Overall, the retail industry is by far the largest advertising category for Australian media, accounting for 17% of total spend and more than double the next biggest category (motor vehicles). The finance industry ranks fifth behind entertainment and food. The highest spending financial institution in 2004 was the Promina Group, spending an estimated $40-45m and ranking 25th overall. The only other financial institutions in the top 50 advertisers in 2004 were the Commonwealth Bank of Australia ($35-40m and 32nd overall) and Insurance Australia Group ($25-30m and 43rd overall).
1.3. Media Penetration
It is estimated that consumers see 10,000 advertising messages per day. This remarkable figure is a result of the enormous variety of communications media used by advertisers today. In particular:
• 99% of Australian homes have television with over 60% of homes having two or more sets;
Over 25% of Australian homes also have pay television, which is forecast to grow to 40% over the next two years.
• Newspapers reach approximately 84% of Australia’s population each week with a combined Metropolitan daily circulation of 2.3 million (3.4 million on Sundays);
65% of Australians read a Metropolitan daily newspaper;
• There are 257 commercial radio stations on-air in Australia. In an average week, commercial radio reaches 78% of Australians;
The average Australian aged over 10 spends almost 20 hours per week listening to radio, increasing to almost 24 hours per week for people aged 55 or older;
• The reach of magazines as an industry continues to increase;
There have been over 300 magazine launches since 1990 leading to a 75% increase in the number of titles;
Australians over thirteen buy 21 magazines per year on average and 43% of children aged six to thirteen read a magazine monthly;
Women’s Health and Lifestyle magazines account for 68% of total magazine sales;

An Actuarial Approach to Measuring Media Effectiveness
C:\Documents and Settings\kandis\Local Settings\Temporary Internet Files\OLKB2\An Actuarial Approach to Measuring Media Effectiveness_MortgageCo.doc - 5 -
• Not surprisingly, online advertising is predicted to explode as an advertising medium. Approximately 75% of Australians have internet access, with almost 50% of the home internet population now having broadband;
• There are a countless additional mediums such as in store promotions, sponsorships, outdoor, cinema, ambient (from pavement to sky writing), product placement in movies, etc.
1.4. The Need for Accountability
Increasingly, marketers are being held more accountable for their marketing investments. Advertisers across the board are seeking more robust data to support their spending decisions. Many existing media effectiveness models, however, suffer from a number of limitations:
• They often include subjective inputs, with limited specific understanding of the advertiser’s previous activity and directly related results;
for example, assumptions are often based on the perceived strength of each medium;
• There is limited separation in the modelling between brand building and response objectives, making it very difficult to develop an understanding of the return being generated on marketing investments – either in the short term or longer term;
• There is often no explicit relationship identified between cause and effect;
• Many models focus predominantly on television, which, whilst an important medium, still accounts for less than 30% of total media spend;
• There is typically a limited feedback loop (or control cycle) to assess the on-going effectiveness of the modelled programme;
• Model outputs often require interpretation by the client to be translated into a specific media schedule; and
• The models are typically offered by media agencies who are incentivised through their remuneration structures to maintain and grow media expenditure!
An actuarial approach to modelling media effectiveness can overcome the majority of these limitations.

An Actuarial Approach to Measuring Media Effectiveness
C:\Documents and Settings\kandis\Local Settings\Temporary Internet Files\OLKB2\An Actuarial Approach to Measuring Media Effectiveness_MortgageCo.doc - 6 -
The Challenge for Marketers
The types of questions marketers are increasingly being asked include:
• What is the relationship between marketing investment and sales revenue?
If I stopped advertising, how long would it take for my sales levels to drop?
If I halved my advertising spend what would happen to my volume of leads?
Which components of my media activity work best (and worst)?
• Where could additional sales come from?
Where have I been effective at converting sales from other brands and how effective have I been?
Which medium generates the greatest effect and efficiency and is there more capacity in this channel?
• What is the optimal marketing investment to achieve my market share goals?
What is the brand versus immediate ROI trade-off in using above and below the line (for example, direct mail) marketing activity?
When, and through which channels, should I target my prospects?
• What is the optimal media spend by media channel, by region, in order to maximise leads or sales given a fixed spend;
• How do media strategies differ under different combinations of external market conditions, competitor activity, brand strength and offer/creative?
The remainder of this paper describes a case study of a project designed to help address a number of these challenges.

An Actuarial Approach to Measuring Media Effectiveness
C:\Documents and Settings\kandis\Local Settings\Temporary Internet Files\OLKB2\An Actuarial Approach to Measuring Media Effectiveness_MortgageCo.doc - 7 -
2. Case Study – MortgageCo
We have undertaken a programme of this nature with one of Australia’s largest mortgage companies. We have named the client MortgageCo and whilst the methodology we adopted is accurately described, all the charts and results illustrated have been disguised to protect our client’s commercial confidentiality. MortgageCo wished to implement a robust methodology for allocating and optimising its media spend. In particular, they wished to develop a system to allow them to understand optimal media spend by media channel and by region to maximise leads generated given a fixed media spend. MortgageCo also wished to understand how their strategy might change under different combinations of market conditions and competitor activity. Figure 2.1 shows the various internal and external factors which drive performance outcomes for MortgageCo.
Figure 2.1 – High Level Drivers of Performance Outcomes
Inputs Outcomes
Exte
rnal
Fac
tors
(Unc
ontr
olla
ble)
Inte
rnal
Fac
tors
(C
ontr
olla
ble) Media Used
Offer & Creative
Market Conditions
Competitor Activity
Enquiries
Brand Strength
Performance Efficiency
&
Brand Growth
Sales
Inputs Outcomes
Exte
rnal
Fac
tors
(Unc
ontr
olla
ble)
Inte
rnal
Fac
tors
(C
ontr
olla
ble) Media Used
Offer & Creative
Market Conditions
Competitor Activity
Enquiries
Brand Strength
Performance Efficiency
&
Brand Growth
Sales
An Actuarial Approach to Measuring Media Effectiveness
C:\Documents and Settings\kandis\Local Settings\Temporary Internet Files\OLKB2\An Actuarial Approach to Measuring Media Effectiveness_MortgageCo.doc - 8 -
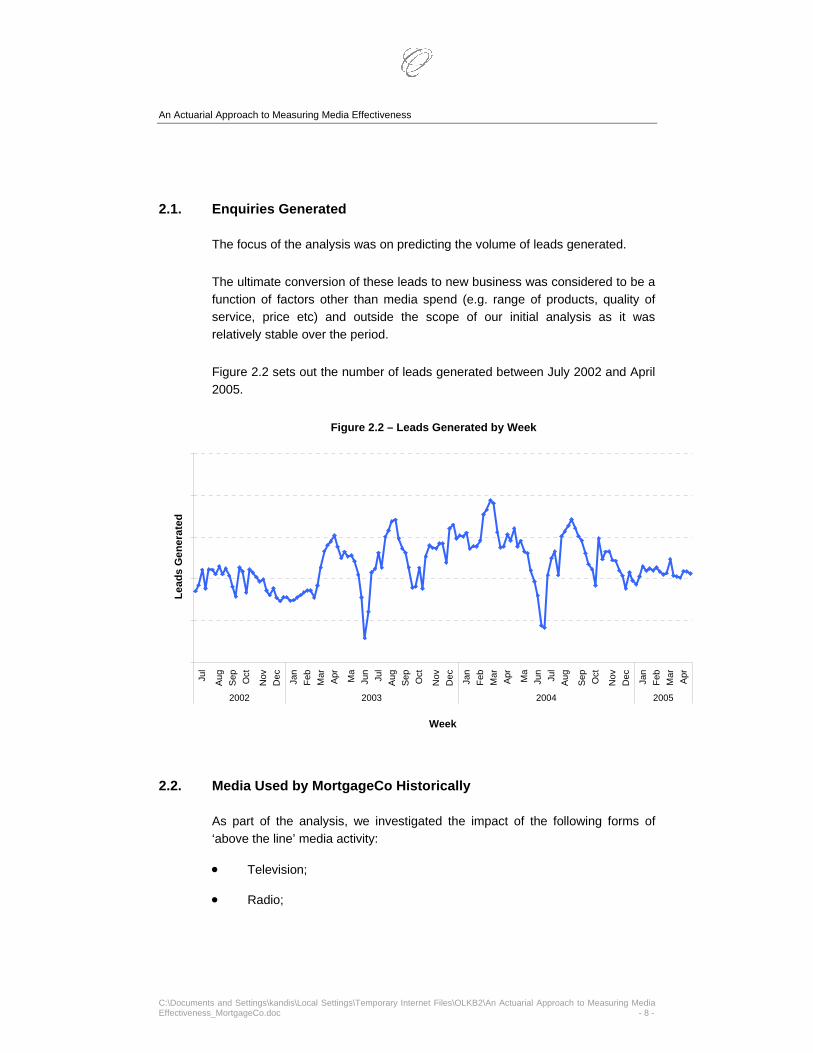
2.1. Enquiries Generated
The focus of the analysis was on predicting the volume of leads generated. The ultimate conversion of these leads to new business was considered to be a function of factors other than media spend (e.g. range of products, quality of service, price etc) and outside the scope of our initial analysis as it was relatively stable over the period. Figure 2.2 sets out the number of leads generated between July 2002 and April 2005.
Figure 2.2 – Leads Generated by Week
2.2. Media Used by MortgageCo Historically
As part of the analysis, we investigated the impact of the following forms of ‘above the line’ media activity:
• Television;
• Radio;
Jul
Aug
Sep Oct
Nov
Dec Jan
Feb
Mar
Apr Ma
Jun
Jul
Aug
Sep Oct
Nov
Dec Jan
Feb
Mar
Apr Ma
Jun
Jul
Aug
Sep Oct
Nov
Dec Jan
Feb
Mar
Apr
2002 2003 2004 2005
Week
Lead
s G
ener
ated
An Actuarial Approach to Measuring Media Effectiveness
C:\Documents and Settings\kandis\Local Settings\Temporary Internet Files\OLKB2\An Actuarial Approach to Measuring Media Effectiveness_MortgageCo.doc - 9 -
• Press (national, metropolitan, regional and community press);
• Magazines;
• Online;
• Other, including Cinema, Billboards, and Bus Panels.
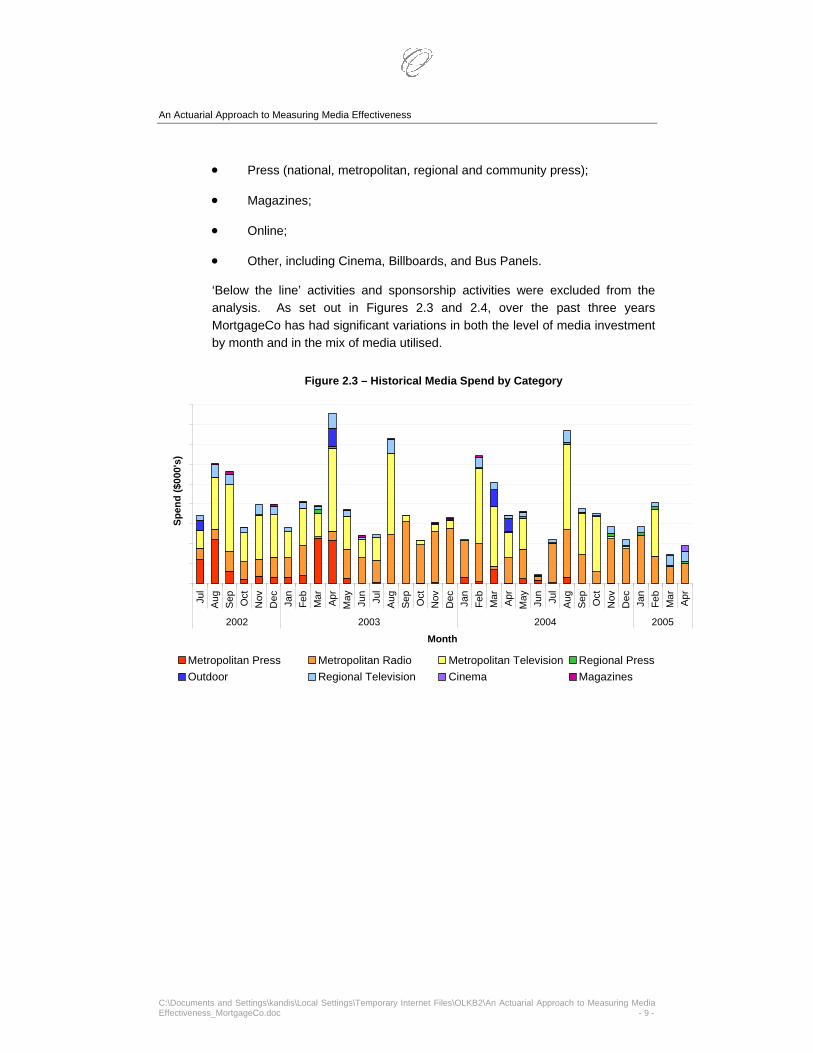
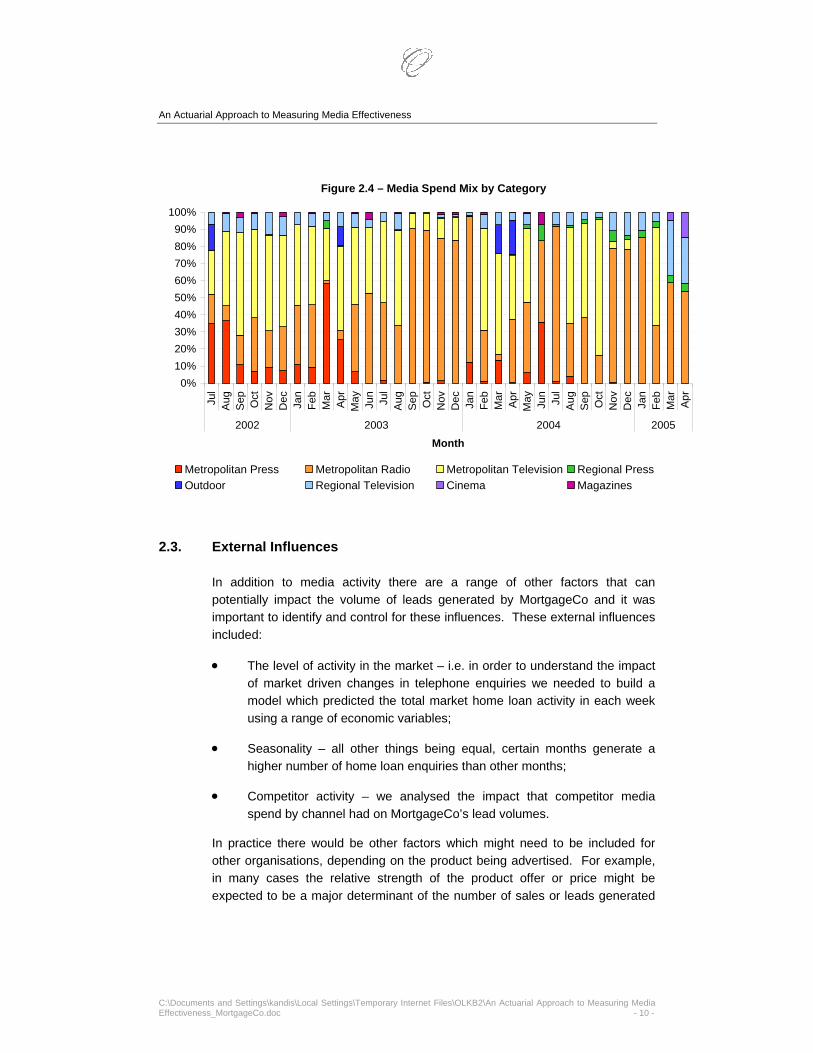
‘Below the line’ activities and sponsorship activities were excluded from the analysis. As set out in Figures 2.3 and 2.4, over the past three years MortgageCo has had significant variations in both the level of media investment by month and in the mix of media utilised.
Figure 2.3 – Historical Media Spend by Category
Jul
Aug
Sep
Oct
Nov
Dec Jan
Feb
Mar Ap
rM
ay Jun
Jul
Aug
Sep
Oct
Nov
Dec Jan
Feb
Mar Ap
rM
ay Jun
Jul
Aug
Sep
Oct
Nov
Dec Jan
Feb
Mar Ap
r
2002 2003 2004 2005
Month
Spen
d ($
000'
s)
Metropolitan Press Metropolitan Radio Metropolitan Television Regional PressOutdoor Regional Television Cinema Magazines
An Actuarial Approach to Measuring Media Effectiveness
C:\Documents and Settings\kandis\Local Settings\Temporary Internet Files\OLKB2\An Actuarial Approach to Measuring Media Effectiveness_MortgageCo.doc - 10 -
Figure 2.4 – Media Spend Mix by Category
2.3. External Influences
In addition to media activity there are a range of other factors that can potentially impact the volume of leads generated by MortgageCo and it was important to identify and control for these influences. These external influences included:
• The level of activity in the market – i.e. in order to understand the impact of market driven changes in telephone enquiries we needed to build a model which predicted the total market home loan activity in each week using a range of economic variables;
• Seasonality – all other things being equal, certain months generate a higher number of home loan enquiries than other months;
• Competitor activity – we analysed the impact that competitor media spend by channel had on MortgageCo’s lead volumes.
In practice there would be other factors which might need to be included for other organisations, depending on the product being advertised. For example, in many cases the relative strength of the product offer or price might be expected to be a major determinant of the number of sales or leads generated
0%10%20%30%40%50%60%70%80%90%
100%Ju
lA
ugS
ep Oct
Nov
Dec Jan
Feb
Mar
Apr
May Jun
Jul
Aug
Sep Oct
Nov
Dec Jan
Feb
Mar
Apr
May Jun
Jul
Aug
Sep Oct
Nov
Dec Jan
Feb
Mar
Apr
2002 2003 2004 2005
Month
Metropolitan Press Metropolitan Radio Metropolitan Television Regional PressOutdoor Regional Television Cinema Magazines

An Actuarial Approach to Measuring Media Effectiveness
C:\Documents and Settings\kandis\Local Settings\Temporary Internet Files\OLKB2\An Actuarial Approach to Measuring Media Effectiveness_MortgageCo.doc - 11 -
by a particular media campaign. In MortgageCo’s case these were deemed to be less important.

An Actuarial Approach to Measuring Media Effectiveness
C:\Documents and Settings\kandis\Local Settings\Temporary Internet Files\OLKB2\An Actuarial Approach to Measuring Media Effectiveness_MortgageCo.doc - 12 -
3. Approach
The key purpose of our analysis was to isolate the impact of media on the volume of leads generated. A wide range of factors were tested simultaneously for their impact on this volume, including many out of MortgageCo’s control. We extracted detailed information from MortgageCo’s systems including particulars relating to MortgageCo’s historic media schedule and to each lead generated. The specific methodology used to determine the impact of each factor (or group of factors) is not discussed in detail in this paper due to commercial sensitivity.
3.1. Measuring Exposure to Advertising
For each different form of advertising we required a suitable measure of the exposed population in order to quantify the response driven by that exposure. There are a variety of potential measures of exposure that are used to measure media response. These include:
• Spend – The amount outlaid by the advertiser by media channel;
• Opportunities to see/hear – The potential audience for the media;
• Impacts – The number of audience ‘hits’ for the media;
• Reach – The number of unique audience ‘hits’ for the media;
• Frequency – The average number of ‘hits’ per audience member for the media.
Our analysis focussed on the relationship between impacts (or a population weighted measure of impacts) and the enquiries that MortgageCo received. Each media channel has its own variation of determining impacts. The relevant measures utilised are described below:
• Television – The population weighted measure for television impacts is called TARPs – Television Average Rating Points. TARPs are measured by television ratings companies such as OzTAM and AC Neilsen and can be differentiated by geography and demographic;
• Radio – For radio we constructed a measure of impacts from audience listenership and geodemographic data;

An Actuarial Approach to Measuring Media Effectiveness
C:\Documents and Settings\kandis\Local Settings\Temporary Internet Files\OLKB2\An Actuarial Approach to Measuring Media Effectiveness_MortgageCo.doc - 13 -
• Press and Magazines – For press and magazines we constructed a measure of impacts from readership statistics and geodemographic data;
• Online – The relevant measure for online advertising is called impressions. For some websites where advertisements are carried on multiple pages, unique impressions is a more relevant measure;
• Cinema – Cinema audiences are an appropriate measure of impacts for cinema advertising;
• Billboards – RTA (and equivalent) traffic data provides the best measure of impacts for billboard advertising. It should be noted, however, that these measures tend to be more readily aligned to an opportunity to see rather than directly measuring impacts;
• Bus Panels – Traffic data and relevant bus routing maps are helpful in estimating impacts for bus panels.
As the demand for robust data has increased, audience measurement methodologies have also improved significantly, particularly for mediums such as cinema and outdoor.
3.2. Media Data
Data for each of the media channels were sourced separately and there were significant differences between the veracity and completeness of the data available by media channel.
Television
For MortgageCo and each competitor we collated details of every television advertisement run between July 2002 and April 2005. For each advertisement we captured:
• City;
• Television network;
• Company;
• Product/Campaign;
• Duration of advertisement;
• Day of week;

An Actuarial Approach to Measuring Media Effectiveness
C:\Documents and Settings\kandis\Local Settings\Temporary Internet Files\OLKB2\An Actuarial Approach to Measuring Media Effectiveness_MortgageCo.doc - 14 -
• Date;
• Time;
• Program;
• Genre (e.g. news, comedy, sport);
• Content classification;
• Number of advertisements in break;
• Position of advertisement in break;
• Position of break in program;
• Position of advertisement relative to network promotions;
• TARPs (including by key demographics).
For each of the 94 commercial television stations in Australia (including regionals and pay television) we overlaid coverage maps to allow us to identify which of the population were exposed to each advertisement. Figure 3.1 below sets out an extract from MortgageCo’s television scheduling for the week commencing 1 September 2003.
Figure 3.1 – Sample Television Schedule Extract
Station Duration Day Date Time ProgramNCA Prior*
Position In Break
Number in Break
Break in Program
NCA After*
TARPs 25-54
TARPs 25-39
HSV7 30 Mon 1/09/2003 04:52pm Seven News Y 5 6 2 N 0.6 0.8GTV9 30 Mon 1/09/2003 12:48pm Days of Our Lives Y 4 6 5 N 1.4 0.4GTV9 30 Mon 1/09/2003 05:03pm Burgo's Catch Phrase N 2 5 1 N 10.2 9.4HSV7 30 Tue 2/09/2003 04:52pm Seven News at 4.30 Y 4 5 2 N 9.7 9.9GTV9 30 Tue 2/09/2003 03:48pm Dr. Phil Y 4 5 5 Y 6.0 6.0GTV9 30 Tue 2/09/2003 04:46pm Entertainment Tonight Y 2 5 2 Y 4.8 2.4GTV9 30 Tue 2/09/2003 04:54pm Entertainment Tonight Y 3 5 3 Y 4.4 3.0GTV9 30 Tue 2/09/2003 05:12pm Burgo's Catch Phrase Y 3 7 2 Y 3.8 4.2GTV9 30 Tue 2/09/2003 10:19pm Stingers N 1 3 4 Y 2.3 2.3GTV9 15 Tue 2/09/2003 11:47pm Nightline N 1 5 2 N 15.6 17.4HSV7 15 Wed 3/09/2003 04:58pm Inter/Prior Program N 1 4 1 N 4.3 3.0HSV7 30 Wed 3/09/2003 05:15pm M*A*S*H N 3 5 3 N 1.3 0.8HSV7 30 Wed 3/09/2003 08:17pm Hot Auctions N 2 6 2 N 2.5 2.1GTV9 30 Wed 3/09/2003 12:08pm Days of Our Lives Y 1 7 1 N 12.0 13.0GTV9 30 Thu 4/09/2003 12:45pm Days of Our Lives Y 2 7 5 N 4.4 5.2GTV9 15 Thu 4/09/2003 08:10pm Getaway Y 4 5 4 N 3.0 3.7HSV7 30 Fri 5/09/2003 06:57pm Today Tonight Y 4 5 3 N 12.9 10.3GTV9 30 Fri 5/09/2003 08:03pm Burke's Backyard N 1 5 3 Y 7.5 7.5GTV9 15 Sat 6/09/2003 03:22pm So Fresh Y 5 6 5 Y 3.3 2.6GTV9 30 Sat 6/09/2003 04:38pm The Car Show Y 6 6 2 N 3.7 4.7GTV9 15 Sat 6/09/2003 06:08pm National Nine News Saturday N 3 6 1 N 11.2 12.0GTV9 15 Sat 6/09/2003 06:46pm Australia's Funniest Home Vide Y 7 8 2 N 10.9 10.0HSV7 30 Sun 7/09/2003 08:22am Sunday Sunrise Y 3 7 2 Y 1.1 1.5HSV7 15 Sun 7/09/2003 08:59am Sunday Sunrise Y 7 8 4 N 1.4 0.8HSV7 30 Sun 7/09/2003 09:11am Sunday Sunrise Y 2 9 5 Y 0.9 0.6HSV7 30 Sun 7/09/2003 04:47pm Movie: Air Bud Y 3 7 6 N 2.0 2.2HSV7 30 Sun 7/09/2003 09:09pm Movie: Woman On Top Y 5 7 3 N 9.4 8.0

An Actuarial Approach to Measuring Media Effectiveness
C:\Documents and Settings\kandis\Local Settings\Temporary Internet Files\OLKB2\An Actuarial Approach to Measuring Media Effectiveness_MortgageCo.doc - 15 -
Radio
We collated summarised details of MortgageCo’s weekly radio advertising schedule. This included:
• City;
• Number of advertisements played;
• Laydown (scheduling by day of week and time of day);
• Station;
• Genre;
• Network.
For each competitor we collated summarised details of the monthly radio advertising schedule. These incorporated:
• City;
• Number of advertisements played;
• Station;
• Genre;
• Network.
Against each profile of advertisements, we overlaid network coverage maps and audience listenership by time of day and day of week.
National, Metropolitan and Regional Press
For MortgageCo and each competitor we collated details of every print advertisement run in every national, metropolitan and regional newspaper. This covered:
• Publication;
• Company;
• Product/Campaign;
• Day;
• Date of publication;
An Actuarial Approach to Measuring Media Effectiveness
C:\Documents and Settings\kandis\Local Settings\Temporary Internet Files\OLKB2\An Actuarial Approach to Measuring Media Effectiveness_MortgageCo.doc - 16 -
• Page;
• Size;
• Colouring;
• Position on page.
Against each publication we overlaid distribution and readership details to determine an exposed population.
Community Newspapers
For MortgageCo we collated weekly summarised data covering advertisements lodged in community newspapers Australia-wide. This covered:
• Publication;
• Number of advertisements.
Once again, we overlaid distribution and readership details against each publication to determine an exposed population.
Magazines
For MortgageCo and each competitor we collated details of every print advertisement run in every national, metropolitan and regional magazine. These covered mainstream publications such as Cleo, Woman’s Day and The Good Weekend, as well as trade publications such as Your Mortgage Magazine. The data collected includes:
• Publication;
• Company;
• Product/Campaign;
• Date of publication;
• Page;
• Size;
• Colouring;
• Position on page;

An Actuarial Approach to Measuring Media Effectiveness
C:\Documents and Settings\kandis\Local Settings\Temporary Internet Files\OLKB2\An Actuarial Approach to Measuring Media Effectiveness_MortgageCo.doc - 17 -
Against each magazine we overlaid distribution and readership details to determine an exposed population.
Online
We collected internet exposures in terms of impressions and unique impressions for websites with MortgageCo advertising attached.
Cinema
We collected total levels of activity for MortgageCo and competitors for their cinema advertising.
Outdoor
We collected data on the location of MortgageCo’s billboards and periods of advertising. We also collected data on MortgageCo’s bus panel exposure by city, route and time period. For competitors, we collected data outlining the total level of outdoor activity.
3.3. Market Activity
In order to understand the impact of market driven changes in telephone enquiries we needed to understand the relative market strength for the duration of the modelling period. To this extent, we collected economic and market indicators including:
• Interest rates;
• Historical lending;
• Unemployment statistics;
• Market yields and equity returns;
• GDP measures;
• Inflation measures;
• Population growth statistics;
• Migration statistics;
• Housing affordability measures;
An Actuarial Approach to Measuring Media Effectiveness
C:\Documents and Settings\kandis\Local Settings\Temporary Internet Files\OLKB2\An Actuarial Approach to Measuring Media Effectiveness_MortgageCo.doc - 18 -
• Historical median house price movements.
We used these factors to build a model which predicted the total market home loan activity in each week. The output of this model was then used as a factor in our other models predicting lead volumes for MortgageCo.
3.4. Other Data
In addition to media and market activity there are a range of other factors that can potentially impact the volume of leads generated by MortgageCo and it was important to identify and control for these influences. These included:
• Socio-demographic factors;
• Geographic factors; and
• Seasonality.
We collected a range of additional information to isolate these external influences. In particular, we collated socio-demographic information about each of the geographical regions we analysed, including details of:
• Income;
• Education;
• Multiculturalism; and
• Household composition and family size.
3.5. Model Fitting
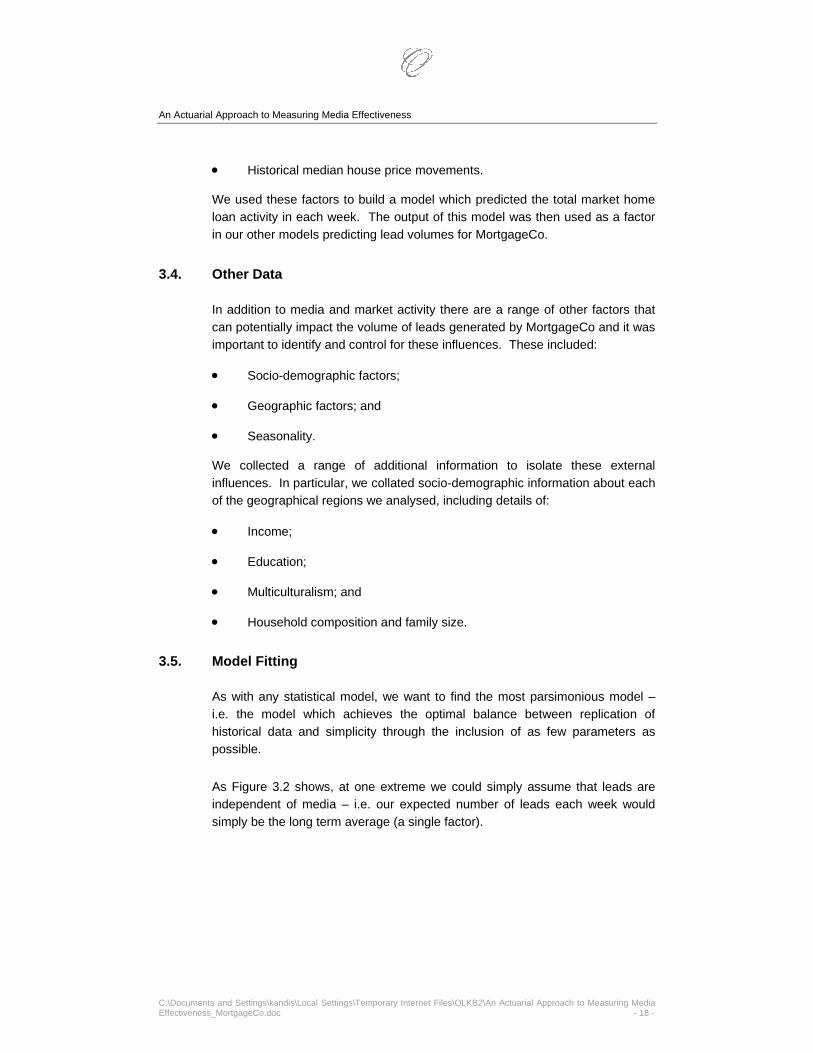
As with any statistical model, we want to find the most parsimonious model – i.e. the model which achieves the optimal balance between replication of historical data and simplicity through the inclusion of as few parameters as possible. As Figure 3.2 shows, at one extreme we could simply assume that leads are independent of media – i.e. our expected number of leads each week would simply be the long term average (a single factor).
An Actuarial Approach to Measuring Media Effectiveness
C:\Documents and Settings\kandis\Local Settings\Temporary Internet Files\OLKB2\An Actuarial Approach to Measuring Media Effectiveness_MortgageCo.doc - 19 -
Figure 3.2 – Actual versus Predicted Leads (Using Long Term Average) At the other extreme we could fit a model which perfectly predicts the historical experience by including every possible factor to historically influence lead volumes (known as over-fitting) but this would almost certainly ensure that our model does not accurately predict future lead volumes. We need to find a balance between adequately explaining the historical period and meaningfully predicting future lead volumes.
Modelling Using Only MortgageCo’s Media Spend
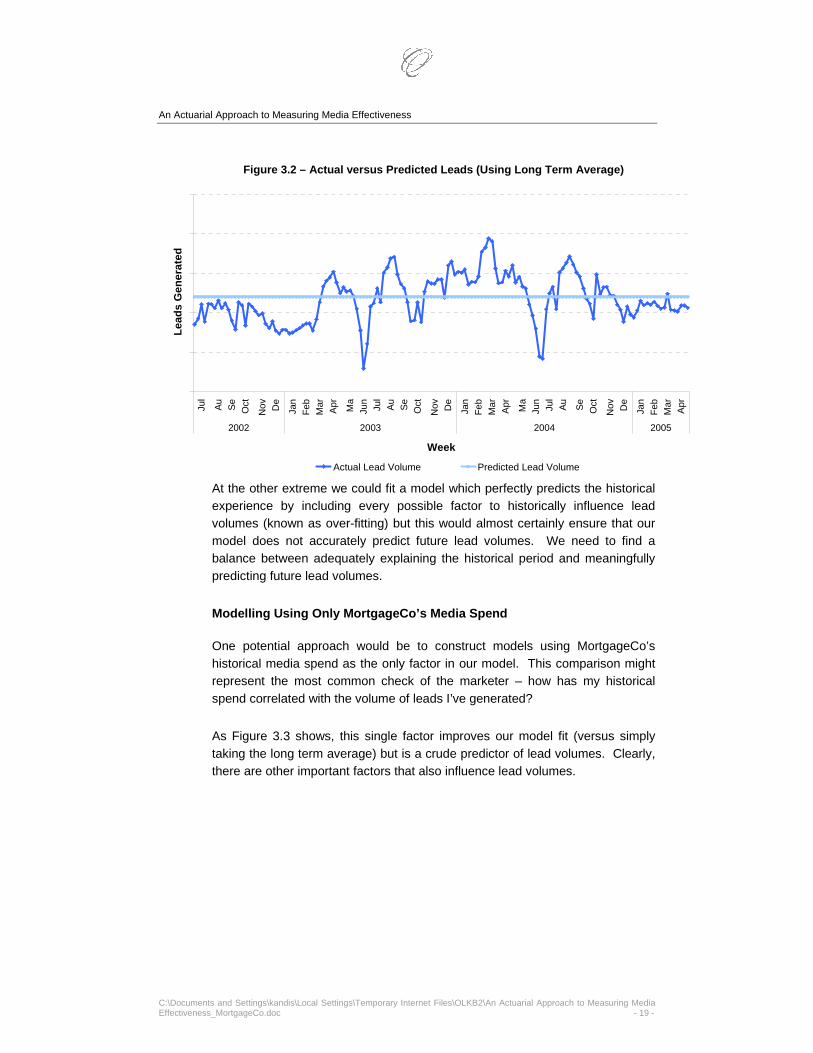
One potential approach would be to construct models using MortgageCo’s historical media spend as the only factor in our model. This comparison might represent the most common check of the marketer – how has my historical spend correlated with the volume of leads I’ve generated? As Figure 3.3 shows, this single factor improves our model fit (versus simply taking the long term average) but is a crude predictor of lead volumes. Clearly, there are other important factors that also influence lead volumes.
Jul
Au Se Oct
Nov De
Jan
Feb
Mar
Apr Ma
Jun
Jul
Au Se Oct
Nov De
Jan
Feb
Mar
Apr Ma
Jun
Jul
Au Se Oct
Nov De
Jan
Feb
Mar
Apr
2002 2003 2004 2005
Week
Lead
s G
ener
ated
Actual Lead Volume Predicted Lead Volume
An Actuarial Approach to Measuring Media Effectiveness
C:\Documents and Settings\kandis\Local Settings\Temporary Internet Files\OLKB2\An Actuarial Approach to Measuring Media Effectiveness_MortgageCo.doc - 20 -
Figure 3.3 – Actual versus Predicted Leads (Using Only MortgageCo Media Spend) There are a number of reasons, however, why media spend does not make sense to include in our predictive model. Most notably, consumers are influenced by exposure to advertising, not advertising spend. MortgageCo’s ability to negotiate better deals on advertising going forward will not result in fewer leads. Conversely, if market rates doubled for the same level of exposure, MortgageCo would not expect a doubling in the number of leads. Indeed, one of the key reasons for developing a model of media effectiveness is to identify which media channels are more efficient than others (in terms of incremental leads generated per incremental dollar spent).
Modelling Using MortgageCo and Competitor Exposures by Media Channel
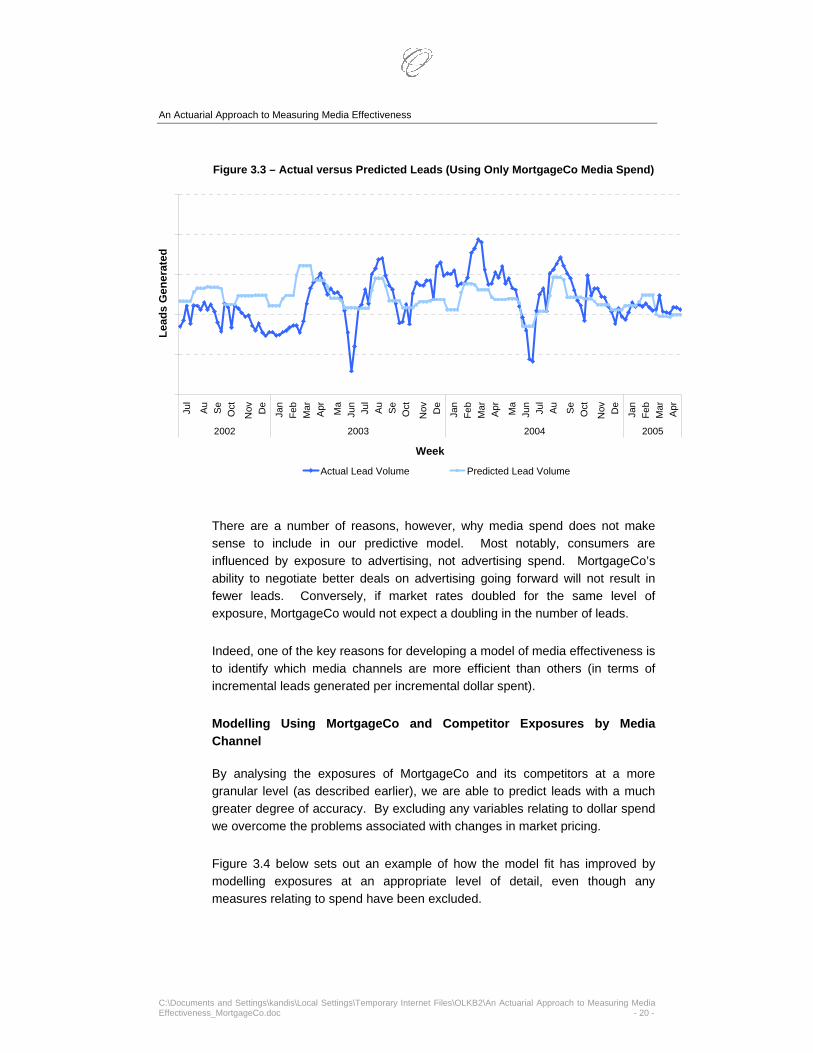
By analysing the exposures of MortgageCo and its competitors at a more granular level (as described earlier), we are able to predict leads with a much greater degree of accuracy. By excluding any variables relating to dollar spend we overcome the problems associated with changes in market pricing. Figure 3.4 below sets out an example of how the model fit has improved by modelling exposures at an appropriate level of detail, even though any measures relating to spend have been excluded.
Jul
Au Se Oct
Nov De
Jan
Feb
Mar
Apr Ma
Jun
Jul
Au Se Oct
Nov De
Jan
Feb
Mar
Apr Ma
Jun
Jul
Au Se Oct
Nov De
Jan
Feb
Mar
Apr
2002 2003 2004 2005
Week
Lead
s G
ener
ated
Actual Lead Volume Predicted Lead Volume
An Actuarial Approach to Measuring Media Effectiveness
C:\Documents and Settings\kandis\Local Settings\Temporary Internet Files\OLKB2\An Actuarial Approach to Measuring Media Effectiveness_MortgageCo.doc - 21 -
Section 4 discusses a number of the factors included in the model developed for MortgageCo.
Figure 3.4 – Actual versus Predicted Leads (MortgageCo and Competitor Exposures)
Our final model included a number of additional factors which further improved the model fit shown above including seasonality, market strength and various socio-demographic factors.
Model Testing
The models developed were then tested rigorously against various hold-out samples and new data periods to ensure their predictive power.
3.6. Scenario Testing, Simulation and Optimisation
Once the models proved to be predictive we were able to test a range of alternative media strategies prior to implementation. In particular, we varied parameters such as the total media acquired (in terms of exposures as opposed to dollars spent), channel mix and timing to examine the effect of each strategy on predicted customer behaviour.
Jul
Au Se Oct
Nov De
Jan
Feb
Mar
Apr Ma
Jun
Jul
Au Se Oct
Nov De
Jan
Feb
Mar
Apr Ma
Jun
Jul
Au Se Oct
Nov De
Jan
Feb
Mar
Apr
2002 2003 2004 2005
Week
Lead
s G
ener
ated
Actual Lead Volume Predicted Lead Volume

An Actuarial Approach to Measuring Media Effectiveness
C:\Documents and Settings\kandis\Local Settings\Temporary Internet Files\OLKB2\An Actuarial Approach to Measuring Media Effectiveness_MortgageCo.doc - 22 -
The natural extension of scenario testing was to find the scenario which provided the optimal outcome for a given set of objectives and constraints. A large number of simulations were run varying all the drivers of lead generation in order to find the optimal media strategy. The simulation model was constrained in order to only consider strategies in line with other business requirements. Section 5 discusses some of the applications of the scenario testing, simulation and optimisation processes in more detail.

An Actuarial Approach to Measuring Media Effectiveness
C:\Documents and Settings\kandis\Local Settings\Temporary Internet Files\OLKB2\An Actuarial Approach to Measuring Media Effectiveness_MortgageCo.doc - 23 -
4. Modelling Results
This section describes a subset of the factors that we identified as being predictive for MortgaegCo. Not all factors have been shown, and the model relativities within each factor have been hidden for commercial reasons. Over 400 factors were investigated, with approximately 30 being included in our final models. In practice, the combination of quantifying the incremental impact of each factor (and estimating the associated financial impact) against the additional cost associated with different exposure levels will enable MortgageCo to optimise its media spend going forward. For example, the incremental impact of acquiring additional TARPs for Television (and the associated financial benefit to MortgageCo) can be directly assessed against the dollar cost for acquiring those additional TARPs in the market. The results set out in this section relate specifically to the MortgageCo case study. Whilst the same methodology can be been applied to other products and industries, each advertiser has its own unique set of circumstances that need to be allowed for and the impact of each medium (and results within each medium) will vary depending on those circumstances.
4.1. Television Related Factors
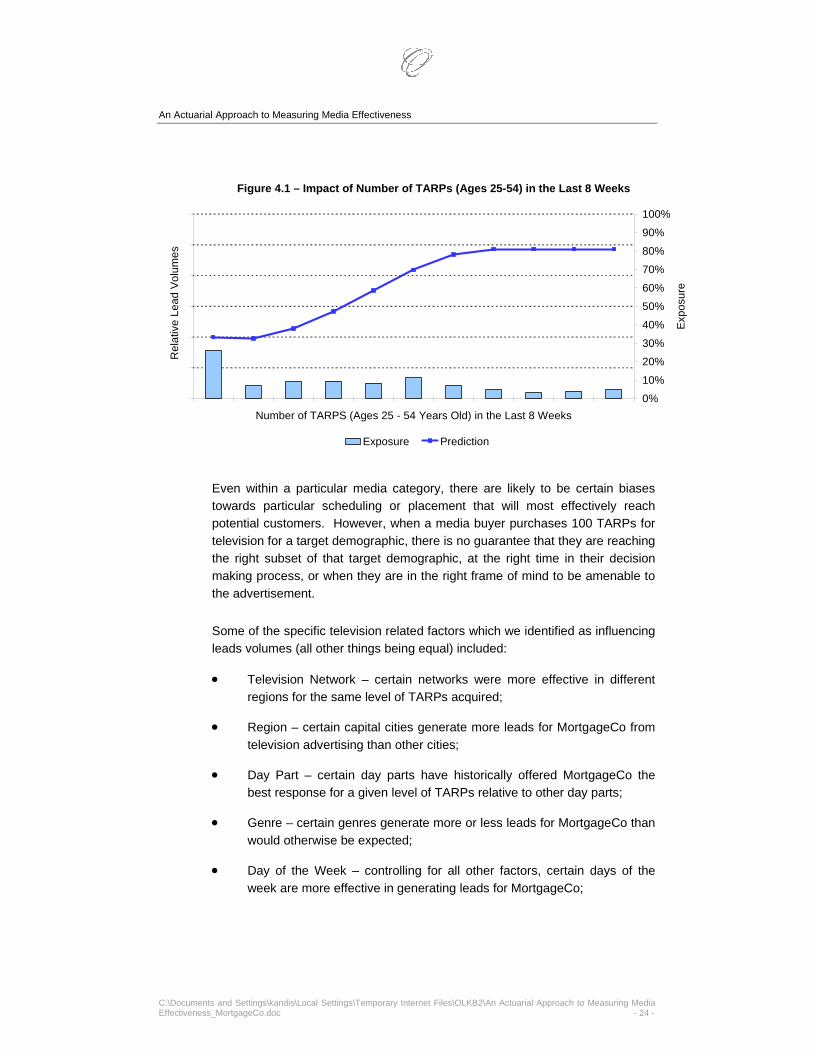
A number of Television related factors were included in our model for MortgageCo. Not surprisingly, one of the most significant of these factors was the number of TARPs (ages 25-54) acquired in the last 8 weeks. As shown in Figure 4.1, as the number of TARPs acquired increases, the expected number of leads also increases, levelling out beyond a certain point.
An Actuarial Approach to Measuring Media Effectiveness
C:\Documents and Settings\kandis\Local Settings\Temporary Internet Files\OLKB2\An Actuarial Approach to Measuring Media Effectiveness_MortgageCo.doc - 24 -
Figure 4.1 – Impact of Number of TARPs (Ages 25-54) in the Last 8 Weeks
Even within a particular media category, there are likely to be certain biases towards particular scheduling or placement that will most effectively reach potential customers. However, when a media buyer purchases 100 TARPs for television for a target demographic, there is no guarantee that they are reaching the right subset of that target demographic, at the right time in their decision making process, or when they are in the right frame of mind to be amenable to the advertisement. Some of the specific television related factors which we identified as influencing leads volumes (all other things being equal) included:
• Television Network – certain networks were more effective in different regions for the same level of TARPs acquired;
• Region – certain capital cities generate more leads for MortgageCo from television advertising than other cities;
• Day Part – certain day parts have historically offered MortgageCo the best response for a given level of TARPs relative to other day parts;
• Genre – certain genres generate more or less leads for MortgageCo than would otherwise be expected;
• Day of the Week – controlling for all other factors, certain days of the week are more effective in generating leads for MortgageCo;
Number of TARPS (Ages 25 - 54 Years Old) in the Last 8 Weeks
Rel
ativ
e Le
ad V
olum
es
0%
10%
20%
30%
40%
50%
60%
70%
80%
90%
100%
Expo
sure
Exposure Prediction
An Actuarial Approach to Measuring Media Effectiveness
C:\Documents and Settings\kandis\Local Settings\Temporary Internet Files\OLKB2\An Actuarial Approach to Measuring Media Effectiveness_MortgageCo.doc - 25 -
• Duration of Advertisement – advertisements of different durations generate different levels of leads per TARP;
• Position in Break – different positions in the advertisement break are more effective than others.
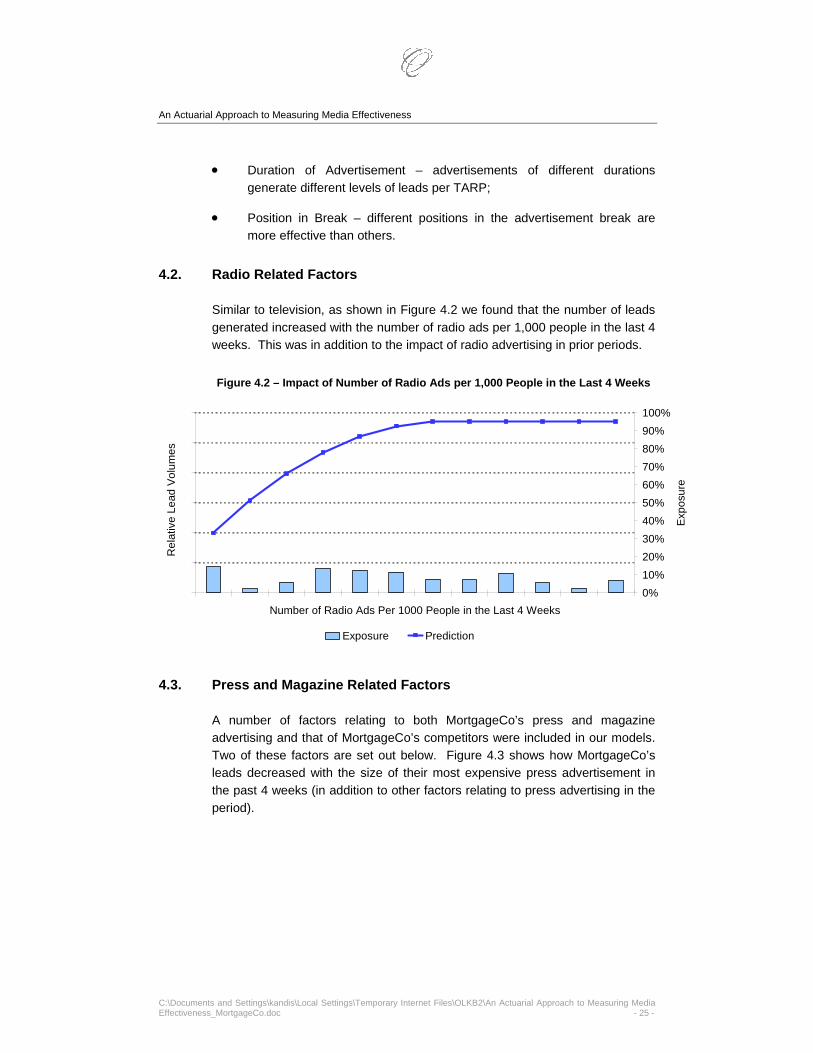
4.2. Radio Related Factors
Similar to television, as shown in Figure 4.2 we found that the number of leads generated increased with the number of radio ads per 1,000 people in the last 4 weeks. This was in addition to the impact of radio advertising in prior periods. Figure 4.2 – Impact of Number of Radio Ads per 1,000 People in the Last 4 Weeks
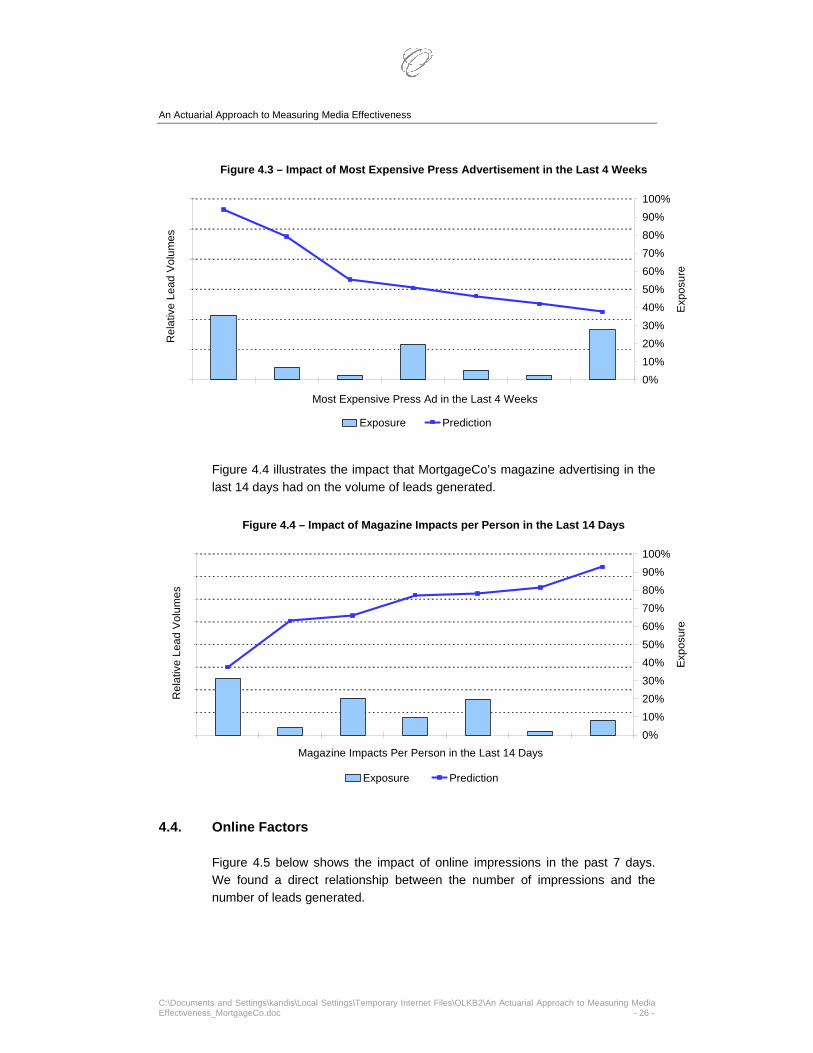
4.3. Press and Magazine Related Factors
A number of factors relating to both MortgageCo’s press and magazine advertising and that of MortgageCo’s competitors were included in our models. Two of these factors are set out below. Figure 4.3 shows how MortgageCo’s leads decreased with the size of their most expensive press advertisement in the past 4 weeks (in addition to other factors relating to press advertising in the period).
Number of Radio Ads Per 1000 People in the Last 4 Weeks
Rel
ativ
e Le
ad V
olum
es
0%10%20%30%40%50%60%70%80%90%100%
Expo
sure
Exposure Prediction
An Actuarial Approach to Measuring Media Effectiveness
C:\Documents and Settings\kandis\Local Settings\Temporary Internet Files\OLKB2\An Actuarial Approach to Measuring Media Effectiveness_MortgageCo.doc - 26 -
Figure 4.3 – Impact of Most Expensive Press Advertisement in the Last 4 Weeks Figure 4.4 illustrates the impact that MortgageCo’s magazine advertising in the last 14 days had on the volume of leads generated.
Figure 4.4 – Impact of Magazine Impacts per Person in the Last 14 Days
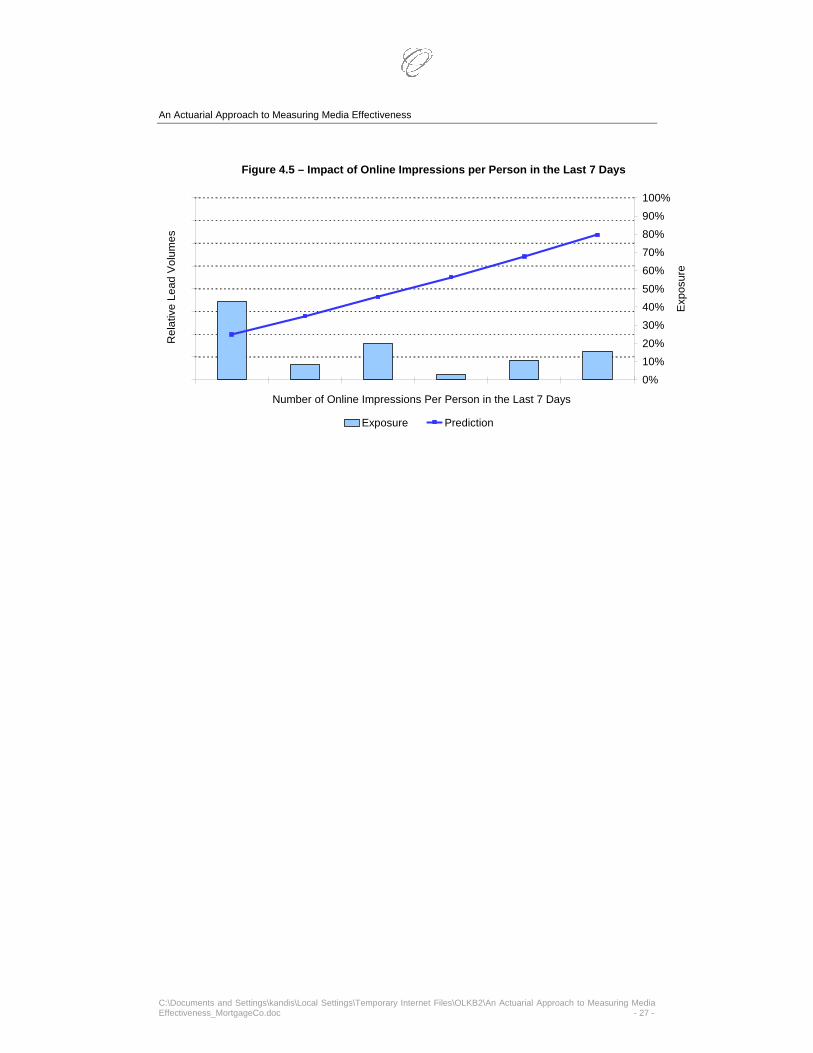
4.4. Online Factors
Figure 4.5 below shows the impact of online impressions in the past 7 days. We found a direct relationship between the number of impressions and the number of leads generated.
Most Expensive Press Ad in the Last 4 Weeks
Rel
ativ
e Le
ad V
olum
es
0%10%20%30%40%50%60%70%80%90%100%
Expo
sure
Exposure Prediction
Magazine Impacts Per Person in the Last 14 Days
Rel
ativ
e Le
ad V
olum
es
0%10%20%30%40%50%60%70%80%90%100%
Expo
sure
Exposure Prediction
An Actuarial Approach to Measuring Media Effectiveness
C:\Documents and Settings\kandis\Local Settings\Temporary Internet Files\OLKB2\An Actuarial Approach to Measuring Media Effectiveness_MortgageCo.doc - 27 -
Figure 4.5 – Impact of Online Impressions per Person in the Last 7 Days
Number of Online Impressions Per Person in the Last 7 Days
Rel
ativ
e Le
ad V
olum
es
0%10%20%
30%40%50%
60%70%80%90%100%
Exp
osur
e
Exposure Prediction

An Actuarial Approach to Measuring Media Effectiveness
C:\Documents and Settings\kandis\Local Settings\Temporary Internet Files\OLKB2\An Actuarial Approach to Measuring Media Effectiveness_MortgageCo.doc - 28 -
5. Model Applications
By properly understanding the relationship between media activity and sales, marketers can make informed and quantifiable decisions around what is often their largest and most subjective budget item. The media model developed for MortgageCo has a number of applications. Some of these are described briefly below.
5.1. Strategic Media Allocation
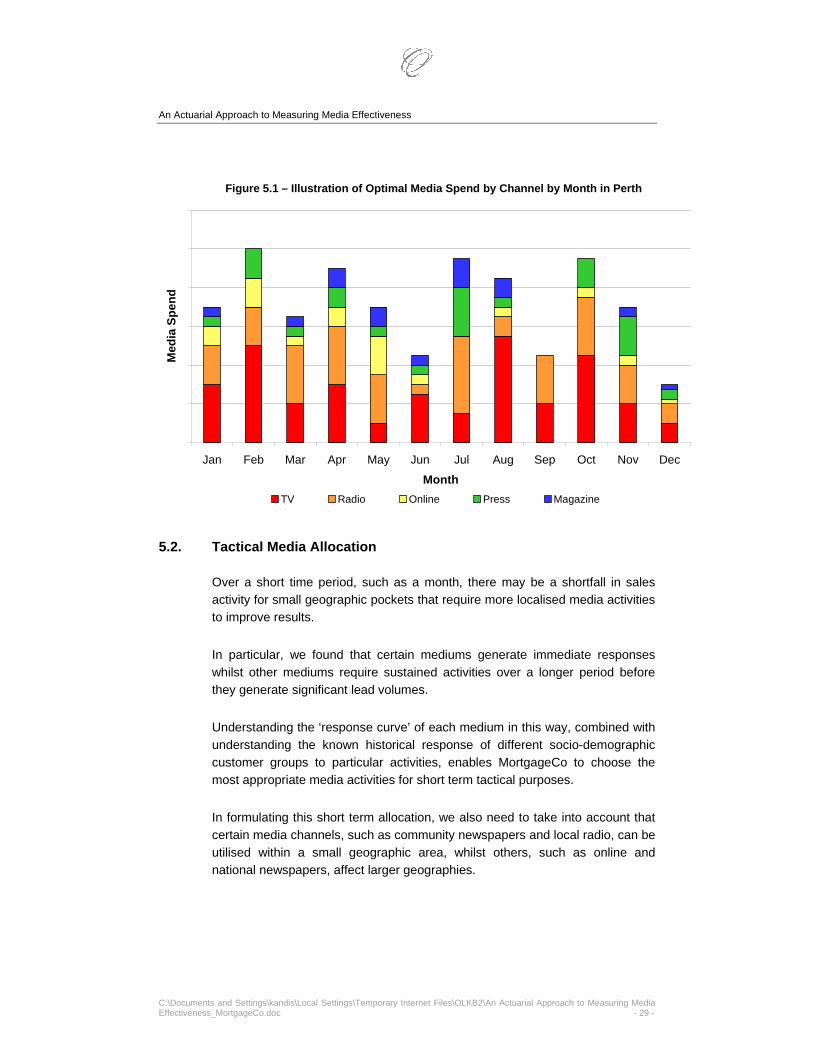
The first use of the modelling for MortgageCo was to determine the optimal media mix by region by month. With a budgeted media spend measured in millions and the cost of acquiring each customer in the hundreds of dollars, the leveraging of greater efficiencies in promotional activities can be dramatic – whether it be a budget reduction of say 10% or thousands of additional customers for the same spend. Different media channels offer different levels of response per exposure and typically most media channels do not operate in isolation. Consumers respond best to combinations of advertising rather than from a single channel. Nevertheless, advertisers can receive significant discounts by buying substantial volumes of advertising from one channel or media owner. In addition, the cost of each media channel can change quite dramatically. For a given level of exposure, the cost of television tends to be more expensive in the lead up to Christmas and during election campaigns for example, than at other periods throughout the year. Similarly, different products may have seasonality in their sales patterns, meaning that a consistent level of exposure may naturally lead to fluctuating levels of sales. These seasonal fluctuations may be truly market driven, or may in fact be driven by historical marketing activity. Being able to quantify the impact of each media channel allows us to identify the optimal allocation of media activity throughout the year, at varying levels of spend. If the seasonal trends for the product are different to the price fluctuations driven by the cost of the marketing activity, it is possible to exploit this as part of a strategic media allocation. Figure 5.1 sets out an illustration of a strategic media allocation for a particular region.
An Actuarial Approach to Measuring Media Effectiveness
C:\Documents and Settings\kandis\Local Settings\Temporary Internet Files\OLKB2\An Actuarial Approach to Measuring Media Effectiveness_MortgageCo.doc - 29 -
Figure 5.1 – Illustration of Optimal Media Spend by Channel by Month in Perth
5.2. Tactical Media Allocation
Over a short time period, such as a month, there may be a shortfall in sales activity for small geographic pockets that require more localised media activities to improve results. In particular, we found that certain mediums generate immediate responses whilst other mediums require sustained activities over a longer period before they generate significant lead volumes. Understanding the ‘response curve’ of each medium in this way, combined with understanding the known historical response of different socio-demographic customer groups to particular activities, enables MortgageCo to choose the most appropriate media activities for short term tactical purposes. In formulating this short term allocation, we also need to take into account that certain media channels, such as community newspapers and local radio, can be utilised within a small geographic area, whilst others, such as online and national newspapers, affect larger geographies.
Jan Feb Mar Apr May Jun Jul Aug Sep Oct Nov Dec
Month
Med
ia S
pend
TV Radio Online Press Magazine
An Actuarial Approach to Measuring Media Effectiveness
C:\Documents and Settings\kandis\Local Settings\Temporary Internet Files\OLKB2\An Actuarial Approach to Measuring Media Effectiveness_MortgageCo.doc - 30 -
5.3. Optimising Flighting Patterns
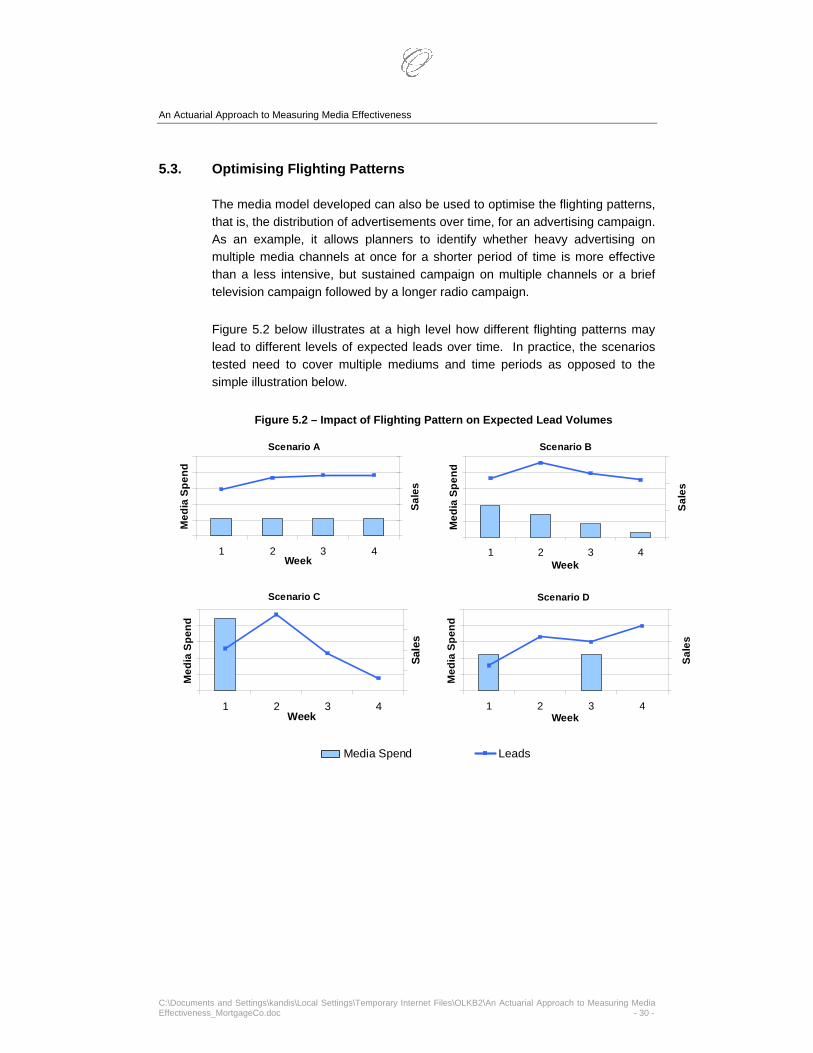
The media model developed can also be used to optimise the flighting patterns, that is, the distribution of advertisements over time, for an advertising campaign. As an example, it allows planners to identify whether heavy advertising on multiple media channels at once for a shorter period of time is more effective than a less intensive, but sustained campaign on multiple channels or a brief television campaign followed by a longer radio campaign. Figure 5.2 below illustrates at a high level how different flighting patterns may lead to different levels of expected leads over time. In practice, the scenarios tested need to cover multiple mediums and time periods as opposed to the simple illustration below.
Figure 5.2 – Impact of Flighting Pattern on Expected Lead Volumes
Media Spend Leads
Scenario C
1 2 3 4Week
Med
ia S
pend
Sale
s
Scenario A
1 2 3 4Week
Med
ia S
pend
Sale
s
Scenario D
1 2 3 4Week
Med
ia S
pend
Sale
s
Scenario B
1 2 3 4Week
Med
ia S
pend
Sale
s

An Actuarial Approach to Measuring Media Effectiveness
C:\Documents and Settings\kandis\Local Settings\Temporary Internet Files\OLKB2\An Actuarial Approach to Measuring Media Effectiveness_MortgageCo.doc - 31 -
5.4. Negotiating Media Placement
Knowing the impact of advertising with different media owners can give media buyers a significant advantage in their negotiating placement of advertisements. Media buyers tend to be able to negotiate better rates for larger spend with a single media owner, particularly for television and radio exposures. For example, agreeing to spend an entire television budget with Network Ten would achieve a better discount and increased TARP bonus allocation than having the same budget spread evenly between three commercial networks. However, even for the same level of TARPs with the same target audience, different networks provide different levels of leads. Understanding which mediums, and providers within those mediums, provide the most efficient spend gives the media buyer an enormous bargaining tool which can be used to play off media placement deals from each network against each other. Ultimately this can extend to create a bias in the schedule to skew the purchased exposures towards those that offer the greatest returns. As an example, in the case of MortgageCo we were able to identify which television networks provided the highest return on marketing investment in each region, enabling MortgageCo to use this information in the negotiation process if required.
5.5. Determining Supply Side Strategies
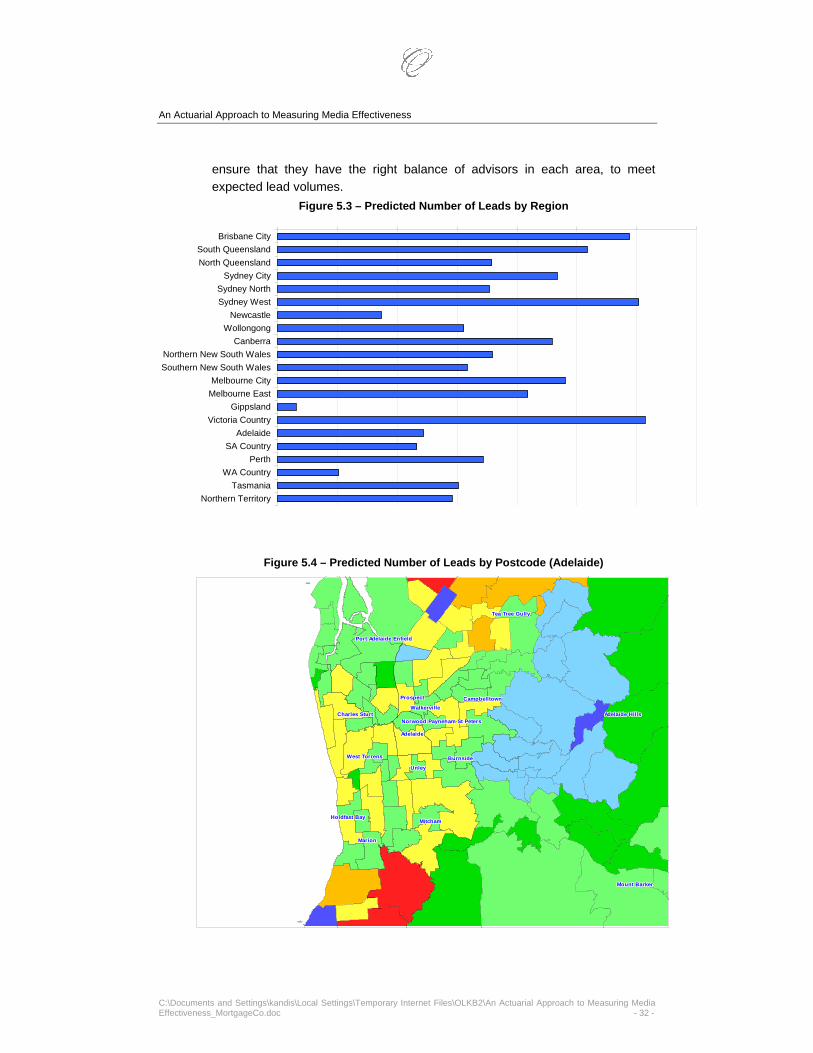
By understanding which customers are most easily influenced by marketing activity, media buyers can adjust their supply side processes to optimise their sales efficiency. Equally, by understanding the expected number of leads in each region (or postcode) for a given media strategy, sales force locations and distribution processes can be realigned to match where the company expects the greatest expected return on its marketing activity – both cost of sales and the value of resulting new business. Figures 5.3 and 5.4 set out examples of outputs which might help in determining these strategies. Note that the actual figures shown by region have been re-ordered for confidentiality reasons. Figure 5.3 sets out the expected number of leads in each region for a given media strategy, whilst Figure 5.4 breaks down the same results by postcode within a particular region. In each case, these outputs enable MortgageCo to
An Actuarial Approach to Measuring Media Effectiveness
C:\Documents and Settings\kandis\Local Settings\Temporary Internet Files\OLKB2\An Actuarial Approach to Measuring Media Effectiveness_MortgageCo.doc - 32 -
ensure that they have the right balance of advisors in each area, to meet expected lead volumes.
Figure 5.3 – Predicted Number of Leads by Region
Figure 5.4 – Predicted Number of Leads by Postcode (Adelaide)
UnleyUnleyUnleyUnleyUnleyUnleyUnleyUnleyUnley
AdelaideAdelaideAdelaideAdelaideAdelaideAdelaideAdelaideAdelaideAdelaide
Norwood Payneham St PetersNorwood Payneham St PetersNorwood Payneham St PetersNorwood Payneham St PetersNorwood Payneham St PetersNorwood Payneham St PetersNorwood Payneham St PetersNorwood Payneham St PetersNorwood Payneham St Peters
BurnsideBurnsideBurnsideBurnsideBurnsideBurnsideBurnsideBurnsideBurnside
MarionMarionMarionMarionMarionMarionMarionMarionMarion
Holdfast BayHoldfast BayHoldfast BayHoldfast BayHoldfast BayHoldfast BayHoldfast BayHoldfast BayHoldfast Bay MitchamMitchamMitchamMitchamMitchamMitchamMitchamMitchamMitcham
West TorrensWest TorrensWest TorrensWest TorrensWest TorrensWest TorrensWest TorrensWest TorrensWest Torrens
Charles SturtCharles SturtCharles SturtCharles SturtCharles SturtCharles SturtCharles SturtCharles SturtCharles SturtWalkervilleWalkervilleWalkervilleWalkervilleWalkervilleWalkervilleWalkervilleWalkervilleWalkerville
ProspectProspectProspectProspectProspectProspectProspectProspectProspect CampbelltownCampbelltownCampbelltownCampbelltownCampbelltownCampbelltownCampbelltownCampbelltownCampbelltown
Mount BarkerMount BarkerMount BarkerMount BarkerMount BarkerMount BarkerMount BarkerMount BarkerMount Barker
Adelaide HillsAdelaide HillsAdelaide HillsAdelaide HillsAdelaide HillsAdelaide HillsAdelaide HillsAdelaide HillsAdelaide Hills
Tea Tree GullyTea Tree GullyTea Tree GullyTea Tree GullyTea Tree GullyTea Tree GullyTea Tree GullyTea Tree GullyTea Tree Gully
Port Adelaide EnfieldPort Adelaide EnfieldPort Adelaide EnfieldPort Adelaide EnfieldPort Adelaide EnfieldPort Adelaide EnfieldPort Adelaide EnfieldPort Adelaide EnfieldPort Adelaide Enfield
Brisbane CitySouth QueenslandNorth Queensland
Sydney CitySydney NorthSydney West
NewcastleWollongong
CanberraNorthern New South WalesSouthern New South Wales
Melbourne CityMelbourne East
GippslandVictoria Country
AdelaideSA Country
PerthWA Country
TasmaniaNorthern Territory

An Actuarial Approach to Measuring Media Effectiveness
C:\Documents and Settings\kandis\Local Settings\Temporary Internet Files\OLKB2\An Actuarial Approach to Measuring Media Effectiveness_MortgageCo.doc - 33 -
5.6. Measuring Sales Driven by Brand
By extracting the impact of media on short term sales, we are able to identify the volume of sales generated by the existing strength of the brand. This allows us to estimate the contribution to future sales derived from the brand itself. It also allows us to effectively allocate and justify the cost of marketing activity between brand building for the long term, and short term sales activity. Marketing strategies can then be developed to optimise the balance of activities to both build brand strength and generate business in the short term.

An Actuarial Approach to Measuring Media Effectiveness
C:\Documents and Settings\kandis\Local Settings\Temporary Internet Files\OLKB2\An Actuarial Approach to Measuring Media Effectiveness_MortgageCo.doc - 34 -
6. Conclusions
Companies are increasingly evaluating every line of expenditure to drive down costs. For many, the advertising budget is often a rather nebulous expense, seen as necessary to generate business, but rarely effectively measured in terms of return on investment. For the advertisers and media planners that do attempt to calculate ROI, the resulting metric is often seriously flawed – typically in favour of the “success” of their prescribed strategy and rarely suggesting a reduction in spend. By applying fundamental actuarial principles allowing us to understand the relationship between promotional activity and sales, we can help advertisers more efficiently allocate their budgets. By properly measuring the outcomes of each media strategy, we are able to introduce a greater degree of precision and accountability to the media planning, strategy and evaluation phases of advertising campaigns. This promises to be a significant shift in thinking for an area relatively weak at evaluating performance, but perhaps one that is well overdue. It grants advertisers a greater confidence that their media budget is being utilised to best meet their strategic goals and ensures that advertising budgets can be justified on an ROI basis as robustly as any other key item of expenditure.