Amyotrophic Lateral Sclerosis
26
Randolph Coleman
Transcript of Amyotrophic Lateral Sclerosis

Randolph Coleman
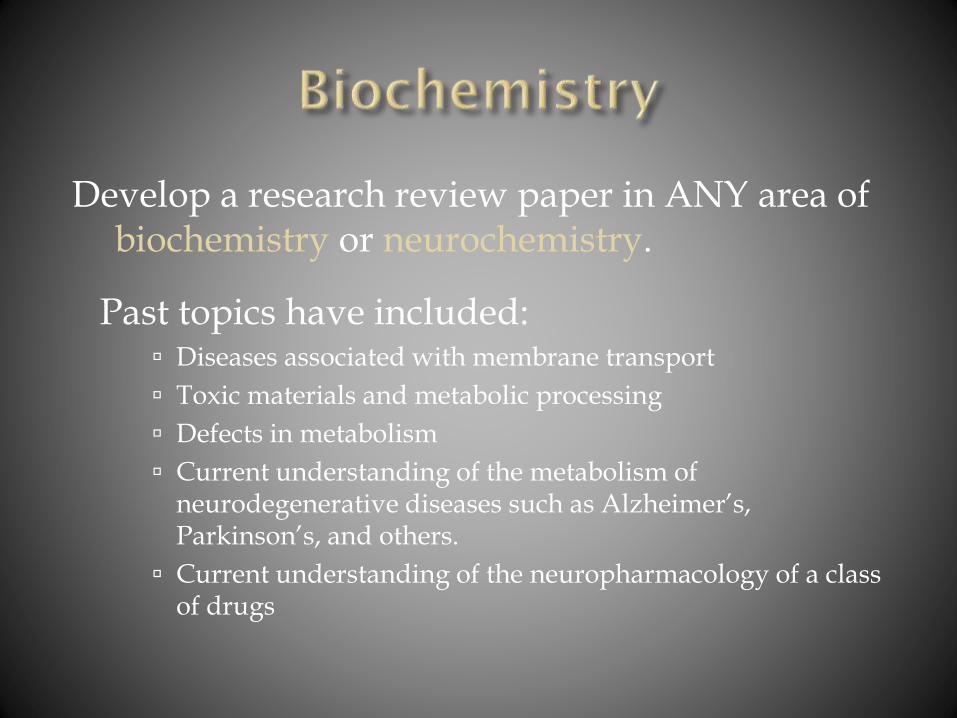
Develop a research review paper in ANY area of biochemistry or neurochemistry.
Past topics have included: Diseases associated with membrane transport
Toxic materials and metabolic processing
Defects in metabolism
Current understanding of the metabolism of neurodegenerative diseases such as Alzheimer’s, Parkinson’s, and others.
Current understanding of the neuropharmacology of a class of drugs

(1) Gather together metabolic data

(2) Make mathematical assignments

(3) Define mathematical relationships

(4) Organize data in spreadsheet format

AD PD HD
MS ALS Prion


Alpha-synuclein aggregation mediated by:
Dopamine metabolism
Ubiquitin-proteosome system
Lysosomal degradation
Reactive oxygen species

Treatment Main Processes Affected
Vitamin D Inflammation, Reactive Oxygen Species Scavenging
Edaravone Tau Phosphorylation, Dopamine Vesicle Formation
Lithium Tau Phosphorylation
Sodium Butyrate p38 Phosphorylation
N-Acetylcysteine Reactive Oxygen Species Scavenging, Insulin Sensitization
Pioglitazone Insulin Sensitization
Aspirin Inflammation
Cyclosporin A Apoptosis
Nortriptyline Apoptosis
A Mathematical Model of Insulin Resistance in Parkinson’s DiseaseE.M. Braatz, R.A. Coleman
Department of Chemistry
ConclusionThis model predicts that the treatment combination summarized in the table above is effective in slowing the advancement of Parkinson’s disease on pathways that are influenced by insulin signaling. The earlier the treatment is introduced, the more likely it is to prevent disease progression.
Acknowledgements• Howard Hughes Medical Institute• Roy R. Charles Center for Academic Excellence• Douglas Morton, Marilyn Brown• College of William and Mary
Treatment Summary
Effects of Treatment on Cell Death
Effects of Treatment on Phosphorylated Tau, Neurofibrillary Tangles, and Lewy Bodies
Introduction• Parkinson’s disease is a neurodegenerative disorder resulting in the
death of dopaminergic neurons in the substantia nigra pars compacta region of the brain
• Insulin resistance is a precursor to type-II diabetes mellitus caused by a diet high in fats and sugars
• Parkinson’s disease and insulin resistance are mutually intensifying
This project introduces a mathematical model representing the biochemical interactions between insulin signaling and Parkinson’s disease. The model can be used to examine the changes that occur over the course of the disease as well as identify which processes would be the most effective targets for treatment. The model is mathematized using Biochemical Systems Theory. It incorporates a treatment strategy that includes several experimental drugs along with current treatments. In the past, Biochemical Systems Theory models of neurodegeneration have used the Power Law Analysis and Simulation tool to model the system. This project suggests the use of MATLAB instead. MATLAB allows for more flexibility in both the model itself and in data analysis. Previous Biochemical Systems Theory analyses of neurodegeneration began treatment at disease onset. As shown in this model, the outcomes of delayed, realistic treatment and full treatment at disease onset are significantly different. The delayed treatment strategy is an important development in Biochemical Systems Theory modeling of neurodegeneration. It emphasizes the importance of early diagnosis, and allows for a more accurate representation of disease and treatment interactions.
Abstract
Effects of Treatment on Reactive Oxygenand Nitrogen Species
Effects of Treatment on Insulin Signaling and Inflammation
Methods: Biochemical Systems Theory• Initial values are assigned on a relative basis• Flux equations describe relative reaction rates and consist of the
product of the relative concentrations of the reactants multiplied by a rate constant or rate equation.
• Ex. J(88) = X(258)*Xind(75)• Rate equations describe the effect of modifiers on the reactions.
Promoters have positive effects while inhibitors have negative effects.• Ex. X(258) = 0.00001*X(92)
• Systems equations describe the change to the relative species concentrations as the disease progresses. The equations consist of the flux equations detracting from the species concentration subtracted from the flux equations contributing to its concentration.
• Ex. X(93) = X(258)*Xind(75) – X(259)*X(93)• Data is analyzed comparatively by subtracting the disease or
treatment state from a baseline state depicting a healthy cell system.
Results• The disease state demonstrates an increase in neurotoxic species
compared to the baseline state.• The full treatment state significantly decreased the effects of the disease
state.• The delayed treatment was somewhat effective against degeneration.
Effects of Treatment on p38 Phosphorylation
Effects of Treatment on Dopamine

Mutant (expanded) Huntington Protein
Leads to:
Dyshomeostasis of Ca2+
Mitochondrial Dysfunction
Caspase activation


Concentration of Cytosolic Ca2+
0
10
20
30
40
50
60
70
80
90
100
0 2 4 6 8 10
Time (s)
Co
ncen
trati
on
Normal MSN
HD MSN

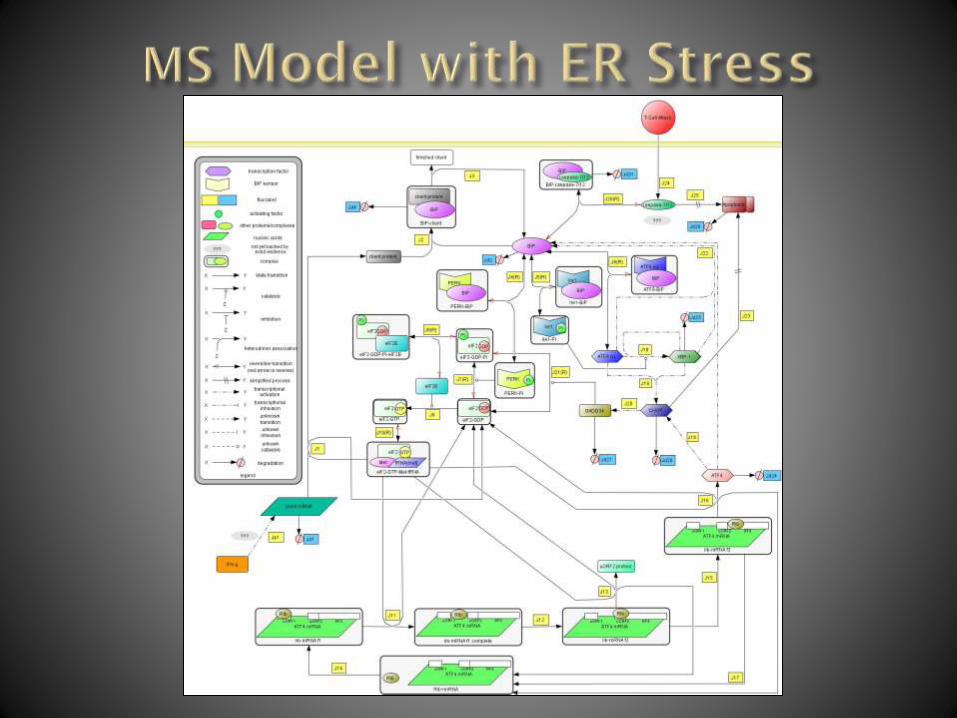
Immune System Involvement:
Oligodendrocytes are focus
ER stress involved
Protein synthesis affected

Lees JR, Cross AH (2007) J of Clinical Investigation Used with permission


Prion Protein (PrP) Processing:
Lipid raft trafficking
Metal ion involvement
Reactive oxygen species implicated

Neuroinvasion and Proliferation of PrPSc in Humans Following Prion Infection
AbstractPrions are misfolded isoforms of the normal membrane
protein PrPC, called PrPSc. This scrapie protein can through an
unclear mechanism convert the normal isoform to the ‘bad’
one and cause a loss of function within infected cells. Many
cells express PrPC, but neurons and glia are particularly
susceptible to infection, which ultimately results in apoptosis
and symptoms related to neurodegeneration. Using the
program CellDesigner and Matlab this model simulates oral
ingestion of PrPSc, its uptake through the intestinal epithelia
(via M cells), into Peyer’s Patches and lymph nodes where
neutrally circulating immune cells, such dendritic cells,
macrophages, B cells and T cells phagocytized PrPSc. and
consequently are infected with. PrPSc. Circulation through the
blood stream and transendothelial migration into the brain
infects the CNS with prions. The subsequent damage done to
local cells initiates an inflammatory response, further
circulating the prions, not recognized as an antigen, through
the lymphatic and nervous system. Cell death within the CNS
causes neurodegeneration and subsequent death. There is yet
no cure for prion disease. Highly specific monoclonal
antibodies for PrPSc are being investigated.
Initial Infection Through Intestinal Lining and
Uptake Into Peyer’s Patches and Lymph
Nodes
Replication in Lymph Node FDCs• FDC naturally express high levels of PrPC therefor serving as a
site for conversion and replication of PrPSc.
• Interactions with B cells cause cross infection and subsequent
infection of T cells coming into contact with B cells.
Trojan Horse Neuroinvasion of CNS• After reaching a certain threshold titer load of replicated PrPSc,
cells carrying the scrapie form (DC, macrophages and T cells)
recirculate into the blood and cross infect monocytes that
regularly cross the blood brain barrier (BBB) into the
perivascular space to differentiate and replace local DC.
• Normal interaction between DC and CNS neurons/glia cause
localized infection with PrPSc.
Damage and Inflammation• A build-up of reactive oxygen species (ROS) follows
infection and contributes to oxidative stress, ER stress,
release of Ca2+, metal ion irregularity, upregulation and
releases of pro-inflammatory agents (TNF-alpha, TGF-beta,
CXCL10, CX3C1, CCL21, IL-1beta, and IL-6) and
direct/indirect induction of multiple apoptotic pathways.
• Similar effects are seen following infection of the microglia,
astrocytes, and oligodedrocytes that regulate normal function
of neurons.
• Activation of ant-inflammatory cells and their migration
across the blood brain barrier. These cells include
monocytes, CD4+ and CD8+ T cells, Treg, FoxP3+ Treg cells,
neurtrophils, and B cells.
• Both para- and transcellular migration across endothelia
causes disruption of the BBB.
• Inside the brain these cells work to phagocytize and degrade
PrPSc and damaged cells, but bring more PrPSc with them,
causing more damage, excitement of cytokines and pro-
inflammatory agents like IL-27, IL-17, TGF, Il-6, IL-2, TNF-
alpha, and MMP9, induction of macrophage-acting DC, and
unchecked inflammation.
Conclusions
Potential target areas for treatment of prion infection
could include limited immobilization of immune
response as overacting inflammation stimulates the
clinical phase of the disease.
Acknowledgements• Cummings Memorial Fund
• Roy R. Charles Center for Academic Excellence
• The College of William and Mary
C.A. Stephens, R. A. ColemanDepartment of Chemistry

Improper APP processing :
Accumulation of A-beta fibrils & plaques
Hyperphosphorylated tau-protein tangles
Reactive oxygen species implicated
Metal ion involvement

AbstractAbnormal mitochondrial function has become recognized as a
critical component in the pathogenesis of a variety of
neurodegenerative diseases, including AD. We have recently found
abnormal expression of several genes critical to mitochondrial
biogenesis in AD brains. Using this subset of mitochondrial genes,
we have begun to build a mathematical model of AD using
Biochemical System Theory (BST). Through the development and
application of appropriate differential equations, the flux of various
metabolites and small molecules will be simulated and used to
generate a testable model of mitochondrial involvement in AD
pathogenesis. Methods: Human Mitochondrial Biogenesis and
Human Alzheimer Disease RT² Profiler PCR Arrays were used to
assess expression of 168 mitochondrial function and AD genes in
two control and five age- and gender-matched AD brains. These
gene expression changes served as the starting point for MatLab-
based mathematical analysis and BST dynamic computer
simulations. Results: Our preliminary PCR array analysis identifies
significant expression changes in genes involved with maintaining
mitochondrial morphology or regulating mitochondrial membrane
potential. Combining these data with the mathematical modeling of
these interactions using BST, we have generated a tentative
working model shown here. Conclusions: Our preliminary model
depicts and predicts the relationships of HSPD1, DNM1L, CDKN2A,
MFN2, and BCL2L1 to the processes of mitochondrial dysfunction
and neuronal apoptosis in the AD brain. Additionally, we are able to
predict the sensitivity of those relationships to changes in activity
brought about, for example, by drugs targeting the appropriate
proteins expressed be those genes.
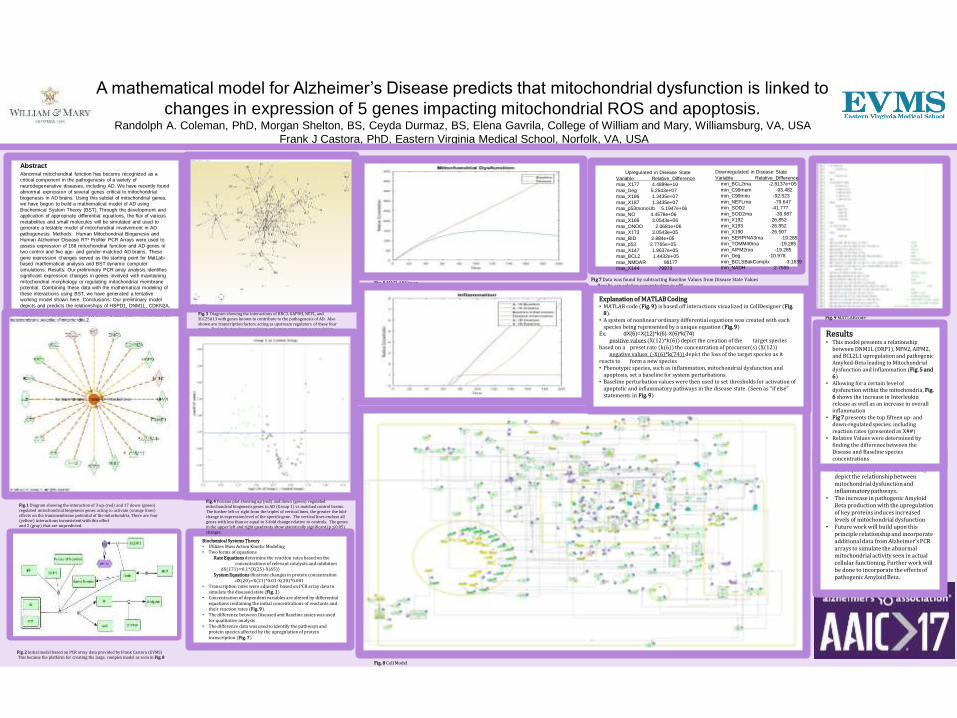
A mathematical model for Alzheimer’s Disease predicts that mitochondrial dysfunction is linked to
changes in expression of 5 genes impacting mitochondrial ROS and apoptosis.Randolph A. Coleman, PhD, Morgan Shelton, BS, Ceyda Durmaz, BS, Elena Gavrila, College of William and Mary, Williamsburg, VA, USA
Frank J Castora, PhD, Eastern Virginia Medical School, Norfolk, VA, USA
Biochemical Systems Theory• Utilizes Mass Action Kinetic Modeling• Two forms of equations
Rate Equations determine the reaction rates based on the concentrations of relevant catalysts and inhibitors
dX(171)=0.1*(X(25)-X(65))System Equations illustrate changes in protein concentration
dX(20)=X(21)*0.01-X(20)*0.001• Transcription rates were adjusted based on PCR array data to
simulate the diseased state (Fig. 1)• Concentration of dependent variables are altered by differential
equations containing the initial concentrations of reactants and their reaction rates (Fig. 9).
• The difference between Diseased and Baseline states was used for qualitative analysis
• The difference data was used to identify the pathways and protein species affected by the upregulation of protein transcription (Fig. 7)
Upregulated in Disease State
Variable Relative_Difference
max_X177 4.4899e+10
max_Deg 5.2543e+07
max_X186 1.3435e+07
max_X187 1.3435e+07
max_p53monoUb 5.1947e+06
max_NO 4.4578e+06
max_X166 3.0543e+06
max_ONOO 2.0681e+06
max_X173 3.0543e+05
max_BID 2.884e+05
max_p53 2.7765e+05
max_X147 1.9637e+05
max_BCL2 1.4432e+05
max_NMDAR 98177
max_X144 79973
Downregulated in Disease State
Variable Relative_Difference
min_BCL2rna -2.8137e+05
min_C99mem -93.482
min_C99mito -92.523
min_NEFLrna -79.647
min_SOD2 -41.777
min_SOD2rna -39.987
min_X192 -26.852
min_X193 -26.852
min_X190 -26.507
min_SERPINA3rna -19.285
min_TOMM40rna -19.285
min_AIFM2rna -19.285
min_Deg -10.978
min_BCLSBakComplx -3.1639
min_NADH -2.7555
Fig 7 Data was found by subtracting Baseline Values from Disease State ValuesResults are relative concentration in nM
Conclusions and Future Work• This equation system can accurately
depict the relationship between mitochondrial dysfunction and inflammatory pathways.
• The increase in pathogenic Amyloid Beta production with the upregulation of key proteins induces increased levels of mitochondrial dysfunction
• Future work will build upon this principle relationship and incorporate additional data from Alzheimer’s PCR arrays to simulate the abnormal mitochondrial activity seen in actual cellular functioning. Further work will be done to incorporate the effects of pathogenic Amyloid Beta.
Results• This model presents a relationship
between DNM1L (DRP1), MFN2, AIFM2, and BCL2L1 upregulation and pathogenic Amyloid-Beta leading to Mitochondrial dysfunction and Inflammation (Fig. 5 and 6)
• Allowing for a certain level of dysfunction within the mitochondria, Fig. 6 shows the increase in Interleukin release as well as an increase in overall inflammation
• Fig 7 presents the top fifteen up- and down-regulated species. including reaction rates (presented as X##)
• Relative Values were determined by finding the difference between the Disease and Baseline species concentrations
Fig .2 Initial model based on PCR array data provided by Frank Castora (EVMS)This became the platform for creating the large, complex model as seen in Fig. 8
Fig. 3 Diagram showing the interactions of BBC3, GAPDH, NEFL, and SLC25A13 with genes known to contribute to the pathogenesis of AD. Also shown are transcription factors acting as upstream regulators of these four genes. Red indicates down regulation and green represents up regulation.
Fig. 4 Volcano plot showing up (red) and down (green) regulated mitochondrial biogenesis genes in AD (Group 1) vs matched control brains. The further left or right from the triplet of vertical lines, the greater the fold-change in expression level of the specific gene. The vertical lines enclose all genes with less than or equal to 3-fold change relative to controls. The genes in the upper left and right quadrants show statistically significant (p ≤0.05) changes.
Fig. 1 Diagram showing the interaction of 3 up-(red) and 17 down-(green) regulated mitochondrial biogenesis genes acting to activate (orange lines) effects on the transmembrane potential of the mitochondria. There are four (yellow) interactions inconsistent with this effectand 2 (gray) that are unpredicted.
Fig .5 MATLAB Figure
Fig. 6 Matlab Figure
Fig. 9 MATLAB code
Explanation of MATLAB Coding• MATLAB code (Fig. 9) is based off interactions visualized in CellDesigner (Fig.
8).• A system of nonlinear ordinary differential equations was created with each
species being represented by a unique equation (Fig. 9)Ex. dX(6)=X(12)*k(6)-X(6)*k(74)
positive values (X(12)*k(6)) depict the creation of the target species based on a preset rate (k(6)) the concentration of precursor(s) (X(12))
negative values (-X(6)*k(74)) depict the loss of the target species as it reacts to form a new species• Phenotypic species, such as inflammation, mitochondrial dysfunction and
apoptosis, set a baseline for system perturbations.• Baseline perturbation values were then used to set thresholds for activation of
apoptotic and inflammatory pathways in the disease state. (Seen as “if else” statements in Fig. 9)
Fig. 8 Cell Model


The Commonwealth Health Research Board
Award Funding for 2017 – 2019
The Commonwealth of Virginia Alzheimer’s and
Related Diseases Research Award Fund (ARDRAF)
Thomas F. & Kate Miller Jeffress Memorial Trust
W&M/EVMS Collaborative Research Grant
Roy R. Charles Center College of William & Mary


![NFL Football & Amyotrophic Lateral Sclerosis [ALS]](https://static.fdocuments.us/doc/165x107/559430511a28ab4c3d8b4747/nfl-football-amyotrophic-lateral-sclerosis-als.jpg)