Amplikyzer: Automated methylation analysis of amplicons ... · PDF fileAmplikyzer: Automated...
27
Amplikyzer: Automated methylation analysis of amplicons from bisulfite flowgram sequencing Sven Rahmann 1* Jasmin Beygo 2 Deniz Kanber 2 Marcel Martin 1 Bernhard Horsthemke 2 Karin Buiting 2 1 Genome Informatics, Institute of Human Genetics, University Hospital Essen, University of Duisburg-Essen Hufelandstr. 55, 45147 Essen, Germany 2 Institute of Human Genetics, University Hospital Essen, University of Duisburg-Essen Hufelandstr. 55, 45147 Essen, Germany The Roche 454 GS Junior sequencing platform allows locus-specific DNA methyla- tion analysis using deep bisulfite amplicon sequencing. However, bisulfite-converted DNA reads may contain long T homopolymers, and the main sources of errors on py- rosequencing platforms are homopolymer over- and undercalls. Furthermore, existing tools do not always meet the analysis requirements for complex assay designs with multiple regions of interest (ROIs) from multiple samples. We have developed the amplikyzer software package to address the above challenges. It directly aligns the intensity sequences from standard flowgram files (SFF format) to given amplicon reference sequences, without converting to nucleotide FASTA for- mat first, avoiding information loss by rounding flow intensities, and taking special measures to correctly process long homopolymers. It offers a variety of options to an- alyze complex multiplexed samples with several regions of interest and outputs useful statistics and publication-quality analysis plots without mandatory manual interac- tion. This allows our software to be used as part of automated pipelines as well as interactively. The underlying analysis algorithms, using a novel hybrid flowgram-DNA sequence representation are described in detail. We also discuss configuration options and use cases of our open source amplikyzer software and present exemplary results. The software, including required libraries, is available at https://bitbucket.org/ svenrahmann/amplikyzer/downloads. Contact: Sven.Rahmann[at]uni-due.de * to whom correspondence should be addressed 1 PeerJ PrePrints | https://peerj.com/preprints/122v2/ | v2 received: 29 Nov 2013, published: 29 Nov 2013, doi: 10.7287/peerj.preprints.122v2 PrePrints
-
Upload
nguyendieu -
Category
Documents
-
view
221 -
download
0
Transcript of Amplikyzer: Automated methylation analysis of amplicons ... · PDF fileAmplikyzer: Automated...

Amplikyzer: Automated methylation analysis ofamplicons from bisulfite flowgram sequencing
Sven Rahmann 1∗ Jasmin Beygo 2 Deniz Kanber 2
Marcel Martin 1 Bernhard Horsthemke 2 Karin Buiting 2
1 Genome Informatics, Institute of Human Genetics,University Hospital Essen, University of Duisburg-Essen
Hufelandstr. 55, 45147 Essen, Germany
2 Institute of Human Genetics,University Hospital Essen, University of Duisburg-Essen
Hufelandstr. 55, 45147 Essen, Germany
The Roche 454 GS Junior sequencing platform allows locus-specific DNA methyla-tion analysis using deep bisulfite amplicon sequencing. However, bisulfite-convertedDNA reads may contain long T homopolymers, and the main sources of errors on py-rosequencing platforms are homopolymer over- and undercalls. Furthermore, existingtools do not always meet the analysis requirements for complex assay designs withmultiple regions of interest (ROIs) from multiple samples.
We have developed the amplikyzer software package to address the above challenges.It directly aligns the intensity sequences from standard flowgram files (SFF format)to given amplicon reference sequences, without converting to nucleotide FASTA for-mat first, avoiding information loss by rounding flow intensities, and taking specialmeasures to correctly process long homopolymers. It offers a variety of options to an-alyze complex multiplexed samples with several regions of interest and outputs usefulstatistics and publication-quality analysis plots without mandatory manual interac-tion. This allows our software to be used as part of automated pipelines as well asinteractively.
The underlying analysis algorithms, using a novel hybrid flowgram-DNA sequencerepresentation are described in detail. We also discuss configuration options anduse cases of our open source amplikyzer software and present exemplary results.The software, including required libraries, is available at https://bitbucket.org/
svenrahmann/amplikyzer/downloads. Contact: Sven.Rahmann[at]uni-due.de
∗to whom correspondence should be addressed
1
PeerJ PrePrints | https://peerj.com/preprints/122v2/ | v2 received: 29 Nov 2013, published: 29 Nov 2013, doi: 10.7287/peerj.preprints.122v2
PrePrin
ts

1 Introduction
Motivation Locus-specific DNA methylation analysis is widely used in the field of genomicimprinting, related disorders and cancer research. To determine and quantify the methylationstate at single nucleotide resolution, locus-specific bisulfite sequencing by Sanger sequencing ofDNA clones was used as a gold-standard technique over a long time. However, this method wastime consuming, so only a few clones were typically analysed, and biases in cloning might haveled to a skewed ratio of methylated to unmethylated molecules. Nowadays massively parallelsequencing methods, in particular 454 sequencing, can be used for high-throughput sequencingof bisulfite PCR amplicons (Taylor et al., 2007; Beygo et al., 2013b,a; Berland et al., 2013). Forexample, using the Roche 454 GS Junior system, more than 100 000 sequence reads can easilybe obtained in a single sequencing run without subcloning, thus eliminating cloning bias. Thismethod allows to obtain highly quantitative DNA methylation patterns and to detect even slightmethylation changes.
Currently, the International Human Epigenome Consortium (IHEC) is undertaking a multi-national study to establish genome-wide basepair-level methylation maps, which are expectedto yield new insights into human methylation patterns1. At present, more than 10 countriesare a member of IHEC. In Germany, for example, DEEP (DEutsches Epigenom Programm2)will produce 70 reference epigenomes of selected human and murine cells involved in metabolicand inflammatory diseases. The validation of differentially methylated regions and more de-tailed studies require deep bisulfite amplicon sequencing from specifically selected loci (regionsof interest, ROIs) with high coverage.
The Roche 454 sequencing technology is an appropriate one for deep amplicon sequencing, asit provides read lengths of up to 700 bp on the Roche 454 GS Junior device. We previously found,for instance, that several CpG islands (CGIs) on the X-chromosome are incompletely methylated,while on the autosomes, most CGIs are either completely or not at all methylated (Zeschnigket al., 2009).
Problem Statement The bisulfite-sequenced amplicon methylation analysis problem, as consid-ered in this work, consists of the following inputs: a set of bisulfite sequence reads, a set ofreference ROIs with primers, a set of distinct samples given by multiplex identifier sequences(MIDs), and forward and reverse tag sequences. We specifically assume that a flowgram-basedsequencing technology is used (i.e., Roche 454 or Ion Torrent) that produces reads as flowgrams(see Section 2.1) and outputs SFF files (standard flowgram format).
The task at hand is to identify, for each read, the corresponding MID and ROI, and to analyzethe methylation status of each CpG in the ROI of the read. This is possible because sodiumbisulfite treatment converts each unmethylated C into T, but leaves methylated Cs unmodified.This means that by examining each nucleotide in a read that corresponds to the C of a CG
dinucleotide in the reference, the methylation state can be inferred.From such a detailed nucleotide-level analysis, statistical summaries (methylation rates of CpGs
or entire ROIs) are to be generated and visualized.
Related Work BiQ Analyzer (Bock et al., 2005) and its successor BiQ Analyzer HT (Lutsiket al., 2011) are popular tools for bisulfite-sequenced amplicon analysis and widely used. BiQ
1http://www.ihec-epigenomes.org/welcome/2https://deutsches-epigenom-programm.de
2
PeerJ PrePrints | https://peerj.com/preprints/122v2/ | v2 received: 29 Nov 2013, published: 29 Nov 2013, doi: 10.7287/peerj.preprints.122v2
PrePrin
ts

Analyzer HT offers a wide range of analysis functions, an interactive user interface and compre-hensive visualization capabilities. However, the task of identifying MID and ROI for each readis not solved by BiQ Analyzer, but left to other SFF-capable read splitting and mapping tools,such as Roche’s proprietary software, or any other commercial or free software able to separatereads into FASTA files according to barcode sequences (MIDs). Another tool for bisulfite am-plicon analysis, also for repetitive ROI sequences, is BISMA (Rohde et al., 2010), which is alsosequence-based (instead of flowgram-based). As it uses CLUSTALW (Larkin et al., 2007) foralignments, it does not allow high-throughput analysis with tens of thousands of reads. TheBDPC web server (Rohde et al., 2008) takes BISMA or BiQ Analyzer results as input andprovides additional aggregation and presentation capabilities.
Bismark (Krueger and Andrews, 2011) and MethylCoder (Pedersen et al., 2011) are combinedbisulfite-aware read mappers and methylation callers. They rely on sequence-based read mappers(e.g, Bowtie2 (Langmead and Salzberg, 2012)) and explicit simulated bisulfite conversion of thereference genome. As they work on the sequence level (rather than with flowgrams), they aremore suitable for Illumina sequence data and exome-wide or genome-wide methylation analysis.
To summarize, BiQ Analyzer HT requires pre-processed FASTA sequence files separately foreach MID; all tools provide sequence-based analysis. In contrast, a design goal of amplikyzer isto provide a unified analysis starting from raw flowgrams, while at the same time offering morecustomization options to the user.
Our Contributions Our amplikyzer software is an alternative to existing solutions with a num-ber of distinguishing features that, to our knowledge, are not implemented in any of the toolsdescribed above. Most importantly, our analysis starts directly from the flowgrams in the rawSFF file without converting to FASTA first (see Section 2.1). No pre-processing of the SFFfile is necessary; all steps from the raw data to publication-quality analysis figures are providedby our methods and software. Noteworthy features of amplikyzer include the separation of se-quence reads based on single nucleotide polymorphisms (SNPs) present in the correspondingamplicon/ROI with the possibility to present the methylation data in separate plots for eachallele. Furthermore, comparison plots enable the user to depict the methylation for separatedalleles from one or more samples at a time. Different samples can be sorted automatically bymethylation level or manually by specifying a MID order.
The amplikyzer software was designed to work within automated high-throughput workflows.This means that once the input data (reads, primers, ROI sequences, MIDs, etc.) and analysisparameters are specified in persistent editable configuration files, no further user interaction isnecessary, and all analysis results are produced as textual reports and publication-quality imagefiles in an output directory. This enables amplikyzer with all of its customization options to bepart of larger workflows, such as provided by Snakemake (Koster and Rahmann, 2012). In thesame spirit, amplikyzer is a standalone desktop application instead of a client/server system. Anoptional graphical user interface (GUI) is provided to specify the analysis parameters interactivelyif desired by the user.
Organization of this Article In Section 2, we summarize background knowledge on bisulfitesequencing experiments using the Roche 454 platform. This knowledge is required to understandthe rationale behind amplikyzer ’s algorithmic analysis approach, which is described in Section 3.A description of the software is given in Section 4. Section 5 describes an exemplary analysis andits results in comparison to other tools. A brief discussion concludes the paper.
3
PeerJ PrePrints | https://peerj.com/preprints/122v2/ | v2 received: 29 Nov 2013, published: 29 Nov 2013, doi: 10.7287/peerj.preprints.122v2
PrePrin
ts

2 Background
We provide background knowledge on flowgrams and SFF files in Section 2.1, discuss necessaryfilter adjustments to the Roche 454 GS Junior sequencer software for bisulfite sequencing inSection 2.2, and describe a typical library preparation protocol and the resulting structure of thesequence reads in Section 2.3.
2.1 Flowgram Analysis Challenges
The output of the Roche 454 sequencing technology (and similarly, of the Ion Torrent technol-ogy) does not consist of DNA sequences, but of flowgrams. A flowgram is a numeric sequencedescribing (normalized) measured light intensities during each sequencing cycle. The Roche 454GS Junior system uses a fixed repeated nucleotide interrogation sequence (TACG) for up to twohundred cycles up to 800 flows. (Since the end of 2012, a more complex alternative interro-gation sequence called flow pattern B can be used that leads to longer reads.) Each flow of asingle nucleotide results in a measured intensity, approximately proportional to the number ofnucleotides in the current homopolymer to be sequenced, where an intensity value of 1.0 cor-responds to a single nucleotide. For example, assuming the interrogation sequence TACG, theflowgram (1.02, 2.10, 0.15, 2.20, 3.07, 0.03, 2.58, 0.19) consisting of two full cycles (or eight flows)is also written as T1.02A2.10C0.15G2.20T3.07A0.03C2.58G0.19. By rounding, it can be translated (“base-called”) into the DNA sequence TAAGGTTTCCC.
An SFF file output by the sequencer software contains both the raw flowgrams and the base-called DNA sequence for each read that passed the internal quality filters, together with qualityand filtering information. The specific file format is documented at various locations3.
In the example above, at least the decision for the flow C2.58 is not obvious: Does this intensityrefer to CC or CCC? Theoretically, ambiguous intensities should not exist; in practice, they dooccur. The problem becomes more prominent at higher intensities, where saturation effectsoccur and the measured intensity is not proportional to the number of nucleotides any more. Forexample, A5.32 might plausibly refer to a homopolymer of 5, 6, or 7 As.
It follows that if the flowgram output of the sequencer is first base-called and only then alignedto a genomic reference sequence, there is a high chance that spurious insertions or deletions willbe seen in the alignment because of wrong base calling decisions. To address these issues, werecently proposed an algorithm for directly aligning flowgrams to DNA references (Martin andRahmann, 2013) without previous base-calling or alternatively converting the reference DNA intoflowspace. A prototype implementation is available as the FlowG software4.
In the context of sodium bisulfite sequencing, however, the problem is further aggravated by thefact that bisulfite treatment converts most Cs into Ts, such that there will be long T-homopolymersin many reads. For example, genomic ATTCTCCTCGA would become ATTTTTTTTGA (assuming anunmethylated CpG), which may plausibly lead to flows A1.10T6.48G0.92A1.02 (ignoring intermediatezero flows). The base calling step would interpret this as ATTTTTTGA, missing two Ts, and yieldingthe alignment
genomic: ATTCTCCTCGA
read: ATTTTTT--GA,
where a gap is aligned to the C of the CpG dinucleotide, leaving us unable to infer its methylationstate from the alignment.
3http://www.ncbi.nlm.nih.gov/Traces/trace.cgi?cmd=show&f=formats&m=doc&s=format#sff4http://www.rahmannlab.de/software
4
PeerJ PrePrints | https://peerj.com/preprints/122v2/ | v2 received: 29 Nov 2013, published: 29 Nov 2013, doi: 10.7287/peerj.preprints.122v2
PrePrin
ts

The analysis method for amplikyzer has been specifically designed to work with flowgrams andavoid the illustrated problems, while still allowing an efficient analysis of a large number of reads.
2.2 Quality Filtering
As the homopolymer problem is well known, the manufacturer’s software includes quality filtersto alleviate the problem by discarding reads with too many ambiguous intensities. While thisreduces the number of available reads, it increases the overall quality of base-called reads. Asexplained above, for sodium bisulfite sequencing, long homopolymer runs (and thus more am-biguous intensity values) cannot be avoided. The standard filter settings discard a large fractionof the reads, and so the settings must be adjusted to yield more reads (which are consequentlyharder to analyze using conventional methods). We recommend the following filter adjustmentsin the sequencer software:
1. setting doValleyFilterTrimBack to True (instead of its default value False). This choiceinstructs the system only to trim the low-quality end of (and not to entirely discard) readswith many ambiguous intensities.
2. increasing vfBadFlowThreshold to 10 from its default value 4. This parameter controlsthe number of allowed ambiguous flow values before the read is trimmed. (Possibly, evenlarger values could be attempted.)
2.3 Library Generation and Read Structure
Generation of Locus-Specific Amplicon Libraries To study DNA methylation at a specific lo-cus in different individuals, amplicon libraries are generated using two consecutive PCRs. Thefirst PCR on bisulfite-treated DNA (the ROI) is performed with locus-specific primers that matchthe bisulfite-treated DNA and contain universal primer tags (in amplikyzer abbreviated as FWD,REV) for forward and reverse primers. For the second PCR, primers are used which consist ofthe universal tags, sample-specific barcode sequences (MIDs), the 454 key sequence and the 454sequencing system primers. Amplicon fragments are clonally amplified in an emulsion PCR (em-PCR), beads carrying DNA are enriched, and the amplicon library is sequenced on the Roche 454GS Junior system.
Structure of Sequenced Reads If the above library generation protocol is followed, each se-quenced read (i.e., flowgram) consists of the following parts, which the amplikyzer algorithmneeds to recognize in order to correctly classify the read:
1. the 454 key sequence (always TCAG), consuming two full TACG flow cycles and correspond-ing to the flow prefix (1.00, 0.00, 1.00, 0.00, 0.00, 1.00, 0.00, 1.00). The key sequence is usedto normalize observed flow intensities, such that the observed value of 1.00 on averagecorresponds to a flow of a single nucleotide.
2. a MID (multiplex ID), used to sequence amplicons from different samples in the same run.Each MID is a unique DNA sequence of length 10 nt.
3. a tag, for which presently only two possibilities exist, forward and reverse. The presenceof the forward tag CTTGCTTCCTGGCACGAG indicates that the remainder of the read will startwith a forward primer, continue with the corresponding region of interest, end with the
5
PeerJ PrePrints | https://peerj.com/preprints/122v2/ | v2 received: 29 Nov 2013, published: 29 Nov 2013, doi: 10.7287/peerj.preprints.122v2
PrePrin
ts

reverse primer, and that C 7→ T substitutions should be expected because of bisulfite treat-ment. In contrast, the reverse tag CAGGAAACAGCTATGAC indicates that the read continueswith the reverse complements of a reverse primer, of the corresponding region of interestand of the forward primer, and that G 7→ A substitutions are expected.
4. locus sequence, consisting of either (f, i, r) or (r, i, f), depending on the tag type, where fis the forward primer, i the region of interest (ROI), and r the reverse primer (as given in5′ → 3′ direction on the genomic reference), and · denotes reverse complement. The locussequence is the only read element that is bisulfite-treated.
The other tag and another copy of the MID follow, but we do not consider them during theanalysis. Table 1 shows an overview of the read structure.
The amplikyzer software can be adapted to other read structures via configuration files; thedescription in this article, however, assumes the above structure.
3 Algorithms
This section describes the novel algorithmic analysis approach implemented by the amplikyzersoftware. As explained in Section 2.1, when working with flowgram-based data, it is advantageousto work directly with the flow intensities instead of converting to a DNA sequence first, inorder to avoid information loss and spurious insertions or deletions in alignments. Methods todirectly align flowgrams to DNA have been described previously (Vacic et al., 2008; Lysholmet al., 2011; Martin and Rahmann, 2013). None of them can efficiently make use of string-basedindexing techniques and are thus much slower than state-of-the-art read mappers using hashingor an FM index based on the Burrows-Wheeler transform (Li and Durbin, 2009; Langmead andSalzberg, 2012). Therefore we introduce a hybrid representation between flowgram and DNAsequence (Section 3.1). It retains some of the flexibility of flow intensity values, but on the otherhand allows to use the established FM index data structure and to construct a novel variantof the above-mentioned read mapping algorithms for rapid mapping of flowgram reads to ROIs(Section 3.2). Finally, we discuss the final alignment of the flowgram to the ROI sequence andsubsequent methylation calling (Section 3.3).
The steps described in this subsection are the most time-consuming ones when analyzing anSFF file. The subsequent steps, such as aggregating methylation information and producingtextual or graphical reports on methylation states and rates, can be performed quickly andflexibly, given the alignment results. They are discussed in Section 4.
3.1 Hybrid Flowgram-String Representation
We write a single flow as Bf , where B ∈ Σ := A, C, G, T is the base and f ∈ 0.00, 0.01, 0.02, . . . is the intensity. A flowgram is a sequence of flows (Bf1
1 , Bf22 , . . . ). Frequently, the Bi are a
repeated fixed permutation of the DNA alphabet, but this is not necessary.In order to use string-based indexing schemes and fast mapping algorithms, we convert a
flowgram to a string over the extended alphabet Ω := A, a, C, c, G, g, T, t, +. We write b for thelower-case letter of B ∈ Σ and cn with integer n for the string representing the n-fold repetitionof c ∈ Ω. We write c0 for the empty string.
Let 0 ≤ µ ≤ 0.5 be a parameter that describes how much a flow intensity may deviate froman integer value to be considered an uncertain flow ; in practice, we use µ = 0.2. That is, if flowintensity f ∈ [n− µ, n+ µ] for some integer n, we decide that flow Bf corresponds to the n-fold
6
PeerJ PrePrints | https://peerj.com/preprints/122v2/ | v2 received: 29 Nov 2013, published: 29 Nov 2013, doi: 10.7287/peerj.preprints.122v2
PrePrin
ts

length orientation bisulfite indexed req. match lenelement [bp] in read treated? sequence L C
key 4 fwd no fwd 4 4MID 10 fwd no fwd 7 7
tag 17–18 fwd no fwd 10 12locus 100+ fwd or rc yes fwd(C 7→ T) ∪ rc(G 7→ A) 30 50
Table 1: Read elements, properties, indexed sequence (fwd: forward; rc: reverse complement) andrequired exact match lengths to recognize an element; L: required exact match lengthat some starting position within the relevant part of the read; C: required cumulativematch length over the relevant part of the read.
repetition of B exactly, but if f ∈]n+ µ, n+ 1− µ[, then we decide that Bf corresponds to n orn+ 1 repetitions of B and write this as Bnb with an additional lower-case (“uncertain”) base atthe end. Because of saturation effects and limited discrimination power at high intensities, welimit this scheme at a given integer cut-off value N and convert Bf to BN+ for f > N +µ, wherethe + indicates an unspecified additional number of Bs.
In other words, given parameters µ and N , the flow Bf is converted to its hybrid representation
h(Bf ) :=
Bn if |f − n| ≤ µ and 0 ≤ n ≤ N,Bnb if n+ µ < f < n+ 1− µ and 0 ≤ n < N,
BN+ if f > N + µ.
(1)
3.2 Rapid Read Mapping of Hybrid Flowgram-DNA Sequences
Preliminaries We describe how to efficiently find the correct MID and locus/ROI for each read,without generating the alignment yet. Each read is assumed to be a flowgram following thestructure described in Section 2.3. For rapid read mapping, in order to quickly identify MID andROI, each read is converted into the hybrid format, i.e., a string over alphabet Ω, described inSection 3.1.
For each modular part of a read (keys, MIDs, tags, and loci containing forward primer, ROIand reverse primer), we build a separate index data structure similar to an FM index (see below).Currently, there exists only one possible key sequence (TCAG) on the Roche 454 GS Junior, soindexing keys is not strictly necessary. For uniformity of analysis, however, we treat the keysimilar to the other read elements. The way the index is built differs for each element, accordingto its possible orientations in the read (forward only, or possibly as reverse complement) and itsbisulfite treatment status (true or false). An overview is given in Table 1. The locus sequencemay be oriented forward or reverse complementary in the read (according to the observed tagtype) and is bisulfite-treated. Therefore, we index two variants of the locus sequence, each over athree-letter alphabet: the forward reference contains only A, G, T, while the reverse complementaryreference contains only A, C, T. In order to precisely map the flowgram reads in the hybrid Ω-representation to the index, we use the same homopolymer length cut-off value N as in Section 3.1and reduce longer homopolymers to length N (in practice, N = 4).
For technical reasons, as we use a variant of backward search for read mapping, but want toprocess the flowgrams from left to right, the reversed (not reverse complementary) sequences ofthe elements given in Table 1 are used. All reversed reference sequences of a structural elementare terminated by a special character (traditionally written as $) and then concatenated. A $
7
PeerJ PrePrints | https://peerj.com/preprints/122v2/ | v2 received: 29 Nov 2013, published: 29 Nov 2013, doi: 10.7287/peerj.preprints.122v2
PrePrin
ts
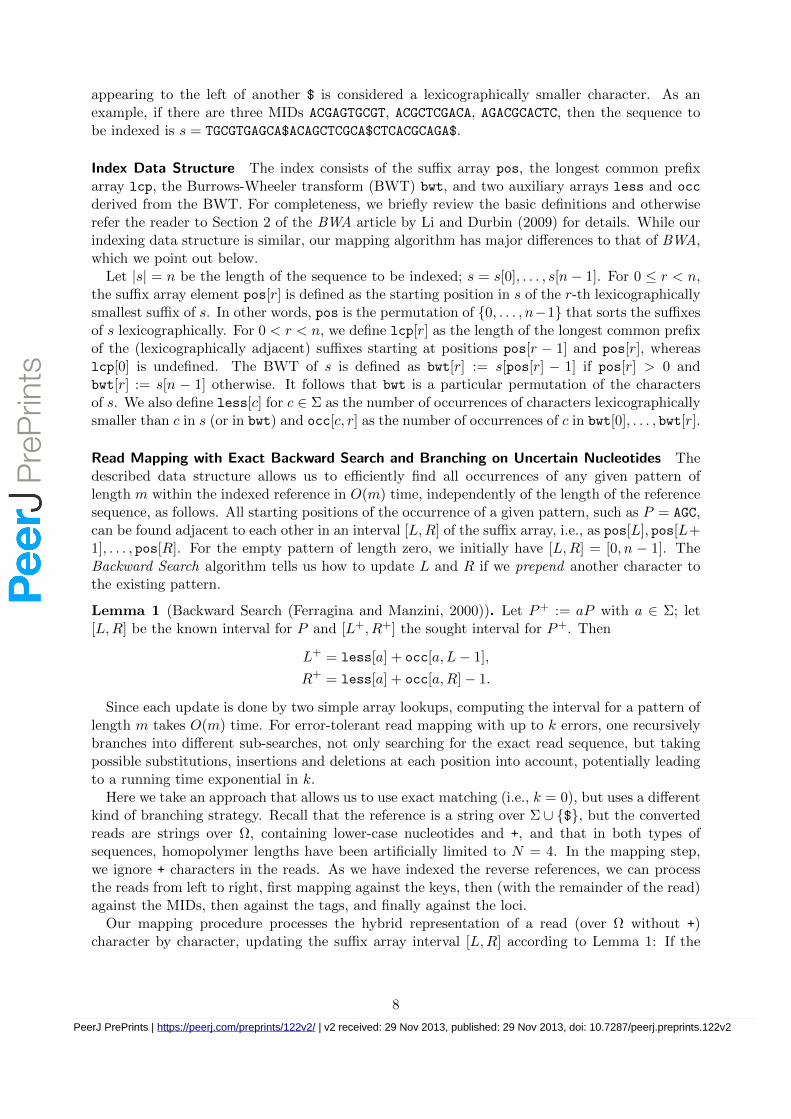
appearing to the left of another $ is considered a lexicographically smaller character. As anexample, if there are three MIDs ACGAGTGCGT, ACGCTCGACA, AGACGCACTC, then the sequence tobe indexed is s = TGCGTGAGCA$ACAGCTCGCA$CTCACGCAGA$.
Index Data Structure The index consists of the suffix array pos, the longest common prefixarray lcp, the Burrows-Wheeler transform (BWT) bwt, and two auxiliary arrays less and occ
derived from the BWT. For completeness, we briefly review the basic definitions and otherwiserefer the reader to Section 2 of the BWA article by Li and Durbin (2009) for details. While ourindexing data structure is similar, our mapping algorithm has major differences to that of BWA,which we point out below.
Let |s| = n be the length of the sequence to be indexed; s = s[0], . . . , s[n− 1]. For 0 ≤ r < n,the suffix array element pos[r] is defined as the starting position in s of the r-th lexicographicallysmallest suffix of s. In other words, pos is the permutation of 0, . . . , n−1 that sorts the suffixesof s lexicographically. For 0 < r < n, we define lcp[r] as the length of the longest common prefixof the (lexicographically adjacent) suffixes starting at positions pos[r − 1] and pos[r], whereaslcp[0] is undefined. The BWT of s is defined as bwt[r] := s[pos[r] − 1] if pos[r] > 0 andbwt[r] := s[n − 1] otherwise. It follows that bwt is a particular permutation of the charactersof s. We also define less[c] for c ∈ Σ as the number of occurrences of characters lexicographicallysmaller than c in s (or in bwt) and occ[c, r] as the number of occurrences of c in bwt[0], . . . , bwt[r].
Read Mapping with Exact Backward Search and Branching on Uncertain Nucleotides Thedescribed data structure allows us to efficiently find all occurrences of any given pattern oflength m within the indexed reference in O(m) time, independently of the length of the referencesequence, as follows. All starting positions of the occurrence of a given pattern, such as P = AGC,can be found adjacent to each other in an interval [L,R] of the suffix array, i.e., as pos[L], pos[L+1], . . . , pos[R]. For the empty pattern of length zero, we initially have [L,R] = [0, n − 1]. TheBackward Search algorithm tells us how to update L and R if we prepend another character tothe existing pattern.
Lemma 1 (Backward Search (Ferragina and Manzini, 2000)). Let P+ := aP with a ∈ Σ; let[L,R] be the known interval for P and [L+, R+] the sought interval for P+. Then
L+ = less[a] + occ[a, L− 1],
R+ = less[a] + occ[a,R]− 1.
Since each update is done by two simple array lookups, computing the interval for a pattern oflength m takes O(m) time. For error-tolerant read mapping with up to k errors, one recursivelybranches into different sub-searches, not only searching for the exact read sequence, but takingpossible substitutions, insertions and deletions at each position into account, potentially leadingto a running time exponential in k.
Here we take an approach that allows us to use exact matching (i.e., k = 0), but uses a differentkind of branching strategy. Recall that the reference is a string over Σ ∪ $, but the convertedreads are strings over Ω, containing lower-case nucleotides and +, and that in both types ofsequences, homopolymer lengths have been artificially limited to N = 4. In the mapping step,we ignore + characters in the reads. As we have indexed the reverse references, we can processthe reads from left to right, first mapping against the keys, then (with the remainder of the read)against the MIDs, then against the tags, and finally against the loci.
Our mapping procedure processes the hybrid representation of a read (over Ω without +)character by character, updating the suffix array interval [L,R] according to Lemma 1: If the
8
PeerJ PrePrints | https://peerj.com/preprints/122v2/ | v2 received: 29 Nov 2013, published: 29 Nov 2013, doi: 10.7287/peerj.preprints.122v2
PrePrin
ts

processed character is upper case (in Σ) then Lemma 1 is applied directly. If, however, the pro-cessed character is lower case, designating a potential but uncertain flow, the search branchesinto two cases. The first case corresponds to processing the character as if it were upper case; thesecond case simply skips the character. In order to avoid excessive branching due to many adja-cent lower-case characters without informative upper-case characters in between, some uncertain(lower-case) nucleotides are converted to their certain (upper-case) counterparts using a greedystrategy, such that at most three uncertain nucleotides exist in each sliding window of length 20.
Application of Lemma 1 continues in each sub-branch until the suffix array interval [L+, R+]becomes empty (i.e., L+ > R+), or until all read characters have been used. In the former case,we record the last valid [L,R] interval; in the latter case, we record the final interval. In bothcases, we also note the associated match length ` (number of matching characters).
Since we do not allow for errors when mapping (but do branch for uncertain characters), were-start the mapping procedure at each position in the read, instead of only from the beginning.This results, for each starting position i within the hybrid read sequence, in a maximal matchlength `i and an associated suffix array interval [Li, Ri]. The sequence of `i values is referred toas matching statistics. If `i is too small to indicate a significant match we treat it as zero. Therequired values for retaining `i are given in Table 1 (column L) for each read element.
Typically, for sufficiently long maximal matches, there is a single matching position withinthe indexed sequence, i.e., the final suffix array interval [Li, Ri] has length 1. In general, foreach found reference position pos[r], Li ≤ r ≤ Ri, with maximal match length `i, we find theassociated reference sequence k (e.g., MID or locus) and keep track of the length of the maximalmatch between the read and each individual reference sequence k. Additionally, we keep trackof accumulated match lengths as follows. We say that there is a jump in matching statistics atread position i if either i = 0 or `i > `i−1 − 1, i.e., the found maximally matching string is adifferent one than at the previous position (Rahmann, 2003). For each reference sequence, weadd the match lengths at jumps to obtain cumulated match lengths.
Interpretation of Maximal and Cumulated Matching Statistics For each read part, the map-ping procedure yields two numbers for each reference sequence k: the length `(k) of the longestmatch, and the cumulated length c(k) of longest matches after jumps. We say that a read poten-tially maps to reference k if `(k) ≥ L or c(k) ≥ C for thresholds L, C as given in Table 1.
The final decision against which references the current part of the read is precisely aligned ismade on the basis of the two resulting candidate sets
SC := k | c(k) ≥ C, SL := k | `(k) ≥ L
according to the following case distinction.If |SC| = |SL| = 0, no suitable references have been found, and the read has not been mapped.
If |SC| = 0 and |SL| = 1, the read is aligned against the unique sequence in SL, even thoughthere is only weak mapping evidence. If |SC| = 0 and |SL| > 1, no reasonable unique referencewas identified, and the read is not aligned. If |SC| = 1 and |SL| = 0, the read is aligned againstthe unique sequence in SC, even though there is only weak mapping evidence. If |SC| = |SL| = 1and SC = SL, both criteria indicate the same reference, and the read is aligned against it; this isthe ideal and most common case. If |SC| = |SL| = 1 and SC 6= SL, the criteria indicate differentreferences, and the read is aligned against both, although only weak evidence exists for either.If |SC| = 1, |SL| > 1 and SC ⊂ SL, both criteria agree on the unique sequence in SC, and theread is aligned against it. In the same case, if SC 6⊂ SL, there is a contradiction between thecriteria and the read is aligned against SC ∪ SL; this is a rare case. If |SC| > 1 and |SL| = 0, no
9
PeerJ PrePrints | https://peerj.com/preprints/122v2/ | v2 received: 29 Nov 2013, published: 29 Nov 2013, doi: 10.7287/peerj.preprints.122v2
PrePrin
ts
A C G T N B D H V R Y S W K M
A 10 −19 −19 −19 0 −19 2 2 2 5 −19 −19 5 −19 5C −19 10 −19 −19 0 2 −19 2 2 −19 5 5 −19 −19 5G −19 −19 10 −19 0 2 2 −19 2 5 −19 5 −19 5 −19T −19 −19 −19 10 0 2 2 2 −19 −19 5 −19 5 5 −19a 10 −21 −21 −21 0 −21 2 2 2 5 −21 −21 5 −21 5c −21 10 −21 −21 0 2 −21 2 2 −21 5 5 −21 −21 5g −21 −21 10 −21 0 2 2 −21 2 5 −21 5 −21 5 −21t −21 −21 −21 10 0 2 2 2 −21 −21 5 −21 5 5 −21+ −∞ −∞ −∞ −∞ −∞ −∞ −∞ −∞ −∞ −∞ −∞ −∞ −∞ −∞ −∞A 10 −19 −19 −19 0 −19 2 1 1 5 −19 −19 5 −19 3C −19 10 −19 −19 −3 −1 −19 −1 −1 −19 2 2 −19 −19 2G −19 −19 10 −19 0 1 2 −19 1 5 −19 3 −19 5 −19T −19 10 −19 10 4 6 2 6 −1 −19 10 2 5 5 2a 10 −21 −21 −21 0 −21 2 1 1 5 −21 −21 5 −21 3c −21 10 −21 −21 −3 −1 −21 −1 −1 −21 2 2 −21 −21 2g −21 −21 10 −21 0 1 2 −21 1 5 −21 3 −21 5 −21t −21 10 −21 10 4 6 2 6 −1 −21 10 2 5 5 2+ −∞ −∞ −∞ −∞ −∞ −∞ −∞ −∞ −∞ −∞ −∞ −∞ −∞ −∞ −∞A 10 −19 10 −19 4 −1 6 2 6 10 −19 2 5 2 5C −19 10 −19 −19 0 1 −19 2 1 −19 5 3 −19 −19 5G −19 −19 10 −19 −3 −1 −1 −19 −1 2 −19 2 −19 2 −19T −19 −19 −19 10 0 1 1 2 −19 −19 5 −19 5 3 −19a 10 −21 10 −21 4 −1 6 2 6 10 −21 2 5 2 5c −21 10 −21 −21 0 1 −21 2 1 −21 5 3 −21 −21 5g −21 −21 10 −21 −3 −1 −1 −21 −1 2 −21 2 −21 2 −21t −21 −21 −21 10 0 1 1 2 −21 −21 5 −21 5 3 −21+ −∞ −∞ −∞ −∞ −∞ −∞ −∞ −∞ −∞ −∞ −∞ −∞ −∞ −∞ −∞
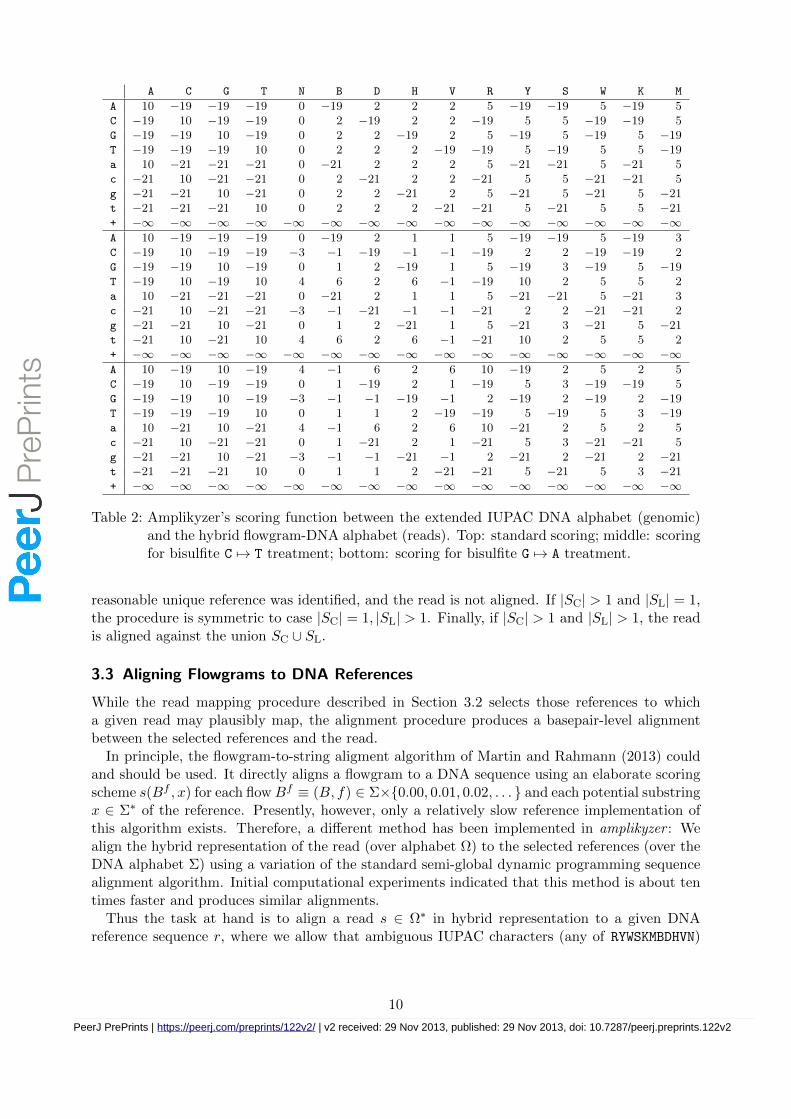
Table 2: Amplikyzer’s scoring function between the extended IUPAC DNA alphabet (genomic)and the hybrid flowgram-DNA alphabet (reads). Top: standard scoring; middle: scoringfor bisulfite C 7→ T treatment; bottom: scoring for bisulfite G 7→ A treatment.
reasonable unique reference was identified, and the read is not aligned. If |SC| > 1 and |SL| = 1,the procedure is symmetric to case |SC| = 1, |SL| > 1. Finally, if |SC| > 1 and |SL| > 1, the readis aligned against the union SC ∪ SL.
3.3 Aligning Flowgrams to DNA References
While the read mapping procedure described in Section 3.2 selects those references to whicha given read may plausibly map, the alignment procedure produces a basepair-level alignmentbetween the selected references and the read.
In principle, the flowgram-to-string aligment algorithm of Martin and Rahmann (2013) couldand should be used. It directly aligns a flowgram to a DNA sequence using an elaborate scoringscheme s(Bf , x) for each flowBf ≡ (B, f) ∈ Σ×0.00, 0.01, 0.02, . . . and each potential substringx ∈ Σ∗ of the reference. Presently, however, only a relatively slow reference implementation ofthis algorithm exists. Therefore, a different method has been implemented in amplikyzer : Wealign the hybrid representation of the read (over alphabet Ω) to the selected references (over theDNA alphabet Σ) using a variation of the standard semi-global dynamic programming sequencealignment algorithm. Initial computational experiments indicated that this method is about tentimes faster and produces similar alignments.
Thus the task at hand is to align a read s ∈ Ω∗ in hybrid representation to a given DNAreference sequence r, where we allow that ambiguous IUPAC characters (any of RYWSKMBDHVN)
10
PeerJ PrePrints | https://peerj.com/preprints/122v2/ | v2 received: 29 Nov 2013, published: 29 Nov 2013, doi: 10.7287/peerj.preprints.122v2
PrePrin
ts

A A A G G TG
T
A
a
G
G
+
c
T
score(T,A) [mismatch]
score(A,A) [match]
score(a,A) [small match]
del(G,+; G)
ins(+; G,T)
ins(c; G,T)
T1.01
A1.54
G2.41
C0.32
T0.98
Figure 1: Alignment graph between a hybrid flowgram-DNA string (vertical) and a genomic refer-ence (horizontal). Potentially, all horizontal, vertical and main diagonal edges betweenthe nodes exist. Here the optimal alignment, a maximum-scoring path through thegraph, has been marked. Scoring of diagonal edges is done using the scores from Ta-ble 2. Scoring of horizontal edges uses the del function described in Eq. (2), and scoringof vertical edges uses the ins function described in Eq. (3).
may exist in r to denote SNP positions and their possible realizations.We use the three scoring schemes shown in Table 2: one for untreated (parts of) reads, one
for forward tagged bisulfite-treated reads with expected C 7→ T substitutions, and one for reversetagged bisulfite-treated reads with G 7→ A substitutions. The scores are computed as log-oddsfrom expected frequencies of matches and mismatches in true alignments using amplikyzer ’sscoring module. It is assumed that the frequency of matches in correct alignments is 95% forflows considered certain, allowing a reasonable margin for SNP positions and sequencing errors.For uncertain flows (lower-case letters), a match frequency of 96% is assumed, slightly higherthan for upper-case letters. The rationale behind this constraint is that if an uncertain flow isused, there should be a good reason for it, i.e., a match in the alignment. The scores are scaledand rounded such that the standard match score achieves a value of 10.
Note that the + symbol that indicates a long homopolymer of unspecified length above a cut-off N in the read cannot be aligned directly to a genomic nucleotide and has to be aligned to agap character.
Indeed, the key difference of the alignment algorithm in comparison to existing ones is itsscoring of insertions and deletions. Recall that each alignment can be viewed as a path in analignment graph (also edit graph) with horizontal, vertical and diagonal edges (oriented left-to-right and top-to-bottom) and that the score of an alignment can be written as the sum of thescores assigned to each edge of the path. The optimal alignment then corresponds to a maximum-scoring path in that graph (see Figure 1). To specify a scoring scheme, we specify how to scoreeach edge, depending on its type and the annotated characters.
Let del(h1, h2; g) be the (negative) score a horizontal edge (an additional genomic character gbetween two hybrid symbols h1, h2) and ins(h; g1, g2) be the (negative) score for a vertical edge(an additional hybrid symbol h between two genomic characters g1, g2). Usually, such gap scoresare assigned a constant value per edge, or using an affine function depending on the total lengthof the gap. The gap scoring in amplikyzer differs, since the score depends on the surrounding
11
PeerJ PrePrints | https://peerj.com/preprints/122v2/ | v2 received: 29 Nov 2013, published: 29 Nov 2013, doi: 10.7287/peerj.preprints.122v2
PrePrin
ts
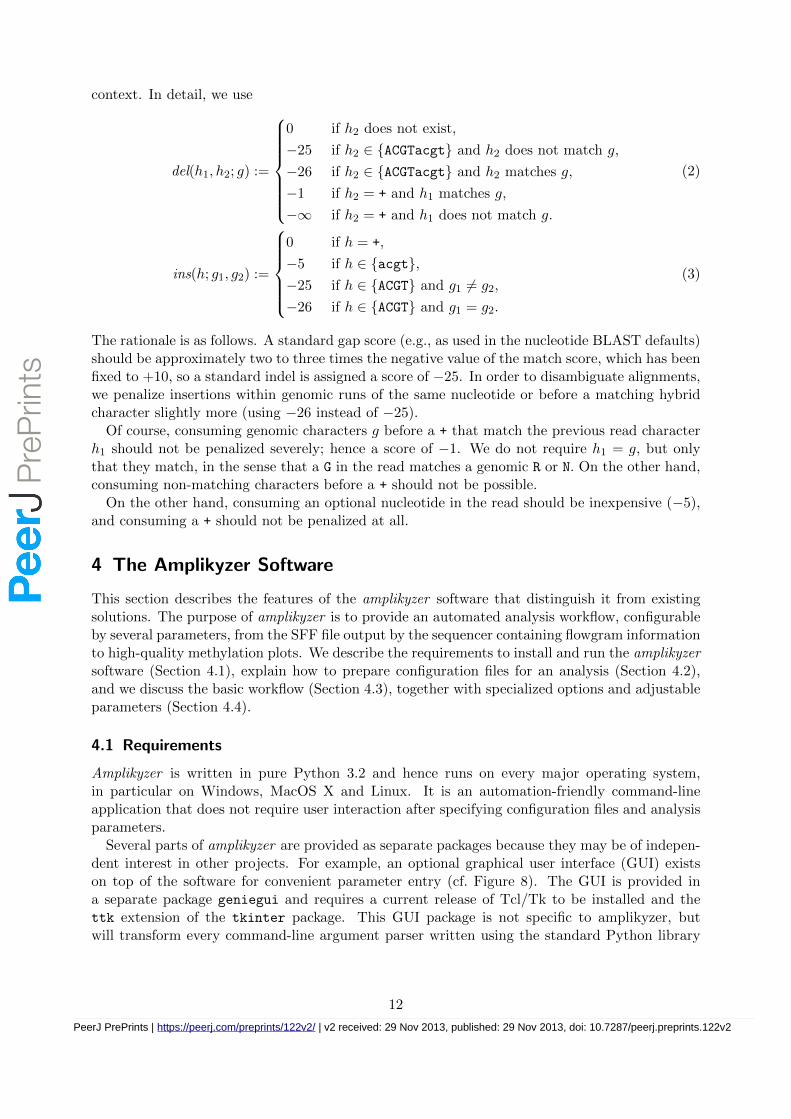
context. In detail, we use
del(h1, h2; g) :=
0 if h2 does not exist,
−25 if h2 ∈ ACGTacgt and h2 does not match g,
−26 if h2 ∈ ACGTacgt and h2 matches g,
−1 if h2 = + and h1 matches g,
−∞ if h2 = + and h1 does not match g.
(2)
ins(h; g1, g2) :=
0 if h = +,
−5 if h ∈ acgt,−25 if h ∈ ACGT and g1 6= g2,
−26 if h ∈ ACGT and g1 = g2.
(3)
The rationale is as follows. A standard gap score (e.g., as used in the nucleotide BLAST defaults)should be approximately two to three times the negative value of the match score, which has beenfixed to +10, so a standard indel is assigned a score of −25. In order to disambiguate alignments,we penalize insertions within genomic runs of the same nucleotide or before a matching hybridcharacter slightly more (using −26 instead of −25).
Of course, consuming genomic characters g before a + that match the previous read characterh1 should not be penalized severely; hence a score of −1. We do not require h1 = g, but onlythat they match, in the sense that a G in the read matches a genomic R or N. On the other hand,consuming non-matching characters before a + should not be possible.
On the other hand, consuming an optional nucleotide in the read should be inexpensive (−5),and consuming a + should not be penalized at all.
4 The Amplikyzer Software
This section describes the features of the amplikyzer software that distinguish it from existingsolutions. The purpose of amplikyzer is to provide an automated analysis workflow, configurableby several parameters, from the SFF file output by the sequencer containing flowgram informationto high-quality methylation plots. We describe the requirements to install and run the amplikyzersoftware (Section 4.1), explain how to prepare configuration files for an analysis (Section 4.2),and we discuss the basic workflow (Section 4.3), together with specialized options and adjustableparameters (Section 4.4).
4.1 Requirements
Amplikyzer is written in pure Python 3.2 and hence runs on every major operating system,in particular on Windows, MacOS X and Linux. It is an automation-friendly command-lineapplication that does not require user interaction after specifying configuration files and analysisparameters.
Several parts of amplikyzer are provided as separate packages because they may be of indepen-dent interest in other projects. For example, an optional graphical user interface (GUI) existson top of the software for convenient parameter entry (cf. Figure 8). The GUI is provided ina separate package geniegui and requires a current release of Tcl/Tk to be installed and thettk extension of the tkinter package. This GUI package is not specific to amplikyzer, butwill transform every command-line argument parser written using the standard Python library
12
PeerJ PrePrints | https://peerj.com/preprints/122v2/ | v2 received: 29 Nov 2013, published: 29 Nov 2013, doi: 10.7287/peerj.preprints.122v2
PrePrin
ts

[MIDS]
MID01 = ACGAGTGCGT
MID02 = ACGCTCGACA
...
[LABELS]
MID01 = Alice
MID02 = Bob
...
[TAGS]
FWD = CTTGCTTCCTGGCACGAG
REV = CAGGAAACAGCTATGAC
[LOCI]
MEST =
CCGCTGCTGGCCAGCTCTGCACGGCT,
GCGGGCTCTGCGGCGCCCGGTGCTCTGCAACGCT...GTGCG,
GTGGGAACGAGGGGGTGTGGCTGG
...
Table 3: Abbreviated example of an amplikyzer configuration file (extension .conf), followingthe standard INI format. It is recommended to store the sections for MIDs, labels, tagsand loci in different files, such as mids.conf, labels.conf. tags.conf and loci.conf
in the same directory as the SFF file to be analyzed.
argparse package into a GUI that will launch the command-line program with the user-providedparameter values. Another package parses the SFF file format, while another one implementsgeneric BWT-based read mapping algorithms in Python. All of these packages are collected intoa single ZIP archive and should be installed together to obtain the full functionality. The numpy
and matplotlib Python packages are required for graphical output.
4.2 Basic Configuration
We recommend to use a separate directory for each analysis. Such a directory should containthe SFF file and additional configuration files required for analysis. These configuration filesmust specify MID sequences, optionally human-readable labels to replace MIDs in the analysisoutput, forward and reverse tag sequences, and ROI sequences with primers, as they appear in thereference genome. The configuration files must adhere to the standard INI file format5; Table 3shows an example. MIDs and tags are typically re-used in every analysis, as these sequencesdo not change, but the labels and analyzed loci are project-specific. The [LABELS] section isoptional, but convenient if one wants to identify each sample in the analysis results not by MID01,but by a more human-readable alias. If no label is specified for any MID, the MID name is used(typically a string like MID07).
The [LOCI] section is the most complex one, as it contains each locus sequence, separatedinto forward primer, region of interest (ROI) and reverse primer, as a contiguous forward-strandgenomic sequence (without simulated bisulfite treatment), with the three parts separated bycommas. In other words, the format of a single locus entry is as follows.
5see http://en.wikipedia.org/wiki/INI_file for a description
13
PeerJ PrePrints | https://peerj.com/preprints/122v2/ | v2 received: 29 Nov 2013, published: 29 Nov 2013, doi: 10.7287/peerj.preprints.122v2
PrePrin
ts
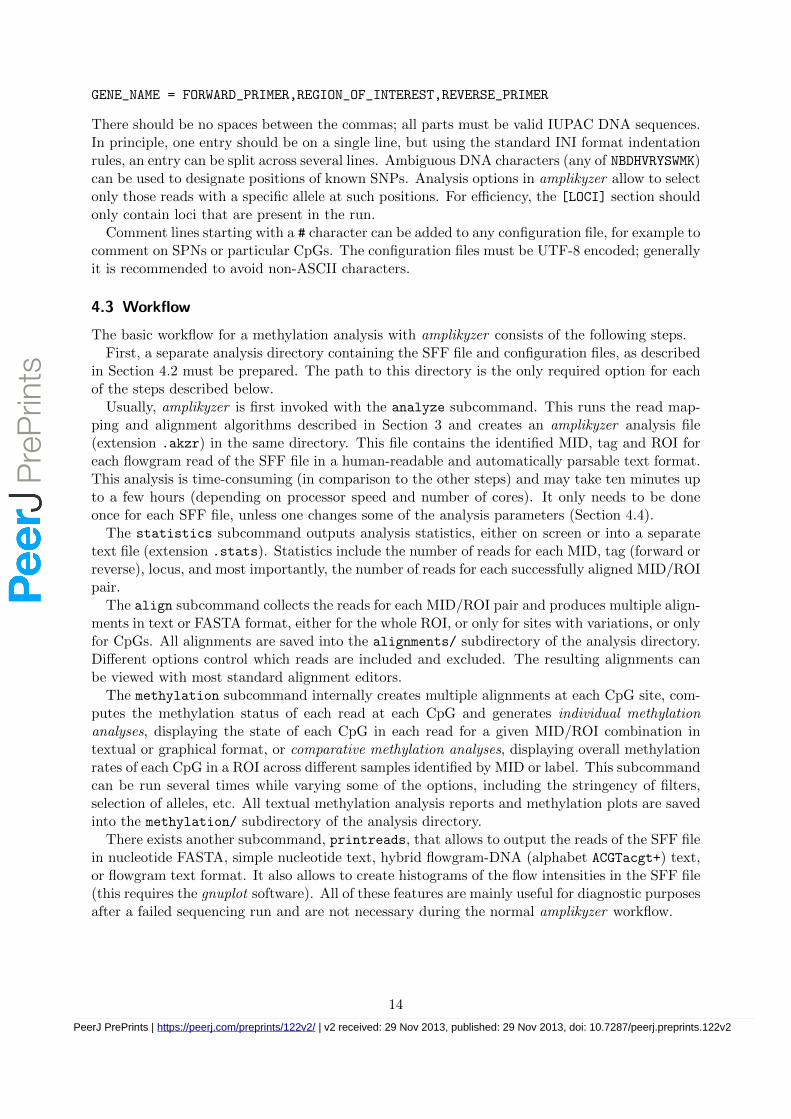
GENE_NAME = FORWARD_PRIMER,REGION_OF_INTEREST,REVERSE_PRIMER
There should be no spaces between the commas; all parts must be valid IUPAC DNA sequences.In principle, one entry should be on a single line, but using the standard INI format indentationrules, an entry can be split across several lines. Ambiguous DNA characters (any of NBDHVRYSWMK)can be used to designate positions of known SNPs. Analysis options in amplikyzer allow to selectonly those reads with a specific allele at such positions. For efficiency, the [LOCI] section shouldonly contain loci that are present in the run.
Comment lines starting with a # character can be added to any configuration file, for example tocomment on SPNs or particular CpGs. The configuration files must be UTF-8 encoded; generallyit is recommended to avoid non-ASCII characters.
4.3 Workflow
The basic workflow for a methylation analysis with amplikyzer consists of the following steps.First, a separate analysis directory containing the SFF file and configuration files, as described
in Section 4.2 must be prepared. The path to this directory is the only required option for eachof the steps described below.
Usually, amplikyzer is first invoked with the analyze subcommand. This runs the read map-ping and alignment algorithms described in Section 3 and creates an amplikyzer analysis file(extension .akzr) in the same directory. This file contains the identified MID, tag and ROI foreach flowgram read of the SFF file in a human-readable and automatically parsable text format.This analysis is time-consuming (in comparison to the other steps) and may take ten minutes upto a few hours (depending on processor speed and number of cores). It only needs to be doneonce for each SFF file, unless one changes some of the analysis parameters (Section 4.4).
The statistics subcommand outputs analysis statistics, either on screen or into a separatetext file (extension .stats). Statistics include the number of reads for each MID, tag (forward orreverse), locus, and most importantly, the number of reads for each successfully aligned MID/ROIpair.
The align subcommand collects the reads for each MID/ROI pair and produces multiple align-ments in text or FASTA format, either for the whole ROI, or only for sites with variations, or onlyfor CpGs. All alignments are saved into the alignments/ subdirectory of the analysis directory.Different options control which reads are included and excluded. The resulting alignments canbe viewed with most standard alignment editors.
The methylation subcommand internally creates multiple alignments at each CpG site, com-putes the methylation status of each read at each CpG and generates individual methylationanalyses, displaying the state of each CpG in each read for a given MID/ROI combination intextual or graphical format, or comparative methylation analyses, displaying overall methylationrates of each CpG in a ROI across different samples identified by MID or label. This subcommandcan be run several times while varying some of the options, including the stringency of filters,selection of alleles, etc. All textual methylation analysis reports and methylation plots are savedinto the methylation/ subdirectory of the analysis directory.
There exists another subcommand, printreads, that allows to output the reads of the SFF filein nucleotide FASTA, simple nucleotide text, hybrid flowgram-DNA (alphabet ACGTacgt+) text,or flowgram text format. It also allows to create histograms of the flow intensities in the SFF file(this requires the gnuplot software). All of these features are mainly useful for diagnostic purposesafter a failed sequencing run and are not necessary during the normal amplikyzer workflow.
14
PeerJ PrePrints | https://peerj.com/preprints/122v2/ | v2 received: 29 Nov 2013, published: 29 Nov 2013, doi: 10.7287/peerj.preprints.122v2
PrePrin
ts

4.4 Adjustable Parameters
The amplikyzer software comes with built-in help, available using the --help option of eachsubcommand. For example, running
python3.2 -m amplikyzer analyze --help
displays analysis parameters and options. We only discuss the most important ones.The analyze subcommand makes use of a modern multi-core system by running the analysis
in parallel processes; the number of processes to be used can be specified using the -j option.The parameters µ and N of the hybrid flowgram-DNA representation described in Section 3.1,as used for read mapping, can be set using options --certainflow and --maxflow, respectively;their default values are µ = 0.2 and N = 4. During the alignment phase, µ can be set differentlyusing the option --alignmaybeflow; its default value is 0.35.
The methylation subcommand allows to specify the following parameters.
--loci with a space-separated list of locus names runs the analysis only on the specified loci.The default * is to iterate over each locus for which sufficiently many alignments exist.
--mids allows to restrict the analysis to given MIDs. Using the default * on both loci and MIDsprovides a fully automatic analysis of each MID/ROI combination for which enough readsare available without further interaction.
--alleles with a string specifying the nucleotide values for each SNP position only selectsreads with the given allele/haplotype. Again, * iterates over all possible haplotypes sep-arately. Specifying N aggregates reads irrespective of SNP status at the correspondingposition. For example, if a specific locus XYZ has four SNP positions, the option com-bination --loci XYZ --alleles ANNA performs methylation analysis using all reads thatshow an A at the first and fourth SNP position, aggregating over the second and third SNPposition. To the best of our knowledge, this way to restrict the analysis to specific allelesis a unique feature of amplikyzer.
--minreads with a number (default: 20) specifies the number of required informative reads inorder to produce an output file. Specifying a lower number than the default should beavoided, as methylation rates computed on less than 20 reads are of questionable value.
--type with an analysis type name (individual, comparative or smart) decides which type ofanalysis to perform: individual methylation analysis or comparative methylation analysisor both (automatically excluding uninteresting combinations).
--conversionrate with a rate between 0 and 1 (default: 0.95) specifies the required bisulfiteconversion rate for each read to be considered for the analysis. Reads with a lower conversionrate, as measured by the number of remaining Cs, are excluded from analysis.
--badcpgs with an integer number or fraction (< 1) specifies the allowed number of CpGs in aread with undetermined CpG status. The status of a CpG is determined if the correspondinggenomic C is aligned to a T (“unmethylated”) or C (“methylated”) from the read, andundetermined otherwise. If the number of fraction of undetermined CpGs exceeds thegiven threshold (default: 2), the read is excluded from analysis.
--sort with a list of sort orders allows to sort reads (during individual analysis) or samples(during comparative analysis) using the given sorting criteria. The syntax of this option
15
PeerJ PrePrints | https://peerj.com/preprints/122v2/ | v2 received: 29 Nov 2013, published: 29 Nov 2013, doi: 10.7287/peerj.preprints.122v2
PrePrin
ts

is complex, as several sort orders may be applied in combination. Each sort order consistsof a prefix specifying according to which criterion we want to sort; it must be from theset meth:, mids:, alleles:, followed (without spaces) by a corresponding argument.For example, meth:down and meth:up sort the samples by decreasing and increasing overallmethylation, respectively. Using mids:MID03,MID01,MID04 restricts the output to the givenMIDs in the given order. Using alleles:GA,GG,CA,CG restricts the output to the givenalleles (assuming two SNP positions in the selected loci) in the given order.
Additionally, there are parameters --remark to specify an arbitrary remark for the analysis,--format to specify the output format (PDF, PNG, SVG or text) and --style to specify color
or bw for graphical color or black-and-white output.There are more options controlling input and output files; and there are additional options for
the printreads, statistics and align subcommands. As they are not crucial for the mainworkflow, we refer to the built-in help of the software.
5 Experiments
To illustrate the capabilities of the algorithmic approach taken with the amplikyzer software, weanalyzed an exemplary dataset. The dataset is available as supplementary material as a singleZIP file (156 MB), including the SFF file and all configuration files; it can be directly used to testa new amplikyzer installation. It can be obtained from https://bitbucket.org/svenrahmann/
amplikyzer/downloads.
Material and Methods We established amplicon libraries for six imprinted loci (GRB10, MEST,KCNQ1OT1, H19-CTCF6, RB1 -CpG85, and SNRPN ) and one non-imprinted locus (LAMA3 ).
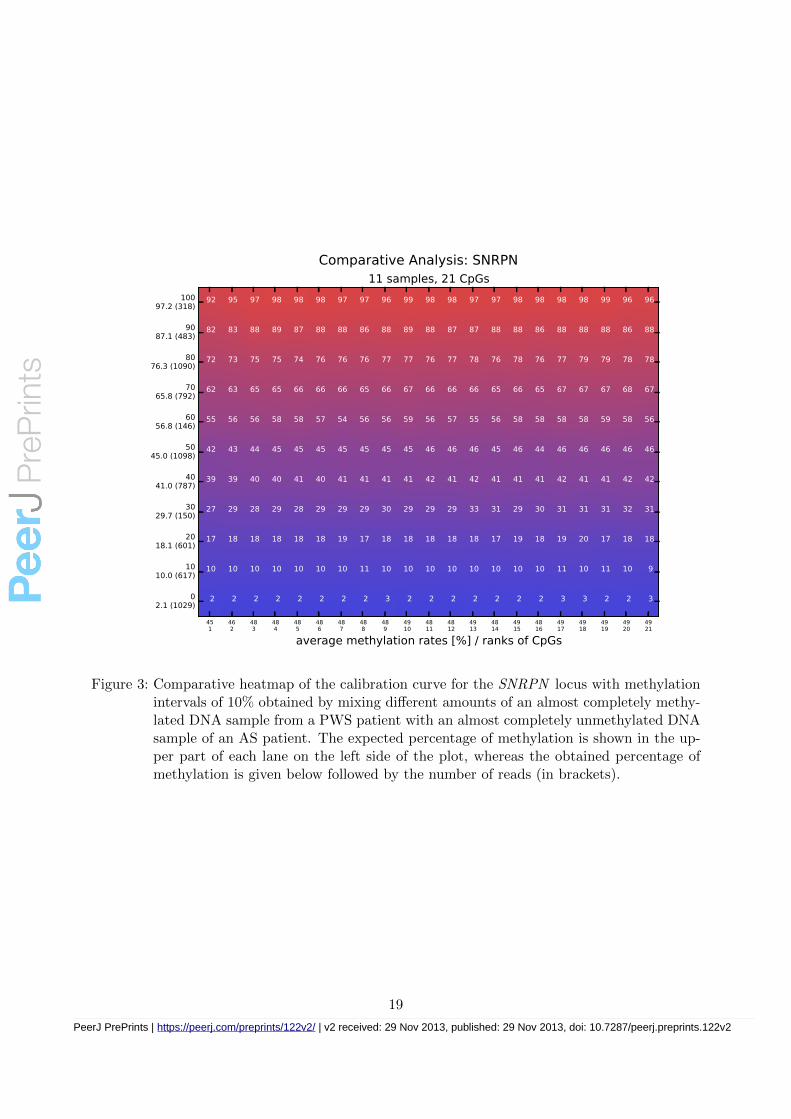
Human blood samples were obtained after written informed consent. Control blood samplesfrom blood donors were anonymised. The study was approved by the ethics committee of theUniversity of Duisburg-Essen (approval number 08-3858). For GRB10, MEST, KCNQ1OT1and RB1 we used blood DNA from individuals with known normal or abnormal methylationpatterns for amplicon library preparation. For H19-CTCF6 and LAMA3 we used DNA fromindividuals heterozygous for a single nucleotide polymorphism (SNP), which can be used toseparate the parental alleles. Furthermore, we used DNA from two patients with either Prader-Willi-syndrome (PWS) or Angelman syndrome (AS) to obtain a calibration curve for the SNRPNlocus. Both patients have a deletion of the chromosomal region 15q11q13 including SNRPN.The PWS patient carries the deletion on his unmethylated paternal chromosome 15 resultingin complete methylation of the SNRPN differentially methylated region (DMR), whereas thepatient with AS carries the deletion on his methylated maternal chromosome 15, resulting inabsence of methylation at this DMR. Eleven different amplicon libraries for the calibration curvewere set up by mixing different amounts of DNA aliquots from the PWS and AS patients.
All 33 amplicon libraries were pooled, clonally amplified and sequenced on the Roche 454GS Junior system.
The initial SFF file analysis was run with default parameters and took less than 20 minutes ona quadcore multiprocessor PC with an Intel Core i7-2600 processor at 3.4 GHz and with 8 GB ofRAM, using four parallel processes. We ran the methylation analysis using the default parameterswith a minimum conversion rate of 95% and a maximum of two undetermined CpGs in a singleread, generating single and comparative plots for each of the 33 MID/ROI combinations withmore than 100 usable reads.
16
PeerJ PrePrints | https://peerj.com/preprints/122v2/ | v2 received: 29 Nov 2013, published: 29 Nov 2013, doi: 10.7287/peerj.preprints.122v2
PrePrin
ts

MID Sample Locus amplikyzer BiQ Analyzer HT#Reads Avg. meth. #Reads Avg. meth.
MID 01 RB1 maternal deletion RB1 -CpG85 34885 3.0 15928 3.6MID 03 RB1 paternal deletion RB1 -CpG85 1125 92.9 771 96.0MID 04 normal control 1 RB1 -CpG85 1137 51.5 456 57.4MID 05 normal control 2 RB1 -CpG85 783 52.4 351 57.7MID 17 0% AS / 100% PWS SNRPN 318 97.2 295 97.2MID 18 10% AS / 90% PWS SNRPN 483 87.1 451 88.5MID 19 20% AS / 80% PWS SNRPN 1090 76.3 977 77.0MID 20 30% AS / 70% PWS SNRPN 792 65.8 678 66.6MID 21 40% AS / 60% PWS SNRPN 146 56.8 134 57.4MID 22 50% AS / 50% PWS SNRPN 1098 45.0 939 46.4MID 24 60% AS / 40% PWS SNRPN 787 41.0 686 41.2MID 25 70% AS / 30% PWS SNRPN 150 29.7 124 30.4MID 26 80% AS / 20% PWS SNRPN 601 18.1 527 18.7MID 27 90% AS / 10% PWS SNRPN 617 10.0 558 9.9MID 28 100% AS / 0% PWS SNRPN 1029 2.1 900 2.0MID 09 normal control 1 LAMA3 670 61.6 576 61.1MID 10 normal control 2 LAMA3 723 65.1 618 65.7MID 08 normal control 1 H19-CTCF6 3319 45.0 2890 48.2MID 17 normal control 2 H19-CTCF6 4938 49.6 4293 48.9MID 25 normal control 3 H19-CTCF6 2486 52.5 2062 51.1MID 17 normal control 1 KCNQ10T 3579 57.1 3743 57.5MID 18 normal control 2 KCNQ10T 5667 63.3 5370 62.2MID 19 normal control 3 KCNQ10T 5180 63.9 5152 63.9MID 20 normal control 4 KCNQ10T 5703 56.2 5713 55.1MID 06 BWS KCNQ10T 2302 17.8 2265 16.8MID 12 upd(7)mat GRB10 1665 96.0 1322 96.2MID 09 normal control 1 GRB10 3419 48.0 2460 52.1MID 10 normal control 2 GRB10 7959 50.3 6147 49.8MID 04 normal control 3 GRB10 3418 52.7 2746 47.4MID 12 upd(7)mat MEST 8832 97.1 8209 97.2MID 10 normal control 1 MEST 6151 50.6 6066 51.6MID 11 normal control 2 MEST 4627 53.7 4285 56.4MID 13 normal control 3 MEST 9968 49.1 10099 49.8
Table 4: Overview of libraries and analysis results using both amplikyzer and BiQ Analyzer HT.
17
PeerJ PrePrints | https://peerj.com/preprints/122v2/ | v2 received: 29 Nov 2013, published: 29 Nov 2013, doi: 10.7287/peerj.preprints.122v2
PrePrin
ts

A1 A2
501
502
503
504
505
506
507
508
519
5110
5111
5112
5113
5314
5215
methylation rates [%] / ranks of CpGs
indiv
idual re
ads
6151 reads, 15 CpGs, 50.6% methylation
Methylation Analysis: MEST / NC 1
961
972
973
974
975
976
967
978
989
9810
9711
9712
9713
9714
9815
methylation rates [%] / ranks of CpGs
indiv
idual re
ads
8832 reads, 15 CpGs, 97.1% methylation
Methylation Analysis: MEST / upd(7)mat
B1 B2
Figure 2: Methylation analysis of the imprinted MEST locus on human chromosome 7q32 by(A) amplikyzer and (B) BiQ Analyzer HT. In individual methylation plots, each rowcorresponds to an individual read and each column to a CpG. A red rectangle rep-resents a methylated CpG, a blue rectangle an unmethylated CpG. Plots A1 and B1show the methylation status of individual reads of a normal control (NC). The overallaverage methylation is approximately 50%, as expected for an imprinted locus. Thereads can be separated into reads from the methylated maternal allele and reads fromthe unmethylated paternal allele. Plots A2 and B2 show an individual with hyperme-thylation for this locus. This hypermethylation is caused by a maternal uniparentaldisomy for chromosome 7 (upd(7)mat), i.e., the presence of two methylated maternalchromosomes 7 and the absence of an unmethylated paternal copy for chromosome 7.
18
PeerJ PrePrints | https://peerj.com/preprints/122v2/ | v2 received: 29 Nov 2013, published: 29 Nov 2013, doi: 10.7287/peerj.preprints.122v2
PrePrin
ts
451
462
483
484
485
486
487
488
489
4910
4811
4812
4913
4814
4915
4816
4917
4918
4919
4920
4921
average methylation rates [%] / ranks of CpGs
100 97.2 (318)
90 87.1 (483)
80 76.3 (1090)
70 65.8 (792)
60 56.8 (146)
50 45.0 (1098)
40 41.0 (787)
30 29.7 (150)
20 18.1 (601)
10 10.0 (617)
0 2.1 (1029)
92 95 97 98 98 98 97 97 96 99 98 98 97 97 98 98 98 98 99 96 96
82 83 88 89 87 88 88 86 88 89 88 87 87 88 88 86 88 88 88 86 88
72 73 75 75 74 76 76 76 77 77 76 77 78 76 78 76 77 79 79 78 78
62 63 65 65 66 66 66 65 66 67 66 66 66 65 66 65 67 67 67 68 67
55 56 56 58 58 57 54 56 56 59 56 57 55 56 58 58 58 58 59 58 56
42 43 44 45 45 45 45 45 45 45 46 46 46 45 46 44 46 46 46 46 46
39 39 40 40 41 40 41 41 41 41 42 41 42 41 41 41 42 41 41 42 42
27 29 28 29 28 29 29 29 30 29 29 29 33 31 29 30 31 31 31 32 31
17 18 18 18 18 18 19 17 18 18 18 18 18 17 19 18 19 20 17 18 18
10 10 10 10 10 10 10 11 10 10 10 10 10 10 10 10 11 10 11 10 9
2 2 2 2 2 2 2 2 3 2 2 2 2 2 2 2 3 3 2 2 3
11 samples, 21 CpGs
Comparative Analysis: SNRPN
Figure 3: Comparative heatmap of the calibration curve for the SNRPN locus with methylationintervals of 10% obtained by mixing different amounts of an almost completely methy-lated DNA sample from a PWS patient with an almost completely unmethylated DNAsample of an AS patient. The expected percentage of methylation is shown in the up-per part of each lane on the left side of the plot, whereas the obtained percentage ofmethylation is given below followed by the number of reads (in brackets).
19
PeerJ PrePrints | https://peerj.com/preprints/122v2/ | v2 received: 29 Nov 2013, published: 29 Nov 2013, doi: 10.7287/peerj.preprints.122v2
PrePrin
ts

(A) (B)
891
902
913
914
935
936
947
968
959
9610
9511
9412
9613
9614
methylation rates [%] / ranks of CpGs
indiv
idual re
ads
1695 reads, 14 CpGs, 93.4% methylation
Methylation Analysis: H19_CTCF6 / A / NC 1
541
682
413
464
595
296
337
818
859
8810
8611
7012
methylation rates [%] / ranks of CpGs
indiv
idual re
ads
350 reads, 12 CpGs, 61.6% methylation
Methylation Analysis: LAMA3 / A / NC 1
31
42
43
34
15
16
17
28
19
210
311
212
313
314
methylation rates [%] / ranks of CpGs
indiv
idual re
ads
1615 reads, 14 CpGs, 2.4% methylation
Methylation Analysis: H19_CTCF6 / T / NC 1
531
662
383
494
595
286
367
868
899
8710
8411
6412
methylation rates [%] / ranks of CpGsin
div
idual re
ads
319 reads, 12 CpGs, 61.5% methylation
Methylation Analysis: LAMA3 / T / NC 1
471
482
483
484
485
486
497
508
499
5010
5011
4912
5013
5114
methylation rates [%] / ranks of CpGs
indiv
idual re
ads
3319 reads, 14 CpGs, 49.0% methylation
Methylation Analysis: H19_CTCF6 / N / NC 1
531
672
393
474
595
296
357
838
879
8710
8511
6712
methylation rates [%] / ranks of CpGs
indiv
idual re
ads
670 reads, 12 CpGs, 61.6% methylation
Methylation Analysis: LAMA3 / N / NC 1
471
472
483
474
485
486
487
498
489
4910
4811
4812
4913
4914
average methylation rates [%] / ranks of CpGs
NC 1 A93.4 (1695)
NC 1 T2.4 (1615)
NC 2 A94.5 (2510)
NC 2 T2.5 (2402)
89 90 91 91 93 93 94 96 95 96 95 94 96 96
3 4 4 3 1 1 1 2 1 2 3 2 3 3
92 91 93 91 95 96 96 96 95 97 94 95 96 95
4 4 4 3 1 1 1 2 2 2 2 2 2 3
4 samples, 14 CpGs
Comparative Analysis: H19_CTCF6
561
682
453
484
605
296
347
858
889
8810
8911
7012
average methylation rates [%] / ranks of CpGs
NC 1 A61.6 (350)
NC 1 T61.5 (319)
NC 2 A64.8 (410)
NC 2 T65.5 (313)
54 68 41 46 59 29 33 81 85 88 86 70
53 66 38 49 59 28 36 86 89 87 84 64
53 70 48 50 61 30 33 86 91 88 94 73
62 68 53 47 63 29 34 88 88 88 93 73
4 samples, 12 CpGs
Comparative Analysis: LAMA3
Figure 4: Allele separation. (A) Methylation analysis of the imprinted H19-CTCF6 locus withseparation of the parental alleles for a heterozygous normal control (NC1) with an A/Cvariant (rs2071094, A/T after bisulfite modification). The A allele represents the paternalmethylated allele, whereas the T allele represents the unmethylated maternal allele. Acombined plot (allele N) shows the methylation analysis for the same individual withoutseparation. A comparative plot of two NCs (obtained by sorting by MIDs and alleles)clearly shows the distinct methylation patterns of the alleles. (B) Similar methylationanalysis for the non-imprinted LAMA3 locus of a heterogygous normal control (NC)with an A/C variant (rs1711451, A/T after bisulfite modification). Here separation of thealleles shows that both parental alleles have a similar methylation pattern, indicatingthat methylation at this locus is not allele or parent-of-origin specific.
20
PeerJ PrePrints | https://peerj.com/preprints/122v2/ | v2 received: 29 Nov 2013, published: 29 Nov 2013, doi: 10.7287/peerj.preprints.122v2
PrePrin
ts
461
482
473
484
475
476
507
498
499
4810
4811
5112
4713
4814
4515
5016
methylation rates [%] / ranks of CpGs
indiv
idual re
ads
3419 reads, 16 CpGs, 48.0% methylation
Methylation Analysis: GRB10 / NC 1
511
542
523
524
525
526
567
528
529
5310
5311
5612
5213
5314
4915
5516
methylation rates [%] / ranks of CpGs
indiv
idual re
ads
3418 reads, 16 CpGs, 52.7% methylation
Methylation Analysis: GRB10 / NC 2
501
522
503
494
495
496
527
508
509
5110
5011
5312
4913
5014
4715
5216
methylation rates [%] / ranks of CpGs
indiv
idual re
ads
7959 reads, 16 CpGs, 50.3% methylation
Methylation Analysis: GRB10 / NC 3
931
962
983
974
965
986
937
978
989
9410
9811
9512
9613
9514
9315
9916
methylation rates [%] / ranks of CpGs
indiv
idual re
ads
1665 reads, 16 CpGs, 96.0% methylation
Methylation Analysis: GRB10 / upd(7)mat
601
622
623
614
615
616
637
628
629
6110
6211
6412
6113
6214
5915
6416
average methylation rates [%] / ranks of CpGs
upd(7)mat 96.0 (1665)
NC 2 52.7 (3418)
NC 3 50.3 (7959)
NC 1 48.0 (3419)
93 96 98 97 96 98 93 97 98 94 98 95 96 95 93 99
51 54 52 52 52 52 56 52 52 53 53 56 52 53 49 55
50 52 50 49 49 49 52 50 50 51 50 53 49 50 47 52
46 48 47 48 47 47 50 49 49 48 48 51 47 48 45 50
4 samples, 16 CpGs
Comparative Analysis: GRB10
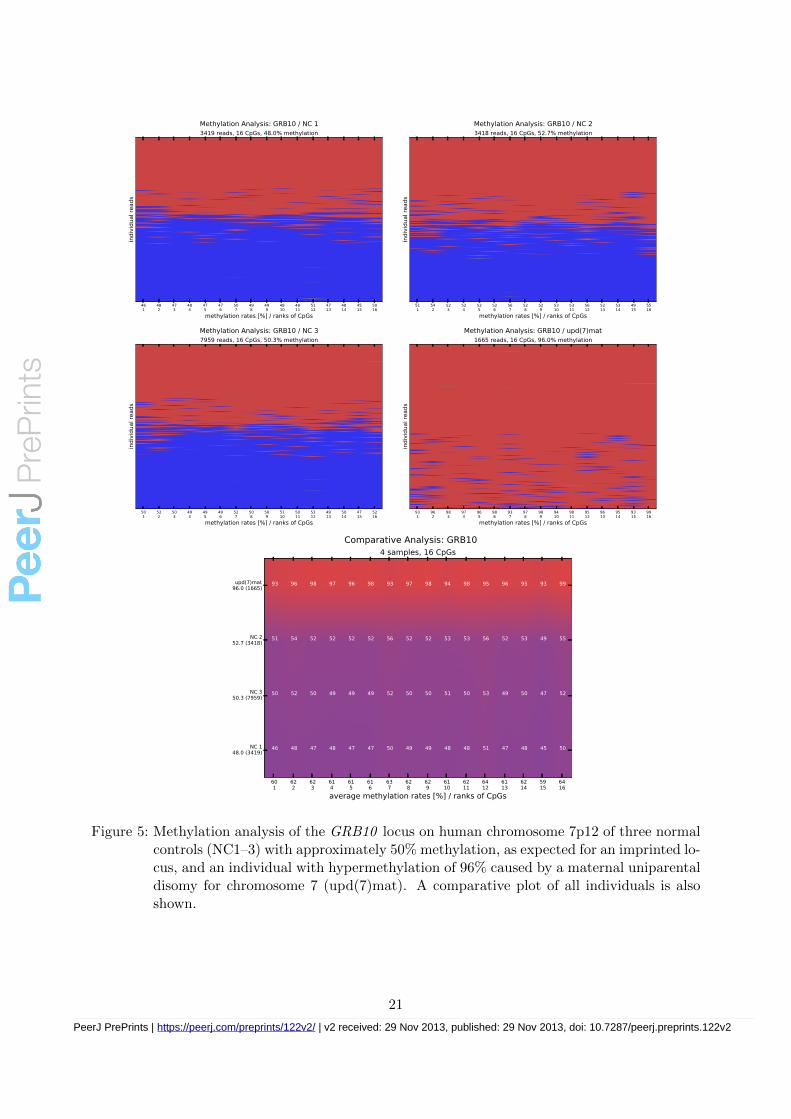
Figure 5: Methylation analysis of the GRB10 locus on human chromosome 7p12 of three normalcontrols (NC1–3) with approximately 50% methylation, as expected for an imprinted lo-cus, and an individual with hypermethylation of 96% caused by a maternal uniparentaldisomy for chromosome 7 (upd(7)mat). A comparative plot of all individuals is alsoshown.
21
PeerJ PrePrints | https://peerj.com/preprints/122v2/ | v2 received: 29 Nov 2013, published: 29 Nov 2013, doi: 10.7287/peerj.preprints.122v2
PrePrin
ts

591
562
573
574
565
576
577
methylation rates [%] / ranks of CpGs
indiv
idual re
ads
3579 reads, 7 CpGs, 57.1% methylation
Methylation Analysis: KCNQ1OT1 / NC 1
641
622
623
644
635
636
647
methylation rates [%] / ranks of CpGs
indiv
idual re
ads
5667 reads, 7 CpGs, 63.3% methylation
Methylation Analysis: KCNQ1OT1 / NC 2
651
632
633
644
635
646
647
methylation rates [%] / ranks of CpGs
indiv
idual re
ads
5180 reads, 7 CpGs, 63.9% methylation
Methylation Analysis: KCNQ1OT1 / NC 3
581
552
553
564
565
576
567
methylation rates [%] / ranks of CpGs
indiv
idual re
ads
5703 reads, 7 CpGs, 56.2% methylation
Methylation Analysis: KCNQ1OT1 / NC 4
191
172
163
184
185
196
177
methylation rates [%] / ranks of CpGs
indiv
idual re
ads
2302 reads, 7 CpGs, 17.8% methylation
Methylation Analysis: KCNQ1OT1 / BWS
531
512
513
524
515
526
527
average methylation rates [%] / ranks of CpGs
NC 3 63.9 (5180)
NC 2 63.3 (5667)
NC 1 57.1 (3579)
NC 4 56.2 (5703)
BWS 17.8 (2302)
65 63 63 64 63 64 64
64 62 62 64 63 63 64
59 56 57 57 56 57 57
58 55 55 56 56 57 56
19 17 16 18 18 19 17
5 samples, 7 CpGs
Comparative Analysis: KCNQ1OT1
Figure 6: Methylation analysis of the KCNQ1OT1 locus on human chromosome 11p15 of fournormal controls (NC1–4) with average methylation rates between 56.2% and 63.9%and a patient with Beckwith-Wiedeman syndrome (BWS). The patient is a somaticmosaic for the methylation defect, meaning that he has normal methylated cells andcells with a methylation defect, resulting in hypomethylation of approximately 20%. Acomparative plot of all individuals, sorted by overall methylation, is also shown.
22
PeerJ PrePrints | https://peerj.com/preprints/122v2/ | v2 received: 29 Nov 2013, published: 29 Nov 2013, doi: 10.7287/peerj.preprints.122v2
PrePrin
ts

491
522
533
464
555
536
527
548
529
5110
5011
methylation rates [%] / ranks of CpGs
indiv
idual re
ads
1137 reads, 11 CpGs, 51.5% methylation
Methylation Analysis: RB1_CpG85 / NC 1
521
522
533
524
545
546
557
558
549
4410
5211
methylation rates [%] / ranks of CpGs
indiv
idual re
ads
783 reads, 11 CpGs, 52.4% methylation
Methylation Analysis: RB1_CpG85 / NC 2
11
12
23
24
75
66
57
48
29
210
111
methylation rates [%] / ranks of CpGs
indiv
idual re
ads
34885 reads, 11 CpGs, 3.0% methylation
Methylation Analysis: RB1_CpG85 / RB1 mat. del.
901
892
973
964
995
966
997
988
809
8410
9411
methylation rates [%] / ranks of CpGs
indiv
idual re
ads
1125 reads, 11 CpGs, 92.9% methylation
Methylation Analysis: RB1_CpG85 / RB1 pat. del.
481
482
513
494
545
526
537
538
479
4510
4911
average methylation rates [%] / ranks of CpGs
RB1 pat. del. 92.9 (1125)
NC 2 52.4 (783)
NC 1 51.5 (1137)
RB1 mat. del. 3.0 (34885)
90 89 97 96 99 96 99 98 80 84 94
52 52 53 52 54 54 55 55 54 44 52
49 52 53 46 55 53 52 54 52 51 50
1 1 2 2 7 6 5 4 2 2 1
4 samples, 11 CpGs
Comparative Analysis: RB1_CpG85
Figure 7: Methylation analysis for the Retinoblastoma 1 (RB1 ) locus at the CpG85 island inintron 2 on human chromosome 13 of two normal controls (NC1, NC2), a patient witha deletion affecting the RB1 gene on the methylated maternal allele (RB1 mat. del.)and a patient with a deletion affecting the unmethylated paternal allele (RB1 pat. del.).A comparative plot of all individuals, sorted by overall methylation, is also shown.
23
PeerJ PrePrints | https://peerj.com/preprints/122v2/ | v2 received: 29 Nov 2013, published: 29 Nov 2013, doi: 10.7287/peerj.preprints.122v2
PrePrin
ts

Results The data set consists of 167 351 sequence reads. The number of sequence reads obtainedfor each MID/ROI combination are shown in Table 4.
A methylation analysis of individual reads, comparing amplikyzer with BiQ Analyzer HT, of animprinted locus (MEST ) for a normal control and a patient with abnormal methylation is shownin Figure 2. While amplikyzer finds and analyzes slightly more reads and has fewer unresolvedCpGs (grey rectangles), the overall numbers and results are comparable between both tools andcorrespond to the expected results.
The results obtained for the calibration curve for the SNRPN locus are shown in Figure 3 asa comparative analysis plot. In contrast to an individual plot, where each row corresponds to asingle reads, each row in a comparative plot corresponds to a sample. In both cases, a columncorresponds to a CpG of the region of interest.
The amplikyzer software allows automatic allele separation when a SNP is defined in thegenomic reference sequence for a ROI, resulting in specific methylation plots for each allele. It isalso possible to get the union over both alleles in a single plot by specifying N for the correspondingSNP. Separation of the parental alleles for the imprinted and differentially methylated H19-CTCF6 and the non-imprinted LAMA3 locus is shown in Figure 4. For a comparative analysisof these loci between several individuals, amplikyzer ’s --sort option allows to sort the samplesexplicitly by specifying the MID order in which they should be plotted from top to bottom. (Bydefault, samples are sorted by average methylation level.)
Individual methylation plots and comparative heatmaps for loci GRB10, KCNQ1OT1, andRB1 -CpG85 are shown in Figures 5, 6 and 7, respectively.
Results for the analysis of all samples investigated are listed in Table 4. We have analysed thedescribed libraries with both amplikyzer and BiQ Analyzer HT. For the latter, the FASTA filegenerated by the sequencer with all sequence reads of the run was separated according to MIDsusing the Geneious software (Biomatters). For methylation analysis we used filter parameterssimilar to the ones used by the amplikyzer with default settings (minimal conversion rate of 0.95;maximal fraction of unrecognized sites of 0.2). A genomic reference sequence in FASTA formatwas loaded for each locus into BiQ Analyzer HT together with the corresponding MID-separatedFASTA files for each sample. The results of the methylation analyses obtained by amplikyzerand BiQ Analyzer HT showed only slight variation but no significant differences with regard tothe average overall methylation and the number of reads for almost all loci (Table 4; see Figure 2for a detailed example).
6 Discussion and Conclusion
In comparison to existing software, amplikyzer obtains similar results where applicable, butoffers both more convenience and more analysis capabilities. It is more convenient, becauseamplikyzer generates all plots directly from the SFF file, whereas for BiQ Analyzer HT, theFASTA file generated by the sequencer has to be separated according to MIDs using third-party software. Amplikyzer ’s unique analysis capabilities consist of automatic allele separation(or combination) and its extensive sorting options for comparative plots (according to a givenorder of MIDs and/or alleles). Amplikyzer is driven by configuration files and command lineoptions that can be prepared before the analysis is started instead, and it does not requireinteraction during the analysis. This makes amplikyzer usable within larger automated pipelines.For convenience, a basic graphical user interface to enter command line parameters interactivelyis provided (Figure 8).
Methodologically, amplikyzer is the only tool based on flowgrams instead of base-called FASTA
24
PeerJ PrePrints | https://peerj.com/preprints/122v2/ | v2 received: 29 Nov 2013, published: 29 Nov 2013, doi: 10.7287/peerj.preprints.122v2
PrePrin
ts

Figure 8: Part of the graphical user interface (GUI) of amplikyzer, showing the options for methy-lation analysis.
files. In the current version, a hybrid sequence representation is used for efficiency reasons. Atthe moment, this seems necessary during the mapping phase for quick MID and ROI identifica-tion. During alignment, however, we would like to switch to the pure flowgram-string alignmentalgorithm introduced by Martin and Rahmann (2013) in the future. However, this requires sev-eral speed-ups and implementation tricks; and initial tests do not indicate that the resultingalignments would be significantly different or better.
In summary, amplikyzer is a versatile and powerful tool for methylation analysis of deepbisulfite-sequenced amplicons. It can be obtained, together with the example dataset, fromhttps://bitbucket.org/svenrahmann/amplikyzer/downloads.
Acknowledgements
We thank Katrin Rademacher and Nicholas Wagner for improving the bisulfite filter settings andJohanna Christina Czeschik for her helpful critical comments on the manuscript.
References
S. Berland, M. Appelback, O. Bruland, J. Beygo, K. Buiting, D. J. Mackay, I. K. Temple, andG. Houge. Evidence for anticipation in Beckwith-Wiedemann syndrome. Eur. J. Hum. Genet.,2013. epub ahead of print.
J. Beygo, O. Ammerpohl, D. Gritzan, M. Heitmann, K. Rademacher, J. Richter, A. Caliebe,
25
PeerJ PrePrints | https://peerj.com/preprints/122v2/ | v2 received: 29 Nov 2013, published: 29 Nov 2013, doi: 10.7287/peerj.preprints.122v2
PrePrin
ts

R. Siebert, B. Horsthemke, and K. Buiting. Deep bisulfite sequencing of aberrantly methylatedloci in a patient with multiple methylation defects. PLoS ONE, 8(10):e76953, 2013a.
J. Beygo, V. Citro, A. Sparago, A. De Crescenzo, F. Cerrato, M. Heitmann, K. Rademacher,A. Guala, T. Enklaar, C. Anichini, M. Cirillo Silengo, N. Graf, D. Prawitt, M. V. Cubellis,B. Horsthemke, K. Buiting, and A. Riccio. The molecular function and clinical phenotype ofpartial deletions of the IGF2/H19 imprinting control region depends on the spatial arrangementof the remaining ctcf binding sites. Human Molecular Genetics, 22(3):544–557, 2013b.
C. Bock, S. Reither, T. Mikeska, M. Paulsen, J. Walter, and T. Lengauer. BiQ Analyzer: visual-ization and quality control for DNA methylation data from bisulfite sequencing. Bioinformatics,21:4067–4068, 2005.
P. Ferragina and G. Manzini. Opportunistic data structures with applications. In Proceedingsof the 41st Annual Symposium on Foundations of Computer Science (FOCS), pages 390–398,2000.
J. Koster and S. Rahmann. Snakemake: a scalable bioinformatics workflow engine. Bioinformat-ics, 28(19):2520–2522, 2012.
F. Krueger and S. R. Andrews. Bismark: a flexible aligner and methylation caller for bisulfite-seqapplications. Bioinformatics, 27(11):1571–1572, 2011.
B. Langmead and S. Salzberg. Fast gapped-read alignment with Bowtie 2. Nature Methods, 9:357–359, 2012.
M. Larkin, G. Blackshields, N. Brown, R. Chenna, P. McGettigan, H. McWilliam, F. Valentin,I. Wallace, A. Wilm, R. Lopez, J. Thompson, T. Gibson, and D. Higgins. Clustal W andClustal X version 2.0. Bioinformatics, 23(21):2947–2948, 2007.
H. Li and R. Durbin. Fast and accurate short read alignment with Burrows-Wheeler transform.Bioinformatics, 25(14):1754–1760, July 2009.
P. Lutsik, L. Feuerbach, J. Arand, T. Lengauer, J. Walter, and C. Bock. BiQ Analyzer HT:locus-specific analysis of DNA methylation by high-throughput bisulfite sequencing. NucleicAcids Research, 39(suppl 2):W551–W556, 2011.
F. Lysholm, B. Andersson, and B. Persson. FAAST: Flow-space assisted alignment search tool.BMC Bioinformatics, 12:293, 2011.
M. Martin and S. Rahmann. Aligning flowgrams to DNA sequences. In Proceedings of theGerman Conference on Bioinformatics (GCB) 2013. Schloss Dagstuhl – Leibniz-Zentrum furInformatik, 2013. In press.
B. Pedersen, T.-F. Hsieh, C. Ibarra, and R. L. Fischer. MethylCoder: software pipeline forbisulfite-treated sequences. Bioinformatics, 27(17):2435–2436, 2011.
S. Rahmann. Fast and sensitive probe selection for DNA chips using jumps in matching statistics.In Proceedings of the 2nd IEEE Computer Society Bioinformatics Conference (CSB 2003),pages 57–64. IEEE, 2003.
C. Rohde, Y. Zhang, T. P. Jurkowski, H. Stamerjohanns, R. Reinhardt, and A. Jeltsch. Bisul-fite sequencing data presentation and compilation (BDPC) web server–a useful tool for DNAmethylation analysis. Nucleic Acids Research, 36(5):e34, 2008.
26
PeerJ PrePrints | https://peerj.com/preprints/122v2/ | v2 received: 29 Nov 2013, published: 29 Nov 2013, doi: 10.7287/peerj.preprints.122v2
PrePrin
ts

C. Rohde, Y. Zhang, R. Reinhardt, and A. Jeltsch. BISMA – fast and accurate bisulfite sequencingdata analysis of individual clones from unique and repetitive sequences. BMC Bioinformatics,11(1):230, 2010. ISSN 1471-2105.
K. H. Taylor, R. S. Kramer, J. W. Davis, J. Guo, D. J. Duff, D. Xu, C. W. Caldwell, andH. Shi. Ultradeep bisulfite sequencing analysis of DNA methylation patterns in multiple genepromoters by 454 sequencing. Cancer Research, 67(18):8511–8518, 2007.
V. Vacic, H. Jin, J.-K. Zhu, and S. Lonardi. A probabilistic method for small RNA flowgrammatching. Pacific Symposium on Biocomputing, pages 75–86, 2008.
M. Zeschnigk, M. Martin, G. Betzl, A. Kalbe, C. Sirsch, K. Buiting, S. Gross, E. Fritzilas,B. Frey, S. Rahmann, and B. Horsthemke. Massive parallel bisulfite sequencing of CG-richDNA fragments reveals that methylation of many X-chromosomal CpG islands in female bloodDNA is incomplete. Human Molecular Genetics, 18(8):1439–1448, 2009.
27
PeerJ PrePrints | https://peerj.com/preprints/122v2/ | v2 received: 29 Nov 2013, published: 29 Nov 2013, doi: 10.7287/peerj.preprints.122v2
PrePrin
ts