AMI network 1 Entropy-based electricity theft detection in ... · IET Cyber-Physical Systems:...
7
IET Cyber-Physical Systems: Theory & Applications Research Article Entropy-based electricity theft detection in AMI network ISSN 2398-3396 Received on 12th May 2017 Revised 20th July 2017 Accepted on 23rd August 2017 doi: 10.1049/iet-cps.2017.0063 www.ietdl.org Sandeep Kumar Singh 1 , Ranjan Bose 1 , Anupam Joshi 2 1 Department of Electrical Engineering, Indian Institute of Technology Delhi, New Delhi 110 016, India 2 Department of Computer Science and Electrical Engineering, University of Maryland, Baltimore County, Baltimore, MD 21250, USA E-mail: [email protected] Abstract: Advanced metering infrastructure (AMI), one of the prime components of the smart grid, has many benefits like demand response and load management. Electricity theft, a key concern in AMI security since smart meters used in AMI are vulnerable to cyber attacks, causes millions of dollar in financial losses to utilities every year. In light of this problem, the authors propose an entropy-based electricity theft detection scheme to detect electricity theft by tracking the dynamics of consumption variations of the consumers. Relative entropy is used to compute the distance between probability distributions obtained from consumption variations. When electricity theft attacks are launched against AMI, the probability distribution of consumption variations deviates from historical consumption, thus leading to a larger relative entropy. The proposed method is tested on different attack scenarios using real smart-meter data. The results show that the proposed method detects electricity theft attacks with high detection probability. 1 Introduction The power grid has become an essential part in the present-day society. People's day-to-day life will be affected dramatically without a reliable and stable power grid [1]. Six hundred million people (about 9% of world population) have been affected in July 2012, Indian Blackout and 20 of India's 29 states were hit by power cut [2, 3]. Traditional electric grid is not suitable for today's power requirements [4]. Nowadays, nations have been modernising their existing power system into smart grid due to the evolution of information system and communication technology. Some important features of smart grid are two-way energy transmission and data communication, high reliability, improved efficiency, real- time demand response, and security. Within smart grid, one of the prime technologies being used currently is the advanced metering infrastructure (AMI). AMI is an integration of multiple technologies such as smart metering, home area networks, integrated communications, data management applications, and standardise software interface. AMI gives consumers the information they need to make intelligent decisions, the ability to execute those decisions, and a variety of choices leading to substantial benefits that they do not currently enjoy [5]. In AMI, system operators are able to greatly improve consumer services by refining utility operating and asset management process based on AMI data. AMI offers an essential link between the grid, consumers, and their loads, and generation and storage resources. In AMI, there is no need to send a person to read electricity consumption readings on site and consumers can also monitor energy consumption remotely and do some customised control. AMI has the ability to send information to consumers about their energy use and dynamic electricity pricing. In AMI, electricity metering system has been modernised by replacing the mechanical meters by smart meters. AMI provides benefit to both consumers and utilities. Consumer benefits include more choices about price and service, and more information to manage consumption, cost, and other decisions. AMI provides benefit to utility in billing and operations. Smart meters are low-cost computer intelligence devices that have limited resources and several years operational lifetime. The smart meters would have some minimum basic features such as measurement of electrical energy parameters, bidirectional communication, tamper event detection, recording and reporting, integrated load limiting switch/relay, power event alarms such as loss of supply, low/high voltage, remote firmware upgrade, net metering features, and on demand reading. While some security mechanism has been developed for cyber threats in smart meters, they are not sufficient to prevent attacks [6, 7]. Strong security mechanism cannot be implemented in these devices due to resource limitations. The cost of meters may increase due to the addition of extra hardware to implement strong security mechanism. Among all the cyber attacks in AMI, the study of electricity theft is important in both developed and developing countries. Commercial loss due to electricity theft in US was about $6 billion/year [8]. Electricity theft in India causes $17 billion/year revenue loss [9]. A world bank report highlights that the amount of electricity involved in non-technical losses are ∼50% in developing countries [10]. A good electricity theft detection system in modern smart grid is needed to detect electricity theft attacks efficiently. Traditionally, electricity theft has been detected by physically checking tamper-evident seals, but adversary can easily defeat tamper-evident seal. In AMI, high-resolution meter data is collected and this data can be used in electricity theft detection. Electricity consumption data of smart meter is sent to a control centre at predefined small time intervals. One key feature of AMI is that the transferred data is highly predictable. It is easy to find out the statistical properties for each consumer's consumption pattern. Predictability of AMI data makes this system different from traditional information technology system. Different electricity theft detection schemes have been proposed in literature. These detection schemes are broadly categorised into three classes: (i) state, (ii) game theory, and (iii) classification based. In state-based methods, Lo and Ansari [11] proposed a CONSUMER attack model to improve network observability and detection accuracy by grid sensor placement algorithm. McLaughlin et al. [12] propose AMI intrusion detection system that uses information fusion to combine the sensors and consumption data from a smart meter for more accurate energy theft detection. In [13], a mutual inspection strategy is proposed to discover problematic meters that report malicious consumption readings. Khoo and Cheng [14] propose a system that implements RFID technology to prevent electricity theft. In all of the above state-based detection methods, certain devices, like radio- frequency identification tags and wireless sensors are used for higher detection probability at a cost of extra investment. Game theory-based methods are also discussed in literature for electricity theft detection. Amin et al. [15] address incentives of IET Cyber-Phys. Syst., Theory Appl. This is an open access article published by the IET under the Creative Commons Attribution -NonCommercial License (http://creativecommons.org/licenses/by-nc/3.0/) 1
Transcript of AMI network 1 Entropy-based electricity theft detection in ... · IET Cyber-Physical Systems:...
IET Cyber-Physical Systems: Theory & Applications
Research Article
Entropy-based electricity theft detection inAMI network
ISSN 2398-3396Received on 12th May 2017Revised 20th July 2017Accepted on 23rd August 2017doi: 10.1049/iet-cps.2017.0063www.ietdl.org
Sandeep Kumar Singh1 , Ranjan Bose1, Anupam Joshi21Department of Electrical Engineering, Indian Institute of Technology Delhi, New Delhi 110 016, India2Department of Computer Science and Electrical Engineering, University of Maryland, Baltimore County, Baltimore, MD 21250, USA
E-mail: [email protected]
Abstract: Advanced metering infrastructure (AMI), one of the prime components of the smart grid, has many benefits likedemand response and load management. Electricity theft, a key concern in AMI security since smart meters used in AMI arevulnerable to cyber attacks, causes millions of dollar in financial losses to utilities every year. In light of this problem, the authorspropose an entropy-based electricity theft detection scheme to detect electricity theft by tracking the dynamics of consumptionvariations of the consumers. Relative entropy is used to compute the distance between probability distributions obtained fromconsumption variations. When electricity theft attacks are launched against AMI, the probability distribution of consumptionvariations deviates from historical consumption, thus leading to a larger relative entropy. The proposed method is tested ondifferent attack scenarios using real smart-meter data. The results show that the proposed method detects electricity theftattacks with high detection probability.
1 IntroductionThe power grid has become an essential part in the present-daysociety. People's day-to-day life will be affected dramaticallywithout a reliable and stable power grid [1]. Six hundred millionpeople (about 9% of world population) have been affected in July2012, Indian Blackout and 20 of India's 29 states were hit by powercut [2, 3]. Traditional electric grid is not suitable for today's powerrequirements [4]. Nowadays, nations have been modernising theirexisting power system into smart grid due to the evolution ofinformation system and communication technology. Someimportant features of smart grid are two-way energy transmissionand data communication, high reliability, improved efficiency, real-time demand response, and security. Within smart grid, one of theprime technologies being used currently is the advanced meteringinfrastructure (AMI).
AMI is an integration of multiple technologies such as smartmetering, home area networks, integrated communications, datamanagement applications, and standardise software interface. AMIgives consumers the information they need to make intelligentdecisions, the ability to execute those decisions, and a variety ofchoices leading to substantial benefits that they do not currentlyenjoy [5]. In AMI, system operators are able to greatly improveconsumer services by refining utility operating and assetmanagement process based on AMI data. AMI offers an essentiallink between the grid, consumers, and their loads, and generationand storage resources. In AMI, there is no need to send a person toread electricity consumption readings on site and consumers canalso monitor energy consumption remotely and do somecustomised control. AMI has the ability to send information toconsumers about their energy use and dynamic electricity pricing.In AMI, electricity metering system has been modernised byreplacing the mechanical meters by smart meters. AMI providesbenefit to both consumers and utilities. Consumer benefits includemore choices about price and service, and more information tomanage consumption, cost, and other decisions. AMI providesbenefit to utility in billing and operations.
Smart meters are low-cost computer intelligence devices thathave limited resources and several years operational lifetime. Thesmart meters would have some minimum basic features such asmeasurement of electrical energy parameters, bidirectionalcommunication, tamper event detection, recording and reporting,integrated load limiting switch/relay, power event alarms such as
loss of supply, low/high voltage, remote firmware upgrade, netmetering features, and on demand reading. While some securitymechanism has been developed for cyber threats in smart meters,they are not sufficient to prevent attacks [6, 7]. Strong securitymechanism cannot be implemented in these devices due to resourcelimitations. The cost of meters may increase due to the addition ofextra hardware to implement strong security mechanism. Amongall the cyber attacks in AMI, the study of electricity theft isimportant in both developed and developing countries. Commercialloss due to electricity theft in US was about $6 billion/year [8].Electricity theft in India causes $17 billion/year revenue loss [9]. Aworld bank report highlights that the amount of electricity involvedin non-technical losses are ∼50% in developing countries [10]. Agood electricity theft detection system in modern smart grid isneeded to detect electricity theft attacks efficiently.
Traditionally, electricity theft has been detected by physicallychecking tamper-evident seals, but adversary can easily defeattamper-evident seal. In AMI, high-resolution meter data iscollected and this data can be used in electricity theft detection.Electricity consumption data of smart meter is sent to a controlcentre at predefined small time intervals. One key feature of AMIis that the transferred data is highly predictable. It is easy to findout the statistical properties for each consumer's consumptionpattern. Predictability of AMI data makes this system differentfrom traditional information technology system.
Different electricity theft detection schemes have been proposedin literature. These detection schemes are broadly categorised intothree classes: (i) state, (ii) game theory, and (iii) classificationbased. In state-based methods, Lo and Ansari [11] proposed aCONSUMER attack model to improve network observability anddetection accuracy by grid sensor placement algorithm.McLaughlin et al. [12] propose AMI intrusion detection systemthat uses information fusion to combine the sensors andconsumption data from a smart meter for more accurate energytheft detection. In [13], a mutual inspection strategy is proposed todiscover problematic meters that report malicious consumptionreadings. Khoo and Cheng [14] propose a system that implementsRFID technology to prevent electricity theft. In all of the abovestate-based detection methods, certain devices, like radio-frequency identification tags and wireless sensors are used forhigher detection probability at a cost of extra investment.
Game theory-based methods are also discussed in literature forelectricity theft detection. Amin et al. [15] address incentives of
IET Cyber-Phys. Syst., Theory Appl.This is an open access article published by the IET under the Creative Commons Attribution -NonCommercial License(http://creativecommons.org/licenses/by-nc/3.0/)
1

utility company to combat non-technical losses, when company issubject to tariff regulation. They proposed that regulators shouldincorporate explicit targets for permissible losses to solve theproblem of incentive misalignment. In [16], the problem ofelectricity theft detection is discussed as a game between theelectricity thief and the electricity utility. Yet, in game theory-basedmethods, formulation of utility function for all the players is achallenging task.
Different classification-based methods have also been studied inliterature. Machine learning schemes are used to train a classifierusing sample database. Abnormal patterns are recognised by atrained classifier. In [17], C-means-based fuzzy clusteringalgorithm is proposed to detect defect measurement. Salinas et al.[18] propose distributed algorithms to solve linear equations forusers’ honesty coefficients. Authors utilise peer-to-peer computingto identify the dishonest consumers in the system. In [19], a neuralnetwork model is implemented and an encoding technique isproposed to identify malicious users. Depuru et al. [20] discuss theproblems underlying detection of electricity theft using supportvector machine (SVM). Jokar et al. [21] present consumptionpattern-based theft detection scheme using multi-class SVM. In[22], tree-based threat model is presented to explain the energytheft in AMI. Mashima and Cárdenas [23] present threat model todetect energy theft and use real data from an AMI system tovalidate proposed method. There are many limitations ofclassification-based methods. Primary issue with these methods isdata imbalance. Due to this, the benign and malicious samples arenot in the same range. Benign samples are obtained from historicaldataset but malicious samples (theft samples) hardly exist for aspecific customer. Unavailability of dataset of malicious sampleslimits the detection rate (DR). Second, these schemes arevulnerable to contamination attacks. Adversary may granularlychange data and pollute the dataset and it results to deceive thelearning process to consider a malicious data as a normal data.There are many non-malicious reasons that can alter electricityconsumption such as change of appliances, change of season,change of residents, and so on. These factors result to high falsepositive rate (FPR).
In this paper, we propose an entropy-based electricity theftdetector (EBETD) to detect electricity theft in AMI. The main ideaof the proposed scheme is to track the electricity consumptiondynamics by computing the distance indices between adjoiningtime steps. Relative entropy (Kullback–Leibler distance) [24] isused to compute distance indices. The relative entropy is a measureof the distance between two probability distributions. In this paper,we show that if the relative entropy is more than the thresholdvalue, there is a high probability of electricity theft attack againstthe AMI. The threshold value is decided on the basis of historicalelectricity consumption measurements. We test the performance ofEBETD with real data of 5000 consumers [25]. The proposedEBETD method detects electricity theft attack with highprobability of detection as compared to previously reported results.
The rest of the paper is organised as follows. In Section 2, wediscuss network model and threat model. Section 3 presentsproposed methodology to detect electricity theft attacks. Case studyis given in Section 4. Section 5 presents results and discussion.Section 6 concludes this paper.
2 Network model and threat model2.1 Network model
Fig. 1 shows the network model for AMI. We consider N smartmeters, each meter conveying its consumption readings to a controlcentre. Control centre sends the final aggregate data to externalentities such as a third-party service providers or grid managers.Control centre is responsible to check whether the measurementscoming from the meters is benign or malicious. Therefore, allsecurity measures are taken at the control centre.
2.2 Threat model
The goal of the adversary is to launch electricity theft attack bycompromising smart meters and sending malicious readings to thecontrol centre. The objective of electricity theft is to get financialbenefit by paying less than the actual value for the consumedelectricity. There are different techniques for electricity theft thatan adversary may attempt against AMI. Electricity theft techniques[12] are classified into three categories: (i) physical attacks, (ii)cyber attacks, and (iii) data attacks. Attack in the third category ismade possible through categories first and second. The above-mentioned attacks are discussed briefly below:
(i) Physical attacks: Meter tampering is one type of physical attackto hinder actual recording of electricity consumption. This may bedone by a strong magnet to cause interference with the instruments.Reversing or disconnecting the meters, bypassing the meters toremove loads from measurements are some other type of physicalattacks.(ii) Cyber attacks: Examples of cyber attacks includecompromising smart meters through remote network exploits,modifying the firmware or storage on meters, interceptingcommunications, and interrupting measurements. Cyber attackscan be carried out within the meter or over the communication linkbetween the meter and the utility company.(iii) Data attacks: Data attacks include targeting the electricityconsumption readings and are done through cyber attacks andphysical attacks.
Electricity theft techniques mentioned above are discussed indetail in [12]. Electricity consumers are primary attackers to carryout electricity thefts. The second type of attackers are professionalhackers who use software and hardware gadgets to compromisemeters. The third type of attackers is utility company insiders.
AMI systems transfer electricity consumption data to the utilityat small time intervals (every 30 min or less). This time intervalmay change between distinct AMI deployments. This granularelectricity consumption data can be used to improve theft detectionmechanism of the system. The metering data is a time seriesx1, x2, …, where xi is the electricity consumption of the consumerfrom time interval between measurement xi − 1 to xi. A malicioustime series y^1, y^2, …, is generated by the adversary. The objectivefor the adversary is to generate a time series y^i that will reduce itselectricity bill subject to the constraint that the control centre willnot raise a flag with y^i.
3 Proposed methodologyThe proposed method detects electricity theft attacks by trackingthe dynamics of the consumption data. Relative entropy is used toquantify the consumption variation.
3.1 Relative entropy
It is the expectation of the logarithmic of the likelihood ratio. Letp(x) and q(x) be two probability mass functions of a discreterandom variable x, then relative entropy is a measure of thedistance between two probability mass functions. For any x in X,p(x) > 0 and q(x) > 0 and both p(x) and q(x) sum up to 1. Therelative entropy [24] (also called Kullback–Leibler distance)between two probability mass functions is defined as
Fig. 1 Network model
2 IET Cyber-Phys. Syst., Theory Appl.This is an open access article published by the IET under the Creative Commons Attribution -NonCommercial License
(http://creativecommons.org/licenses/by-nc/3.0/)
D(p ∥ q) = ∑x
p(x)ln p(x)q(x)
= Epln p(x)q(x)
(1)
In the above definition, we use the convention that 0log(0/0) = 0,0log(0/q) = 0, and plog(p/0) = ∞. The Kullback–Leiblerdistance, or simply, the KL distance, of q(x) from p(x) is a measureof the information lost when q(x) is used to approximate p(x). Therelative entropy is always non-negative, D(p ∥ q) ≥ 0, and havingzero value if and only if p = q. It does not obey triangle inequalityand is not symmetric, D(p ∥ q) ≥ 0 is not equal to D(q ∥ p).
The concept of relative entropy was developed in informationtheory. It has been commonly used in the data mining literature. Inthis paper, we use the relative entropy to detect electricity theft inAMI.
The adversary sends malicious electricity consumption readingsto the control centre by compromising any individual smart meterwith the objective to reduce the electricity bill. The proposedmethod detects electricity theft attacks using dynamics ofelectricity consumption data. To quantify electricity consumptionvariation, the relative entropy D(p ∥ q) is used where q representsthe distribution of electricity consumption variation from thehistorical data and p represents the distribution of electricityconsumption variation for current and previous time step.
When there is no electricity theft attack against the AMI, therelative entropy D(p ∥ q) would be relatively small. Whencompromised data is sent to the AMI, the relative entropy D(p ∥ q)will increase. Relative entropy D(p ∥ q) for the current time step iscompared with predefined threshold value which is determined byrelative entropy calculated from historical electricity consumptionvariation, and if the relative entropy is more than predefinedthreshold value, control centre concludes that attack has beenlaunched by adversary. An appropriate action is taken whenelectricity theft attack is detected by the control centre.
4 Case studyIn our test, we have used smart-meter electricity consumption datafrom the Irish Social Science Data Archive [25]. The commissionfor energy regulation, Ireland (CER) and Sustainable EnergyAuthority of Ireland (SEAI) initiated the smart-metering projectwith the purpose of undertaking trials to assess the performance ofsmart meters and their impact on consumers energy consumption.The smart-metering electricity customer behaviour trials took placeduring 2009 and 2010 with over 5000 Irish homes and businessesparticipating. Residential and business customers, who participatedin the trials had an electricity smart meter installed in their homes/premises and agreed to take part in research to help in establishinghow smart metering can help in shaping energy usage behavioursacross a different type of home sizes, lifestyles, and demographics[25].
In this database, there is a file for each consumer containinghalf hourly metering data over a period of 535 days. Each file foreach consumer consists of 535 vectors and each vector having 48components. For a benign dataset, sample vector x includes
[x1, x2, …, x48] components. For every 30 min time step, the metersends consumption reading (in Watt) to the control centre.
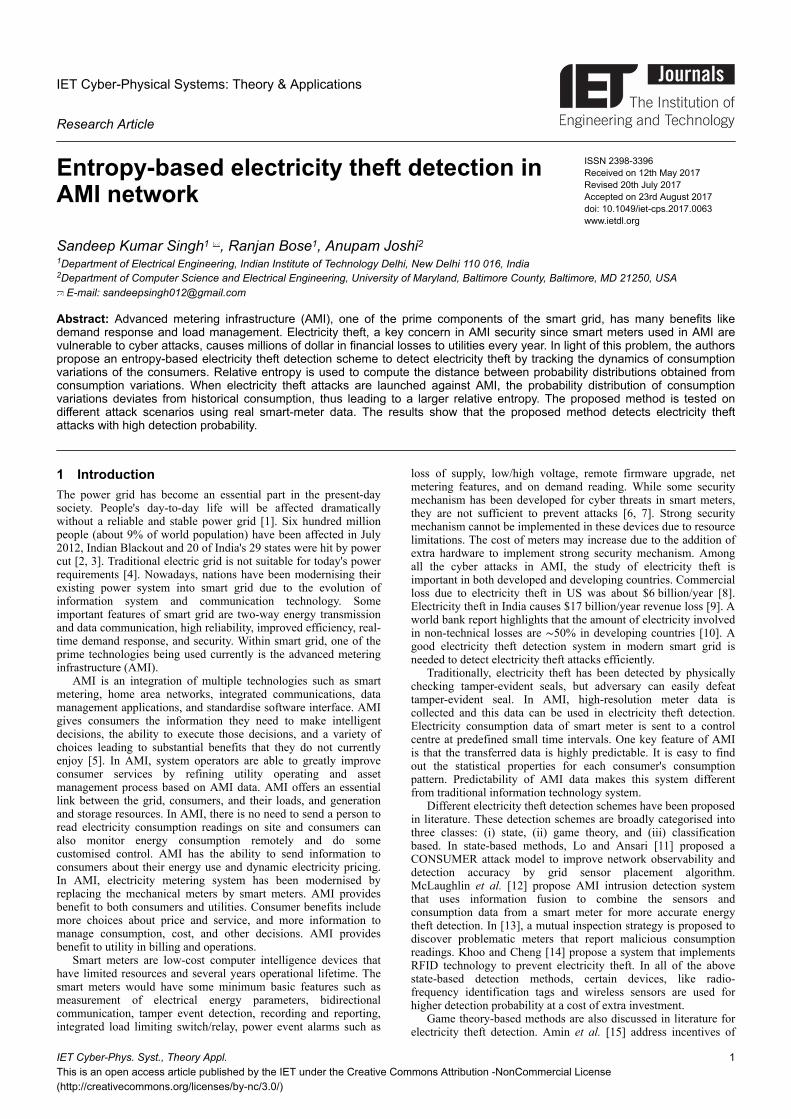
In the proposed method, we consider the difference betweentwo consecutive measurements. The measurement sent to thecontrol centre by smart meter at time i is xi. The measurementvariation is determined as (xi − xi − 1). In case study, we consider N = 1000 (number of smart meters). Histogram of measurementvariation of N meters from July 2009 to July 2010 is shown inFig. 2a. This historical measurement variation data includes allconsecutive measurement variations of N meters. From Fig. 2a, itis clear that majority of measurement variations are small and closeto zero.
When there are no electricity theft attacks, probabilisticdistributions of electricity consumption readings are quite similarbetween different months. Fig. 2b shows the histogram ofmeasurement variation of N meters for August 2010 with noelectricity theft attacks. When there is an electricity theft attackagainst AMI, the histogram of consumption variation is different.The mean and standard deviation of measurement variations hasbeen changed due to attacks. When the adversary launcheselectricity theft attack, malicious measurement y^i is send to controlcentre at time i. Histogram of measurement variation (y^i − xi − 1) ofN meters for September 2010 is shown in Fig. 2c.
4.1 Relative entropy-based detection
In our proposed method, we use relative entropy D(p ∥ q) toquantify the dissimilarity between two distributions. Distribution qis found out from the histogram of the historical data of electricityconsumption variations from July 2009 to July 2010 as shown inFig. 2a. We make an assumption that the historical dataset isbenign. The consumption data of the month of August 2010 isconsidered to be true and the threshold value is computed usingthis data. We have taken electricity theft attacks at each time step(every 30 min time interval) for September 2010. To calculaterelative entropy, distribution p is derived from Figs. 2b and c whichis the histogram of measurement variation for August andSeptember 2010, respectively. Relative entropy D(p ∥ q) iscomputed based on (1).
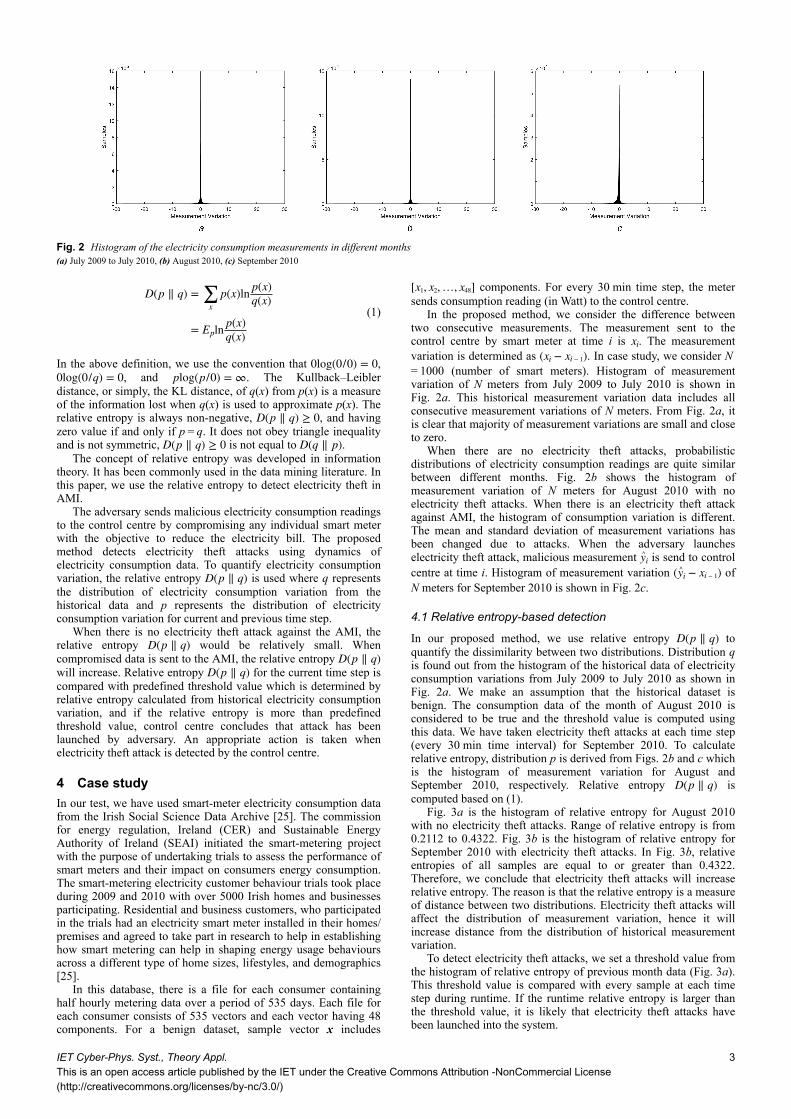
Fig. 3a is the histogram of relative entropy for August 2010with no electricity theft attacks. Range of relative entropy is from0.2112 to 0.4322. Fig. 3b is the histogram of relative entropy forSeptember 2010 with electricity theft attacks. In Fig. 3b, relativeentropies of all samples are equal to or greater than 0.4322.Therefore, we conclude that electricity theft attacks will increaserelative entropy. The reason is that the relative entropy is a measureof distance between two distributions. Electricity theft attacks willaffect the distribution of measurement variation, hence it willincrease distance from the distribution of historical measurementvariation.
To detect electricity theft attacks, we set a threshold value fromthe histogram of relative entropy of previous month data (Fig. 3a).This threshold value is compared with every sample at each timestep during runtime. If the runtime relative entropy is larger thanthe threshold value, it is likely that electricity theft attacks havebeen launched into the system.
Fig. 2 Histogram of the electricity consumption measurements in different months(a) July 2009 to July 2010, (b) August 2010, (c) September 2010
IET Cyber-Phys. Syst., Theory Appl.This is an open access article published by the IET under the Creative Commons Attribution -NonCommercial License(http://creativecommons.org/licenses/by-nc/3.0/)
3
Choosing a proper threshold value is a key issue in the proposedmethod and the detection accuracy depends on this. If we set highthreshold value, some electricity theft attacks are not detectable.When the threshold value is set to low, some benign consumptionreadings may be categorised as malicious readings. In [26],threshold value is set using historical measurement to detect falsedata injection attack in AC state estimation. Similarly, in ourproposed method, the threshold value is set on the basis of thehistogram of historical electricity consumption. The measurementsamples of one month prior to the attack (August 2010) arecompared with the historical dataset to obtain the threshold value.Relative entropy at each time step is obtained from (1), andhistogram of relative entropy is plotted (Fig. 3a). We selectmaximum histogram distance of relative entropy D(p ∥ q) withcertain trust level as threshold value where q is derived fromFig. 2a and p is derived from Fig. 2b. For example, the 99% trustlevel means that threshold value is larger than 99% of the historicalconsumption readings.
5 Results and discussionAll the simulations have been done on DELL PC with 3.20 GHzIntel Core i7 processor and 8 GB RAM on Windows 8 Enterprise.Programming has been done on MATLAB R2014b. To check thedetection efficiency of our proposed scheme, we used differenttype of malicious samples. Xl = [xl, x2, …, x48] andY^
l = [y^l, y^2, …, y^48] are true and malicious consumption datapatterns of lth day for any typical smart meter. Different type ofattacks [12, 18, 21, 27] for electricity theft are as follows:
i. Attack 1 (A1): In this case, the attacked sample is
Y^l = X24 − (l − 1) (2)
In this attack, adversary reverses the order of consumptiondata of last day and sends it to control centre.
ii. Attack 2 (A2): In the second case, the attacked sample is
Y^l = mean(Xl − 1) (3)
Here, adversary sends the mean value of previous day tocontrol centre. Attacks A1 and A2 are useful in a scenariowhere dynamic electricity pricing is used. Utility companymay charge high electricity price for peak electricityconsumption hours. Total electricity consumption is same inattacks A1 and A2 but consumer can get financial profit.
iii. Attack 3 (A3): In the third case, the attacked sample is
Y^l = αl mean(Xl − 1) (4)
where αl = [αl1, α12, …, αl48] and αli = random( mini , maxi ). Inthis case, mean value of the previous day's consumption ismultiplied by αl and sent to the control centre.
iv. Attack 4 (A4): In the fourth case, the attacked sample is
Y^l = αlXl (5)
where αl = [αl1, α12, …, αl48] and αli = random( mini , maxi ). Inthis attack, all consumption readings for a particular day aremultiplied by different randomly selected numbers between( mini , maxi ).
v. Attack 5 (A5): In the fifth case, the attacked sample is
Y^l = αXl (6)
where α = random( min , max ). In this attack, all samples fora particular day are multiplied by the same random number.( min , max ) are used to define the amount of electricity theft.
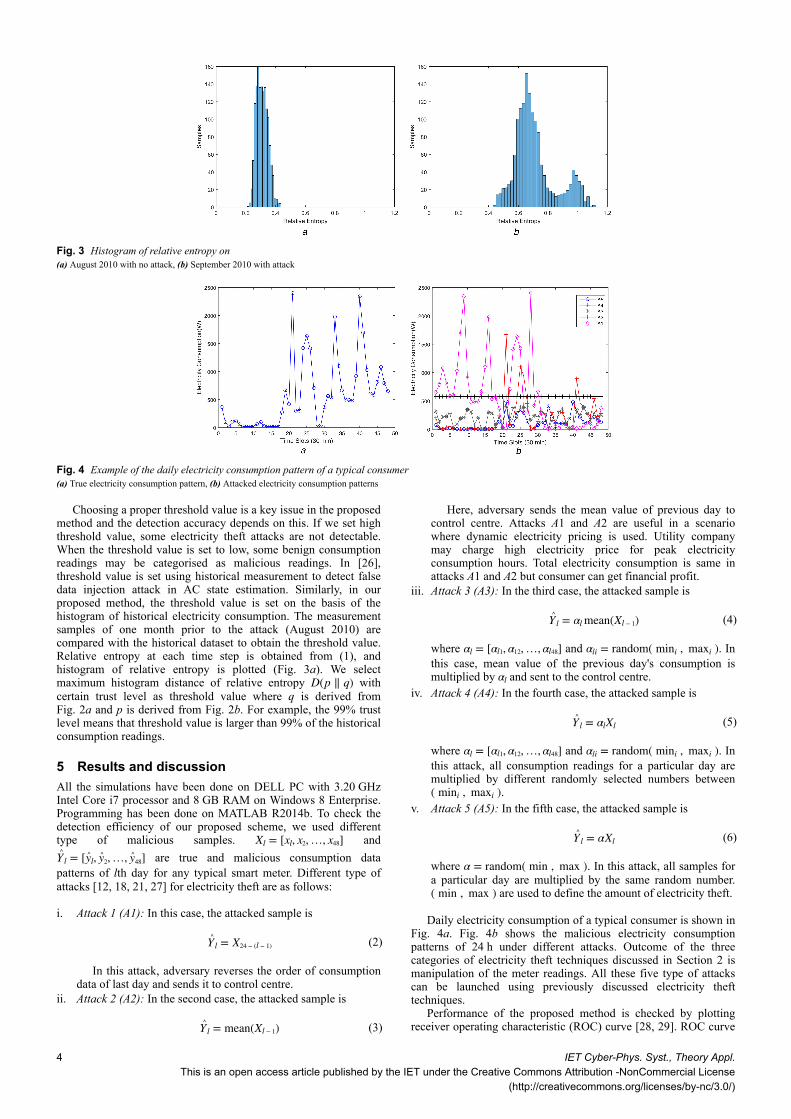
Daily electricity consumption of a typical consumer is shown inFig. 4a. Fig. 4b shows the malicious electricity consumptionpatterns of 24 h under different attacks. Outcome of the threecategories of electricity theft techniques discussed in Section 2 ismanipulation of the meter readings. All these five type of attackscan be launched using previously discussed electricity thefttechniques.
Performance of the proposed method is checked by plottingreceiver operating characteristic (ROC) curve [28, 29]. ROC curve
Fig. 3 Histogram of relative entropy on(a) August 2010 with no attack, (b) September 2010 with attack
Fig. 4 Example of the daily electricity consumption pattern of a typical consumer(a) True electricity consumption pattern, (b) Attacked electricity consumption patterns
4 IET Cyber-Phys. Syst., Theory Appl.This is an open access article published by the IET under the Creative Commons Attribution -NonCommercial License
(http://creativecommons.org/licenses/by-nc/3.0/)
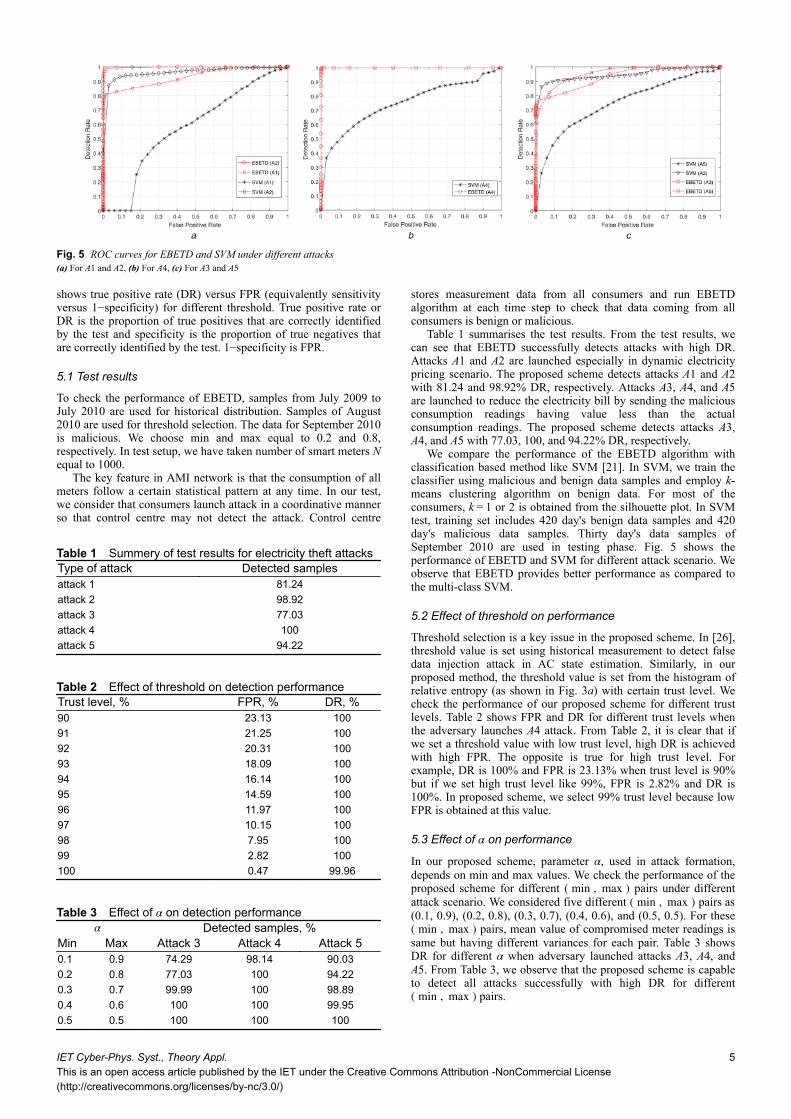
shows true positive rate (DR) versus FPR (equivalently sensitivityversus 1−specificity) for different threshold. True positive rate orDR is the proportion of true positives that are correctly identifiedby the test and specificity is the proportion of true negatives thatare correctly identified by the test. 1−specificity is FPR.
5.1 Test results
To check the performance of EBETD, samples from July 2009 toJuly 2010 are used for historical distribution. Samples of August2010 are used for threshold selection. The data for September 2010is malicious. We choose min and max equal to 0.2 and 0.8,respectively. In test setup, we have taken number of smart meters Nequal to 1000.
The key feature in AMI network is that the consumption of allmeters follow a certain statistical pattern at any time. In our test,we consider that consumers launch attack in a coordinative mannerso that control centre may not detect the attack. Control centre
stores measurement data from all consumers and run EBETDalgorithm at each time step to check that data coming from allconsumers is benign or malicious.
Table 1 summarises the test results. From the test results, wecan see that EBETD successfully detects attacks with high DR.Attacks A1 and A2 are launched especially in dynamic electricitypricing scenario. The proposed scheme detects attacks A1 and A2with 81.24 and 98.92% DR, respectively. Attacks A3, A4, and A5are launched to reduce the electricity bill by sending the maliciousconsumption readings having value less than the actualconsumption readings. The proposed scheme detects attacks A3,A4, and A5 with 77.03, 100, and 94.22% DR, respectively.
We compare the performance of the EBETD algorithm withclassification based method like SVM [21]. In SVM, we train theclassifier using malicious and benign data samples and employ k-means clustering algorithm on benign data. For most of theconsumers, k = 1 or 2 is obtained from the silhouette plot. In SVMtest, training set includes 420 day's benign data samples and 420day's malicious data samples. Thirty day's data samples ofSeptember 2010 are used in testing phase. Fig. 5 shows theperformance of EBETD and SVM for different attack scenario. Weobserve that EBETD provides better performance as compared tothe multi-class SVM.
5.2 Effect of threshold on performance
Threshold selection is a key issue in the proposed scheme. In [26],threshold value is set using historical measurement to detect falsedata injection attack in AC state estimation. Similarly, in ourproposed method, the threshold value is set from the histogram ofrelative entropy (as shown in Fig. 3a) with certain trust level. Wecheck the performance of our proposed scheme for different trustlevels. Table 2 shows FPR and DR for different trust levels whenthe adversary launches A4 attack. From Table 2, it is clear that ifwe set a threshold value with low trust level, high DR is achievedwith high FPR. The opposite is true for high trust level. Forexample, DR is 100% and FPR is 23.13% when trust level is 90%but if we set high trust level like 99%, FPR is 2.82% and DR is100%. In proposed scheme, we select 99% trust level because lowFPR is obtained at this value.
5.3 Effect of α on performance
In our proposed scheme, parameter α, used in attack formation,depends on min and max values. We check the performance of theproposed scheme for different ( min , max ) pairs under differentattack scenario. We considered five different ( min , max ) pairs as(0.1, 0.9), (0.2, 0.8), (0.3, 0.7), (0.4, 0.6), and (0.5, 0.5). For these( min , max ) pairs, mean value of compromised meter readings issame but having different variances for each pair. Table 3 showsDR for different α when adversary launched attacks A3, A4, andA5. From Table 3, we observe that the proposed scheme is capableto detect all attacks successfully with high DR for different( min , max ) pairs.
Table 1 Summery of test results for electricity theft attacksType of attack Detected samplesattack 1 81.24attack 2 98.92attack 3 77.03attack 4 100attack 5 94.22
Fig. 5 ROC curves for EBETD and SVM under different attacks(a) For A1 and A2, (b) For A4, (c) For A3 and A5
Table 2 Effect of threshold on detection performanceTrust level, % FPR, % DR, %90 23.13 10091 21.25 10092 20.31 10093 18.09 10094 16.14 10095 14.59 10096 11.97 10097 10.15 10098 7.95 10099 2.82 100100 0.47 99.96
Table 3 Effect of α on detection performanceα Detected samples, %
Min Max Attack 3 Attack 4 Attack 50.1 0.9 74.29 98.14 90.030.2 0.8 77.03 100 94.220.3 0.7 99.99 100 98.890.4 0.6 100 100 99.950.5 0.5 100 100 100
IET Cyber-Phys. Syst., Theory Appl.This is an open access article published by the IET under the Creative Commons Attribution -NonCommercial License(http://creativecommons.org/licenses/by-nc/3.0/)
5
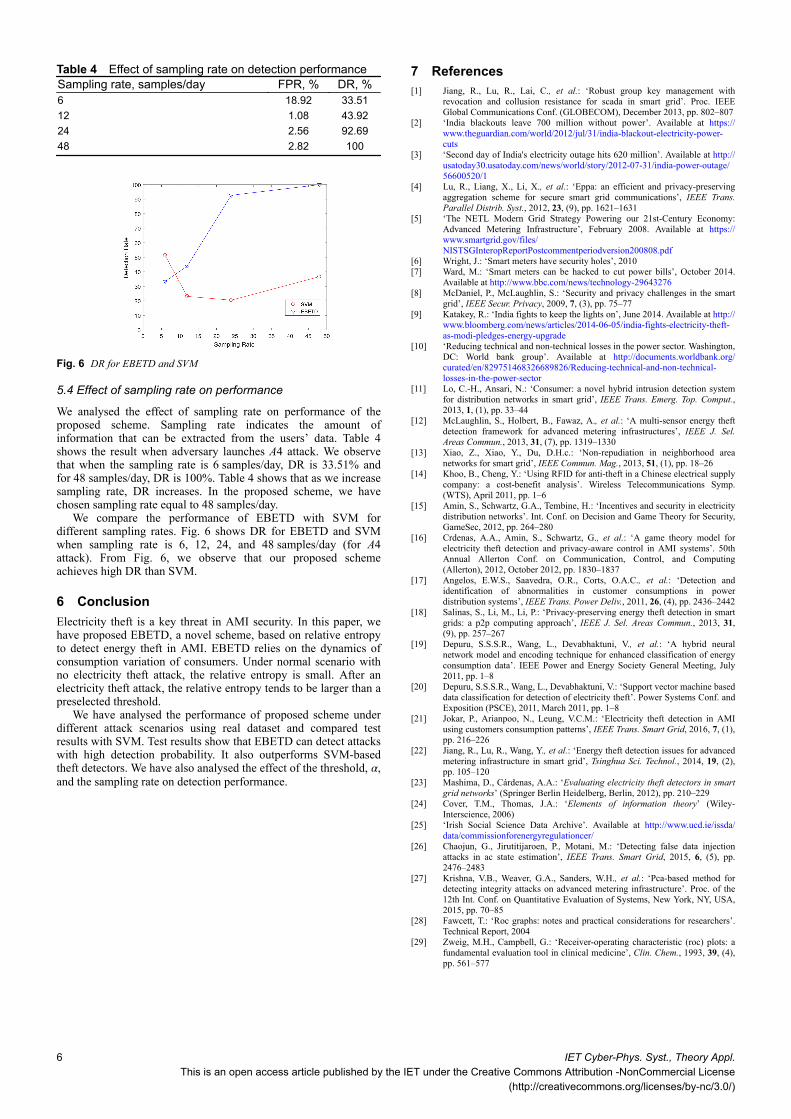
5.4 Effect of sampling rate on performance
We analysed the effect of sampling rate on performance of theproposed scheme. Sampling rate indicates the amount ofinformation that can be extracted from the users’ data. Table 4shows the result when adversary launches A4 attack. We observethat when the sampling rate is 6 samples/day, DR is 33.51% andfor 48 samples/day, DR is 100%. Table 4 shows that as we increasesampling rate, DR increases. In the proposed scheme, we havechosen sampling rate equal to 48 samples/day.
We compare the performance of EBETD with SVM fordifferent sampling rates. Fig. 6 shows DR for EBETD and SVMwhen sampling rate is 6, 12, 24, and 48 samples/day (for A4attack). From Fig. 6, we observe that our proposed schemeachieves high DR than SVM.
6 ConclusionElectricity theft is a key threat in AMI security. In this paper, wehave proposed EBETD, a novel scheme, based on relative entropyto detect energy theft in AMI. EBETD relies on the dynamics ofconsumption variation of consumers. Under normal scenario withno electricity theft attack, the relative entropy is small. After anelectricity theft attack, the relative entropy tends to be larger than apreselected threshold.
We have analysed the performance of proposed scheme underdifferent attack scenarios using real dataset and compared testresults with SVM. Test results show that EBETD can detect attackswith high detection probability. It also outperforms SVM-basedtheft detectors. We have also analysed the effect of the threshold, α,and the sampling rate on detection performance.
7 References[1] Jiang, R., Lu, R., Lai, C., et al.: ‘Robust group key management with
revocation and collusion resistance for scada in smart grid’. Proc. IEEEGlobal Communications Conf. (GLOBECOM), December 2013, pp. 802–807
[2] ‘India blackouts leave 700 million without power’. Available at https://www.theguardian.com/world/2012/jul/31/india-blackout-electricity-power-cuts
[3] ‘Second day of India's electricity outage hits 620 million’. Available at http://usatoday30.usatoday.com/news/world/story/2012-07-31/india-power-outage/56600520/1
[4] Lu, R., Liang, X., Li, X., et al.: ‘Eppa: an efficient and privacy-preservingaggregation scheme for secure smart grid communications’, IEEE Trans.Parallel Distrib. Syst., 2012, 23, (9), pp. 1621–1631
[5] ‘The NETL Modern Grid Strategy Powering our 21st-Century Economy:Advanced Metering Infrastructure’, February 2008. Available at https://www.smartgrid.gov/files/NISTSGInteropReportPostcommentperiodversion200808.pdf
[6] Wright, J.: ‘Smart meters have security holes’, 2010[7] Ward, M.: ‘Smart meters can be hacked to cut power bills’, October 2014.
Available at http://www.bbc.com/news/technology-29643276[8] McDaniel, P., McLaughlin, S.: ‘Security and privacy challenges in the smart
grid’, IEEE Secur. Privacy, 2009, 7, (3), pp. 75–77[9] Katakey, R.: ‘India fights to keep the lights on’, June 2014. Available at http://
www.bloomberg.com/news/articles/2014-06-05/india-fights-electricity-theft-as-modi-pledges-energy-upgrade
[10] ‘Reducing technical and non-technical losses in the power sector. Washington,DC: World bank group’. Available at http://documents.worldbank.org/curated/en/829751468326689826/Reducing-technical-and-non-technical-losses-in-the-power-sector
[11] Lo, C.-H., Ansari, N.: ‘Consumer: a novel hybrid intrusion detection systemfor distribution networks in smart grid’, IEEE Trans. Emerg. Top. Comput.,2013, 1, (1), pp. 33–44
[12] McLaughlin, S., Holbert, B., Fawaz, A., et al.: ‘A multi-sensor energy theftdetection framework for advanced metering infrastructures’, IEEE J. Sel.Areas Commun., 2013, 31, (7), pp. 1319–1330
[13] Xiao, Z., Xiao, Y., Du, D.H.c.: ‘Non-repudiation in neighborhood areanetworks for smart grid’, IEEE Commun. Mag., 2013, 51, (1), pp. 18–26
[14] Khoo, B., Cheng, Y.: ‘Using RFID for anti-theft in a Chinese electrical supplycompany: a cost-benefit analysis’. Wireless Telecommunications Symp.(WTS), April 2011, pp. 1–6
[15] Amin, S., Schwartz, G.A., Tembine, H.: ‘Incentives and security in electricitydistribution networks’. Int. Conf. on Decision and Game Theory for Security,GameSec, 2012, pp. 264–280
[16] Crdenas, A.A., Amin, S., Schwartz, G., et al.: ‘A game theory model forelectricity theft detection and privacy-aware control in AMI systems’. 50thAnnual Allerton Conf. on Communication, Control, and Computing(Allerton), 2012, October 2012, pp. 1830–1837
[17] Angelos, E.W.S., Saavedra, O.R., Corts, O.A.C., et al.: ‘Detection andidentification of abnormalities in customer consumptions in powerdistribution systems’, IEEE Trans. Power Deliv., 2011, 26, (4), pp. 2436–2442
[18] Salinas, S., Li, M., Li, P.: ‘Privacy-preserving energy theft detection in smartgrids: a p2p computing approach’, IEEE J. Sel. Areas Commun., 2013, 31,(9), pp. 257–267
[19] Depuru, S.S.S.R., Wang, L., Devabhaktuni, V., et al.: ‘A hybrid neuralnetwork model and encoding technique for enhanced classification of energyconsumption data’. IEEE Power and Energy Society General Meeting, July2011, pp. 1–8
[20] Depuru, S.S.S.R., Wang, L., Devabhaktuni, V.: ‘Support vector machine baseddata classification for detection of electricity theft’. Power Systems Conf. andExposition (PSCE), 2011, March 2011, pp. 1–8
[21] Jokar, P., Arianpoo, N., Leung, V.C.M.: ‘Electricity theft detection in AMIusing customers consumption patterns’, IEEE Trans. Smart Grid, 2016, 7, (1),pp. 216–226
[22] Jiang, R., Lu, R., Wang, Y., et al.: ‘Energy theft detection issues for advancedmetering infrastructure in smart grid’, Tsinghua Sci. Technol., 2014, 19, (2),pp. 105–120
[23] Mashima, D., Cárdenas, A.A.: ‘Evaluating electricity theft detectors in smartgrid networks’ (Springer Berlin Heidelberg, Berlin, 2012), pp. 210–229
[24] Cover, T.M., Thomas, J.A.: ‘Elements of information theory’ (Wiley-Interscience, 2006)
[25] ‘Irish Social Science Data Archive’. Available at http://www.ucd.ie/issda/data/commissionforenergyregulationcer/
[26] Chaojun, G., Jirutitijaroen, P., Motani, M.: ‘Detecting false data injectionattacks in ac state estimation’, IEEE Trans. Smart Grid, 2015, 6, (5), pp.2476–2483
[27] Krishna, V.B., Weaver, G.A., Sanders, W.H., et al.: ‘Pca-based method fordetecting integrity attacks on advanced metering infrastructure’. Proc. of the12th Int. Conf. on Quantitative Evaluation of Systems, New York, NY, USA,2015, pp. 70–85
[28] Fawcett, T.: ‘Roc graphs: notes and practical considerations for researchers’.Technical Report, 2004
[29] Zweig, M.H., Campbell, G.: ‘Receiver-operating characteristic (roc) plots: afundamental evaluation tool in clinical medicine’, Clin. Chem., 1993, 39, (4),pp. 561–577
Table 4 Effect of sampling rate on detection performanceSampling rate, samples/day FPR, % DR, %6 18.92 33.5112 1.08 43.9224 2.56 92.6948 2.82 100
Fig. 6 DR for EBETD and SVM
6 IET Cyber-Phys. Syst., Theory Appl.This is an open access article published by the IET under the Creative Commons Attribution -NonCommercial License
(http://creativecommons.org/licenses/by-nc/3.0/)

IET Cyber-Phys. Syst., Theory Appl.This is an open access article published by the IET under the Creative Commons Attribution -NonCommercial License(http://creativecommons.org/licenses/by-nc/3.0/)
7