AMERICAN FUNDS INVESTOR - clselement.com · AMERICAN FUNDS INVESTOR INSIDE THE ISSUE MARKET REVIEW:...
11
AMERICAN FUNDS INVESTOR INSIDE THE ISSUE MARKET REVIEW: The real reason losses were so steep in Q4 2018 FUND SPOTLIGHT: How American Mutual outperformed in the worst quarter for U.S. stocks since 2008 FEATURED Defense Wins Championships: A focus on risk and diversification may not win every game, but it is more likely to bring home the championship. FOURTH QUARTER 2018
Transcript of AMERICAN FUNDS INVESTOR - clselement.com · AMERICAN FUNDS INVESTOR INSIDE THE ISSUE MARKET REVIEW:...

AMERICAN FUNDS INVESTOR
INSIDE THE ISSUE
MARKET REVIEW: The real reason losses were so steep in Q4 2018
FUND SPOTLIGHT: How American Mutual outperformed in the worst quarter for U.S. stocks since 2008
FEATURED
Defense Wins Championships:A focus on risk and diversification may
not win every game, but it is more likely to bring home the championship.
FOURTH QUARTER 2018

Market ReviewThe fourth quarter of 2018 was a tough one for the
financial markets, and it pushed most financial assets
to losses on the year. Prices did not fall by 20% or
more, which means the bull market in U.S. stocks is
still officially alive, continuing the second longest and
strongest in U.S. stock market history. But by year’s end,
it was hanging by a thread.
Though the magnitude of losses was not as steep as
in 2008, only a few asset classes were able to generate
returns above 5%, making 2018 worse than 2008 in
some ways. There was practically nowhere to find
attractive real returns last year.
The reasons losses were so steep during a time of year
when many expect gains (the holiday months) include:
` Rich stock market valuations: These are common
in mature bull markets and can decelerate
corporate earnings growth; witnessing them now
is to be expected after the phenomenal growth in
prior quarters.
` Higher interest rates: These are also foreseeable
given the normalcy of the economy and the
abnormality of low interest rates over the last 10
years.
` Extreme political uncertainty: President Trump
has created uncertainty during a period in the
four-year presidential cycle when it is typically at
low tide.
We believe the outlook for 2019 is much better. First,
the stock market has historically moved higher on a
calendar year basis. Over the last 150 years, the long-
term historical probability of a positive return is 75%. But
that probability moves even higher after the stock market
experiences a setback like it has in recent months. The
odds for above-average gains have shifted in our favor.
Generally speaking, now is a better time to buy, not sell.
Volatility is a Perfectly Natural, Normal ThingWhile it seems like 2018 was a volatile year, it’s all relative.
The year felt volatile partly because 2017 was so calm.
The funny thing about volatility is that it goes both ways.
Both positive and negative returns swing more wildly,
but the brain focuses more on the negatives. The charts
presented in this section illustrate this point using daily
price returns from the S&P 500 Index since 1928.
Chart 1: How many days per year have returns been
less than -1%?
The median number is 25. Clearly, there were far fewer
days than that in 2017 – just four! 2018 was above average
with 32 days, but that was eight times 2017’s total, which
made it feel far more dramatic. However, we believe the
increased volatility is nothing to worry about. We are
simply getting back to more normal levels.
Chart 2: How many days per year have returns been
greater than 1%?
The median number is 26. The first point to note is
that is one more than the number of days with less
than -1% returns, which is a great reminder that the
market is not a coin flip. Second, there were only four
days in 2017 above 1%; yet, it was such a great year.
Once again, volatility goes both ways. Third, the
number of days with returns greater than 1% in 2017
was nearly a fifth of the average, and in 2018, it was
just above average. Lastly, it is interesting to note the
number of days with less than -1% returns and those
with returns greater than 1% were the same in 2018.
Now that doesn’t sound too bad.
0
20
40
60
80
100
120
192
8
193
1
193
4
193
7
194
0
194
3
194
6
194
9
195
2
195
5
195
8
196
1
196
4
196
7
1970
1973
1976
1979
198
2
198
5
198
8
199
1
199
4
199
7
20
00
20
03
20
06
20
09
20
12
20
15
20
18
Day
s P
er Y
ear
Number of Days per Year with Returns Less than -1%
<-1 Median
Median = 25 = 4
2018 YTD = 32
Median = 252017 = 42018 YTD = 32
0
10
20
30
40
50
60
70
80
90
100
192
8
193
1
193
4
193
7
194
0
194
3
194
6
194
9
195
2
195
5
195
8
196
1
196
4
196
7
1970
1973
1976
1979
198
2
198
5
198
8
199
1
199
4
199
7
20
00
20
03
20
06
20
09
20
12
20
15
20
18
Day
s P
er Y
ear
Number of Days per Year with Returns Greater than 1%
>+1 Median
Median = 26 2017 = 42018 YTD = 32

Chart 3: How many total days greater than 1% and
less than -1% have there been per year?
Same story, different chapter. There have been 54
days on average, which seems like a lot considering
there are typically 252 trading days in a year. But
that is what the stock market is: volatile. One out of
every five days has historically had a more-than-1%
move (that’s once a week). With that said, 2017 only
had eight, which adds up to a 1% move about once
every six weeks. 2018 had 64 days above average, but
it certainly was not extreme. Thus, while it seems to
have been a rough year, volatility still has been close
to average.
As investors, it’s helpful to remember that the stock
market will be volatile, probably more than you
expect or desire, but it has historically gone up over
time. And while the stock market tends to generate
positive returns, it’s still prudent to anticipate losses
over shorter time frames. That is why it is important
to stay balanced and diversified among various asset
classes within investment portfolios.
Fund Spotlight: American Mutual 2018 Review
As we highlighted several quarters ago, American
Mutual is our chief U.S. value option in the American
Funds lineup. The value exposure, commitment to
risk management (by way of ample cash and bond
reserves), long-term track record, and defined process
all make us comfortable with the exposure in an area
we believe positions investors well in the months,
quarters, and years ahead.
For 2018, American Mutual managed to outperform
the S&P 500 and U.S. value indices handily — falling
just 1.7% in the worst year for U.S. stocks since 2008.
In the volatile fourth quarter, Mutual’s focus on high-
quality companies and the fund’s healthy cash balance
showed through, outperforming the S&P 500 by more
than 5% for the quarter.
We broke down a preliminary look at what contributed
to this outperformance. It must be noted that we
are using quarterly holdings with a lagged reporting
period, so the accuracy will not be the same as the
American Funds attribution that will be available soon,
but it will give us some insight into the outperformance
we saw last year.
0
20
40
60
80
100
120
140
160
180
200
192
8
193
1
193
4
193
7
194
0
194
3
194
6
194
9
195
2
195
5
195
8
196
1
196
4
196
7
1970
1973
1976
1979
198
2
198
5
198
8
199
1
199
4
199
7
20
00
20
03
20
06
20
09
20
12
20
15
20
18
Day
s P
er Y
ear
Number of Days per Year with Market Moves Over 1%
>+/-1 Median
Median = 54 2017 = 82018 YTD = 64
Sector Avg Weight % Active Return* Health Care 17.3% 2.7% Technology 10.5% 1.0% Utilities 4.6% 0.5% Communication Services 5.5% 0.4% Consumer Defensive 9.2% 0.3% Consumer Cyclical 5.6% 0.1% Basic Materials 2.3% 0.0% Real Estate 1.5% 0.0% Industrials 9.4% -0.5% Financial Services 12.0% -0.7% Energy 8.0% -1.5% *vs the S&P 500 as a benchmark

FEATUREDStories that matter to your bottom line.
Defense Wins ChampionshipsThere are several variables that we as investors can
control when investing, including the cost, time until
withdrawals, how we react to volatility, and how much
risk we take on. Unfortunately, we tend to focus most
on returns, which we have no control over.
One of the most important elements investors can
control is risk, which can have a significant impact
on returns. CLS focuses on measuring and targeting
specific risk levels (Risk Budgeting). We do not
make allocation changes based on market moves
(performance chasing). By holding risk steady over
the long term, we can match specific client needs and
help control client emotions. Ultimately, CLS believes
that keeping clients invested for the long run is the
best way to achieve financial goals.
Additionally, we build globally diversified, balanced
portfolios. A diversified approach can help defend
against significant price drops in any one asset class.
A consistent level of risk combined with a diversified
approach results in a powerful matchup that is hard
to beat. Take a look at the table below, which shows
yearly risk and return for two portfolios starting in the
year 2000:
` The diversified portfolio consists of 60% equities
and 40% bonds, with the equity portion broken up
into 60% U.S. stocks and 40% international stocks.
` The non-diversified portfolio is the S&P 500 Index.
` The diversified portfolio generally
underperforms in the up years but outperforms
in down years – a defensive approach (although
not always the case as 2018 has shown).
` There were many more up years than down over
the last 18 years. In fact, the average total return
is higher for the non-diversified portfolio over
this period. And yet, the annualized/cumulative
returns and ending dollar value still favor the
diversified portfolio. How can this be?
• It is because the risk of the diversified portfolio
is so much lower; for the entire period, it is 9%
versus 15% – a 40% relative reduction in risk.
• For every down day that the diversified
portfolio outperforms, it is able to compound
returns and grow faster on the rebound.
• The result is a 14% higher cumulative return for
the diversified portfolio. Translated into dollars,
if you started with $10,000, the diversified
approach results in an additional $1,400 in
your pocket.
This study certainly makes the case for building Risk
Budgeted, global, balanced portfolios to help investors
succeed over time.
RISK
COST
TIME
EMOTION
TAXES
VALUATION
RETURN
WH
AT
INV
EST
OR
S C
AN
CO
NT
RO
L
WH
AT
INV
EST
OR
S C
AN
’T C
ON
TR
OL
Source: Morningstar data. Non-diversified portfolio represented by 100% S&P 500 Index. Diversified portfolio represented by a 60% equity / 40% fixed income portfolio with 60% of the equity in U.S. stocks and 40% in international. U.S. stocks represented by the Russell 3000 Index, international stocks by the MSCI ACWI ex-USA Index, and fixed income by the Bloomberg Barclays U.S. Aggregate Bond Index.
Diversified Portfolio Non-Divers. Portfolio
Starting Value $10,000 $10,000 Year Return Std Dev Return Std Dev 2000 -2% 10% -9% 17% 2001 -6% 11% -12% 20% 2002 -7% 11% -22% 21% 2003 22% 8% 29% 11% 2004 11% 6% 11% 7% 2005 7% 5% 5% 8% 2006 14% 5% 16% 6% 2007 9% 5% 5% 10% 2008 -23% 16% -37% 21% 2009 23% 15% 26% 22% 2010 12% 11% 15% 19% 2011 1% 10% 2% 16% 2012 12% 8% 16% 11% 2013 14% 6% 32% 8% 2014 6% 6% 12% 8% 2015 -1% 8% 1% 14% 2016 7% 7% 12% 10% 2017 15% 2% 22% 4%
Average Total Ret 6% 7% Average Std Dev 8% 13% Annualized Total Ret 6% 5% Cumulative Total Ret 174% 158% Total Period Std Dev 9% 15% Ending Value $27,419 $25,788

CASE’S CORNERFourth Quarter 2018: The Good, the Bad, and the Disappointing
The market review section of this newsletter covered the “bad” part of Q4 2018 , and it bears no repeating. Most asset classes sported negative returns, and volatility picked back up to a normal pace. But it felt much, much worse after a blockbuster 2017 that saw strong returns and muted volatility.
So, what was the “good” part of the quarter? As mentioned in the fund spotlight, several key funds in our investor models saw stellar performance in the fourth quarter and for the year. Now, to be sure, “stellar” is a relative term. Equity funds (and some bond funds) were down for the year, but relative to peers and benchmarks, they performed admirably. All of our Risk Budgeted models saw meaningful outperformance in the fourth quarter, just in time to make up some ground on the year. For example, our 70 Risk Budget model is designed to take on 70% of the volatility of the global market, and it always will. But we expect American Funds to help deliver some alpha for our investors, and they did so in the fourth quarter. A 70 Risk Budget model captured roughly 55% of the drawdown. Global diversification worked from an asset allocation standpoint, and active management worked from a security selection standpoint – two points our investors were excited to see. Our tilts to the lower beta and value oriented American Funds supported portfolios, and performance of those funds proved
to be solid for the year. In fact, all of the funds we typically use in our models were comparably strong among peers for the tumultuous year of 2018. On the other hand, our above benchmark allocation to broad international funds detracted value. American Funds investors rejoiced and continued to vote with their dollars as Capital Group’s offerings saw inflows in 2018, while most active managers continued to lose ground to ETFs. That brings me to the disappointing part of the year.
It’s somewhat astonishing that American Funds continued to see positive flows with an estimated $500 billion+ going out of active funds in 2018. However, the ugly part for taxable investors come year-end is the annual capital gains tax hit. Some of the worst news investors can hear is that they’ve seen negative total returns for the year and they have to pay taxes for them! It’s an antiquated flaw of mutual funds that dates back to their inception. Quite simply, the ETF is a better structure, and we urge Capital Group to take a hard look at joining the party to create transparent and tax-efficient ETFs – either as brand new strategies or versions of their current stellar lineup of mutual funds. We applaud them for their cost leadership in the arena, but the time will come when the market will demand a better structure, and that time may be fast approaching.

FUND PERFORMANCE
Name TICKERQ4 18
RETURN2018 3 YEAR 5 YEAR 10 YEAR 15 YEAR
RISK BUDGET
American Funds AMCAP FMACX -14.34 -1.60 9.51 8.21 14.10 8.06 103
American Funds American Balanced AFMBX -6.54 -2.43 7.07 6.33 10.38 6.76 62
American Funds American High-Inc HIGFX -4.83 -1.51 7.03 2.67 9.24 5.63 31
American Funds American Mutual AFMFX -7.93 -1.77 9.78 7.68 11.86 7.59 84
American Funds Bond Fund of Amer BFFAX 1.64 0.21 2.15 2.43 4.39 3.15 6
American Funds Capital Income Bldr CFIHX -5.57 -6.76 4.51 3.39 7.42 5.96 62
American Funds Capital World Bond WFBFX 1.13 -1.13 2.85 1.16 3.00 3.56 16
American Funds Capital World Gr&Inc FWGIX -11.61 -9.97 6.23 4.05 9.10 7.36 96
American Funds Cnsry Gr & Inc INPDX -4.93 -3.23 6.10 4.51 52
American Funds Corporate Bond CFBFX -0.18 -2.14 3.50 3.84 11
American Funds Dvlpg Wld Gr&Inc FDWGX -4.89 -14.60 6.29 85
American Funds Emerging Markets Bond EBNGX 1.14 -4.00 25
American Funds Europacific Growth FEUPX -12.60 -14.91 3.95 1.64 7.40 6.45 98
American Funds Fundamental Invs FUNFX -12.41 -6.34 9.24 7.99 12.93 8.72 102
American Funds Global Balanced GFBLX -6.10 -5.83 4.76 2.98 60
American Funds Global Growth Port PGXFX -13.24 -8.67 7.01 4.82 102
American Funds Growth and Inc Port GAIHX -9.62 -5.61 6.89 5.39 82
American Funds Growth Fund of Amer GAFFX -15.07 -2.61 10.13 9.00 13.55 8.54 108
American Funds Growth Portfolio GWPDX -13.76 -6.33 8.22 6.46 106
American Funds Income Fund of Amer FIFAX -6.34 -4.86 6.14 5.01 9.54 6.52 63
American Funds Inflation Linked Bd FILBX 0.33 -0.70 2.17 2.05 9
American Funds Interm Bd Fd of Amer IFBFX 1.61 1.17 1.19 1.28 2.25 2.24 1
American Funds Intl Gr and Inc IGAIX -11.38 -14.11 3.62 -0.17 6.70 90
American Funds Invmt Co of Amer FFICX -12.43 -6.23 8.84 7.33 11.69 7.21 97
American Funds Limited Term Tx-Ex B FLTEX 1.18 1.37 1.38 1.78 3.27 2.83 3
American Funds Moderate Gr & Inc BLPDX -6.93 -4.29 5.97 5.10 64
American Funds Mortgage AFFMX 2.04 0.85 1.59 2.49 5
American Funds New Economy FNEFX -13.13 -3.93 9.79 7.52 14.77 9.15 107
American Funds New Perspective FNPFX -13.16 -5.57 7.53 6.22 11.48 8.19 102
American Funds New World FNWFX -8.10 -11.97 6.74 1.95 8.32 7.89 92
American Funds Preservation Port PPFFX 1.40 1.28 1.37 1.43 2
American Funds Retire Inc Port-Cnsry FICWX -2.69 -2.54 4.12 35
American Funds Retire Inc Port-Enh FIEWX -5.87 -4.60 5.61 61
American Funds Retire Inc Port-Mod FIMWX -4.22 -3.51 4.97 47
American Funds Shrt-Term Tx-Exmpt SFTEX 0.73 1.09 0.90 0.82 2
American Funds SMALLCAP World SFCWX -16.20 -9.39 6.83 4.95 12.67 8.28 107
American Funds ST Bd Fd of Amer FSBTX 1.14 1.42 1.18 0.87 1.14 1
American Funds Strategic Bond ANBGX 1.75 0.57 6
American Funds Tax Exempt Bond TFEBX 1.35 1.02 2.35 3.93 5.23 3.91 6
American Funds Tax-Advtg Gr & Inc TYIFX -4.44 -1.85 5.95 5.87 46
American Funds Tax-Exempt Fund of CA EXCAX 1.21 0.93 2.28 4.15 6.19 4.13 5
American Funds Tax-Exempt Fund of NY TFNYX 1.29 0.60 2.05 3.78 5
American Funds Tax-Exempt Presv Port TYEFX 1.01 1.26 1.38 2.29 3
American Funds US Government Sec USGFX 2.52 1.02 1.18 1.97 2.41 3.11 2
American Funds Washington Mutual FWMIX -9.24 -2.65 9.98 8.11 12.21 7.49 94
American High-Income Municipal Bond HIMFX 0.75 1.89 4.02 6.03 7.72 4.66 7
MODEL PORTFOLIOSModel portfolios are constructed using our best ideas from the American Funds lineup and based on target risk
levels. We display tickers from each F-share class for advisor preference.
Despite rough global equity markets in the fourth quarter, model performance held up well. Two of our biggest
value-oriented equity positions, Developing Work G&I and American Mutual, held up particularly well in the
quarter. More growth-and-core-oriented positions such as Fundamental Investors, New Perspective, and
Investment Company of America lagged in the fourth quarter despite helping the majority of 2018.
Bond positions were somewhat positive in the fourth quarter, and our major fixed income funds – Bond Fund
of America and Short-term Bond Fund of America – outperformed their respective benchmarks and helped
performance. Inflation protected bonds lagged somewhat, albeit still positive performers during a negative
equity month.
Aggressive Model 100 RB, Model Yield (12-month): 1.8% % F1 F2 F3
SMALLCAP World Fund 6 SCWFX SMCFX SFCWX
The New Economy Fund 7 ANFFX NEFFX FNEFX
American Mutual Fund 23 AMFFX AMRFX AFMFX
Fundamental Investors 8 AFIFX FINFX FUNFX
The Investment Company of America 8 AICFX ICAFX FFICX
International Growth & Income Fund 15 IGIFX IGFFX IGAIX
EuroPacific Growth Fund 7 AEGFX AEPFX FEUPX
New Perspective Fund 8 NPFFX ANWFX FNPFX
Developing World G&I 18 DWGFX DWGHX FDWGX
Moderate Aggressive Model 75 RB, Model Yield (12-month): 2.0% % F1 F2 F3
SMALLCAP World Fund 4 SCWFX SMCFX SFCWX
American Mutual Fund 17 AMFFX AMRFX AFMFX
Fundamental Investors 5 AFIFX FINFX FUNFX
The Investment Company of America 7 AICFX ICAFX FFICX
Washington Mutual Investors Fund 6 WSHFX WMFFX FWMIX
International Growth & Income Fund 12 IGIFX IGFFX IGAIX
EuroPacific Growth Fund 6 AEGFX AEPFX FEUPX
New Perspective Fund 6 NPFFX ANWFX FNPFX
Developing World G&I 16 DWGFX DWGHX FDWGX
The Bond Fund of America 12 BFAFX ABNFX BFFAX
Short Term Bond Fund of America 9 ASBFX SBFFX FSBTX

Moderate Model 50 RB, Model Yield (12-month): 2.3% % F1 F2 F3
American Mutual Fund 12 AMFFX AMRFX AFMFX
Fundamental Investors 3 AFIFX FINFX FUNFX
The Investment Company of America 4 AICFX ICAFX FFICX
Washington Mutual Investors Fund 4 WSHFX WMFFX FWMIX
International Growth & Income Fund 9 IGIFX IGFFX IGAIX
EuroPacific Growth Fund 5 AEGFX AEPFX FEUPX
New Perspective Fund 3 NPFFX ANWFX FNPFX
Developing World G&I 8 DWGFX DWGHX FDWGX
The Bond Fund of America 23 BFAFX ABNFX BFFAX
Emerging Market Bond Fund 4 EBNEX EBNFX EBNGX
Short Term Bond Fund of America 17 ASBFX SBFFX FSBTX
American Inflation-Linked Bond 8 BFIFX BFIGX FILBX
Conservative Model 30 RB, Model Yield (12-month): 2.4% % F1 F2 F3
American Mutual Fund 9 AMFFX AMRFX AFMFX
The Investment Company of America 3 AICFX ICAFX FFICX
American Funds Global Balanced Fund 3 GBLEX GBLFX GFBLX
International Growth & Income Fund 4 IGIFX IGFFX IGAIX
EuroPacific Growth Fund 3 AEGFX AEPFX FEUPX
Developing World G&I 4 DWGFX DWGHX FDWGX
The Bond Fund of America 28 BFAFX ABNFX BFFAX
Strategic Bond Fund 5 ANBEX ANBFX ANBGX
Emerging Market Bond Fund 6 EBNEX EBNFX EBNGX
Short Term Bond Fund of America 25 ASBFX SBFFX FSBTX
American Inflation-Linked Bond 10 BFIFX BFIGX FILBX
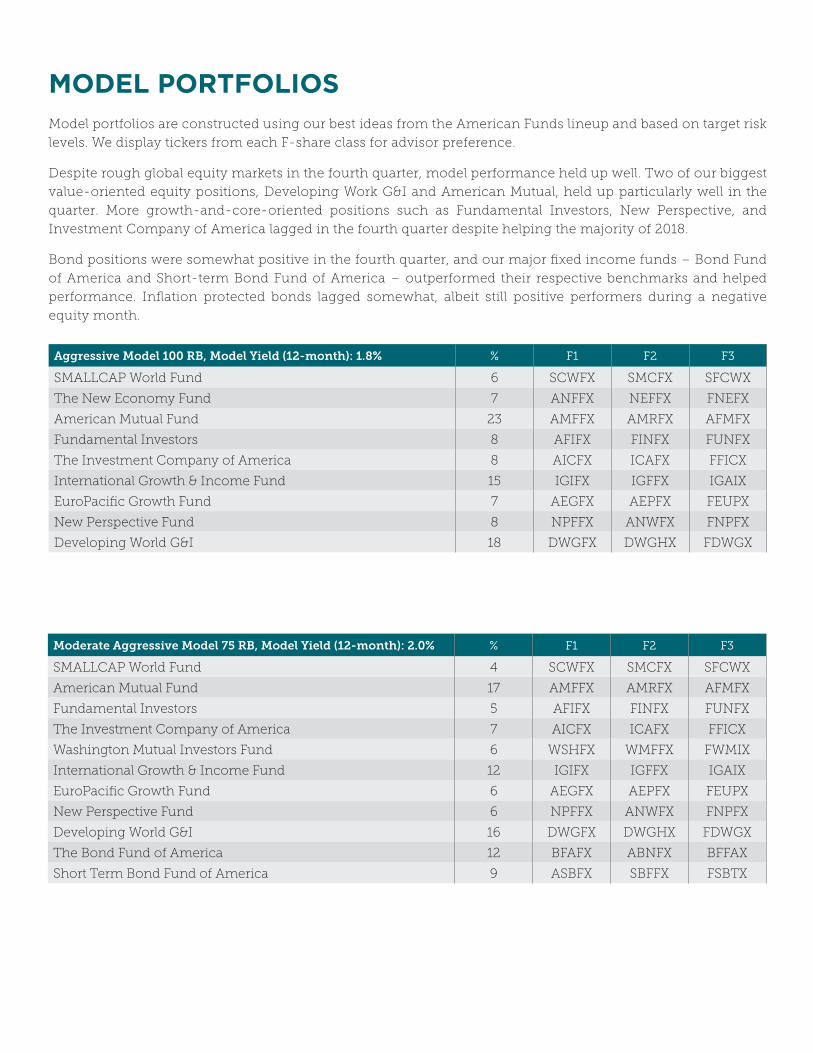
SELECT FACTOR EXPOSURESFactor exposures are based on return sensitivities to seven common, global factors. Factor exposures can provide
insight into portfolio performance and exposures without relying on underlying holdings, which are reported quarterly
with a lag.
Name TICKER SIZE VALUE MOMENTUM MIN VOL QUALITY DURATION CREDIT
American Funds Dvlpg Wld Gr&Inc DWGHX -0.43 1.49 0.00 0.27 -0.17 0.57 -0.26
American Funds Europacific Growth AEPFX -0.29 1.16 0.39 -0.77 0.37 0.45 -0.13
American Funds Fundamental Invs FINFX 0.18 0.22 0.25 0.17 0.13 -0.17 0.04
American Funds Growth Fund of Amer GFFFX 0.32 0.08 0.57 -0.20 0.17 -0.14 0.08
American Funds Intl Gr and Inc IGFFX -0.34 1.13 0.17 -0.36 0.29 0.31 -0.15
American Funds Invmt Co of Amer ICAFX 0.30 0.14 0.25 0.39 -0.14 -0.22 0.06
American Funds New Economy NEFFX 0.37 0.27 0.49 -0.69 0.52 0.13 -0.28
American Funds New Perspective ANWFX -0.10 0.44 0.51 -0.43 0.46 0.14 0.04
American Funds SMALLCAP World SMCFX 0.85 -0.19 0.21 -0.24 0.29 0.06 0.11
American Funds Washington Mutual WMFFX 0.31 0.14 0.10 0.57 -0.10 -0.25 -0.15
American Funds American High-Inc AHIFX 0.00 -0.02 0.01 0.08 -0.05 -0.07 0.95
American Funds American Mutual AMRFX 0.32 -0.01 0.03 0.70 -0.08 -0.21 0.00
American Funds Interm Bd Fd of Amer IBAFX -0.07 -0.01 0.02 0.02 0.00 0.14 0.13
American Funds ST Bd Fd of Amer SBFFX -0.02 -0.02 0.01 -0.01 0.00 0.07 0.09
American Funds Bond Fund of Amer ABNFX -0.09 0.01 -0.01 -0.01 0.06 0.27 0.27
American Funds Income Fund of Amer AMEFX 0.09 0.24 0.02 0.40 -0.04 0.00 0.03
American Funds Inflation Linked Bd BFIGX 0.06 -0.04 -0.03 0.12 -0.06 0.22 0.25
American Funds Global Balanced GBLFX -0.11 0.55 0.13 0.20 -0.15 0.17 0.09
American Funds US Government MMkt AFGXX 0.00 0.00 0.00 0.00 0.00 0.00 -0.01
American Funds Emerging Markets Bd EBNFX -0.75 0.97 -0.19 0.42 -0.07 0.42 0.62
American Funds Strategic Bond ANBFX -0.09 -0.02 0.01 -0.05 0.06 0.23 0.33

ABOUT THE AUTHORSGRANT ENGELBART, CFA, CAIAGrant Engelbart manages CLS’s aggressive mutual funds and several ETF and mutual fund separate account
strategies, including CLS’s American Funds portfolios. He also leads the alternative broad asset class team and
serves on several committees across CLS’s parent company, NorthStar Financial Services Group, LLC.
Mr. Engelbart first joined CLS as an intern in 2007. He returned in 2009 and held several roles in trading and
investment research prior to accepting the role of Portfolio Manager in 2013. He previously held positions at
TD Ameritrade and State Street Corporation.
Mr. Engelbart received his Bachelor of Science degree in Finance from the University of Nebraska at Lincoln.
He holds the Chartered Financial Analyst (CFA) designation, Chartered Alternative Investment Analyst (CAIA)
designation, and FINRA Series 65 license. He is a member of the CFA Society of Nebraska and the CAIA
Chicago Chapter.
Mr. Engelbart was named one of the Top Ten Money Managers to Watch by Money Management
Executive in 2018.
Did you know? Grant invested in his first fund at age 13.
CASE EICHENBERGER, CIMACase Eichenberger co-manages CLS’s American Funds strategies, works closely with CLS’s separate
account strategies (Master Manager), and communicates with advisors and their clients both remotely and
in-person.
Since joining CLS in 2007, Mr. Eichenberger has held various roles, including Relationship Representative
and Internal Wholesaler. In 2015, he accepted the role of Client Portfolio Manager.
Mr. Eichenberger received his Bachelor of Science degree in Business Administration from Midland
University. He holds the FINRA Series 6, 63, and 65 licenses and Certified Investment Management Analyst
(CIMA®) designation. During the accreditation process, he attended the Wharton School of Business at the
University of Pennsylvania.
Mr. Eichenberger is a member of Greater Omaha Young Professionals and a volunteer for Habitat for
Humanity.
Did you know? Case comes from a long line of educators.
KOSTYA ETUS, CFAKonstantin “Kostya” Etus specializes in international investments. He is a co-manager on two mutual funds
(aggressive allocation and international) and manager on various separate account strategies, including Core
Plus ETF and ESG. In addition, he manages 529 plans.
Mr. Etus began his career at CLS in 2011 as a Trading Specialist and became a Research/Portfolio Analyst in
early 2013. In 2016, he was promoted to Portfolio Manager. Prior to working at CLS, Mr. Etus worked as an
Associate Financial Analyst at ConAgra Foods, Inc., managing the company’s global cash network.
He graduated from the University of Nebraska at Omaha with a Bachelor of Science degree in Business
Administration and obtained Master of Investment Management and Financial Analysis and Master of
Business Administration degrees from Creighton University. He holds the FINRA Series 65 securities
registration and the Chartered Financial Analyst (CFA) designation.
Did you know? Kostya grew up in Soviet Russia.

The views expressed herein are exclusively those of CLS Investments, LLC, and are not meant as investment advice and are subject to change. No part of this report may be reproduced in any manner without the express written permission of CLS Investments, LLC. Information contained herein is derived from sources we believe to be reliable, however, we do not represent that this information is complete or accurate and it should not be relied upon as such. This information is prepared for general information only. It does not have regard to the specific investment objectives, financial situation and the particular needs of any specific person who may receive this report. You should seek financial advice regarding the appropriateness of investing in any security or investment strategy discussed or recom mended in this report and should understand that statements regarding fu ture prospects may not be realized. You should note that security values may fluctuate and that each security’s price or value may rise or fall. Accordingly, investors may receive back less than originally invested. Past performance is not a guide to future performance. Investing in any security involves certain systematic risks including, but not limited to, market risk, interest-rate risk, inflation risk, and event risk. These risks are in addition to any unsystematic risks associated with particular investment styles or strategies. The S&P 500 Index is a stock market index based on the market capitalizations of 500 large companies having common stock listed on the NYSE or NASDAQ.
The graphs and charts contained in this work are for informational purposes only. No graph or chart should be regarded as a guide to investing.
CLS Investment, LLC (“CLS”) Portfolio Manager, Grant Engelbart, CFA, CAIA, was selected as a “Top 10 Fund Managers to Watch” in 2018 by Money Management Executive. Money Management Executive is an unbiased, third-party publication covering the asset management industry. Money Management Executive chose the list of managers to watch by screening Morningstar data from funds with a single manager, ranked as having the best three-year annualized returns in their respective categories. The list of managers was published March 12, 2018. Money Management Executive is not affiliated with CLS. Ratings and awards may not be representative of any one client’s experience and are not indicative of CLS’s future performance.
The CFA is a globally respected, graduate-level investment credential established in 1962 and awarded by CFA Institute — the largest global association of investment professionals. To learn more about the CFA charter, visit www.cfainstitute.org
CIMA professionals integrate a complex body of investment knowledge, ethically contributing to prudent investment decisions by providing objective advice and guidance to individual investors and institutional investors. To learn more about the CIMA, visit https://www.imca.org/cima
The CAIA® is the globally-recognized credential for professionals managing, analyzing, distributing, or regulating alternative investments. To learn more about the CAIA, visit https://caia.org/
0134-CLS-2/6/2019