American Electric Power - aep.com Electric Power 1 Riverside Plaza, 22nd ... Conesville Power Plant...
43
S&ME, Inc. | 6190 Enterprise Court | Dublin, OH 43016 | p 614.793.2226 | f 614.793.2410 | www.smeinc.com October 7, 2016 American Electric Power 1 Riverside Plaza, 22nd Floor Columbus, Ohio 43215 Attention: Mr. Brian G. Palmer Reference: Ash Pond Complex CCR Surface Impoundment Inflow Design Flood Assessment Conesville Power Plant Conesville, Ohio S&ME Project No. 7217-14-009H Ohio PE Firm License No. 03530 Dear Mr. Palmer: In accordance with our proposal dated June 21, 2016 and your request for additional work, S&ME, Inc. (S&ME) has completed an Inflow Design Flood Assessment of the ash pond complex at the Conesville Power Plant in Conesville, Ohio. The Assessment was performed to fulfill the requirements of 40 CFR § 257.82(c)(1), Hydrologic and hydraulic capacity requirements for CCR surface impoundments-Inflow design flood control system plan, of the USEPA Rules for Disposal of Coal Combustion Residuals from Electric Facilities. Background The Conesville Generating Plant is located in Coshocton County, Ohio, east of the Muskingum River, across from the town of Conesville. Adjacent to the plant is an approximate 100 acre ash pond complex within which are a number of individual ponds or lagoons: Three fly ash ponds denoted as Fly Ash Pond A, B and C, a bottom ash pond, and a Clearwater pond. The ponds are isolated from exterior surface water inflow. The ponds are regularly dredged and the recovered fly ash and bottom ash is either beneficially re-used or taken to the nearby Abandoned Mine Lands reclamation projects or the nearby residual waste landfill. The separator dike between each lagoon is constructed of fly ash and bottom ash. The separator dikes convey flow either through a pipe or through outlet structures. Because the ponds are interconnected with pipes and outlet structures which equalize the water surface to a common normal pool, the entire pond complex was treated as one hydraulic unit. For the purposes of this study, the interior dikes and outlet devices within the pond complex were not included (or hydraulically modelled) and a single maximum permitted water surface elevation was assumed across all ponds. This assumption is consistent with the Ohio Dam Safety Program dam inventory record for the Conesville Ash Pond Complex.
Transcript of American Electric Power - aep.com Electric Power 1 Riverside Plaza, 22nd ... Conesville Power Plant...

S&ME, Inc. | 6190 Enterprise Court | Dublin, OH 43016 | p 614.793.2226 | f 614.793.2410 | www.smeinc.com
October 7, 2016
American Electric Power
1 Riverside Plaza, 22nd Floor
Columbus, Ohio 43215
Attention: Mr. Brian G. Palmer
Reference: Ash Pond Complex CCR Surface Impoundment
Inflow Design Flood Assessment
Conesville Power Plant
Conesville, Ohio
S&ME Project No. 7217-14-009H
Ohio PE Firm License No. 03530
Dear Mr. Palmer:
In accordance with our proposal dated June 21, 2016 and your request for additional work, S&ME, Inc.
(S&ME) has completed an Inflow Design Flood Assessment of the ash pond complex at the Conesville
Power Plant in Conesville, Ohio. The Assessment was performed to fulfill the requirements of 40 CFR §
257.82(c)(1), Hydrologic and hydraulic capacity requirements for CCR surface impoundments-Inflow design
flood control system plan, of the USEPA Rules for Disposal of Coal Combustion Residuals from Electric
Facilities.
Background
The Conesville Generating Plant is located in Coshocton County, Ohio, east of the Muskingum River,
across from the town of Conesville. Adjacent to the plant is an approximate 100 acre ash pond complex
within which are a number of individual ponds or lagoons: Three fly ash ponds denoted as Fly Ash Pond A,
B and C, a bottom ash pond, and a Clearwater pond. The ponds are isolated from exterior surface water
inflow. The ponds are regularly dredged and the recovered fly ash and bottom ash is either beneficially
re-used or taken to the nearby Abandoned Mine Lands reclamation projects or the nearby residual waste
landfill. The separator dike between each lagoon is constructed of fly ash and bottom ash. The separator
dikes convey flow either through a pipe or through outlet structures. Because the ponds are
interconnected with pipes and outlet structures which equalize the water surface to a common normal
pool, the entire pond complex was treated as one hydraulic unit. For the purposes of this study, the
interior dikes and outlet devices within the pond complex were not included (or hydraulically modelled)
and a single maximum permitted water surface elevation was assumed across all ponds. This assumption
is consistent with the Ohio Dam Safety Program dam inventory record for the Conesville Ash Pond
Complex.

Ash Pond Complex CCR Surface Impoundment
Inflow Design Flood Assessment
Conesville Power Plant
Conesville, Ohio
S&ME Project No. 7217-14-009H
October 7, 2016 2
Previous Analyses
In 2010, BBC&M Engineering, Inc. performed a hydrologic and hydraulic (H&H) analyses of the Ash Pond
Complex which was used as a basis for the H&H study included in Attachment A.
Inflow Design Flood 257.82(a)(3)
The Ash Pond Complex is regulated by the Ohio Department of Natural Resources (ODNR) as a Class II
dam. An H&H study was previously performed in 2010 and a few inputs made in the previous analysis
have changed requiring updated analyses as described in Attachment A.
The objective of this study is to demonstrate that the Ash Pond Complex can safely pass the 50%
probable maximum flood (PMF) as required by ODNR. Per rule 257.82(A)(3)(ii), the Ash Pond is classified
as a significant hazard potential CCR surface impoundment which requires that the impoundment safely
pass the 1000-year flood. NOAA Point precipitation data for a location near the site is included in
Attachment B. A comparison of the 50% Probable Maximum Precipitation (PMP) rainfall depths and the
corresponding 1000 year depth estimates from NOAA Point precipitation data is included in Table 1
below:
Storm Duration ODNR 50% PMP Estimate NOAA 1,000-year Depth Estimate
6-HR 9.375 Inches 6.98 Inches
24-HR 13.25 Inches 9.30 Inches
As the 50% PMP represents a more severe event that the 1,000 year precipitation, the inflow design flood
used for this study was based on the 50% PMP. The 50% Probable Maximum Precipitation (PMP) was used
to estimate the 50% PMF based on revised rainfall depth estimates for the state of Ohio from a statewide
PMP study released by ODNR in 2013. The H&H study included as Attachment A demonstrates that the
facility has the capacity to manage the inflow design flood, as defined above, in a manner which meets
the requirements of 257.82(A)(3)(ii).
Flood Control Plan 257.82(c)
All stormwater runoff from the watershed and all plant inflows are currently discharged through the
Clearwater Pond outlet structure to a holding pond that feeds plant operations and ultimately discharges
to the Muskingum River. The Ash Pond Complex is designed to safely pass the 50% PMF without
overtopping the ash pond embankment, El. 770, via the Clearwater Pond outlet structure with normal pool
set to the maximum permitted operating pool elevation, El. 762. The H&H study included as Attachment A
suggests that the facility has the capacity to manage the inflow design flood in a manner which meets the
requirements of 257.82(A)(3)(ii).


Attachment A – Hydrologic and Hydraulic Study

Project Name: Conesville Ash Pond Complex H&H
Subject: Hydrologic and Hydraulic Study
Project No. 7217-14-009H Calc. No.
Discipline Water Resources Sheet 1 of 6
COVER SHEET
Ash Pond Complex
Hydrologic and Hydraulic Study
Computations By: Signature: Date 10-7-2016
Name: Matthew R. Marquis, P.E.
Title: Project Engineer
Reviewed By: Signature: Date 10-7-2016
Name: Stephen J. Loskota, P.E.
Title: Senior Project Engineer
0 First Issue MRM SJL 10/7/2016
No. Description By Review Date

Project Name: Conesville Ash Pond Complex
Subject: Hydrologic and Hydraulic Study
Project No.: 7217-14-009H Calc. By: MRM
REV By: SJL Date: 10/7/2016 Sheet 2 of 6
CALCULATION SHEET
Table of Contents
Objective ........................................................................................................................... 3
Project Background ......................................................................................................... 3
Hydrologic Study............................................................................................................. 3
Hydrology.......................................................................................................................................................3
Storage.............................................................................................................................................................4
Rainfall ............................................................................................................................................................4
Hydraulic Study............................................................................................................... 4
Ash Pond Outlet ............................................................................................................................................4
Plant Inflows...................................................................................................................................................5
Results / Discussion ........................................................................................................ 6
References ......................................................................................................................... 6
Appendices ....................................................................................................................... 6
Appendix A ....................................................................................................................................................6
List of TablesTable 1 – Ash Pond Complex Routing Results .......................................................................................6

Project Name: Conesville Ash Pond Complex
Subject: Hydrologic and Hydraulic Study
Project No.: 7217-14-009H Calc. By: MRM
REV By: SJL Date: 10/7/2016 Sheet 3 of 6
CALCULATION SHEET
Objective
The ash pond complex at the Conesville Generating Plant is a Class II dam according to the Ohio
Department of Natural Resources (ODNR) Division of Soil and Water. A Hydrologic and Hydraulic (H&H)
study was performed in 2010 and a few assumptions made in the previous analysis have changed
requiring updated analyses as described below:
1. The previous analysis identified low spots along the exterior dike which have been repaired . The
top of dike used in this study is elevation 770.
2. The PMF was updated to reflect current ODNR PMP Guidance.
3. The outlet pipe was originally assumed to be smaller than the actual 36-inch pipe as discovered
by a recent pipe inspection. The pipe size was updated in the outlet structure rating curve used in
this study.
The objective of this study is to demonstrate that the Ash Pond Complex can safely pass the 50%
probable maximum precipitation (PMP) as required by ODNR.
Project Background
The Conesville Generating Plant is located in Coshocton County, Ohio, east of the Muskingum River,
across from the town of Conesville. Adjacent to the plant is an approximate 100 acre ash pond complex
within which are a number of individual ponds or lagoons: Three fly ash ponds denoted as Fly Ash Pond A,
B and C, a bottom ash pond, and a Clearwater pond. The ponds are isolated from exterior surface water
inflow. The ponds are regularly dredged and the recovered fly ash and bottom ash is either being
beneficially re-used or taken to the nearby Abandoned Mine Lands reclamation projects or the nearby
residual waste landfill. The separator dike between each lagoon is constructed of fly ash and bottom ash.
The separator dikes convey flow either through a pipe or through outlet structures. Because the ponds
are interconnected with pipes and outlet structures which equalize the water surface to a common normal
pool, the entire pond complex was treated as one hydraulic unit. For the purposes of this study, the
interior dikes and outlet devices within the pond complex were not included (or hydraulically modelled)
and a single maximum permitted water surface elevation was assumed across all ponds. This assumption
is consistent with the Ohio Dam Safety Program dam inventory record for the Conesville Ash Pond
Complex.
Hydrologic Study
S&ME used the SCS method to estimate the peak discharge during the design storm event. A Hydrologic
and hydraulic analysis was conducted using the HydroCAD v.10 computer program to model the Ash
Pond Complex drainage area using the TR-20 methodology.
Hydrology
The ponds are completely isolated from exterior surface water inflow. The previous analysis performed in
2010 (BBCM, 2010) assumed a drainage area of approximately 128.64 Acres. The Curve number used in

Project Name: Conesville Ash Pond Complex
Subject: Hydrologic and Hydraulic Study
Project No.: 7217-14-009H Calc. By: MRM
REV By: SJL Date: 10/7/2016 Sheet 4 of 6
CALCULATION SHEET
this study was based on the value used in the previous hydrologic analysis performed in 2010 (BBCM,
2010). The Curve number was assumed to be 93 since the majority of the drainage area is open water. The
time of concentration of 30 minutes was obtained from the previous analysis (BBCM,2010).
Storage
The storage within the Ash Pond Complex was obtained from the previous analysis (BBCM, 2010). Storage
and surface area data is included in Appendix A, A.2.
Rainfall
The Ash Pond Complex has been identified as a Class II dam by ODNR, and as such must safely pass 50%
of the Probable Maximum Flood (PMF) in accordance with OAC Rule 1501:21-13-02. The Probable
Maximum Precipitation (PMP) was used to estimate the PMF based on revised rainfall depth estimates for
the state of Ohio from a statewide PMP study released by ODNR in 2013. Historic PMP values were
conservatively high to account for a higher level of uncertainty associated with the predicted values. When
the results of the latest ODNR study were found to reduce the precipitation values, new guidelines were
released on the appropriate use of the values in the hydrologic and hydraulic analysis of dams.
Specifically, the new guidelines require the evaluation of two separate rainfall distributions: a 24-hour SCS
Type II distribution commonly used in the Midwest but modified slightly by ONDR; and a 6-hour PMP
distribution developed by ODNR using techniques from Hydrometeorlogical Report No. 52. The
distributions are presented in Appendix A, A.3-A.6. The time step (which influences peak duration and
intensity) used in each distribution has been defined by ODNR. The more conservative event (the one
resulting in the higher peak water surface elevation) is used as the design event. Maps provided in
Appendix A, A.7-A.8, were used to estimate the total rainfall volumes applied to each of the two specified
rainfall distributions.
Hydraulic Study
The Ash Pond Complex outlet device was modeled using HydroCAD and hydraulic components used in
the study are described in more detail in the following sections. The HydroCAD reports for each rainfall
distribution scenario are included in Appendix A, A.15-A.28.
Ash Pond Outlet
The Ash Pond outlet device is a concrete structure with stop logs that control the normal pool and an
outlet pipe at the base of the structure to discharge flow from the Ash Pond. The stop logs are 4 feet long
and the logs are placed to set the normal pool to elevation 762 which corresponds to the maximum
permitted operating pool. The 36-inch concrete outlet pipe inside inlet elevation sits at approximately
elevation 750 and the outlet invert sits at elevation 730. The outlet pipe is approximately 300 feet long.
Each component of the outlet structure was evaluated separately using accepted engineering equations
and a composite rating curve was developed for the entire structure based on the limiting flow at each
incremental headwater elevation. The composite rating curve was used in HydroCAD to model the
outflow from the pond. A photo of the outlet structure is included below:

Project Name: Conesville Ash Pond Complex
Subject: Hydrologic and Hydraulic Study
Project No.: 7217-14-009H Calc. By: MRM
REV By: SJL Date: 10/7/2016 Sheet 5 of 6
CALCULATION SHEET
Date
:7/7
/2015
Ph
oto
gra
ph
er:
JDR
Location / Orientation Clear Water Pond Outlet
Remarks Concrete Stop Log Structure
The stop log structure rating curve was developed using a composite of a sharp-crested weir equation
with end contractions to simulate the concrete sidewalls and a broad-crested weir equation as the
headwater elevation climbs outside of the applicable range for the sharp-crested equation. The length of
the weir is the stop log length, 4 feet, and the height of the weir is the difference between the normal
pool elevation and the bottom of the structure, 12 feet. As the water falls over the weir and begins to fill
the void space within the structure, the flow transitions to orifice flow into the outlet pipe at the base of
the structure. The outlet pipe orifice flow was modeled using the orifice equation with the centroid of the
opening set to 1.5-feet above the invert of the pipe, elevation 751.5. As the headwater elevation rises, the
flow transitions to pipe pressure flow and the capacity of the pipe controls the outflow. The pipe pressure
flow was modeled using a simplified energy equation by solving for velocity and multiplying by the cross
sectional area to obtain the estimated flow capacity at incremental headwater elevations. The manning’s
roughness coefficient for the pipe was assumed to be 0.011 based on the HydroCD manual entry for a
clean straight concrete pipe. The final rating curve for the outlet structure was developed by choosing the
controlling flow at each incremental headwater elevation from all three primary flow types and the
calculations used to develop the curve are included in Appendix A, A.10-14.
Plant Inflows
Plant inflows to the Ash Pond Complex were obtained from a current water balance diagram obtained
from AEP. The diagram suggests that average daily flows to the Ash Pond total approximately 27.4 million
gallons per day (MGD) which approximately equals 42.4 cfs. The plant inflow was applied as a constant
base flow across the entire storm duration for both the 24-hour and 6-hour scenarios. A water balance
diagram used to estimate plant flows is included in the Appendix, A.9.

Project Name: Conesville Ash Pond Complex
Subject: Hydrologic and Hydraulic Study
Project No.: 7217-14-009H Calc. By: MRM
REV By: SJL Date: 10/7/2016 Sheet 6 of 6
CALCULATION SHEET
Results / Discussion
The results of the study are included in Table 1 below:
Table 1 – Ash Pond Complex Routing Results
Scenario HydroCAD WSEL Top of exterior Dike
ODNR 6-HR Dimensionless Distribution 763.3 770.0
ODNR 24-HR SCS Type-II Modified Distribution 764.1 770.0
The predicted maximum water surface elevation (WSEL) determined using HydroCad is lower than the
elevation of the exterior dike which suggests that the Ash Pond Complex can safely pass the 50% PMF in
accordance with the requirements of OAC Rule 1501:21-13-02.
References
BBCM Engineering, Inc. (2010). “Addendum to Bottom Ash Pond Investigation.” American Electric Power
Service Corp., December, 2010.
Chow, Ven Te. "Chapter 5 - Development of Uniform Flow and Its Formulas." Open-channel Hydraulics.
New York: McGraw-Hill, 1959. Print.
HydroCAD User Manual. Vers. 10.00. n.p.: HydroCAD Software Solutions LLC, Program documentation.
Appendices
Appendix A
♦ Site Plan [A.1]
♦ Ash Pond Complex Storage [A.2]
♦ ODNR PMP Application Guidelines [A.3-A.6]
♦ PMP Charts [A.7-A.8]
♦ Conesville Water Balance Diagram [A.9]
♦ Outlet Structure Rating Curve Calculations [A.10-A.14]
♦ HydroCAD Output Reports [A.15-A.28]


Area Avg Area Distance Volume Cum Volacres acres feet ac-ft ac-ft
730 70.00 070.60 5 353.00
735 71.20 353.073.20 5 366.00
740 75.20 719.076.50 10 765.00
750 77.80 1484.081.50 10 815.00
760 85.20 2299.085.50 6 513.00
766 85.80 2812.087.75 4 351.00
770 89.70 3163.0
Elevation
Conesville Bottom Ash Ponds - Storage Volume Computations
Values in area column are estimated to match volume data provided by AEP in previous HEC-1 analyses and are not considered precise.
68 70 72 74 76 78 80755
Surface Area (acres)
Bottom Ash Ponds - Surface Area/Storage/ElevationNote: Surface Area Values are Estimated
68 70 72 74 76 78 80
725
730
735
740
745
750
755
0 200 400 600 800 1000 1200 1400 1600
Surface Area (acres)
Elev
atio
n
Storage (acre-feet)
Bottom Ash Ponds - Surface Area/Storage/ElevationNote: Surface Area Values are Estimated
Storage (acre-feet) Surface Area (acres)
BBC&M Engineering Storage Volume.xls12/15/2010A.2 OF A.28

Page 1 of 4
Probable Maximum Precipitation ApplicationGuidelines
August 23, 2013
“Probable Maximum Precipitation Study for the State of Ohio” (April 2013, Applied Weather Associates,LLC) is acceptable and appropriate for determining Probable Maximum Precipitation (PMP) valuesunder Ohio Administrative Code Rule 1501:21-13-02. This study shall supersede HydrometeorologicalReport No. 51 (HMR51) by the National Weather Service for the purpose of determining design floodsfor dams within the division’s jurisdiction.
"Probable Maximum Flood" or "PMF" means the flood that may be expected from the most severecombination of critical meteorologic and hydrologic conditions that are reasonably possible in thedrainage basin under study. The "PMF" is derived from the PMP and is determined by using ahydrologic model to simulate the drainage basin's response to those critical conditions which producethe most severe flood runoff. Because each basin is different, it is necessary to simulate multipleflood events using different PMP durations to determine the most severe flood. The most severeflood would then be called the PMF. The table below provides guidance for application of PMP valuesfor determining the PMF for a given drainage basin.
DrainageBasin Size
StormDuration
Rainfall Depth and Spatial Extent Temporal Distribution
<1 mi2 6 hours Obtain the rainfall depth from the 1 mi2
PMP chart. The spatial extent of thestorm is 1 mi2.
Dimensionless Design StormDistributionA
24 hours Obtain the rainfall depth from the 1 mi2
PMP chart. The spatial extent of thestorm is 1 mi2.
SCS Type II at 1.5-hour time stepB
1 mi2 - 10 mi2 6 hours Determine the rainfall depth byinterpolation between 6-hour, 1 mi2 and6-hour, 10 mi2 PMP rainfall depths basedon the drainage basin size.C The spatialextent of the storm is equal to thedrainage basin size.
Dimensionless Design StormDistributionA
24 hours Determine the rainfall depth byinterpolation between 24-hour, 1 mi2 and24-hour, 10 mi2 PMP rainfall depthsbased on the drainage basin size.C Thespatial extent of the storm is equal to thedrainage basin size.
SCS Type II at 1.5-hour time stepB
>10 mi2 24 hours Use HMR52 (computer program) togenerate a 72-hour basin-specific storm(the time step should be set to 1 hour);extract the most severe 24 hours fromwithin the 72-hour stormD.
Use HMR52 (computer program) togenerate a 72-hour basin-specificstorm (the time step should be set to 1hour); extract the most severe 24hours from within the 72-hour stormD
72 hours Use HMR52 (computer program) togenerate a 72-hour basin-specific storm(the time step should be set to 1.5hours)D.
Use HMR52 (computer program) togenerate a 72-hour basin-specificstorm (the time step should be set to1.5 hours)D
A.3 OF A.28

Page 2 of 4
A The Dimensionless Design Storm Distribution is from NRCS, Technical Release 60 (July 2005).
Hr. Cum. Incr Hr. Cum. Incr Hr. Cum. Incr
0 0.000 0 2.2 0.379 0.150 4.2 0.856 0.020
0.2 0.013 0.013 2.4 0.530 0.150 4.4 0.875 0.019
0.4 0.026 0.013 2.6 0.625 0.095 4.6 0.893 0.018
0.6 0.041 0.015 2.8 0.670 0.045 4.8 0.910 0.017
0.8 0.058 0.017 3 0.705 0.035 5 0.927 0.016
1 0.077 0.019 3.2 0.736 0.031 5.2 0.942 0.016
1.2 0.098 0.021 3.4 0.764 0.028 5.4 0.957 0.015
1.4 0.121 0.023 3.6 0.790 0.026 5.6 0.972 0.015
1.6 0.146 0.025 3.8 0.814 0.024 5.8 0.986 0.014
1.8 0.179 0.033 4 0.836 0.022 6 1.000 0.014
2 0.229 0.050
B The SCS Type II distribution at a 1.5-hour time step is shown below. The time step has beenmodified from the original distribution to provide peak intensities that are appropriate for Ohio storms.Please note that computer programs that use the original SCS Type II distribution will likely generatea flood peak that is inappropriately high.
Hr. Cum. Incr Hr. Cum. Incr
0 0 0 12 0.663 0.459
1.5 0.016 0.016 13.5 0.799 0.136
3 0.035 0.018 15 0.854 0.055
4.5 0.056 0.021 16.5 0.891 0.038
6 0.080 0.024 18 0.921 0.029
7.5 0.109 0.029 19.5 0.945 0.024
9 0.147 0.038 21 0.965 0.021
10.5 0.204 0.058 22.5 0.984 0.018
12 0.663 0.459 24 1 0.016
A.4 OF A.28
Page 3 of 4
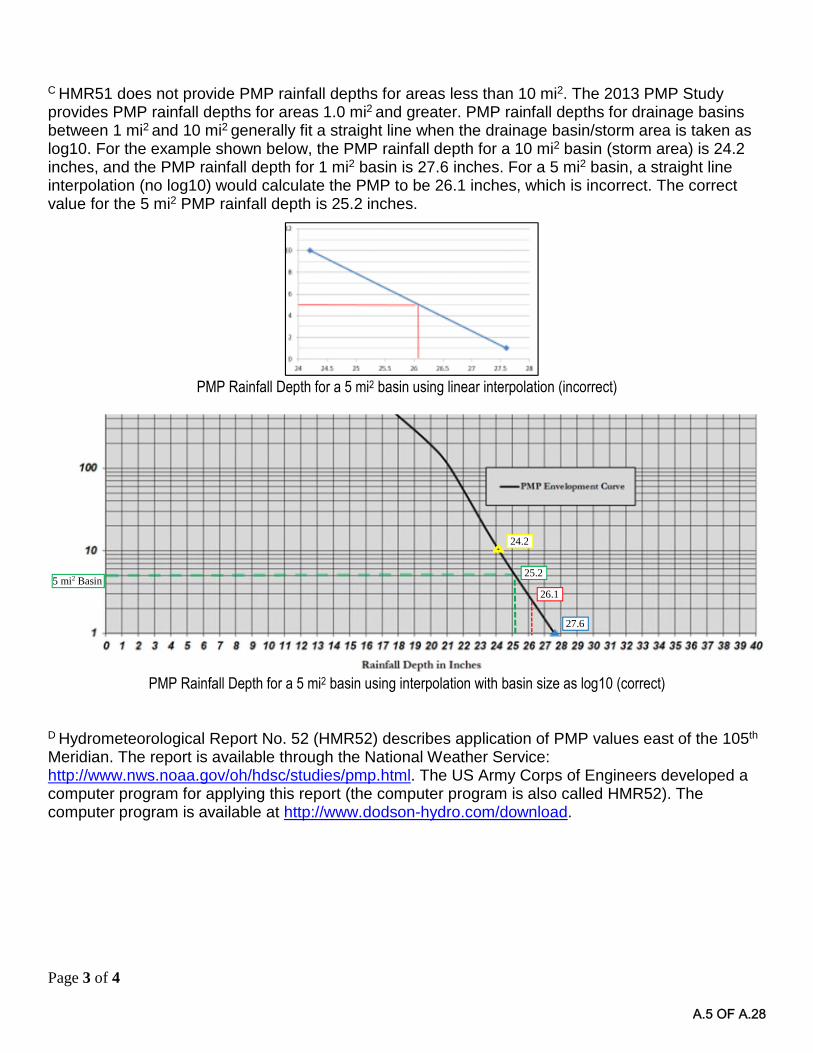
C HMR51 does not provide PMP rainfall depths for areas less than 10 mi2. The 2013 PMP Studyprovides PMP rainfall depths for areas 1.0 mi2 and greater. PMP rainfall depths for drainage basinsbetween 1 mi2 and 10 mi2 generally fit a straight line when the drainage basin/storm area is taken aslog10. For the example shown below, the PMP rainfall depth for a 10 mi2 basin (storm area) is 24.2inches, and the PMP rainfall depth for 1 mi2 basin is 27.6 inches. For a 5 mi2 basin, a straight lineinterpolation (no log10) would calculate the PMP to be 26.1 inches, which is incorrect. The correctvalue for the 5 mi2 PMP rainfall depth is 25.2 inches.
PMP Rainfall Depth for a 5 mi2 basin using linear interpolation (incorrect)
PMP Rainfall Depth for a 5 mi2 basin using interpolation with basin size as log10 (correct)
D Hydrometeorological Report No. 52 (HMR52) describes application of PMP values east of the 105th
Meridian. The report is available through the National Weather Service:http://www.nws.noaa.gov/oh/hdsc/studies/pmp.html. The US Army Corps of Engineers developed acomputer program for applying this report (the computer program is also called HMR52). Thecomputer program is available at http://www.dodson-hydro.com/download.
24.2
27.6
25.2
26.15 mi2 Basin
A.5 OF A.28

Page 4 of 4
Comments:In past analyses, there was confidence that the PMP values from HMR51 and the rainfall distributionswere very conservative. The new PMP values and distributions no longer provide an additional safetyfactor; therefore, it is important to assure that appropriate, justified hydrologic parameters are used.Important items that need to be specifically addressed and documented in a hydrologic study for adam are listed below:
- More detailed investigation of the time of concentration/lag time- Justification for unit hydrograph duration- When assessing infiltration/runoff using curve numbers, specifically address connected
impervious, and the “Quality Cover” should be no higher than “fair” unless specifically justified.
Important References:Natural Resources Conservation Service, National Engineering HandbookPart 628 Dams, Chapter 50 Earth Spillway Design (1997)Part 630 Hydrology, Chapter 9 Hydrologic Soil-Cover Complexes (2004), Chapter 15 Time ofConcentration (2010), Chapter 16 Hydrographs (2007)
Natural Resources Conservation Service, Conservation Engineering DivisionEarth Dams and Reservoirs, TR–60, July 2005
US Army Corps of Engineers, Hydrologic Engineering CenterHEC-1, Flood Hydrograph Package, User’s Manual (1998)
A.6 OF A.28

A.7 OF A.28

A.8 OF A.28

0.28
4
Wel
lin
take
scre
enw
ash
wat
er
EV
APex
cess
raw
wat
erre
turn
0.00
3
0.04
1
0.03
3
0.17
5
EV
AP
EV
AP
Precipitation
Pla
ntIn
take
EV
AP
001
&09
1002
601
&69
1
Pre
cipi
tatio
n
Offs
iteR
un-o
n
602
0.00
6
EV
AP
0.45
8
1.44
1.44
0.20
0.02
1
0.01
9
16.8
5
0.01
2
1.97
71.
43
22.9
2.23
0.79
0.20
2
10.4
1
11.2
11.8
69
1.45
9
1.44
0.19
0.434
0.08
7
0.07
9
0.47
3
3.82
1.33
9 0.13
4
27.6
09
1.62
6
1.95
7
0.33
1
0.01
0
0.00
1
0.00
1
15.4
84
13.8
54
0.68
5
0.00
20.
329
AE
PG
ener
atio
nR
eso
urc
esIn
c.C
on
esvi
lleP
lan
tW
ater
Bal
ance
Dia
gra
m
Wat
er&
Eco
logi
cal
Res
ourc
eS
ervi
ces
Rev
ised
01.0
1.14
##-O
utfa
llnu
mbe
r
NO
TE
S:
Flo
ws
are
base
don
desi
gnflo
ws
inM
GD
.
Pre
cipi
tatio
nis
assu
min
g39
”/ye
ar.
Uni
ts1/
2ci
rcul
atio
nw
ater
are
noti
nclu
ded
sinc
eth
eyha
vebe
enre
tired
.
Hol
ding
Pon
d
607
U2A
Bui
ldin
gS
ump
Uni
t4F
GD
Mak
eup
Wat
erS
train
ers
Uni
t4F
GD
CP
SW
WT
P
Uni
ts1-
3S
ewag
eT
reat
men
tP
lant
Ash
Pon
d
Pla
ntS
ervi
ceW
ater
Coa
lPile
&U
4G
ypsu
mP
ileR
un-O
ff
Uni
ts5-
6A
shS
luic
eW
ater
Uni
ts5-
6F
GD
Sys
tem
Met
alC
lean
ing
Was
te
Uni
t4S
CR
Rea
gent
Uni
t4F
GD
EV
AP
608
Sto
rmW
ater
Out
fall
Uni
t4B
oile
rWat
er
Uni
ts5-
6B
oile
rWat
erWat
erP
re-T
reat
men
t
Uni
ts4-
6C
oolin
gT
ower
Blo
wdo
wn
Uni
t4F
GD
Are
aO
/WS
EP
Uni
t4A
shS
luic
eW
ater
Pre
p.P
lant
Wel
ls
0.00
9Uni
ts4-
6S
ewag
eT
reat
men
tP
lant
Yar
d&
Pla
ntA
rea
Run
off
0.43
0
Uni
t4B
oile
rC
anno
ns
FG
DLa
ndfil
lS
ludg
e–
1,77
6T
PD
EV
AP
0.01
2
0.49
1
0.49
2
801
605
604
SW(MuskingumRiver)
Sew
age
Slu
dge
0.87
4T
PY
588
588
0.08
41.5
41
22.2
36
25.9
1
3.01
9
Slu
dge
0.01
0
22.2
3
A.9 OF A.28

Project: Conesville Ash Pond Complex H&H
Location: Coshocton, Ohio
Project Number: 7217-14-009H
Calculated By: MRM Date: 10/3/2016
Reviewed By: Date:
Source: Hydraulic Engineering Circular No. 22, Third Edition
Urban Drainage Design Manual (Rev. 2013)
Value Units
Pool Elevation = 762 Feet MSL
Length of Weir = 4.0 Feet
Height of Weir = 12.0 Feet From 2010 Analysis
762.00 4.0 12.00 0.00 3.33 0.0
763.00 4.0 12.00 0.08 3.33 12.7
764.00 4.0 12.00 0.17 3.33 33.9
765.00 4.0 12.00 0.25 3.33 58.8
766.00 4.0 12.00 0.33 3.40 87.1
767.00 4.0 12.00 0.42 3.44 115.3
768.00 4.0 12.00 0.50 3.47 142.8
769.00 4.0 12.00 0.58 3.50 168.7
770.00 4.0 12.00 0.67 3.54 192.1
771.00 4.0 12.00 0.75 3.57 212.1
772.00 4.0 12.00 0.83 3.60 227.9
* Cscw = 3.33 when H/Hc < 0.3
Clearwater Pond - Sharp Crested Weir Flow
Description
Maximum Normal Operating Pool
From 2010 Analysis
Headwater Elevation (FT) L, Length (feet) Hc, Feet H/HcCscw,
Coefficient*Q, Orifice Discharge (CFS)
[Use EQ 8-20]
S&ME, Inc.CWP_Final Case.xls
10/4/2016
A.10 OF A.28

Project: Conesville Ash Pond Complex H&H
Location: Coshocton, Ohio
Project Number: 7217-14-009H
Calculated By: MRM Date: 10/3/2016
Reviewed By: Date:
Source: Hydraulic Engineering Circular No. 22, Third Edition
Urban Drainage Design Manual (Rev. 2013)
Value Units
Pool Elevation = 762 Feet MSL
Width = 4.0 Feet
762.00 3.32 0.00 0.0
763.00 3.32 4.00 13.3
764.00 3.32 8.00 37.6
765.00 3.32 12.00 69.0
766.00 3.32 16.00 106.2
767.00 3.32 20.00 148.5
768.00 3.32 24.00 195.2
769.00 3.32 28.00 245.9
770.00 3.32 32.00 300.5
771.00 3.32 36.00 358.6
772.00 3.32 40.00 420.0
Cbcw, Coefficient
10.00
0.00
1.00
2.00
3.00
4.00
5.00
6.00
7.00
Ao (SF) Q, Discharge (CFS)Ho (FT)
8.00
9.00
Clearwater Pond - Broad Crested Weir Flow
Description
Maximum Normal Operating Pool
From 2010 Analysis
Headwater Elevation (FT)
S&ME, Inc.CWP_Final Case.xls
10/4/2016
A.11 OF A.28

Project: Conesville Ash Pond Complex H&H
Location: Coshocton, Ohio
Project Number: 7217-14-009H
Calculated By: MRM Date: 10/3/2016
Reviewed By: Date:
Source: Hydraulic Engineering Circular No. 22, Third Edition
Urban Drainage Design Manual (Rev. 2013)
Value Units
Pool Elevation = 762 Feet MSL
Diameter = 36.0 Inches
Orifice Elevation = 751.50 Feet MSL
Co = 0.6 (0.4-0.6)
762.00 0.6 7.07 10.50 36.2 116.9
763.00 0.6 7.07 11.50 37.2 124.1
764.00 0.6 7.07 12.50 38.2 131.1
765.00 0.6 7.07 13.50 39.2 138.0
766.00 0.6 7.07 14.50 40.2 144.8
767.00 0.6 7.07 15.50 41.2 151.6
768.00 0.6 7.07 16.50 42.2 158.3
769.00 0.6 7.07 17.50 43.2 164.9
770.00 0.6 7.07 18.50 41.2 165.6
771.00 0.6 7.07 19.50 42.2 172.1
772.00 0.6 7.07 20.50 43.2 178.5
Clearwater Pond - Pipe Inlet Flow
Description
Maximum Normal Operating Pool
Inside Diameter of Orifice
Controid Elevation of Orifice (750 + 1.5ft)
Use 0.6 for circular pipe with square edges
Headwater Elevation (FT) Co, Coefficient Ao (SF) Ho (FT) g (FT/S^2) Q, Orifice Discharge (CFS)
S&ME, Inc.CWP_Final Case.xls
10/4/2016
A.12 OF A.28

Project: Conesville Ash Pond Complex H&H
Location: Coshocton, Ohio
Project Number: 7217-14-009H
Calculated By: MRM Date: 10/3/2016
Reviewed By: Date:
Sources: Hydraulic Engineering Circular No. 22, Third Edition, Urban Drainage Design Manual (Rev. 2013)
Oho Department of Transportation, Hydraulics Manual, Chapter 8, Appendix A
Value Units Description
Manning's n = 0.011 Based on Concrete Pipe, straight, (Chow, 1959)
Inlet Invert = 750 Feet msl
Outlet Invert (z2) = 730 Feet msl
Entrance Coefficent (Ke) = 0.5
Expansion Coefficent (Ko) = 1
Bend Coefficent (Kb) = 0
Pipe Diameter (D) = 3 Feet From Pipe Inspection
Pipe Length (L) = 300 FeetDarcy-Weisbach (f) = 0.016 Relate Manning's n to Darcy-Weisbach friction factor
Gravity Constant (g) = 32.2 Feet/sec^2
ENERGY EQUATION
762.00 22.55 7.07 159.4
763.00 22.90 7.07 161.9
764.00 23.25 7.07 164.3
765.00 23.59 7.07 166.7 HEAD LOSS EQUATION
766.00 23.92 7.07 169.1
767.00 24.25 7.07 171.4
768.00 24.58 7.07 173.7
769.00 24.90 7.07 176.0
770.00 25.21 7.07 178.2 SOLVE FOR VELOCITY
771.00 25.53 7.07 180.4
772.00 25.84 7.07 182.6
Clearwater Pond - Pipe Pressure Flow36" Concrete Outlet Pipe
Headwater Elevation (z1) (FT) Velocity (FPS) Area (SF) Flow (CFS)
3
1
2185
D
nf =
∑+++=++ Lhzg
vpz
g
vp2
222
1
211
22 γγ
∑
+++= boeL KKK
D
Lf
g
vh
2
2
( )
++++
−=
boe KKKD
Lf
zzgv
1
2 21
VAQ =
A.13 OF A.28

fee
tcf
scf
scf
sc
fsM
GD
76
2.0
00
.00
.01
16
.91
59
.40
.00
.0S
top
Lo
gF
low
Sh
arp
We
ir*
76
3.0
01
2.7
13
.31
24
.11
61
.91
2.7
8.2
Sto
pL
og
Flo
wS
ha
rpW
eir*
76
4.0
03
3.9
37
.61
31
.11
64
.33
3.9
21
.9S
top
Lo
gF
low
Sh
arp
We
ir*
76
5.0
05
8.8
69
.01
38
.01
66
.76
9.0
44
.6S
top
Lo
gF
low
Bro
ad
We
ir
76
6.0
08
7.1
10
6.2
14
4.8
16
9.1
10
6.2
68
.7S
top
Lo
gF
low
Bro
ad
We
ir
76
7.0
01
15
.31
48
.51
51
.61
71
.41
48
.59
6.0
Sto
pL
og
Flo
wB
roa
dW
eir
76
8.0
01
42
.81
95
.21
58
.31
73
.71
58
.31
02
.3P
ipe
Inle
tF
low
76
9.0
01
68
.72
45
.91
64
.91
76
.01
64
.91
06
.6P
ipe
Inle
tF
low
77
0.0
01
92
.13
00
.51
65
.61
78
.21
65
.61
07
.0P
ipe
Inle
tF
low
77
1.0
02
12
.13
58
.61
72
.11
80
.41
72
.11
11
.2P
ipe
Inle
tF
low
77
2.0
02
27
.94
20
.01
78
.51
82
.61
78
.51
15
.4P
ipe
Inle
tF
low
*Equ
atio
n[8
-20
]fr
om
HE
C-2
2o
nly
ap
plic
ab
lefo
rra
nge
of
valu
es
wh
en
L>
3H
.A
fte
re
leva
tion
76
4th
eb
roa
d-c
rest
ed
we
ire
qu
atio
nis
mo
rea
pp
rop
ria
te.
La
keE
leva
tion
Pre
ssu
reP
ipe
Flo
wC
on
tro
l
Flo
w
Pip
eIn
let
Flo
w
Cle
arw
ate
rP
on
dO
utl
et
Str
uc
ture
Ca
pa
cit
y-
Ca
se
4
To
tal
Ou
tflo
wC
on
tro
lTyp
e
Sto
pL
og
Flo
wS
ha
rpW
eir*
Sto
pL
og
Flo
wB
roa
dW
eir
S&
ME
,In
c.C
WP
_F
ina
lCa
se.x
ls1
0/4
/20
16
A.14 OF A.28

1S
Ash Pond DA
2P
Ash Pond Complex
4L
Plant Inflows
Routing Diagram for Clear Water Pond 6-HR HMSPrepared by S&ME, Inc., Printed 10/7/2016
HydroCAD® 10.00-15 s/n 08472 © 2015 HydroCAD Software Solutions LLC
Subcat Reach Pond Link
A.15 OF A.28

Clear Water Pond 6-HR HMSPrinted 10/7/2016Prepared by S&ME, Inc.
Page 2HydroCAD® 10.00-15 s/n 08472 © 2015 HydroCAD Software Solutions LLC
Area Listing (all nodes)
Area
(acres)
CN Description
(subcatchment-numbers)
128.640 93 (1S)
A.16 OF A.28

E 6-hr 6-HR Rainfall=9.37"Clear Water Pond 6-HR HMSPrinted 10/7/2016Prepared by S&ME, Inc.
Page 3HydroCAD® 10.00-15 s/n 08472 © 2015 HydroCAD Software Solutions LLC
Summary for Subcatchment 1S: Ash Pond DA
Runoff = 726.79 cfs @ 2.76 hrs, Volume= 91.373 af, Depth= 8.52"
Runoff by SCS TR-20 method, UH=SCS, Weighted-CN, Time Span= 0.00-72.00 hrs, dt= 0.01 hrsE 6-hr 6-HR Rainfall=9.37"
Area (ac) CN Description
* 128.640 93
128.640 100.00% Pervious Area
Tc Length Slope Velocity Capacity Description(min) (feet) (ft/ft) (ft/sec) (cfs)
30.0 Direct Entry,
Subcatchment 1S: Ash Pond DA
Runoff
Hydrograph
Time (hours)727068666462605856545250484644424038363432302826242220181614121086420
Flo
w(c
fs)
800
750
700
650
600
550
500
450
400
350
300
250
200
150
100
50
0
E 6-hr
6-HR Rainfall=9.37"
Runoff Area=128.640 ac
Runoff Volume=91.373 af
Runoff Depth=8.52"
Tc=30.0 min
CN=93
726.79 cfs
A.17 OF A.28

E 6-hr 6-HR Rainfall=9.37"Clear Water Pond 6-HR HMSPrinted 10/7/2016Prepared by S&ME, Inc.
Page 4HydroCAD® 10.00-15 s/n 08472 © 2015 HydroCAD Software Solutions LLC
Summary for Pond 2P: Ash Pond Complex
Inflow Area = 128.640 ac, 0.00% Impervious, Inflow Depth = 10.49" for 6-HR eventInflow = 769.19 cfs @ 2.76 hrs, Volume= 112.433 afOutflow = 18.14 cfs @ 6.60 hrs, Volume= 64.893 af, Atten= 98%, Lag= 230.2 minPrimary = 18.14 cfs @ 6.60 hrs, Volume= 64.893 af
Routing by Dyn-Stor-Ind method, Time Span= 0.00-72.00 hrs, dt= 0.01 hrs / 3Starting Elev= 762.00' Surf.Area= 0.000 ac Storage= 2,470.000 afPeak Elev= 763.26' @ 6.60 hrs Surf.Area= 0.000 ac Storage= 2,577.429 af (107.429 af above start)Flood Elev= 770.00' Surf.Area= 0.000 ac Storage= 3,163.000 af (693.000 af above start)
Plug-Flow detention time= (not calculated: initial storage exceeds outflow)Center-of-Mass det. time= 1,734.8 min ( 1,932.7 - 197.9 )
Volume Invert Avail.Storage Storage Description
#1 730.00' 3,300.000 af Custom Stage Data Listed below
Elevation Cum.Store(feet) (acre-feet)
730.00 0.000735.00 353.000740.00 719.000750.00 1,484.000760.00 2,299.000766.00 2,812.000770.00 3,163.000771.00 3,200.000772.00 3,300.000
Device Routing Invert Outlet Devices
#1 Primary 762.00' Special & User-DefinedElev. (feet) 762.00 763.00 764.00 765.00 766.00 767.00 768.00769.00 770.00 771.00 772.00Disch. (cfs) 0.000 12.700 33.900 69.000 106.200 148.500158.300 164.900 165.600 172.100 178.500
Primary OutFlow Max=18.14 cfs @ 6.60 hrs HW=763.26' (Free Discharge)1=Special & User-Defined (Custom Controls 18.14 cfs)
A.18 OF A.28

E 6-hr 6-HR Rainfall=9.37"Clear Water Pond 6-HR HMSPrinted 10/7/2016Prepared by S&ME, Inc.
Page 5HydroCAD® 10.00-15 s/n 08472 © 2015 HydroCAD Software Solutions LLC
Pond 2P: Ash Pond Complex
InflowPrimary
Hydrograph
Time (hours)727068666462605856545250484644424038363432302826242220181614121086420
Flo
w(c
fs)
850
800
750
700
650
600
550
500
450
400
350
300
250
200
150
100
50
0
Inflow Area=128.640 ac
Peak Elev=763.26'
Storage=2,577.429 af
769.19 cfs
18.14 cfs
Pond 2P: Ash Pond Complex
Primary
Stage-Discharge
Discharge (cfs)1701601501401301201101009080706050403020100
Ele
va
tio
n(f
ee
t)
772
770
768
766
764
762
760
758
756
754
752
750
748
746
744
742
740
738
736
734
732
730
Special & User-Defined
A.19 OF A.28

E 6-hr 6-HR Rainfall=9.37"Clear Water Pond 6-HR HMSPrinted 10/7/2016Prepared by S&ME, Inc.
Page 6HydroCAD® 10.00-15 s/n 08472 © 2015 HydroCAD Software Solutions LLC
Pond 2P: Ash Pond Complex
Storage
Stage-Area-Storage
Storage (acre-feet)3,2003,0002,8002,6002,4002,2002,0001,8001,6001,4001,2001,0008006004002000
Ele
va
tio
n(f
ee
t)
772
770
768
766
764
762
760
758
756
754
752
750
748
746
744
742
740
738
736
734
732
730
Starting Elevation
Flood Elevation
Custom Stage Data
A.20 OF A.28

E 6-hr 6-HR Rainfall=9.37"Clear Water Pond 6-HR HMSPrinted 10/7/2016Prepared by S&ME, Inc.
Page 7HydroCAD® 10.00-15 s/n 08472 © 2015 HydroCAD Software Solutions LLC
Summary for Link 4L: Plant Inflows
Inflow = 42.40 cfs @ 0.00 hrs, Volume= 21.060 afPrimary = 42.40 cfs @ 0.00 hrs, Volume= 21.060 af, Atten= 0%, Lag= 0.0 min
Primary outflow = Inflow, Time Span= 0.00-72.00 hrs, dt= 0.01 hrs
2 Point manual hydrograph, To= 0.00 hrs, dt= 6.00 hrs, cfs =42.40 42.40
Link 4L: Plant Inflows
InflowPrimary
Hydrograph
Time (hours)727068666462605856545250484644424038363432302826242220181614121086420
Flo
w(c
fs)
46
44
42
4038
36
34
3230
28
26
24
2220
18
16
1412
10
8
64
2
0
Manual Hydrograph42.40 cfs
42.40 cfs
A.21 OF A.28

1S
Ash Pond DA
2P
Ash Pond Complex4L
Plant Inflows
Routing Diagram for Clear Water Pond 24-HR HMSPrepared by S&ME, Inc., Printed 10/4/2016
HydroCAD® 10.00-15 s/n 08472 © 2015 HydroCAD Software Solutions LLC
Subcat Reach Pond Link
A.22 OF A.28

Clear Water Pond 24-HR HMSPrinted 10/4/2016Prepared by S&ME, Inc.
Page 2HydroCAD® 10.00-15 s/n 08472 © 2015 HydroCAD Software Solutions LLC
Area Listing (all nodes)
Area
(acres)
CN Description
(subcatchment-numbers)
128.640 93 (1S)
A.23 OF A.28

E 24-hr 24-HR Rainfall=13.25"Clear Water Pond 24-HR HMSPrinted 10/4/2016Prepared by S&ME, Inc.
Page 3HydroCAD® 10.00-15 s/n 08472 © 2015 HydroCAD Software Solutions LLC
Summary for Subcatchment 1S: Ash Pond DA
Runoff = 495.27 cfs @ 12.26 hrs, Volume= 132.796 af, Depth=12.39"
Runoff by SCS TR-20 method, UH=SCS, Weighted-CN, Time Span= 0.00-72.00 hrs, dt= 0.01 hrsE 24-hr 24-HR Rainfall=13.25"
Area (ac) CN Description
* 128.640 93
128.640 100.00% Pervious Area
Tc Length Slope Velocity Capacity Description(min) (feet) (ft/ft) (ft/sec) (cfs)
18.0 Direct Entry,
Subcatchment 1S: Ash Pond DA
Runoff
Hydrograph
Time (hours)727068666462605856545250484644424038363432302826242220181614121086420
Flo
w(c
fs)
550
500
450
400
350
300
250
200
150
100
50
0
E 24-hr
24-HR Rainfall=13.25"
Runoff Area=128.640 ac
Runoff Volume=132.796 af
Runoff Depth=12.39"
Tc=18.0 min
CN=93
495.27 cfs
A.24 OF A.28

E 24-hr 24-HR Rainfall=13.25"Clear Water Pond 24-HR HMSPrinted 10/4/2016Prepared by S&ME, Inc.
Page 4HydroCAD® 10.00-15 s/n 08472 © 2015 HydroCAD Software Solutions LLC
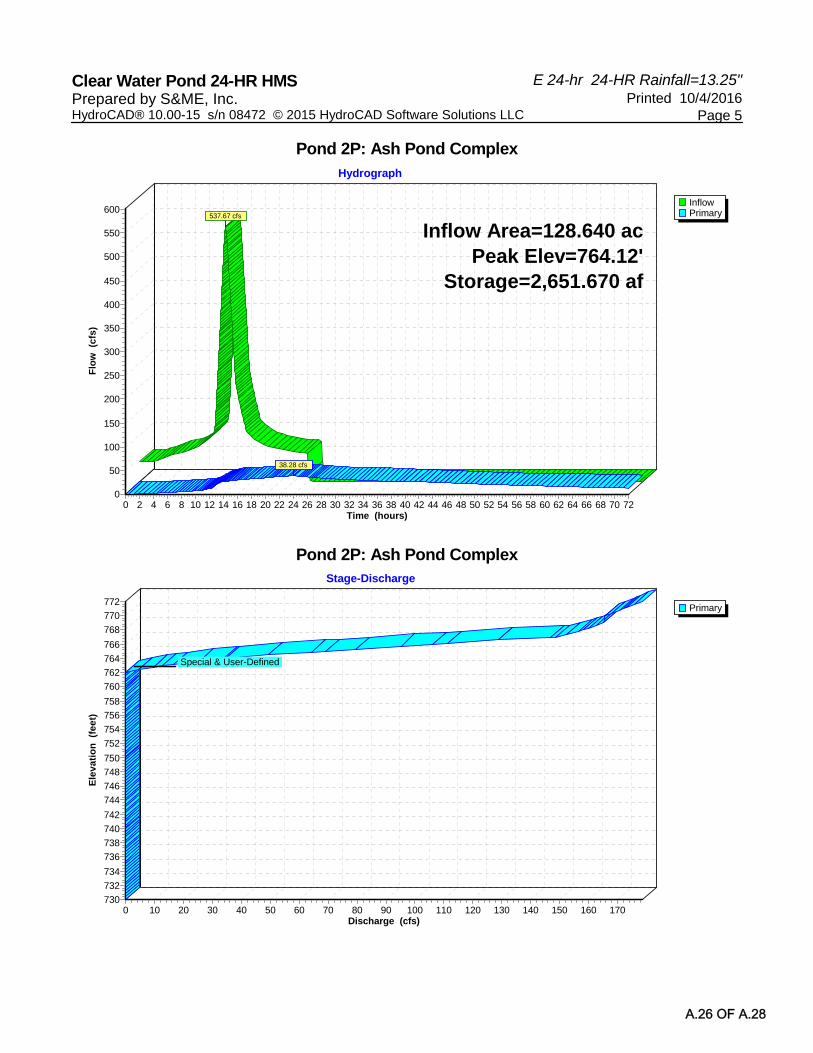
Summary for Pond 2P: Ash Pond Complex
Inflow Area = 128.640 ac, 0.00% Impervious, Inflow Depth = 20.24" for 24-HR eventInflow = 537.67 cfs @ 12.26 hrs, Volume= 216.930 afOutflow = 38.28 cfs @ 24.01 hrs, Volume= 127.475 af, Atten= 93%, Lag= 704.6 minPrimary = 38.28 cfs @ 24.01 hrs, Volume= 127.475 af
Routing by Dyn-Stor-Ind method, Time Span= 0.00-72.00 hrs, dt= 0.01 hrs / 3Starting Elev= 762.00' Surf.Area= 0.000 ac Storage= 2,470.000 afPeak Elev= 764.12' @ 24.01 hrs Surf.Area= 0.000 ac Storage= 2,651.670 af (181.670 af above start)Flood Elev= 770.00' Surf.Area= 0.000 ac Storage= 3,163.000 af (693.000 af above start)
Plug-Flow detention time= (not calculated: initial storage exceeds outflow)Center-of-Mass det. time= 1,445.7 min ( 2,208.1 - 762.4 )
Volume Invert Avail.Storage Storage Description
#1 730.00' 3,300.000 af Custom Stage Data Listed below
Elevation Cum.Store(feet) (acre-feet)
730.00 0.000735.00 353.000740.00 719.000750.00 1,484.000760.00 2,299.000766.00 2,812.000770.00 3,163.000771.00 3,200.000772.00 3,300.000
Device Routing Invert Outlet Devices
#1 Primary 762.00' Special & User-DefinedElev. (feet) 762.00 763.00 764.00 765.00 766.00 767.00 768.00769.00 770.00 771.00 772.00Disch. (cfs) 0.000 12.700 33.900 69.000 106.200 148.500158.300 164.900 165.600 172.100 178.500
Primary OutFlow Max=38.28 cfs @ 24.01 hrs HW=764.12' (Free Discharge)1=Special & User-Defined (Custom Controls 38.28 cfs)
A.25 OF A.28
E 24-hr 24-HR Rainfall=13.25"Clear Water Pond 24-HR HMSPrinted 10/4/2016Prepared by S&ME, Inc.
Page 5HydroCAD® 10.00-15 s/n 08472 © 2015 HydroCAD Software Solutions LLC
Pond 2P: Ash Pond Complex
InflowPrimary
Hydrograph
Time (hours)727068666462605856545250484644424038363432302826242220181614121086420
Flo
w(c
fs)
600
550
500
450
400
350
300
250
200
150
100
50
0
Inflow Area=128.640 ac
Peak Elev=764.12'
Storage=2,651.670 af
537.67 cfs
38.28 cfs
Pond 2P: Ash Pond Complex
Primary
Stage-Discharge
Discharge (cfs)1701601501401301201101009080706050403020100
Ele
va
tio
n(f
ee
t)
772
770
768
766
764
762
760
758
756
754
752
750
748
746
744
742
740
738
736
734
732
730
Special & User-Defined
A.26 OF A.28

E 24-hr 24-HR Rainfall=13.25"Clear Water Pond 24-HR HMSPrinted 10/4/2016Prepared by S&ME, Inc.
Page 6HydroCAD® 10.00-15 s/n 08472 © 2015 HydroCAD Software Solutions LLC
Pond 2P: Ash Pond Complex
Storage
Stage-Area-Storage
Storage (acre-feet)3,2003,0002,8002,6002,4002,2002,0001,8001,6001,4001,2001,0008006004002000
Ele
va
tio
n(f
ee
t)
772
770
768
766
764
762
760
758
756
754
752
750
748
746
744
742
740
738
736
734
732
730
Starting Elevation
Flood Elevation
Custom Stage Data
A.27 OF A.28

E 24-hr 24-HR Rainfall=13.25"Clear Water Pond 24-HR HMSPrinted 10/4/2016Prepared by S&ME, Inc.
Page 7HydroCAD® 10.00-15 s/n 08472 © 2015 HydroCAD Software Solutions LLC
Summary for Link 4L: Plant Inflows
Inflow = 42.40 cfs @ 0.00 hrs, Volume= 84.134 afPrimary = 42.40 cfs @ 0.00 hrs, Volume= 84.134 af, Atten= 0%, Lag= 0.0 min
Primary outflow = Inflow, Time Span= 0.00-72.00 hrs, dt= 0.01 hrs
2 Point manual hydrograph, To= 0.00 hrs, dt= 24.00 hrs, cfs =42.40 42.40
Link 4L: Plant Inflows
InflowPrimary
Hydrograph
Time (hours)727068666462605856545250484644424038363432302826242220181614121086420
Flo
w(c
fs)
46
44
42
4038
36
34
3230
28
26
24
2220
18
16
1412
10
8
64
2
0
Manual Hydrograph42.40 cfs
42.40 cfs
A.28 OF A.28

Attachment B – NOAA Point Precipitation Data

NOAA Atlas 14, Volume 2, Version 3Location name: Conesville, Ohio, USA*Latitude: 40.1885°, Longitude: -81.8707°
Elevation: 755.2 ft*** source: ESRI Maps
** source: USGS
POINT PRECIPITATION FREQUENCY ESTIMATES
G.M. Bonnin, D. Martin, B. Lin, T. Parzybok, M.Yekta, and D. Riley
NOAA, National Weather Service, Silver Spring, Maryland
PF_tabular | PF_graphical | Maps_&_aerials
PF tabular
PDS-based point precipitation frequency estimates with 90% confidence intervals (in inches)1
DurationAverage recurrence interval (years)
1 2 5 10 25 50 100 200 500 1000
5-min0.338
(0.306-0.374)0.405
(0.366-0.448)0.490
(0.442-0.541)0.555
(0.499-0.612)0.638
(0.573-0.703)0.701
(0.627-0.771)0.762
(0.679-0.838)0.826
(0.733-0.908)0.910
(0.802-1.00)0.972
(0.852-1.07)
10-min0.525
(0.475-0.582)0.633
(0.572-0.700)0.762
(0.687-0.841)0.857
(0.771-0.945)0.975
(0.876-1.08)1.06
(0.950-1.17)1.15
(1.02-1.26)1.23
(1.09-1.36)1.34
(1.18-1.47)1.42
(1.24-1.56)
15-min0.644
(0.582-0.713)0.774
(0.699-0.856)0.935
(0.844-1.03)1.05
(0.949-1.16)1.21
(1.08-1.33)1.32
(1.18-1.45)1.43
(1.27-1.57)1.53
(1.36-1.69)1.67
(1.47-1.83)1.77
(1.55-1.95)
30-min0.852
(0.771-0.943)1.04
(0.936-1.15)1.28
(1.16-1.41)1.46
(1.32-1.61)1.70
(1.53-1.87)1.88
(1.68-2.07)2.06
(1.83-2.26)2.24
(1.99-2.46)2.47
(2.18-2.72)2.65
(2.33-2.92)
60-min1.04
(0.941-1.15)1.27
(1.15-1.41)1.61
(1.45-1.77)1.86
(1.68-2.05)2.21
(1.98-2.43)2.48
(2.22-2.73)2.75
(2.45-3.03)3.04
(2.69-3.34)3.42
(3.02-3.76)3.73
(3.27-4.10)
2-hr1.20
(1.09-1.34)1.47
(1.33-1.63)1.88
(1.70-2.10)2.22
(2.00-2.47)2.72
(2.44-3.01)3.13
(2.80-3.46)3.58
(3.18-3.95)4.06
(3.60-4.48)4.77
(4.20-5.25)5.37
(4.69-5.90)
3-hr1.29
(1.16-1.44)1.56
(1.41-1.75)2.01
(1.81-2.25)2.37
(2.12-2.65)2.90
(2.59-3.24)3.35
(2.98-3.72)3.84
(3.40-4.27)4.38
(3.86-4.85)5.17
(4.52-5.72)5.85
(5.07-6.46)
6-hr1.53
(1.38-1.70)1.84
(1.66-2.06)2.34
(2.11-2.61)2.77
(2.49-3.07)3.39
(3.03-3.75)3.93
(3.49-4.34)4.52
(4.00-4.98)5.18
(4.54-5.68)6.14
(5.34-6.73)6.98
(6.02-7.62)
12-hr1.81
(1.65-2.01)2.18
(1.98-2.41)2.74
(2.48-3.03)3.22
(2.91-3.55)3.94
(3.55-4.34)4.57
(4.09-5.01)5.26
(4.69-5.76)6.04
(5.34-6.59)7.20
(6.31-7.83)8.20
(7.12-8.90)
24-hr2.10
(1.95-2.28)2.51
(2.33-2.74)3.14
(2.91-3.41)3.68
(3.40-3.99)4.50
(4.13-4.86)5.21
(4.74-5.61)5.99
(5.40-6.44)6.86
(6.13-7.37)8.17
(7.18-8.77)9.30
(8.06-9.98)
2-day2.44
(2.26-2.64)2.91
(2.71-3.15)3.59
(3.34-3.89)4.18
(3.87-4.52)5.06
(4.66-5.46)5.81
(5.31-6.26)6.63
(6.01-7.15)7.53
(6.75-8.12)8.87
(7.82-9.58)10.0
(8.70-10.8)
3-day2.61
(2.44-2.81)3.12
(2.91-3.36)3.83
(3.57-4.11)4.43
(4.12-4.76)5.31
(4.91-5.71)6.06
(5.57-6.51)6.88
(6.27-7.38)7.76
(7.01-8.34)9.05
(8.06-9.75)10.1
(8.92-11.0)
4-day2.79
(2.61-2.99)3.32
(3.11-3.56)4.06
(3.80-4.34)4.67
(4.36-5.00)5.57
(5.17-5.95)6.32
(5.83-6.75)7.12
(6.53-7.62)7.99
(7.26-8.55)9.24
(8.30-9.92)10.3
(9.13-11.1)
7-day3.38
(3.18-3.61)4.01
(3.77-4.29)4.86
(4.56-5.20)5.57
(5.21-5.95)6.59
(6.14-7.03)7.43
(6.89-7.93)8.33
(7.67-8.90)9.28
(8.48-9.92)10.6
(9.61-11.4)11.8
(10.5-12.6)
10-day3.89
(3.65-4.15)4.61
(4.34-4.92)5.52
(5.19-5.89)6.27
(5.88-6.68)7.31
(6.83-7.79)8.15
(7.59-8.69)9.03
(8.36-9.63)9.94
(9.15-10.6)11.2
(10.2-12.0)12.2
(11.0-13.1)
20-day5.44
(5.13-5.76)6.43
(6.06-6.82)7.58
(7.15-8.05)8.48
(7.99-9.01)9.69
(9.10-10.3)10.6
(9.94-11.3)11.5
(10.8-12.3)12.5
(11.6-13.3)13.7
(12.6-14.6)14.6
(13.4-15.6)
30-day6.83
(6.48-7.21)8.05
(7.63-8.50)9.39
(8.89-9.92)10.4
(9.86-11.0)11.8
(11.1-12.4)12.8
(12.0-13.5)13.8
(12.9-14.5)14.7
(13.8-15.6)16.0
(14.9-16.9)16.9
(15.6-17.9)
45-day8.75
(8.30-9.23)10.3
(9.74-10.8)11.8
(11.2-12.5)13.0
(12.3-13.7)14.4
(13.7-15.2)15.5
(14.7-16.4)16.6
(15.6-17.5)17.6
(16.5-18.6)18.8
(17.6-19.9)19.7
(18.4-20.9)
60-day10.5
(10.0-11.1)12.3
(11.8-13.0)14.1
(13.4-14.8)15.4
(14.6-16.2)17.0
(16.1-17.9)18.1
(17.2-19.1)19.2
(18.2-20.2)20.2
(19.1-21.3)21.4
(20.2-22.6)22.3
(21.0-23.6)
1 Precipitation frequency (PF) estimates in this table are based on frequency analysis of partial duration series (PDS).
Numbers in parenthesis are PF estimates at lower and upper bounds of the 90% confidence interval. The probability that precipitation frequency estimates (for agiven duration and average recurrence interval) will be greater than the upper bound (or less than the lower bound) is 5%. Estimates at upper bounds are notchecked against probable maximum precipitation (PMP) estimates and may be higher than currently valid PMP values.
Please refer to NOAA Atlas 14 document for more information.
Back to Top
Page 1 of 4Precipitation Frequency Data Server
10/4/2016http://dipper.nws.noaa.gov/hdsc/pfds/pfds_printpage.html?lat=40.1885&lon=-81.8707&da...

PF graphical
Back to Top
Page 2 of 4Precipitation Frequency Data Server
10/4/2016http://dipper.nws.noaa.gov/hdsc/pfds/pfds_printpage.html?lat=40.1885&lon=-81.8707&da...

Maps & aerials
Small scale terrain
Large scale terrain
Large scale map
+
–3km
2mi
+
–100km
60mi
+
–100km
60mi
Page 3 of 4Precipitation Frequency Data Server
10/4/2016http://dipper.nws.noaa.gov/hdsc/pfds/pfds_printpage.html?lat=40.1885&lon=-81.8707&da...
Large scale aerial
Back to Top
US Department of CommerceNational Oceanic and Atmospheric Administration
National Weather ServiceNational Water Center
1325 East West HighwaySilver Spring, MD 20910
Questions?: [email protected]
Disclaimer
+
–100km
60mi
Page 4 of 4Precipitation Frequency Data Server
10/4/2016http://dipper.nws.noaa.gov/hdsc/pfds/pfds_printpage.html?lat=40.1885&lon=-81.8707&da...