Ambulance - NHS Improvement · Activity information for ambulance services covers every stage of an...
71
Healthcare costing standards for England Information requirements and costing processes Second version Ambulance
Transcript of Ambulance - NHS Improvement · Activity information for ambulance services covers every stage of an...

Healthcare costing standards for England
Information requirements and costing processes
Second version
Ambulance

We support providers to give patients
safe, high quality, compassionate care
within local health systems that are
financially sustainable.

1 | > Contents
Contents
Introduction .................................................................................. 2
Information requirements ........................................................... 4
IR1: Collecting information for costing ........................................... 5
IR2: Managing information for costing ......................................... 14
Costing processes ..................................................................... 26
CP1: Role of the general ledger in costing ................................... 27
CP2: Clearly identifiable costs ..................................................... 30
CP3: Appropriate cost allocation methods ................................... 50
CP4: Matching costed activities to incidents and patients ............ 58
CP5: Reconciliation...................................................................... 63

2 | > Introduction
Introduction
This is the second version of the Healthcare costing standards for England:
ambulance. These standards should be applied to 2017/18 data and used for all
national cost collections. They supersede all earlier versions. All paragraphs have
equal importance.
These standards have been through two development cycles involving
engagement, consultation and implementation. We would like to thank all those
who have contributed to the development of these standards.
The main audience for the standards is costing professionals but they have been
written with secondary audiences in mind, such as clinicians and informatics and
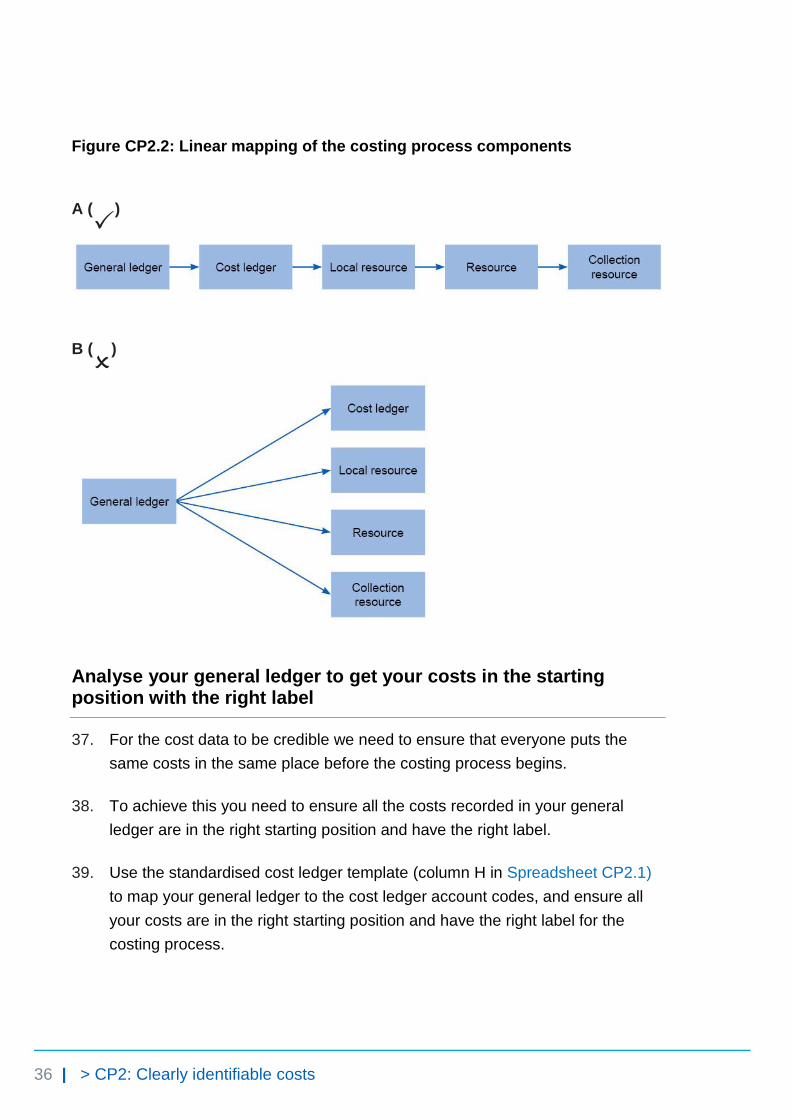
finance colleagues.
For ambulance services, there are three types of standards: information
requirements, costing processes and costing methods.
• Information requirements describe the activity information required to
implement the other costing standards, and suggest how costing
practitioners can work with informatics and service departments to obtain
good quality data for costing.
• Costing processes apply to all services provided by your organisation and
cover the costing process from the general ledger through to the final
patient unit cost and reconciliation to audited accounts.
These first two sets of standards, contained in this document, make up the main
costing process. They should be implemented in numerical order, before the
costing methods.
• Costing methods focus on high volume and high value services or
departments. These should be implemented after the information
requirements and costing processes, and prioritised based on the value
and volume of the service for your organisation.

3 | > Introduction
All of the standards are published on NHS Improvement’s website.1 An
accompanying technical document contains information required to implement the
standards, which is best presented in Excel. In this document, cross-references to
spreadsheets (for example, Spreadsheet CP3.3) refer to the technical document.
We have ordered the standards linearly but, as aspects of the costing process can
happen simultaneously, where helpful we have cross-referenced to information in
later standards.
We also cross-reference to relevant costing principles. These principles should
underpin all costing activity.2
We have produced a number of tools and templates to support you to implement
the standards. These are available to download from
https://improvement.nhs.uk/resources/approved-costing-guidance-standards
You can also download an evidence pro forma if you would like to give us feedback
on the standards. Please send completed forms to [email protected]
1 See https://improvement.nhs.uk/resources/approved-costing-guidance-standards
2 For details see The costing principles, https://improvement.nhs.uk/resources/approved-costing-
guidance/
4 | > Information requirements
Information requirements
IR1: Collecting information for costing
IR2: Managing information for costing

5 | > IR1: Collecting information for costing
IR1: Collecting information for costing
Purpose: To set out the minimum information requirements for patient-level costing.
Objectives
1. To ensure all providers collect the same information for costing, comparison
with peers and collection purposes.
2. To help allocate the correct quantum of cost to the correct activity using the
prescribed cost allocation method.
3. To support local reporting of cost information by activity in the organisation’s
dashboards.
Scope
4. The information requirements specified in this standard apply to all activity
going through 999 control centres.
5. Activity information is required to cost a patient, not the patient. The aim is to
divide an incident’s costs between all the patients treated, not to gather all
data relating to each patient.
6. Data on clinical interventions falls outside the scope of this standard. This data
is not currently available for costing and more appropriate drivers for
ambulance service costs such as journey time and on-scene time are used.

6 | > IR1: Collecting information for costing
Overview
7. This standard and Spreadsheets IR1.1 and IR1.2 specify five patient-level
activity feeds as the minimum requirement for allocating resources.
8. Refer to columns B and C in Spreadsheet IR1.1 for the specific requirements
and definitions. This standard gives the purposes of collecting the information
as well as the ways to work with the relevant teams in your organisation to
collect the minimum required data in a format suitable for costing.
9. Any costs not covered in the five patient-level feeds need to have relative
weight values or other local information sources to allocate the costs. Use
statistic allocation tables to store relative weight information to use in your
costing systems where the standards prescribe using a relative weight3 to
allocate costs.
10. You may be using additional sources of information for costing. If so, continue
to use these and document this in your costing manual.
11. This standard specifies what information to collect, not how to collect it. If you
collect several of the specified feeds in one dataset, you should continue to do
so, as long as the information required is captured.
12. If you do not currently collect and use the minimum required activity
information feeds, you should work with your informatics department and the
departments providing the services to put in place systems to collect this
information. We acknowledge that some requirements cannot be met by all
providers currently. We provide a framework for working towards making the
relevant data available (see Figure IR2.1 in Standard IR2: Managing
information for costing) and a three-year transition path to meet the
information requirement (see Column M in Spreadsheet IR1.2).
13. Note that the data tables and fields specified in this standard are neither
reports that you need to produce nor a collection template. They specify the
information you will need for costing and the production of the required
outputs to populate a separate collection template.
3 Please see Standard CP3: Appropriate cost allocation methods paragraphs 40 to 48 for more
information on relative weight values.

7 | > IR1: Collecting information for costing
What you need to implement this standard
• Costing principle 1: Good costing should focus on materiality4
• Spreadsheet IR1.1: Activity feeds required for costing
• Spreadsheet IR1.2: Field requirements for the activity feeds
• Spreadsheet IR1.3: Examples of feed data for different scenarios
Approach
Information required for allocating patient-facing costs
14. Information on the following is required for allocating patient-facing costs:
• emergency response activity
• patients
• vehicles
• staff.
Information feeds
15. We specify five activity information feeds:
• feed 1: incident information – master feed
• feed 2: response unit information – auxiliary feed
• feed 3: patient information – auxiliary feed
• feed 4: staff information – auxiliary feed
• feed 5: fleet information – auxiliary feed.
16. Spreadsheet IR1.1 describes the detail required for the activity data for the
five feeds. The specific data fields required for each feed are listed in
Spreadsheet IR1.2.
17. Two types of feed support the matching process. They are classified in
column G in Spreadsheet IR1.1:
4 See The costing principles, https://improvement.nhs.uk/resources/approved-costing-guidance/
8 | > IR1: Collecting information for costing
• master feeds – the core patient-level activity feeds that the other feeds are
matched to, eg the incident information feed
• auxiliary feeds – the information feeds that are matched to the master
feeds, eg the staff and fleet information feeds.
18. These feeds can be matched to produce patient-level cost records for patient-
level information and costing systems (PLICS) as well as incident-level costs
for local reporting and other uses, while retaining the most detailed level of
data.
19. Please note that, unlike the other information feeds, the fleet information feed
(feed 5) is not an activity feed – that is, it contains no information about
patient-facing activities. It is an information source to help allocate fleet costs
at the level of each vehicle and thus improve cost allocation.
Activity information (feeds 1 and 2)
20. Activity information for ambulance services covers every stage of an
emergency response – from receiving a call to treating and conveying the
patient(s) to a treatment location, handing over care and preparing to respond
again.5
21. Activity data is collected from the call or another trigger (eg an ambulance
passes a roadside incident or transfer from NHS 111 service) and any
subsequent responses. This consists of:
• incident information (feed 1), eg start and end time of the call; number of
response units dispatched
• response unit information6 (feed 2), eg timestamps of different stages in
each job cycle.
22. Although data on call-handling activities7 is usually collected at the call level,
this version of the standard only requires information on the main call
associated with the incident (ie at incident level). This is because duplicate
5 See Standard CM1: Allocating costs across job cycle elements for details of job cycle stages.
6 A response unit is the combination of staff and vehicle that responds to an incident. See the
costing glossary for a full definition. 7 See Standard CM1: Allocating costs across job cycle elements for details of call stage activities.
9 | > IR1: Collecting information for costing
calls associated with the same incident cannot be linked to the main call and
the incident.8
23. Data on telephone clinical advice activities9 is usually collected at the incident
level (feed 1). Data on giving telephone clinical advice to the crew at the
scene is not required for this version of the standards.
24. Data on the physical response stage activities10 is usually collected at the
response unit level (feed 2), and may be more detailed than that at the patient
level since one patient can be treated by multiple response units.
25. Providers will be required to collect an incident-level activity feed (feed 1) to
bring together multiple response units’ activity for use in allocating costs to
individual or multiple patients.
Costing standards relative to feeds 1 and 2
• Standard CM1: Allocating costs across job cycle elements
• Standard CM3: Non-responding time
• Spreadsheet IR1.3: Examples of feed data for different scenarios11
Patient information (feed 3)
26. Patient information collected during the emergency call and response can
include:
• patient identifying information, eg NHS number or other patient ID
• demographic information, eg age, gender
• information relating to the emergency call, eg reasons for the call (also
known as chief complaint)
• activity type:
– hear and treat/refer
– see and treat/refer 8 This is based on feedback from the National Ambulance Information Group.
9 See Standard CM1: Allocating costs across job cycle elements for details of call stage activities.
10 See Standard CM1: Allocating costs across job cycle elements for details of physical response
stage activities. 11
See scenario examples in Spreadsheet IR1.3 for how the incident feed (feed1), response feed
(feed 2) and patient feed (feed 3) link together and what specific data fields need to be populated
in each scenario.

10 | > IR1: Collecting information for costing
– see, treat and convey.
27. We acknowledge that for some patients not all of these details will be
available. We expect available data to be recorded and an attempt made to
find the NHS number using the batch-tracing service,12 NHS Spine13 or other
services. In the technical document we provide codes to use when data is not
available.
28. Note that for the patient identifiable information, information governance
issues should be covered by the provider’s own procedures, not these
standards.
29. For multiple-patient incidents, the number of conveying vehicles arriving at a
treatment location should be used as a proxy for the number of patients
involved in the incident.14 A patient record should be generated for each
patient conveyed, even if the patient’s details are not available.
Costing standards relevant to feed 3
• Standard CM1: Allocating costs across job cycle elements
• Spreadsheet IR1.3: Examples of feed data for different scenarios15
Staff information (feed 4)
30. Best practice is to use information from the actual rotas and staff pay. This
data can directly link staff costs to the activities the staff were involved with
and accurately distribute non-responding time across jobs. The aim is to
match staff costs to the incidents those staff responded to.
31. Staff information includes:
• shift start and end date and time
• staff identifier
12
See https://digital.nhs.uk/media/31515/DBSB-NHS-Number-Batch-Tracing/doc/DBSB_-
_NHS_Number_Batch_Tracing for technical details on batch tracing. 13
See https://digital.nhs.uk/spine for details on Spine. 14
See Standard CM1: Allocating costs across job cycle elements for details of how to allocate costs to multiple patients involved in an incident.
15 See scenario examples in Spreadsheet IR1.3 for how the incident feed (feed1), response feed
(feed 2) and patient feed (feed 3) link together and what specific data fields need to be populated
in each scenario.
https://digital.nhs.uk/media/31515/DBSB-NHS-Number-Batch-Tracing/doc/DBSB_-_NHS_Number_Batch_Tracing

11 | > IR1: Collecting information for costing
• vehicle identifier.
Costing standards relevant to feed 4
• Standard CM1: Allocating costs across job cycle elements
• Standard CM3: Non-responding time
Fleet information (feed 5)
32. Information is needed on the maintenance, lease, purchase and running of
vehicles in the fleet, including:
• vehicle identifier
• parts used in repairs
• time spent off road (in hours).
33. The fleet management system should provide the required information for
allocating maintenance and repair costs to specific vehicles. However, fleet
management information is not yet available for costing across all providers.16
34. Future development of the standards will prioritise making fleet data available.
As and when more detailed information is collected, the standards will be
updated accordingly.
35. Deep-cleaning dates and costs should be collected at the individual vehicle
level, using a fleet number or other unique identifier.
Costing standards relevant to feed 5
• Standard CM2: Fleet costs
• Standard CM3: Non-responding time
Locally specified information feeds
36. Organisations are encouraged to collect more patient-level activity data
wherever this is practical, taking into account the principle of materiality (refer
to the costing principles).
16
This is based on feedback from the National Ambulance Information Group.

12 | > IR1: Collecting information for costing
37. If your organisation has a well-developed electronic patient record (EPR)
system you may be able to capture more data on the care given to patients
than the standards currently require. You should collect this additional data as
it will increase local understanding of the costs associated with different
activity and future versions of the standards may require it for costing.
38. The groups of information listed above are the minimum the standards require
for costing, but do not cover all patient activities in ambulance services. You
need to decide whether specific local costing needs require additional activity
feeds. Examples of such feeds are:
• patient transport service
• NHS 111 service
• urgent care
• GP out-of-hours services
• commercial activities such as first aid training and sports events.
39. Three criteria govern the priority for obtaining these feeds:
• value of service
• volume of service
• priority of the service within the provider and the healthcare economy.
40. If you are already collecting additional patient-level activity data, you are
encouraged to continue to do so as this is best practice. Record these
additional feeds in your costing manual.
41. If you use fields additional to those specified for local reporting or more
detailed costing, continue to use these and log them in your costing manual.
Other considerations
42. Spreadsheet IR1.2 gives the required data fields for the five information feeds.
These fields have various functions, such as costing, collection or reporting.

13 | > IR1: Collecting information for costing
43. The activity feeds do not contain any income information. Your organisation
may decide to include the income for the feeds at patient level to enhance the
value of its reporting dashboard.17
44. The feed specifications in Spreadsheets IR1.1 and IR1.2 do not include
description fields. You may ask for description fields to be included in the
feeds; otherwise you need to maintain code and description look-up tables for
each feed to understand the cost data supplied. You need a process to map
and regularly (at least annually) revalidate the codes and descriptions for each
service.
PLICS collection requirements
45. The master feed of Incidents forms the basis of the cost collection. See the
Ambulance PLICS cost collection guidance for more details.18
17
See Standard CM4: The income ledger for further information. 18
https://improvement.nhs.uk/resources/approved-costing-guidance-collections/

14 | > IR2: Managing information for costing
IR2: Managing information for costing
Purpose: To assess the availability of the information specified in Standard IR1: Collecting information for costing, and to recommend processes to manage this information.
Objectives
1. To explain how to use information in costing.
2. To explain how to support your organisation in improving data quality in
information used for costing.
3. To explain how to manage data quality issues in information used for costing
in the short term.
4. To explain what to do when information is not available for costing.
Scope
5. All information required for the costing process.
Overview
6. Costing practitioners are not responsible for the quality and coverage of
information in your organisation. However, you are ideally placed to raise data
quality issues in your organisation.
7. This standard provides guidance on how you can minimise the impact of poor
quality activity information when producing cost information. These are
considered to be short-term measures that allow you to produce cost

15 | > IR2: Managing information for costing
information in line with the costing principles while your organisation continues
to work on the quality and coverage of its information as a whole.
8. This standard focuses on the steps you should take to be confident about the
data used for costing and to support improvements in data quality in your
organisation. Your organisation should have its own governance
arrangements for managing data capture and flows, for ensuring data quality,
and for compliance with relevant information governance requirements.
What you need to implement this standard
• Costing principle 1: Good costing should focus on materiality
• Costing principle 4: Good costing should be based on high quality data that
supports confidence in the results.19
Approach
Assessing the availability of information for costing
9. Most of the required information20 should be held on your information systems,
but its availability will vary due to different information management practices
and the capacity of your information technology. Here we provide guidance on
assessing data availability. You should work with your informatics department
and the relevant services to assess the availability of data against Standard
IR1: Collecting information for costing and to streamline processes for
extracting what is required.
10. The quality of information varies between organisations. The specific data
fields in each feed are given in Spreadsheet IR1.2. Their availability can be
grouped as follows:
• Available from computer-aided dispatch (CAD) systems (most fields in
feeds 1 to 3): activity and patient data are recorded based on semi-
automated job cycle stage triggers – for example, arriving at the scene,
leaving the scene, arriving at the treatment location – from response
vehicles and dispatchers, and callers’ answers to questions asked of them
19
See The costing principles, https://improvement.nhs.uk/resources/approved-costing-guidance/ 20
As specified in Standard IR1: Collecting information for costing.

16 | > IR2: Managing information for costing
over the telephone by the call handler, and coded according to your triage
system.
• Available from your local information systems (feed 4 and 5): this
information is collected from local information systems other than the CAD.
The availability of the information varies depending on the development of
the local systems at your organisation – for example, some providers do not
collect all the fleet and staff information required.
• Available but not necessarily in a usable format (certain fields in feed
3): activity and patient information data from patient report forms (PRFs)
completed for each patient by frontline staff. This is often captured and
stored on paper, making it difficult to incorporate with other data sources on
any scale. Providers with integrated EPR systems in place should use this
data source where possible and appropriate, either instead of information
from the CAD system or as a supplement to it.
• Not currently available (certain fields in feeds 1 to 3): for example,
number of patients treated at the scene.
11. Use NHS Improvement’s Information gap analysis template and work with
your informatics colleagues and relevant services to assess data availability
for costing. Use column M in Spreadsheet IR1.2 to inform these discussions.
12. If you are not collecting the required information, you must work with the
relevant departments in your organisation to begin collecting it and to make it
available for costing. Figure IR2.1 shows you how to access data for costing.
13. If you cannot achieve all the minimum requirements initially, you should
prioritise accessing:
• fleet information
• staff information
• and data fields to:
― flag whether an incident involves one or more patients
– provide a proxy count of patients based on the number of vehicles
arriving at a treatment location.
17 | > IR2: Managing information for costing
Data available from systems other than the CAD
14. Payroll data should be available from an internal system such as the
electronic staff record (ESR) and rota data should be available from an
internal system such as the global rota system (GRS) to provide the
information required for the staff information feed (feed 4).
15. If you do not currently collect shift data, you should work with your informatics
department and the relevant operational or scheduling departments to collect
it.
16. You should use staff payroll data to allocate staff costs to the activities these
staff deliver. Your CAD system should record which staff respond to which
incidents. However, if it does not, continue to use your current method and
work towards obtaining the required information. Record the information you
collect and the approach you use in your costing manual.
17. Note that you must ensure that relevant information governance requirements
are complied with when accessing individual payroll data.
18. Depending on the development of your fleet management system, the fleet
information feed (feed 5) may or may not be available at your organisation.
19. If your organisation does not collect the required fleet information, continue to
use your current method and work towards obtaining the required information.
Record the information you collect and the approach you use in your costing
manual.
Data that is available but may not be suitable for use in costing
20. Providers complete a PRF for each patient they treat or convey. In some
cases, multiple forms may be completed for the same patient – for example,
when care switches between different frontline staff, or when a patient is
observed over a long time.
21. The adoption of EPR systems varies widely, with many providers still using
paper forms; EPR systems vary in their ability to link to hospital systems.
18 | > IR2: Managing information for costing
22. PRF data is not currently used in costing. Any plans to incorporate PRF data
into costing will have to ensure the data is available in a useable format and of
high enough quality (see Figure IR2.1).
23. In future, quality PRF data could provide a rich and accurate source of data for
costing at the patient level. Costing systems should be set up with the
anticipation that this data source will become available.
Unavailable data and future requirements for data collection
Linking duplicate calls
24. All call-handling activities are recorded in your CAD system. However, when
there is more than one call about an incident only the main call is linked to the
incident; all duplicate calls are recorded separately.
25. To accurately allocate call-handling resources it is important to link activity
data about all calls, including duplicates, to an incident. This enables you to
allocate costs based on the duration of all relevant calls, not just the main call.
Developing a way to obtain this information is a goal for future versions of the
standards.
Telephone clinical advice
26. There are two issues with the activity data on giving telephone clinical advice:
• providers do not record time spent giving clinical advice to patients by
telephone (ie hear and treat) in the same way; some record it separately
from answering the call and triage, while others do not distinguish the two
activities
• time clinical advisors spend talking to ambulance crews is not recorded.
27. Separating call-handling activities from telephone clinical advice activities is
important as different resources need to be allocated to the two types of
activity. Developing a way to obtain this information is a goal for future
versions of the standards.
28. In this version of the standards we include a yes/no option for providers that
can record when telephone clinical advice is given to ambulance crews.

19 | > IR2: Managing information for costing
Number of patients
29. In the absence of PRF data, the number of patients treated at the scene
cannot currently be recorded. Developing a way to obtain this information is a
goal for future versions of the standards.
30. The number of patients conveyed to hospital is not currently recorded by any
ambulance provider. Developing a way to collect this data without increasing
the workload for call takers or ambulance crews is a goal for future versions of
the standards.
Other patient information
31. Some patient information, such as NHS number, age, gender and clinical data
beyond chief complaint, is either unavailable or of poor quality. The full
adoption of EPR systems will improve the quality of this information
significantly. This information is important to produce meaningful analysis of
the costs information.
32. All the issues above are summarised in Table IR2.1.
Table IR2.1: Variably available CAD system outputs
Unavailable items or items with varying availability
Issue
Linking duplicate calls CAD systems only allow one major call to be linked to an incident. Duplicate calls about the same incident cannot be linked.
Separate timestamps for call handling and providing telephone advice to patients
Some providers do not distinguish between hear and treat and call-handling time.
Timestamps for when clinicians provide telephone advice to ambulance crews
Some providers do not distinguish between hear and treat and providing telephone advice to ambulance crews; others have separate resources for each.
Number of patients at the scene
Field exists in some CAD systems based on a question asked during emergency calls, but call handlers are known often to make coding errors when recording numbers and the number reported by the caller is unlikely to be accurate. Providers using EPR can count the forms completed for unique patients.

20 | > IR2: Managing information for costing
Unavailable items or items with varying availability
Issue
Number of patients conveyed to hospital
Field exists in some CAD systems, but is reported not to be widely used and when it is, the data is not collected systematically.
Patient information (NHS number, age, gender, etc)
Missing values for a significant number of patients.
Clinical data beyond chief complaint
Main source is PRF, which is often available in paper format only and data cannot currently be integrated into the costing system.
Managing information feeds
33. You should keep a log of data feeds in your costing manual for each entry
including:
• the feed’s source system, data table name, department, named person and
a deputy responsible for providing the data source to you
• whether it is an in-month or year-to-date feed
• period covered by the feed – for example, all activities undertaken in the
calendar month
• format of information to be loaded into the costing system: SQL script,
Excel spreadsheet or text file (eg CSV)
• the working day on which the costing practitioner will receive the feed
• any known quality issue with the data source and solutions
• number of records on the feed.
Supporting your organisation to improve data quality for costing and managing data quality issues in the short term
Data quality issues
34. The quality of timestamp data for job-cycle elements varies. Some providers
may have many missing values for job-cycle element start and end time. This
information is vital in cost allocation as duration of job-cycle elements is used
as a weighting in many of the allocation methods prescribed. You need to talk
to your Informatics colleagues to look for ways to improve the data quality.

21 | > IR2: Managing information for costing
Methods to treat gaps caused by missing timestamps in job cycles should be
developed locally and recorded in your costing manual.
35. You need to be aware that the chief complaint or initial diagnosis recorded for
a patient does not always accurately reflect their medical problem. This is
because it is based on symptoms reported according to triage system coding,
not a medical diagnosis by a clinician who has assessed the patient in person.
36. For providers that have fleet management systems, their use and the quality
of data available from them vary. You should be aware of this and perform
quality checks on fleet data (see Figure IR2.2) before incorporating it into your
costing system.
Data quality checks
37. Follow a three-step quality-checking process for costing data:
• Step 1 – Review the source data: identify any deficiencies in the feed,
including file format, incomplete data, missing values, incorrect values,
insufficient detail, inconsistent values, outliers and duplicates.
• Step 2 – Cleanse the source data: remedy/fix the identified deficiencies.
Follow consistent rules and log your alterations, creating a ‘before’ and
‘after’ copy of the data feed. Applying duration caps is part of this step.
Always report data quality issues to the department supplying the source
data so they can be addressed for future processes. Keep data
amendments to the minimum, only making them when fully justified and
documenting them clearly.
• Step 3 – Validate the source data: you need a system that checks that
the cleansed and correct data is suitable for loading into the costing
system. This may be part of the costing system itself. Check that the
cleansing measures have resolved or minimised the data quality issues
identified in step 1; if they have not, either repeat step 2 or request higher
quality data from the informatics team.
38. Consider automating the quality check to reduce human errors and varied
formats. Automatic validation, via either an ETL (extract, transform, load)
function of the costing software or a self-built process, can save time. But take
care that the process tolerates differences in input data and if not, that this
22 | > IR2: Managing information for costing
data is consistent. Otherwise you risk spending disproportionate time fixing
the automation.
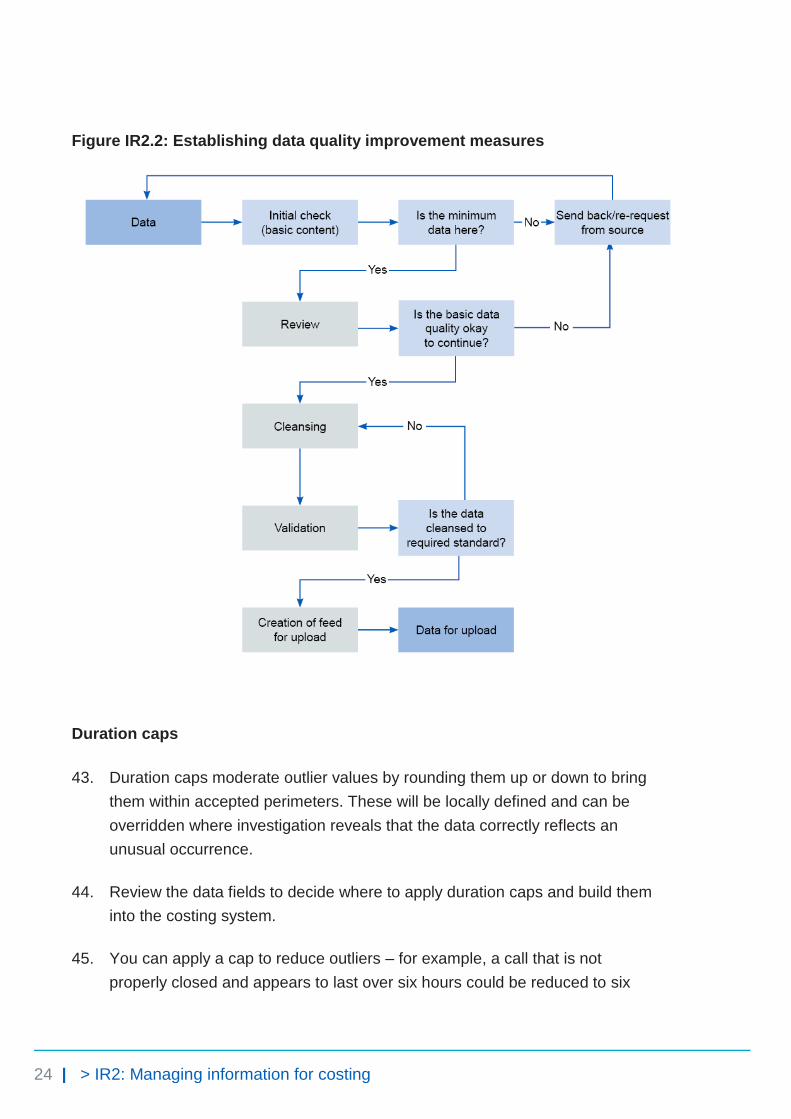
39. Your organisation should continuously improve data quality for audit purposes.
Request changes to the data feeds from the source department or informatics
team, then review the revised data for areas to improve. Set up a formal
process to guide these data quality improvement measures and ensure those
most useful to costing are prioritised. Figure IR2.2 shows the process.
When information is not available for costing
40. Information for costing may be unavailable because data is not:
• collected at an individual patient level
• given to the costing practitioner
• in a usable format for costing
• loaded into the costing system and included in costing processes.
41. If you are missing any of the required data fields in Spreadsheet IR1.2, you
should follow the steps shown in Figure IR2.1 to make the data available for
costing.
42. Until the data becomes available, you need to:
• continue to use your current methods
• document these in your costing manual
• start discussions with the department on how to obtain the information for
costing.

23 | > IR2: Managing information for costing
Figure IR2.1: Making data available for costing
24 | > IR2: Managing information for costing
Figure IR2.2: Establishing data quality improvement measures
Duration caps
43. Duration caps moderate outlier values by rounding them up or down to bring
them within accepted perimeters. These will be locally defined and can be
overridden where investigation reveals that the data correctly reflects an
unusual occurrence.
44. Review the data fields to decide where to apply duration caps and build them
into the costing system.
45. You can apply a cap to reduce outliers – for example, a call that is not
properly closed and appears to last over six hours could be reduced to six

25 | > IR2: Managing information for costing
hours. Duration caps mean that unreasonable unit costs do not need to be
explained when sharing costing information.
46. Capped data needs to be reported and investigated as part of the data quality
check to make sure it does not remove the true variation. The caps need to be
signed off by the relevant service.
47. An example duration cap is given in Table IR2.2. Such caps should be used
as the default in the absence of better local assumptions.
Table IR2.2: Example of duration caps
Feed no Feed name Field name Duration (seconds) Replace with
1 Incident information Call duration ≥3,601 3,600
26 | > Costing processes
Costing processes
CP1: Role of the general ledger in costing
CP2: Clearly identifiable costs
CP3: Appropriate cost allocation methods
CP4: Matching costed activities to incidents and patients
CP5: Reconciliation
27 | > CP1: Role of the general ledger in costing
CP1: Role of the general ledger in costing
Purpose: To set out how the general ledger is used for costing, and to highlight the areas which require review to support accurate costing.
Objective
1. To ensure the correct quantum of cost is available for costing.
Scope
2. This standard should be applied to all lines of the general ledger.
Overview
3. You need the income and expenditure for costing. We refer to this as the
‘general ledger output’. This output needs to be at cost centre and subjective
code level, and is a snapshot of the general ledger. You do not require
balance sheet items for costing.
4. You must include all expenditure and income in the general ledger output,
which must reconcile with the financial position reported by your board and in
the final audited accounts.
5. The general ledger is closed down at the end of the period, after which it
cannot be revised.21 For example, if in March you discover an error in the
previous January’s ledger that needs to be corrected, you can only make the
correction in March’s ledger. Doing so will correct the year-to-date position,
21 Some systems may allow you to back post payroll journals.

28 | > CP1: Role of the general ledger in costing
even though the January and March figures do not represent the true cost at
those times, as one will be overstated and the other understated.
6. The timing of when some costs are reported in the general ledger may pose a
challenge for costing. For example, overtime pay for a particular month may
be posted in the general ledger in the month it was paid, not the month the
overtime was worked. This highlights a limitation in the time-reporting and
expense payment system. We recognise this limitation, but are not currently
proposing a work-around for it.
7. Discuss the general ledger’s layout and structure with the finance team so that
you understand it. This will help you understand the composition of the costing
output.
What you need to implement this standard
• Costing principle 2: Good costing should include all costs for an
organisation and produce reliable and comparable results22
• Spreadsheet CP1.1 General ledger output required fields
Approach
Obtaining the general ledger output
8. The finance team should tell you when the general ledger has been closed for
the period and give you details of any off-ledger adjustments for the period.
You need to put these adjustments into your cost ledger, especially if they are
included in your organisation’s report of its financial position, as you will need
to reconcile to this.
9. Keep a record of all these adjustments, to reconcile back to the general ledger
output. Take care to ensure that any manual adjustments are mapped to the
correct line of the cost ledger.
10. See Spreadsheet CP1.1 for a list of what the extract from the general ledger
output must include.
22
See The costing principles, https://improvement.nhs.uk/resources/approved-costing-guidance/

29 | > CP1: Role of the general ledger in costing
11. Ensure the process for extracting the general ledger output is documented.
You should extract this once the finance team has told you it has closed the
general ledger for the period.
12. The finance team should tell you when it has set up new cost centres and
subjective codes in the general ledger, and when there are material
movements in costs or income between subjective codes or cost centres. One
way to do this is to circulate a general ledger changes form to all appropriate
teams, including costing. Cross-team approval increases the different teams’
understanding of how any changes affect them.
13. Finance teams should not rename, merge or use existing cost centres
for something else as this causes problems for costing if you are not
informed. Finance teams should close a cost centre and set up a new one
rather than renaming it. If this is not possible, you should be told about any
changes.
14. The new general ledger cost centres and subjective codes need to be mapped
to the cost ledger. You then need to reflect these changes in the costing
system.
15. ‘Dump’ ledger codes need to be addressed so that all costs can be assigned
accurately to incidents and patients. Work with your finance colleagues to
determine what these ‘dump’ codes contain so that they are mapped to the
correct lines of the cost ledger.
16. You should have a rolling programme in place to regularly meet with your
finance colleagues to review the general ledger and its role in costing.

30 | > CP2: Clearly identifiable costs
CP2: Clearly identifiable costs
Purpose: To ensure costs are in the correct starting position for costing.
Objectives
1. To ensure all costs are in the correct starting position and correctly labelled for
the costing process.
2. To ensure the same costs are mapped to the same resources.
3. To ensure all costs are classified in a consistent way.
4. To ensure income is not netted off against costs.
Scope
5. This standard should be applied to all lines of the general ledger.
Overview
6. The general ledger is often set up to meet the provider’s financial
management needs rather than those of costing. Therefore some of the costs
it contains have to be transferred to other ledger codes, or aggregated or
disaggregated in the cost ledger to ensure the costs are in the right starting
position for costing.
7. We have received feedback from those who use the national cost datasets to
say that the inconsistency in how costs are labelled limits meaningful analysis.
31 | > CP2: Clearly identifiable costs
8. To ensure the accuracy of cost data, the costs at the beginning of the process
need to be in the right place with the right label.
9. This is one of the reasons we have introduced a standardised cost ledger. It
enables you to investigate the general ledger in depth to understand the costs
it contains, and provides a way to get the costs into the right starting position
with the right label. This is important as it allows the correct cost allocation
method to be applied to the cost.
Classification of costs
10. The standardised cost ledger classifies costs at both the cost centre and
expense code level, according to whether they are patient facing or support23:
• Patient-facing costs are those directly related to delivering patient care
and are driven by patient activity. They should have a clear activity-based
allocation method, and will be both pay and non-pay. These costs use
resources and activities in the costing process.
• Support costs do not directly relate to delivering patient care. Many relate
to running the organisation (eg board costs, HR, finance, estates). Other
support costs may be service-level support costs such as service
management costs.
11. To help with the costing process, support costs have been classified as type 1
and type 2:
• type 1 – support costs such as finance and HR allocated to all the services
that used them, using a prescribed allocation method such as headcount or
actual usage. These costs do not use resources and activities in the costing
process
• type 2 – support costs allocated to the patient using an activity-based
method, eg costs on Clinical Negligence Scheme for Trusts (CNST). These
costs use resources and activities in the costing process.
12. The nature of the cost determines the classification, not the allocation method.
The standards apply an activity-based allocation method to a type 2 support
cost as this is believed to be a more accurate way to allocate this cost.
23 Please see columns D and H in Spreadsheet CP2.1 in the technical document for how cost
centres and expense codes are classified, respectively.
32 | > CP2: Clearly identifiable costs
However, the classification of the cost is still a support cost. It does not
change to a patient-facing classification.
13. Some providers may have sophisticated data systems that allow them to
allocate a type 1 support cost using an activity-based method, but this does
not change the classification.
14. We understand that providers use other cost classifications for local reporting.
The standards do not provide guidance on these.
Income
15. To maintain transparency in the costing process, income should not be netted
off from the costs. The only exceptions to this rule are:
• Where 100% of an individual healthcare professional’s costs are reported in
your general ledger but they spend part of their time at another
organisation. The income received for this activity at another provider can
be netted off the healthcare professional’s pay costs to avoid inflating the
cost of the provider’s own-patient care activity. It is important to determine
whether the recharged value includes type 1 support costs recovery, as
netting this additional income off staff costs would understate the remaining
resource cost.
• Where the materiality principle applies – for very small value contracts or
service-level agreements there is no need to determine the associated
costs.
Salary recharges
16. These are described as ‘pay recharge to’ and ‘pay recharge from’ in the
standardised cost ledger.
17. In line with the first bullet in paragraph 15, a ‘pay recharge to’ is where you
invoice another trust for an element of someone’s salary. This needs to be
netted off against their salary so that 100% cost is not attributed to 50%
activity. The ‘pay recharge to’ needs to be moved to the cost ledger line for the
individual and netted off regardless of whether non-clinical or clinical.

33 | > CP2: Clearly identifiable costs
18. The ‘pay charge from’ needs to be moved to the cost centre that is paying for
the activity so the pay costs can be allocated to the activity.
Commercial activities
19. Commercial activities for which there are costs and income, such as providing
additional ambulance cover for commercial events, should be reported in line
with Standard CP5: Reconciliation under ‘other activities’. This is so that
providers’ commercial activities do not inflate or deflate the costs of patient
care.
20. Where income is generated but costs are difficult to identify, such as car
parking, you must make a sensible estimate after discussion with the
appropriate teams. Report the costs and income under ‘other activities’.
21. Where your organisation holds the budget and therefore the costs for a
service, but you do not record the activity, report these costs under ‘costs and
income reconciliation items’. This includes both your organisation’s own costs
where there is no activity and costs incurred on another organisation’s behalf
– for example, an employee working for the air ambulance service.
22. If your organisation is taking part in a national programme, treat the costs of
this as ‘other activities’ until it becomes business as usual.
What you need to implement this standard
• Costing principle 2: Good costing should include all costs for an
organisation and produce reliable and comparable results
• Costing principle 3: Good costing should show the relationship between
activities and resources consumed
• Costing principle 4: Good costing should involve transparent processes
that allow detailed analysis
• Costing principle 5: Good costing should focus on materiality24
• Spreadsheet CP2.1: Standardised cost ledger (with mapping to resources)
• Spreadsheet CP2.2: Type 1 support costs allocation methods
23. ApproachBefore proceeding, review Spreadsheet: Costing diagram. This is a
high level visual aid to the costing process described in these steps.
24
See The costing principles, https://improvement.nhs.uk/resources/approved-costing-guidance/

34 | > CP2: Clearly identifiable costs
24. We describe the process in steps to make it easier to understand, but in reality
the steps may happen simultaneously in the costing system.
25. You can use different software solutions to achieve the costing process.
Setting up the costing process in your costing system
26. The costing process described here is linear, with each element mapping to
the next in a standardised way, as shown in Figure CP2.1.
27. There are three elements:
• analysing your general ledger and understanding how costs need to be
disaggregated to ensure they are allocated properly, or where they need to
be moved to ensure they have the right label and are in the right starting
position
• using the information from this analysis to inform the processing rules in
your costing system
• having the prepopulated cost ledger in your costing system; when you load
your general ledger output the processing rules from above map it to the
appropriate line in the cost ledger.
Figure CP2.1: Mapping the costing process components
28. Mapping from the general ledger to cost ledger is achieved by following the
steps described below.
29. The mappings from:
• the cost ledger account codes to the resources and
• these resources to the collections resources
are provided in columns J and P in Spreadsheet CP2.1, respectively.
30. The cost ledger, resources and collections resources – with their coding
structure and the mapping between them – should be prepopulated in your
35 | > CP2: Clearly identifiable costs
costing system. If these mappings change, we will provide the information to
update your costing systems.
31. Depending on what costing system you use, costing may take place at a level
lower than resources (see column B in Spreadsheet CP3.1). Your system may
use cost items, local resources or other classifications of costs. You can
continue using any of these methods in your costing system, but be aware
that it adds an additional mapping exercise to your set-up.
32. The cost allocation methods prescribed in Spreadsheet CP3.3 take into
account that costing may happen at a lower level than the resource
description.
33. The only mapping exercise you need to do is mapping your general ledger to
the cost ledger as described below.
34. If you use a local resource in your costing process you must map your cost
ledger to your local resources, then your local resources to the prescribed
resources. You must document your mapping assumptions in your costing
manual.
35. The mapping process still needs to be linear to maintain standardisation and
consistency. Figure CP2.2A illustrates the mapping process with the additional
component of a local resource.
36. Do not treat these mapping exercises as separate entities. It is important to
ensure that everyone puts the same costs in the same place, to maintain the
linear mapping. Figure CP2.2B is an example of how not to approach the
mapping exercises.
36 | > CP2: Clearly identifiable costs
Figure CP2.2: Linear mapping of the costing process components
A (
)
B (
)
Analyse your general ledger to get your costs in the starting position with the right label
37. For the cost data to be credible we need to ensure that everyone puts the
same costs in the same place before the costing process begins.
38. To achieve this you need to ensure all the costs recorded in your general
ledger are in the right starting position and have the right label.
39. Use the standardised cost ledger template (column H in Spreadsheet CP2.1)
to map your general ledger to the cost ledger account codes, and ensure all
your costs are in the right starting position and have the right label for the
costing process.

37 | > CP2: Clearly identifiable costs
40. Analyse your general ledger to understand how costs are recorded in it and
what steps you need to take to get the costs in the right starting position with
the right label.
41. This will include disaggregating costs that need to be mapped as different
resources, or where the labels on the general ledger do not correspond to the
costs recorded on that line in the general ledger.
42. If your general ledger uses sub-analysis codes, you will need to map these
codes to the correct line on the cost ledger.
43. Figure CP2.3 gives an example of the disaggregation. You may have an
emergency operations centre (EOC) cost centre in your general ledger, and
on the expense line ‘band 5’ you have call takers and dispatchers. The costs
for the call takers and dispatchers must be disaggregated as they need to go
to different resources. You can use relative weight values to determine the
apportionment of costs between the two lines in the standardised cost ledger.
Figure CP2.3: Example of disaggregation between the general ledger and the costing ledger
38 | > CP2: Clearly identifiable costs
44. To help prioritise what you analyse, use the GL to CL auto-mapper application
matching the expense code descriptions in your general ledger output to those
in the standardised cost ledger25 in column E in Spreadsheet CP2.1.
45. Where the GL to CL auto-mapper application does not identify an appropriate
line in the cost ledger, you must analyse the general ledger line, identify what
cost sits there and map it to the appropriate line in the cost ledger. Columns I
and J in the standardised cost ledger contain the mapping to the resources
that, with the prescribed activity, identifies the prescribed cost allocation to
use. This means that everyone treats the same cost in the same way, and
variation in activity costs will not be due to variations in the costing process.
46. Use the information from your in-depth investigation of your general ledger to
inform the processing rules for your costing system.
47. You will not be able to analyse each line of the general ledger in depth the first
time you do this exercise, but over time – with good communication between
you and your finance colleagues – this can be refined, starting with where the
largest costs are involved.
48. You need a rolling programme for analysing your general ledger over time to
ensure that costs in the cost ledger continue to be in the right starting position
with the right label.
Load your general ledger output into your costing system
49. The general ledger output must be transformed into the cost ledger within the
costing system to ensure that any changes can be traced and reconciled to
the provider’s general ledger.
50. You should populate the cost ledger template in your costing system. This
means that when you load your general ledger input into your costing system
in step 1, it uses the information from your analysis of the general ledger in
step 0 to map the costs against the appropriate line in the cost ledger.
51. You will then have the right costs in the right starting position with the right
label ready for the costing process to begin.
25 The GL-CL auto-mapper application is available as part of the early implementer support
package, and to others on request.
39 | > CP2: Clearly identifiable costs
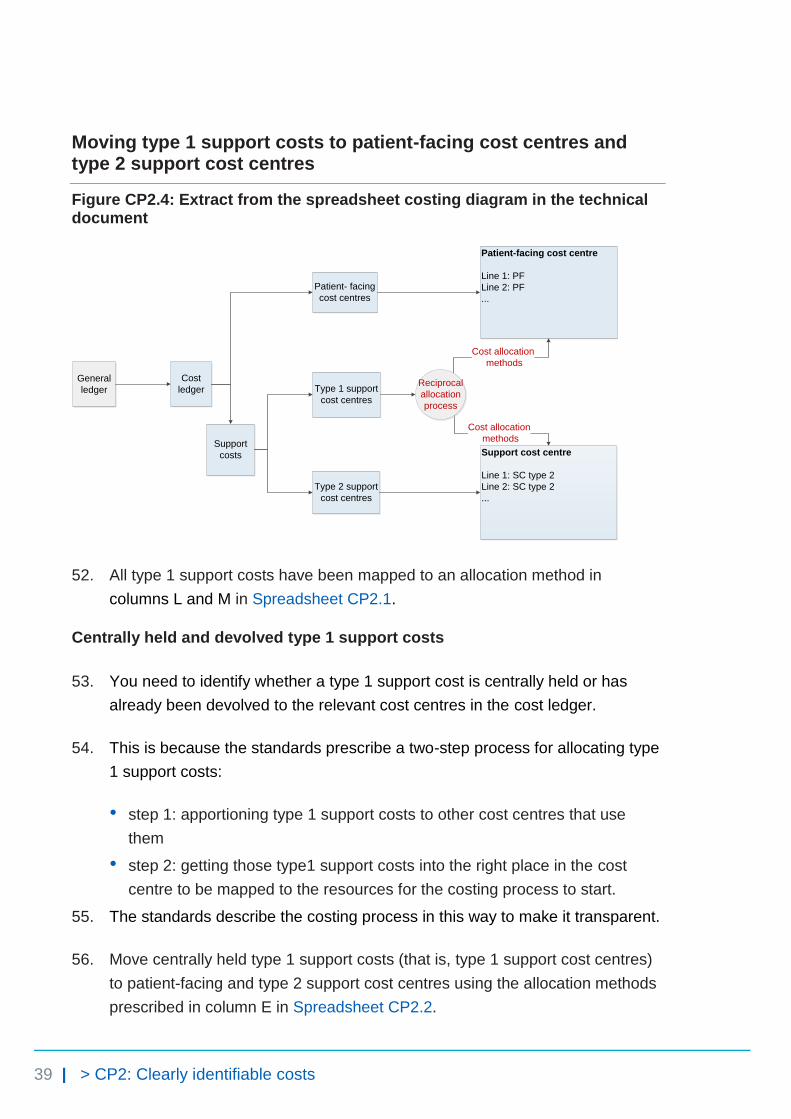
Moving type 1 support costs to patient-facing cost centres and type 2 support cost centres
Figure CP2.4: Extract from the spreadsheet costing diagram in the technical document
Cost
ledger
Patient- facing
cost centres
Support
costs
Type 1 support
cost centres
Type 2 support
cost centres
Support cost centre
Line 1: SC type 2
Line 2: SC type 2
...
Patient-facing cost centre
Line 1: PF
Line 2: PF
...
Cost allocation
methods
Cost allocation
methods
General
ledgerReciprocal
allocation
process
52. All type 1 support costs have been mapped to an allocation method in
columns L and M in Spreadsheet CP2.1.
Centrally held and devolved type 1 support costs
53. You need to identify whether a type 1 support cost is centrally held or has
already been devolved to the relevant cost centres in the cost ledger.
54. This is because the standards prescribe a two-step process for allocating type
1 support costs:
• step 1: apportioning type 1 support costs to other cost centres that use
them
• step 2: getting those type1 support costs into the right place in the cost
centre to be mapped to the resources for the costing process to start.
55. The standards describe the costing process in this way to make it transparent.
56. Move centrally held type 1 support costs (that is, type 1 support cost centres)
to patient-facing and type 2 support cost centres using the allocation methods
prescribed in column E in Spreadsheet CP2.2.

40 | > CP2: Clearly identifiable costs
57. The account codes for these centrally held type 1 support costs are flagged as
‘step 1’ in Column N in the standardised cost ledger (Spreadsheet CP2.1) to
enable mapping to the correct allocation methods in Spreadsheet CP2.2. For
cost centres of non-999 services, such as NHS 111 service cost centres, the
methods specified in Spreadsheet CP2.2 should be followed to allocate
centrally held type 1 support costs. This is to ensure consistent support cost
allocation across all service lines.
58. If the type 1 support cost has already been devolved in the cost ledger
(identified as ‘step 2’ in column N in Spreadsheet CP2.1), you do not need to
do step 1 in Spreadsheet CP2.2.
Examples of type 1 support costs that should be devolved to the cost centres that use them
59. Some type 1 support costs will have already been reported in patient-facing
cost centres and type 2 support cost centres, eg stationery and therefore do
not need to be moved.
60. Other type 1 support costs – such as station security – may have already
been devolved in the general ledger, based on an internal recharge. There is
no need to repeat this step for these costs, providing the prescribed costing
allocation method has been used.
61. Type 2 support costs, such as CNST, should sit in their cost centres in the
cost ledger as there are specific activity-based allocation methods for these,
specified in Spreadsheet CP3.3.
62. If you are using an activity-based method to allocate a type 1 support cost,
continue to use this and document it in your costing manual. We have adopted
this as a superior method.
Reciprocal costing
63. This step includes the reallocation of type 1 support costs between each
other. You should do this using a reciprocal allocation method to allow all
corporate support service costs to be allocated to, and received from, other
corporate support services.
64. Reciprocal costing must take place within the costing system.

41 | > CP2: Clearly identifiable costs
65. Type 1 support costs should not be allocated using a hierarchical method as
this only allows corporate support services costs to be allocated in one
direction.
66. A reciprocal allocation method accurately reflects the interactions between
support departments, and therefore provides more accurate full-cost results
than a hierarchical approach. An example of the reciprocal allocation method
is given at the end of this standard.
Apportioning type 1 support cost in patient-facing and type 2 support cost centres
Figure CP2.5: Extract from the spreadsheet costing diagram in the technical document
ResourcesPatient-facing cost centre
After SC type 1 moved in
Support cost centre
After SC type 1 moved in
Support cost centre
Line 1: Support cost (SC) type 2
Line 2: SC type 2
...
Patient-facing cost centre
Line 1: patient-facing (PF)
Line 2: PF
...Patient- facing resource
Support resource
LIne1: SC type 2
LIne2: SC type 2
LIne3: SC type 1
Cost allocation
methods
LIne1: PF
LIne2: PF
LIne3: SC type 1
Cost allocation
methods
67. Within the costing system, apportion type 1 support costs over the patient-
facing and type 2 support expense lines in the same cost centre, based on the
allocation methods prescribed in columns F and G of Spreadsheet CP2.2.
68. The account codes for these costs are flagged as ‘step 2’ in column N in the
standardised cost ledger (Spreadsheet CP2.1) to enable mapping to the
correct allocation methods in Spreadsheet CP2.2.
69. Patient-facing costs and type 2 support costs, with their allocated portion of
type 1 support costs, are then mapped to resources. Table CP2.1 shows an
example of this.

42 | > CP2: Clearly identifiable costs
Table CP2.1: Example of costs within a patient-facing resource
Resource name Patient-facing cost
Type 1 support cost Total resource cost for the costing process
Frontline staff XX XX XX
Fleet maintenance and repairs – Internal
XX XX XX
How to treat type 1 support costs in type 2 cost centres
70. All type 1 support costs in type 2 cost centres have been mapped to the type 2
support cost allocation method and should use the prescribed allocation
method in column D of Spreadsheet CP3.3.
71. This is because type 2 support cost centres all map to the same resource and
use the same allocation method.
72. Therefore it is not necessary to allocate type 1 costs first over the type 2
expense lines in the same cost centre.
73. However, we must emphasise that the information in Table CP2.1 still needs
to be available if you allocate type 1 support costs in type 2 support cost
centres directly to the support cost resource.
How to treat type 1 support costs in patient-facing costs
74. You do not need to allocate type 1 support costs over the patient-facing
expense lines if:
• all the lines in the patient-facing cost centre map to the same resource and
• you are using an average cost per minute to allocate out that resource.
75. However, we must emphasise that the information in Table CP2.1 still needs
to be available if you allocate type 1 support costs in patient-facing cost
centres directly to the patient-facing resource.
43 | > CP2: Clearly identifiable costs
76. Where the standards state you should allocate the actual staffing costs to their
named frontline staff activity, you need to allocate the type 1 support costs
over the patient-facing expense lines; if you do not, individual staff members
will not be allocated their correct amount of type 1 support costs.
77. If the lines in the patient-facing cost centre are mapped to different resources,
you need to allocate the type 1 support costs over the individual patient-facing
expense lines; if you do not, the different resources will not be allocated their
correct amount of type 1 support costs.
78. To do this, use the prescribed allocation methods in column F of Spreadsheet
CP2.2.
Things to consider when following this method
79. Using an expenditure-based allocation method, some areas of the ledger may
get a larger proportion of the allocated type 1 support costs because of
specific high cost items, such as specialist staff members. If so, investigate
the type 1 support cost allocation and use a more appropriate method.
Other considerations
Negative costs in the cost ledger
80. Negative costs arise for various reasons, such as a journal moving more cost
than is actually in the expense code. Include all costs, including negative
costs, in the costing process to enable a full reconciliation to your
organisation’s accounts.
81. With the wider finance team, you must consider the materiality of each cost
centre’s negative costs and subjective code combination. If the negative value
is sufficiently material, you may want to treat it as a reconciling item. The main
questions to ask before deciding are:
• What negative costs are there?
• Are they distorting the real costs of providing a service?
• Are they material?
• Do they relate to commercial activities?
44 | > CP2: Clearly identifiable costs
82. With the wider finance team, you need to investigate why any negative cost
balances have arisen. Several issues can lead to negative values in the
general ledger being carried into the cost ledger. With suggested solutions,
these are:
• Miscoding: actual expenditure and accruals costs are not matched to the
same cost centre and subjective code combination. Ideally, the responsible
finance team rectifies such anomalies to give you a clean general ledger
output.
• Value of journal exceeds value in the cost centre: If the value
transferred from the cost centre exceeds the value in the cost centre, this
will create a negative cost. Again ideally, the responsible finance team
rectifies such anomalies.
• Timing of accrual release: An inaccurate accrual release can result in a
negative cost value. When this happens, you must consider whether the
negative cost is material and whether its timing creates an issue. You may
need to report some negative costs caused by timing issues as a
reconciliation item.
83. Negative costs can be an issue because of traceable costs. If a particular
cost per unit is known and allocated to an activity rather than used as a
weighting, and the total actual cost multiplied by the number of activities is
greater than the cost sitting in the costing accounting code, a negative cost
will be created.
84. Traceable costs should be used as a relative weight value. The only exception
is where the traceable cost is of a material value and using the actual cost as
a relative weight value will distort the final patient unit cost.
85. Negative costs may also be found in the cost ledger if, during the required
ledger movements, more cost is moved than is actually in the expense code.
To avoid this, use relative weight value or percentages to move costs rather
than actual values.

45 | > CP2: Clearly identifiable costs
PLICS collection requirements
Netting off other operating income
86. For the ambulance PLICS cost collection, other operating income must be
netted off from the patient care costs (ie other operating income is not
included in the total costs collected). This includes education and training and
research income. Non-patient care costs must be allocated to patient care
activity using the standardised allocation methods or appropriate local
allocation rules.
Support costs
87. Type 1 and type 2 supports costs for the PLICS cost collection must be
mapped to the support cost collection resource and reported in the PLICS
collection extract. See Spreadsheet CP2.1 for the collection resource
mapping. If you have any questions, contact [email protected].
Example: Reciprocal type 1 support cost allocation
There are five cost centres:
• two patient-facing cost centres: emergency operational centre (C) and
stations (S)
• three type 1 support cost centres: finance (F), human resources (HR) and
estates (E).
In the general ledger the expenditure balances are:
Table CP2.2: Cost centre balances
Cost centre Expenditure(£)
Finance (F) 13,000
HR (H) 18,000
Estates (E) 22,000
EOC (C) 31,000
Station (S) 16,000
Total 100,000
46 | > CP2: Clearly identifiable costs
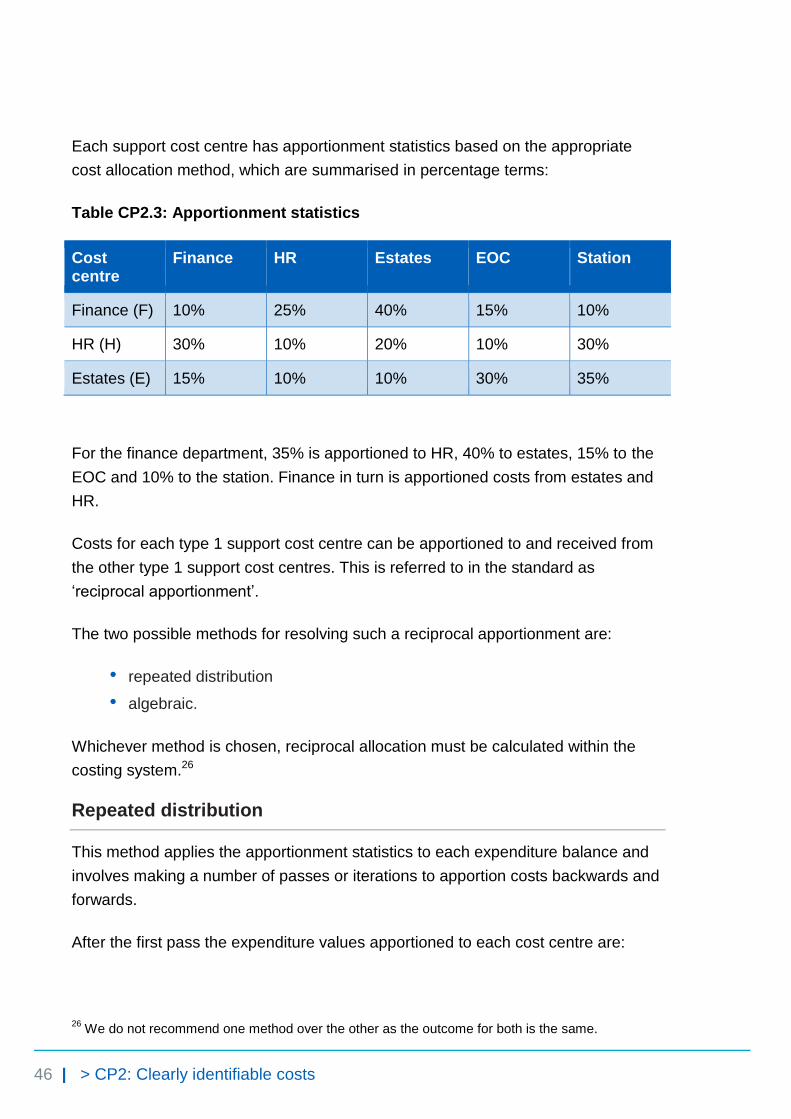
Each support cost centre has apportionment statistics based on the appropriate
cost allocation method, which are summarised in percentage terms:
Table CP2.3: Apportionment statistics
Cost centre
Finance HR Estates EOC Station
Finance (F) 10% 25% 40% 15% 10%
HR (H) 30% 10% 20% 10% 30%
Estates (E) 15% 10% 10% 30% 35%
For the finance department, 35% is apportioned to HR, 40% to estates, 15% to the
EOC and 10% to the station. Finance in turn is apportioned costs from estates and
HR.
Costs for each type 1 support cost centre can be apportioned to and received from
the other type 1 support cost centres. This is referred to in the standard as
‘reciprocal apportionment’.
The two possible methods for resolving such a reciprocal apportionment are:
• repeated distribution
• algebraic.
Whichever method is chosen, reciprocal allocation must be calculated within the
costing system.26
Repeated distribution
This method applies the apportionment statistics to each expenditure balance and
involves making a number of passes or iterations to apportion costs backwards and
forwards.
After the first pass the expenditure values apportioned to each cost centre are:
26
We do not recommend one method over the other as the outcome for both is the same.

47 | > CP2: Clearly identifiable costs
Table CP2.4: First pass
Total Finance HR Estates EOC Station
Finance (F) 13,000 1,300 3,250 5,200 1,950 1,300
HR (H) 18,000 5,400 1,800 3,600 1,800 5,400
Estates (E) 22,000 3,300 2,200 2,200 6,600 7,700
EOC (C) 31,000 0 0 0 0 0
Station (S) 16,000 0 0 0 0 0
Total 100,000 10,000 7,250 11,000 10,350 14,400
After the second pass the values are:
Table CP2.5: Second pass
Total Finance HR Estates EOC Station
Finance (F) 10,000 1000 2,500 4,000 1,500 1000
HR (H) 7,250 2,175 725 1,450 725 2,175
Estates (E) 11,000 1,650 1,100 1,100 3,300 3,850
EOC (C) 41,350 0 0 0 0 0
Station (S) 30,400 0 0 0 0 0
Total 100,000 4,825 4,325 6,550 5,525 7,025
As the expenditure sitting in the patient-facing cost centres is not apportioned to
any other cost centres, the balance for these cost centres keeps growing until the
total for the patient-facing cost centres equals the £100,000 total starting balance.
The process of re-apportionment is continued until, after the tenth pass, most of the
expenditure appears against the patient-facing cost centres.
48 | > CP2: Clearly identifiable costs
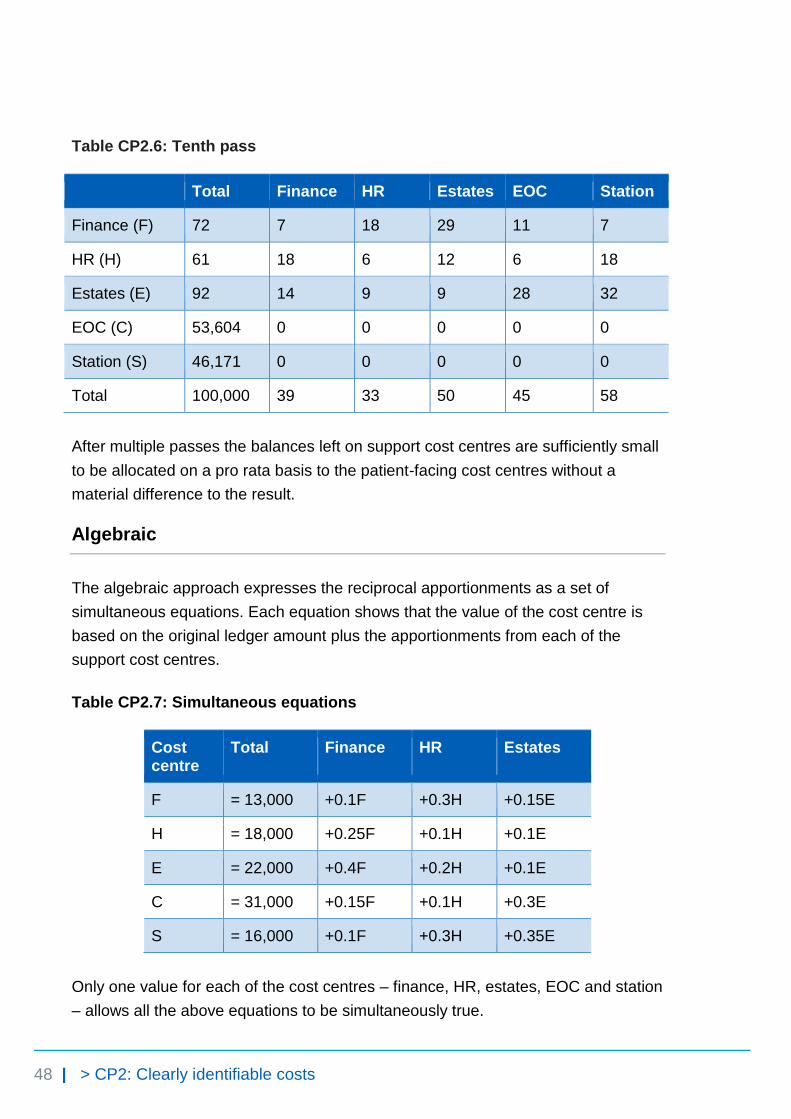
Table CP2.6: Tenth pass
Total Finance HR Estates EOC Station
Finance (F) 72 7 18 29 11 7
HR (H) 61 18 6 12 6 18
Estates (E) 92 14 9 9 28 32
EOC (C) 53,604 0 0 0 0 0
Station (S) 46,171 0 0 0 0 0
Total 100,000 39 33 50 45 58
After multiple passes the balances left on support cost centres are sufficiently small
to be allocated on a pro rata basis to the patient-facing cost centres without a
material difference to the result.
Algebraic
The algebraic approach expresses the reciprocal apportionments as a set of
simultaneous equations. Each equation shows that the value of the cost centre is
based on the original ledger amount plus the apportionments from each of the
support cost centres.
Table CP2.7: Simultaneous equations
Cost centre
Total Finance HR Estates
F = 13,000 +0.1F +0.3H +0.15E
H = 18,000 +0.25F +0.1H +0.1E
E = 22,000 +0.4F +0.2H +0.1E
C = 31,000 +0.15F +0.1H +0.3E
S = 16,000 +0.1F +0.3H +0.35E
Only one value for each of the cost centres – finance, HR, estates, EOC and station
– allows all the above equations to be simultaneously true.
49 | > CP2: Clearly identifiable costs
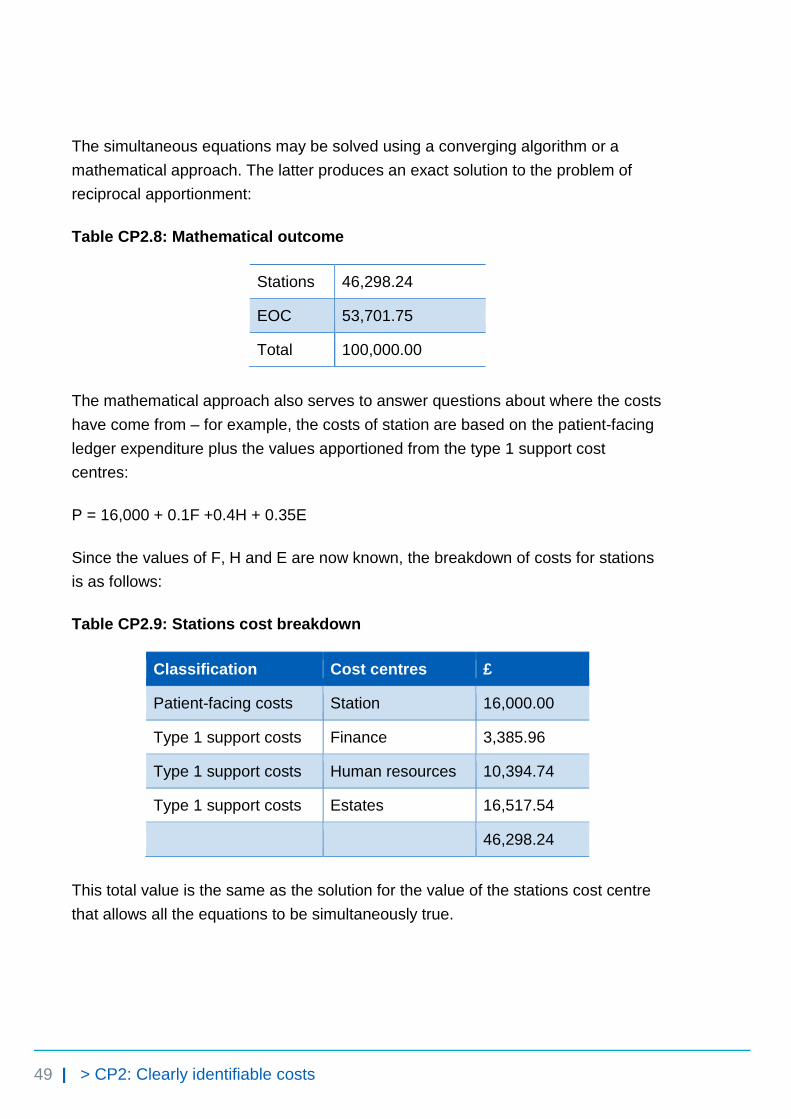
The simultaneous equations may be solved using a converging algorithm or a
mathematical approach. The latter produces an exact solution to the problem of
reciprocal apportionment:
Table CP2.8: Mathematical outcome
Stations 46,298.24
EOC 53,701.75
Total 100,000.00
The mathematical approach also serves to answer questions about where the costs
have come from – for example, the costs of station are based on the patient-facing
ledger expenditure plus the values apportioned from the type 1 support cost
centres:
P = 16,000 + 0.1F +0.4H + 0.35E
Since the values of F, H and E are now known, the breakdown of costs for stations
is as follows:
Table CP2.9: Stations cost breakdown
Classification Cost centres £
Patient-facing costs Station 16,000.00
Type 1 support costs Finance 3,385.96
Type 1 support costs Human resources 10,394.74
Type 1 support costs Estates 16,517.54
46,298.24
This total value is the same as the solution for the value of the stations cost centre
that allows all the equations to be simultaneously true.

50 | > CP3: Appropriate cost allocation methods
CP3: Appropriate cost allocation methods
Purpose: To ensure that the correct quantum of costs is allocated to the correct activity using the most appropriate costing allocation method.
Objectives
1. To ensure resources are allocated to activities using a single appropriate
method, ensuring consistency and comparability in collecting and reporting
cost information, and minimising subjectivity.
2. To ensure costs are allocated to activities using an appropriate information
source.
3. To ensure resources are allocated to activities in a way that reflects how care
is delivered to the patient.
4. To ensure relative weight values reflect how costs are incurred.
Scope
5. This standard should be applied to all costs reported in the cost ledger.
6. All activities going through the 999 service control centre and undertaken by
the organisation.
7. This standard covers relative weight values.
51 | > CP3: Appropriate cost allocation methods
Overview
8. The standardised costing process using resources and activities aims to
capture cost information by reflecting the causality of costs.
9. The costing process allocates resources to incidents and patients in two
steps:
• allocate resources to activities (this standard)
• match costed activities to the correct incident and patient (Standard CP4:
Matching costed activities to incidents and patients).
10. The allocation methods prescribed in the standards in most cases do not
include a relative weight value for acuity or intensity. If you are using a relative
weight value for acuity or intensity with the prescribed allocation method,
continue to do this and record it in your costing manual.
What you need to implement this standard
• Costing principle 2: Good costing should include all costs for an
organisation and produce reliable and comparable results
• Costing principle 5: Good costing should focus on materiality
• Costing principle 6: Good costing should be consistent across services,
enabling cost comparison within and across organisations27
• Spreadsheet CP3.1: Resources for patient-facing and type 2 support costs
• Spreadsheet CP3.2: Activities
• Spreadsheet CP3.3: Allocation methods to allocate patient-facing and type
2 support resources, first to activities then to incidents and finally to patients
Approach
Resources
11. Resources are what the provider purchases to help deliver the service. A
resource may be a care provider, equipment or a consumable.
27
See The costing principles, https://improvement.nhs.uk/resources/approved-costing-guidance/
52 | > CP3: Appropriate cost allocation methods
12. The costs within a resource may have different information sources and cost
drivers. For example, the patient-facing frontline staff resource could include
the costs of frontline staff salaries, and type 1 support costs such as
operational manager costs, station non-pay costs, HR and finance costs.
13. The transparency of these costs – what they are and where they come from in
the general ledger – should be maintained throughout the costing process.
14. Once these separated costs have been calculated they can be aggregated to
whatever level the resources have been set at, and you can be confident the
resource unit cost is accurate because it is underpinned by this costing
process.
15. Spreadsheet CP3.1 lists the prescribed patient-facing and type 2 support
resources to be used for the costing process.
16. Resources are classified as either patient facing or support type 2 (see
column E in Spreadsheet CP3.1).
17. Spreadsheet CP2.1 contains the mapping from each line in the cost ledger to
the patient-facing and type 2 support resources (see columns I and J).
Activities
18. Activities are the work undertaken by resources to deliver the services
required by patients to achieve desired outcomes: for example, answering a
call or treating patients at the scene.
19. Together, resources and activities form a two-dimensional view of what costs
were incurred to deliver what activities.
20. Activities are classified either as patient-facing or type 2 support activities.
21. You need to identify all the activities your organisation performs from the
prescribed list of patient-facing and type 2 support activities in column B in
Spreadsheet CP3.2.
22. Some activities are informed by patient-level feeds: for example, the activity
‘mobile to scene’ uses information from the response feed (feed 2) for costing.
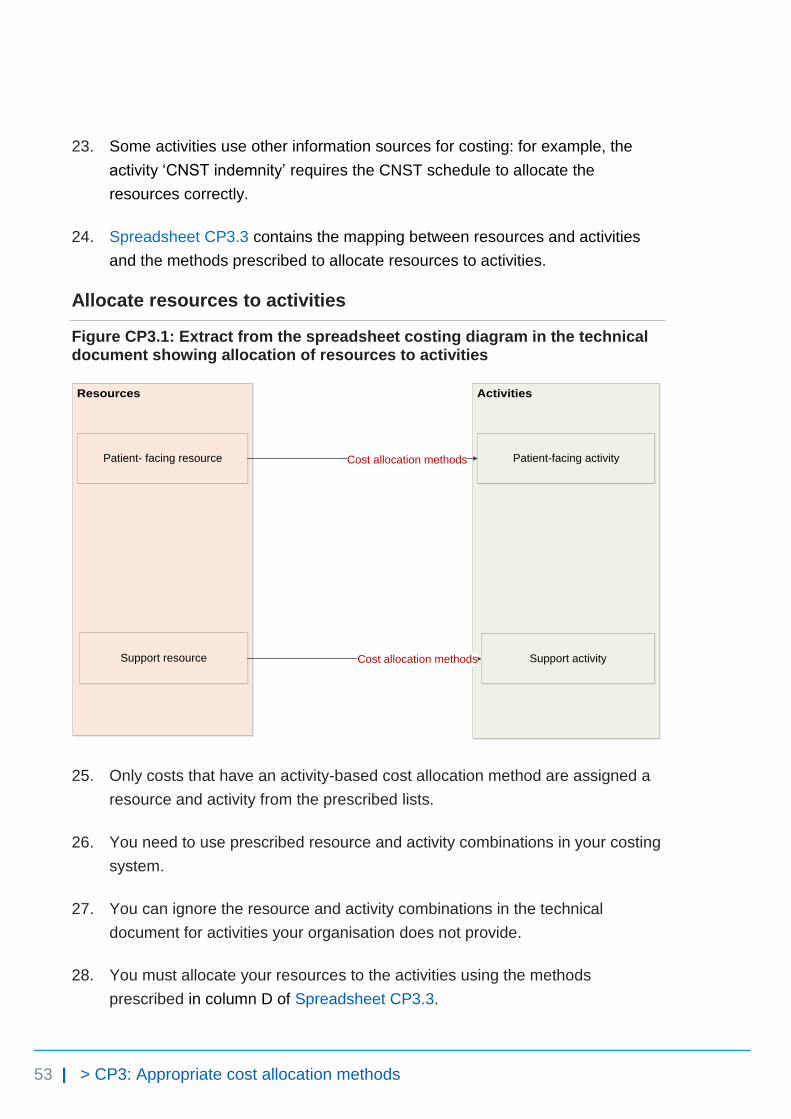
53 | > CP3: Appropriate cost allocation methods
23. Some activities use other information sources for costing: for example, the
activity ‘CNST indemnity’ requires the CNST schedule to allocate the
resources correctly.
24. Spreadsheet CP3.3 contains the mapping between resources and activities
and the methods prescribed to allocate resources to activities.
Allocate resources to activities
Figure CP3.1: Extract from the spreadsheet costing diagram in the technical document showing allocation of resources to activities
Resources Activities
Patient- facing resource
Support resource
Cost allocation methods
Cost allocation methods
Patient-facing activity
Support activity
25. Only costs that have an activity-based cost allocation method are assigned a
resource and activity from the prescribed lists.
26. You need to use prescribed resource and activity combinations in your costing
system.
27. You can ignore the resource and activity combinations in the technical
document for activities your organisation does not provide.
28. You must allocate your resources to the activities using the methods
prescribed in column D of Spreadsheet CP3.3.
54 | > CP3: Appropriate cost allocation methods
29. Resources need to be allocated to activities in the correct proportion. There
are three ways to do this:
• based on actual time or costs28 from the relevant feed
• using relative weight values29 created in partnership with the relevant
departments
• using a local information source.
30. Where resources need to be apportioned to several activities, you need to
determine the percentage of the cost to apportion to each, after discussions
with clinicians and managers, supported by documented evidence where
available (eg paramedic rota plans).
31. One way to do this is to disaggregate the cost ledger further to
resource/activity level. Figure CP3.2 shows how this could look in the
resource/activity matrix for a division of frontline staffing costs.
32. Note that frontline staffing resources do not need to be apportioned to each
job cycle activity30 as this is done when allocating resources to activities – that
is, apportioning and allocating resources happens in one step (see Standard
CM1: Allocating costs to job cycle elements).
28
The costs should be used as a weighting rather than a fixed cost. 29
Relative weight values are statistics to allocate costs in proportion to the total cost incurred. They are an agreed weighting of an item used to allocate costs at a patient event.
30 Includes the following activities: allocation to mobile, mobile to scene, time on scene, convey
patients to treatment location, patient handover and handover to clear.
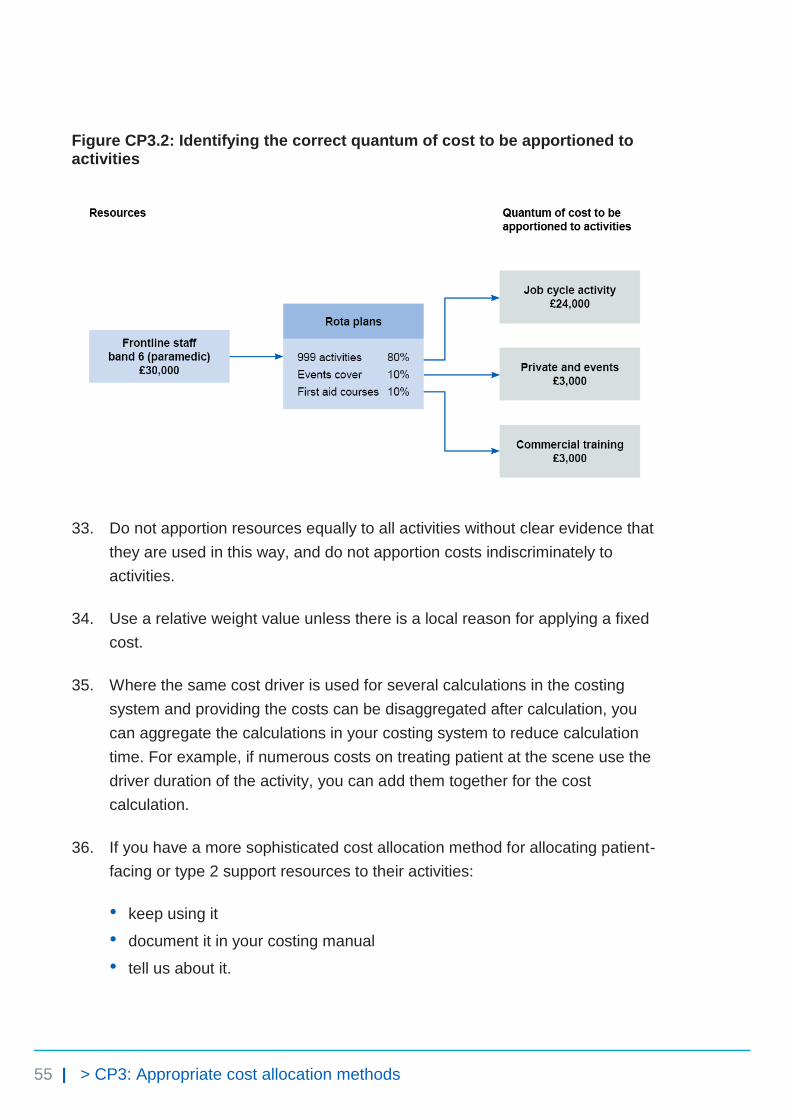
55 | > CP3: Appropriate cost allocation methods
Figure CP3.2: Identifying the correct quantum of cost to be apportioned to activities
33. Do not apportion resources equally to all activities without clear evidence that
they are used in this way, and do not apportion costs indiscriminately to
activities.
34. Use a relative weight value unless there is a local reason for applying a fixed
cost.
35. Where the same cost driver is used for several calculations in the costing
system and providing the costs can be disaggregated after calculation, you
can aggregate the calculations in your costing system to reduce calculation
time. For example, if numerous costs on treating patient at the scene use the
driver duration of the activity, you can add them together for the cost
calculation.
36. If you have a more sophisticated cost allocation method for allocating patient-
facing or type 2 support resources to their activities:
• keep using it
• document it in your costing manual
• tell us about it.

56 | > CP3: Appropriate cost allocation methods
37. We do not accept some cost allocation methods as superior to the prescribed
methods. These include using income or national averages to weight costs.
38. The patient-level feeds will inform the cost allocation methods providing key
cost drivers, such as duration of each job cycle element. The activity feeds will
also provide information for relative weight values to be used in the costing
process, such as fleet repairs and maintenance costs in the fleet information
feed (feed 5).
39. Investigate any costs not driven to an activity, or any activities that have not
received a cost, and correct this.
Relative weight values
40. Relative weight values are values or statistics used to allocate costs to a
patient event in proportion to the total cost incurred.
41. One way to store the relative weight values for use in your costing system is to
compile statistic allocation tables.
42. Income values and national cost averages should not be used as relative
weight values.
43. Relative weight values are used to allocate costs when other drivers are not
available or appropriate. They must be developed and agreed with the
relevant service managers and clinicians to ascertain all aspects of the costs
involved and ensure these are as accurate as possible.
44. You should allocate all costs to patients based on actual usage or
consumption. Where you cannot do this, you should use a relative weight
value to allocate costs to a patient.
45. Relative weight values should be reviewed on a rolling programme or when a
significant change occurs in the relevant department.
Relative weight values for type 1 support costs
46. To allocate type 1 support costs in the correct proportion, relative weight
values may need to be identified by obtaining the relevant information from the
departments.
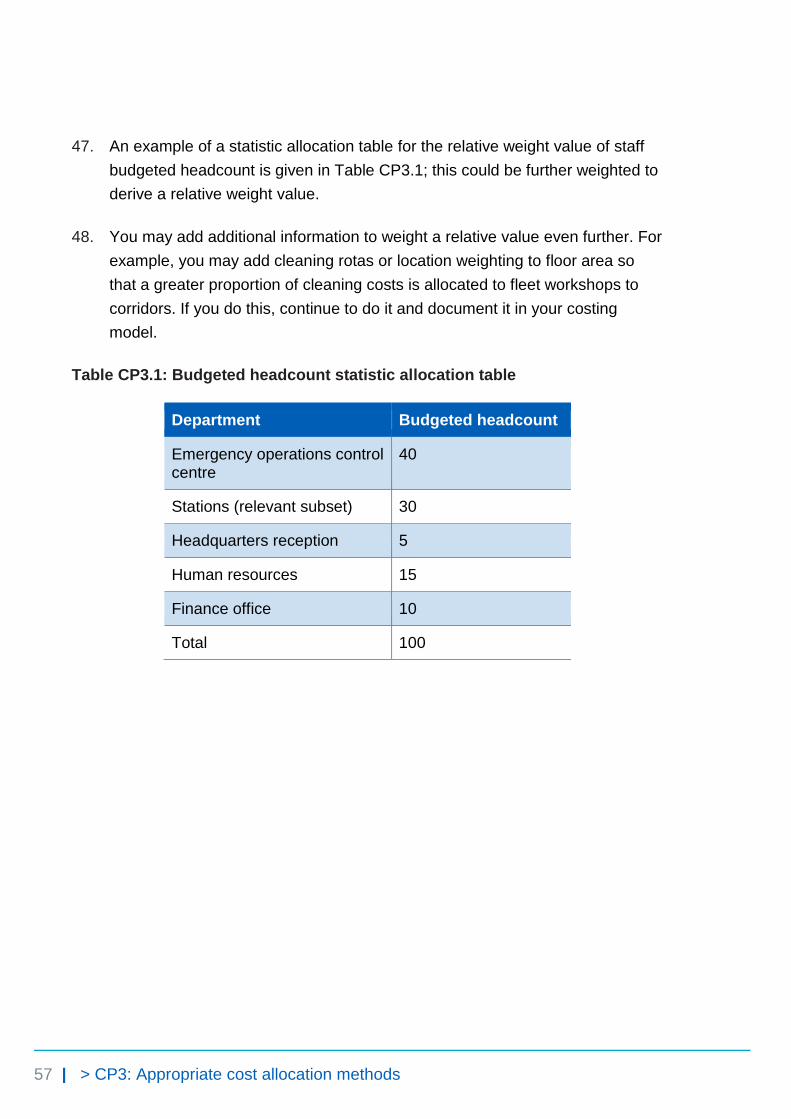
57 | > CP3: Appropriate cost allocation methods
47. An example of a statistic allocation table for the relative weight value of staff
budgeted headcount is given in Table CP3.1; this could be further weighted to
derive a relative weight value.
48. You may add additional information to weight a relative value even further. For
example, you may add cleaning rotas or location weighting to floor area so
that a greater proportion of cleaning costs is allocated to fleet workshops to
corridors. If you do this, continue to do it and document it in your costing
model.
Table CP3.1: Budgeted headcount statistic allocation table
Department Budgeted headcount
Emergency operations control centre
40
Stations (relevant subset) 30
Headquarters reception 5
Human resources 15
Finance office 10
Total 100
58 | > CP4: Matching costed activities to incidents and patients
CP4: Matching costed activities to incidents and patients
Purpose: To achieve consistency across organisations in assigning costed activities to the correct incidents and patients.
Objectives
1. To assign costed activities to the correct incident and patient to produce
patient unit costs.
2. To highlight and report source data quality issues that hinder accurate
matching.
Scope
3. This standard should be applied to all costed activities.
Overview
4. Matching is integral to accurate patient-level costing. For an accurate final
patient unit cost, the costed activities need to be matched first to the incident
and then to the patient.
5. Matching of physical response stage activities31 and some call stage
activities32 to incidents takes place before the costing process – it is done in
your computer aided dispatch (CAD) system (see Standard IR1: Collecting
31
Including activities: allocation to mobile, mobile to scene, time on scene, convey patients to treatment locations, patient handover and handover to clear.
32 Including call taking and telephone clinical advice.

59 | > CP4: Matching costed activities to incidents and patients
information for costing). Therefore there is no need to repeat this step to
match these activities in the costing process.
6. Matching costed activities to incidents and patients involves two approaches:
• for activities informed by an activity feed, use the matching fields in the
activity feeds (see column F in Spreadsheet IR1.1)
• for all other activities, use the prescribed cost allocation methods to match
the costed activities to incidents and patients.
7. Limitations of the data on number of patients and other patient information
(see Standard IR2: Managing information for costing for details) mean that
exact matching of costed activities to each patient involved in one incident is
not currently possible. The standards prescribe cost allocation rules to match
these to patient unit costs (that is, a patient-level cost).
8. We will update this standard with rules to match costed activities to individual
patients once information is available to enable this; we anticipate this will be
possible once the electronic patient record (EPR) system has been more
widely adopted by the ambulance sector.
What you need to implement this standard
• Spreadsheet CP3.3: Allocation methods to allocate resources, first to
activities then to incidents and finally to patients
Approach
Matching costed activities
9. The matching process for costed activities involves two steps:
• matching activities to incidents
• matching costed incidents to patients.
10. This two-step matching process is used because more than one patient can
be treated in any one incident (which is widely used as the activity unit for
ambulance emergency responses). To derive the patient unit cost, you need
to match costed activities first to the incident and then to the patient.

60 | > CP4: Matching costed activities to incidents and patients
11. Figure CP4.1, adapted from the costing diagram in the technical document,
shows the two-step matching process. Please refer to Spreadsheet CP3.3 for
details of the matching and allocation rules.
Figure CP4.1: Extract from the spreadsheet costing diagram in the technical
document showing matching of costed activities to incidents and patients
Activities
Incident
Matching
Cost allocation
methods
Patient-facing activity
Support activity
Cost allocation rules
Patient
in single-patient
incident
Matching
Patient
in multiple-patient
incident
Cost allocation
rules
Matching to single-patient incident and patient
12. The prescribed matching fields ensure the relevant auxiliary data feeds can be
attached to the correct incident and patient.
13. The incident, call or response ID always generates the best match.
14. If you obtain your auxiliary data feeds from the CAD system and you can
include the incident ID in the feeds, use this ID to match the auxiliary feed (eg
response information feed) to the master feed (incident information feed).
15. Matching physical response stage activities and some of the call stage
activities to incidents is done in your organisation’s CAD system (see column
E in Spreadsheet 3.3 for details).
16. However, there are problems matching activities to incidents when:

61 | > CP4: Matching costed activities to incidents and patients
• duplicate calls are taken
• clinical advice is provided to an ambulance crew at the scene.
These problems are discussed in Standard IR1: Collecting information for
costing.
17. For these activities, as well as type 2 support activities, you should follow the
cost allocation rules and methods prescribed in column E (step 2) in
Spreadsheet CP3.3 to allocate the costs to an incident.
18. After matching the costed activities to single-patient incidents, you should
have the patient unit cost – cost at a patient level. Where possible, you should
then match the costed incidents to patients using recorded patient identifiers.
We know that patient identifiers are not always collected, as described in
paragraph 7 of this standard.
Matching to multiple-patient incident and patients
19. Follow the same approach to match costed activities to a multiple-patient
incident as for a single-patient incident.
20. Limitations of the information collected on patients mean matching every
patient involved in a multiple-patient incident is not currently possible (see
Standard IR2: Managing information for costing).
21. Use the cost allocation rules prescribed in column F (step 3) Spreadsheet
CP3.3 to allocate the incident-level costs to all the patients involved in an
incident to derive the patient unit cost.
22. Use number of vehicles arriving at the treatment location as a proxy for
the number of patients conveyed, and then split the costs between this
number of patients. See Standard CM1: Allocating costs to job cycle elements
and Standard IR2: Managing information for costing for reasons of the proxy
used.
23. The accuracy with which costed activities are matched depends on the quality
of both the master feeds and the auxiliary feeds. Follow the guidance in
Standard IR2: Managing information for costing to help your organisation
improve its data quality.

62 | > CP4: Matching costed activities to incidents and patients
24. If your matching rules are more sophisticated than the prescribed matching
fields and improve the accuracy of your matching, continue to use them and
record them in your costing manual.
Other considerations
25. Your costing system should produce a report of the matching criteria used in
the system as described in Table CP5.1 in Standard CP5: Reconciliation, and
you should have a rolling programme to review this.
Reporting unmatched activity for local business intelligence
26. Organisations have traditionally treated the cost of the unmatched activity in
different ways. Most commonly, it has been absorbed by matched activity, a
practice which can have a material impact on the cost of matched activity,
particularly when reviewing the cost at an individual patient level for
benchmarking and tariff calculation.
27. For local reporting purposes we recommend you do not assign unmatched
activity to other incidents or patients but report them as reconciliation items.
28. If reported unmatched activity forms a material proportion of an organisation’s
expenditure, this is likely to be due to poor source data. As this issue will
deflate the patient unit cost, it needs to be identified and steps taken to
improve the quality of the source data, rather than artificially inflating the
patient unit cost by allocating unmatched activity. Please follow the guidance
in Standard IR2: Managing information for costing to support your organisation
in improving its data quality.
PLICS collection requirements
29. For the PLICS collection, costs should be aggregated at incident level.
30. Unmatched cost should not be reported separately. All unmatched costs
should be allocated to incidents using matched activity. See the ambulance
PLICS cost collection guidance for more information.33
33
https://improvement.nhs.uk/resources/approved-costing-guidance-collections/

63 | > CP5: Reconciliation
CP5: Reconciliation
Purpose: Process for reconciling costs and income to the organisation’s accounts, and to reconcile the activity counts reported by the organisation.
Objectives
1. To ensure the cost and income outputs from the costing system reconcile to
the organisation’s accounts.
2. To ensure the activity outputs from the costing system reconcile to what the
organisation is reporting.
Scope
3. This standard covers all costs, income and activity included in the costing
process.
Overview
4. All outputs of the costing process must reconcile to the information reported to
the board, and in the final audited accounts. This ensures a clear link between
these outputs and the costs and activity information captured in the source
data.
What you need to implement this standard
• Costing principle 2: Good costing should include all costs for an
organisation and produce reliable and comparable results
• Costing principle 4: Good costing should involve transparent processes that
allow detailed analysis34
34
See The costing principles, https://improvement.nhs.uk/resources/approved-costing-guidance/

64 | > CP5: Reconciliation
Approach
Reconciliation of costs and income
5. The costs and income outputs must reconcile to the main sources of this
information, the general ledger and the organisation’s reported financial
position.35
6. To demonstrate that the outputs of the costing process reconcile to the main
sources of information, the reports listed in Table CP5.1 must be available
from your costing system.
Table CP5.1: Cost reconciliation reports
Report name Report purpose
Input accounting reconciliation
Enables the totals for the cost ledger and income ledger to be reconciled to the monthly statement of comprehensive income (SOCI) reported by the board for the period reported on, as well as to the final audited accounts at year-end.
Internal reporting reconciliation
Shows the costs from the monthly, quarterly or annual report reconciled to the costs reported in the costing system. Clear records must be kept of any adjustments leading to differences between them, both for internal purposes and to provide a clear audit trail.
Locality or service level reports
Detailed reports of income and costs at provider level, service-line level, localities (eg clinical commissioning groups (CCGs) or locally defined operational areas), down to the level of each incident and patient. This should encourage operational engagement, as details of the resources and activities involved in each individual pathway will be available.
Output accounting reconciliation
Checks that the final costing outputs reconcile to those in the board reports and the audited annual accounts, with the option in the costing system to amend values for any post-closure adjustments, thereby ensuring that the final costing outputs reconcile to these earlier reports.
Adjustments and Documents all the adjustments and exclusions to the total
35
See Standard CP2: Clearly identifiable costs for guidance on where adjustments may be made between the general ledger output and the cost ledger, to be included in your reconciliation.
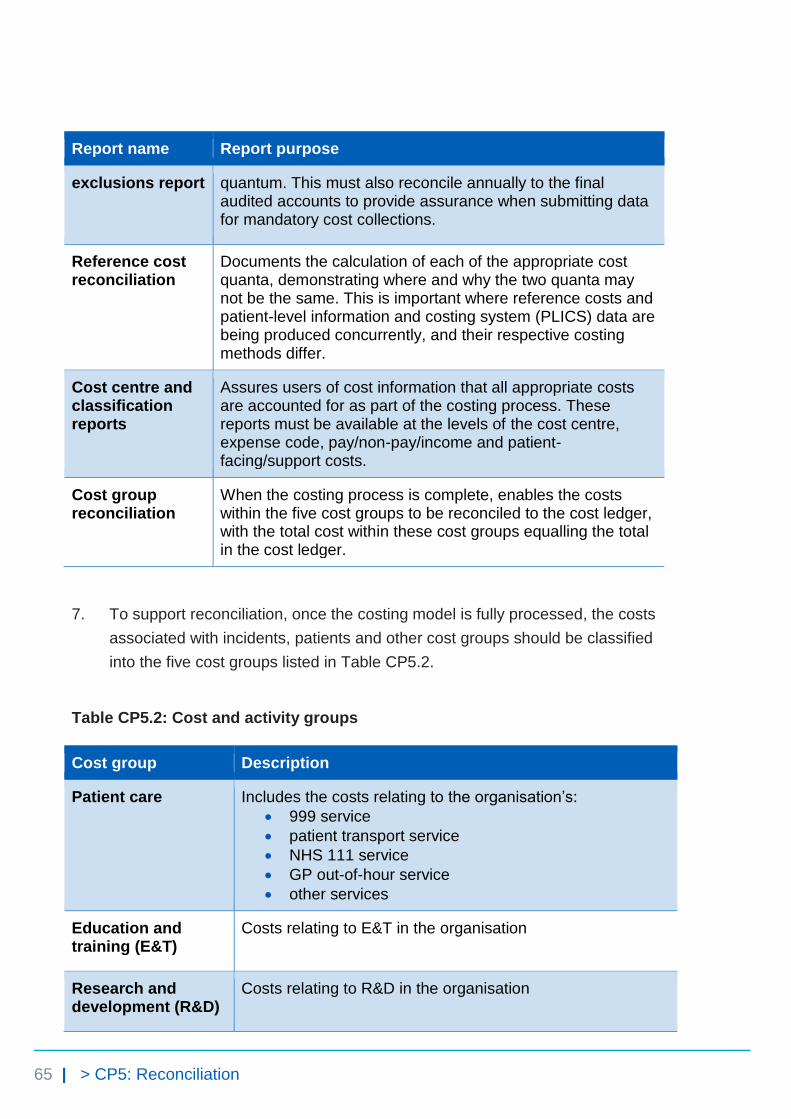
65 | > CP5: Reconciliation
Report name Report purpose
exclusions report quantum. This must also reconcile annually to the final audited accounts to provide assurance when submitting data for mandatory cost collections.
Reference cost reconciliation
Documents the calculation of each of the appropriate cost quanta, demonstrating where and why the two quanta may not be the same. This is important where reference costs and patient-level information and costing system (PLICS) data are being produced concurrently, and their respective costing methods differ.
Cost centre and classification reports
Assures users of cost information that all appropriate costs are accounted for as part of the costing process. These reports must be available at the levels of the cost centre, expense code, pay/non-pay/income and patient-facing/support costs.
Cost group reconciliation
When the costing process is complete, enables the costs within the five cost groups to be reconciled to the cost ledger, with the total cost within these cost groups equalling the total in the cost ledger.
7. To support reconciliation, once the costing model is fully processed, the costs
associated with incidents, patients and other cost groups should be classified
into the five cost groups listed in Table CP5.2.
Table CP5.2: Cost and activity groups
Cost group Description
Patient care Includes the costs relating to the organisation’s:
999 service
patient transport service
NHS 111 service
GP out-of-hour service
other services
Education and training (E&T)
Costs relating to E&T in the organisation
Research and development (R&D)
Costs relating to R&D in the organisation
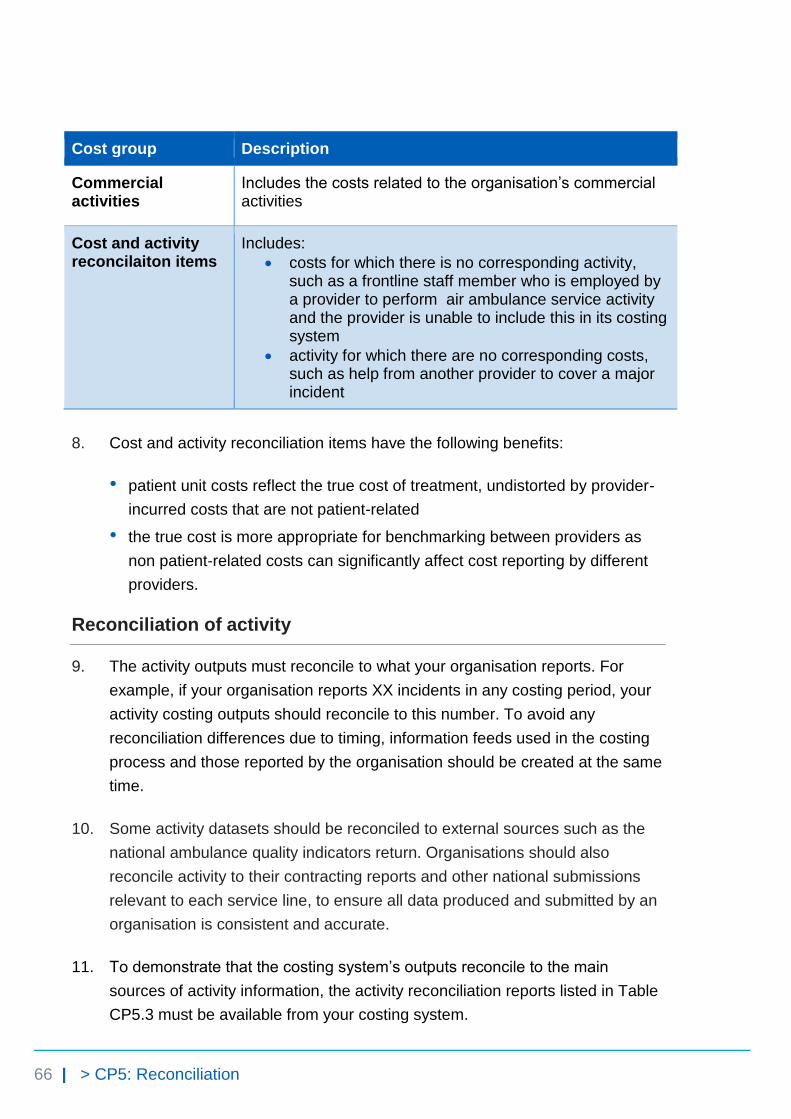
66 | > CP5: Reconciliation
Cost group Description
Commercial activities
Includes the costs related to the organisation’s commercial activities
Cost and activity reconcilaiton items
Includes:
costs for which there is no corresponding activity, such as a frontline staff member who is employed by a provider to perform air ambulance service activity and the provider is unable to include this in its costing system
activity for which there are no corresponding costs, such as help from another provider to cover a major incident
8. Cost and activity reconciliation items have the following benefits:
• patient unit costs reflect the true cost of treatment, undistorted by provider-
incurred costs that are not patient-related
• the true cost is more appropriate for benchmarking between providers as
non patient-related costs can significantly affect cost reporting by different
providers.
Reconciliation of activity
9. The activity outputs must reconcile to what your organisation reports. For
example, if your organisation reports XX incidents in any costing period, your
activity costing outputs should reconcile to this number. To avoid any
reconciliation differences due to timing, information feeds used in the costing
process and those reported by the organisation should be created at the same
time.
10. Some activity datasets should be reconciled to external sources such as the
national ambulance quality indicators return. Organisations should also
reconcile activity to their contracting reports and other national submissions
relevant to each service line, to ensure all data produced and submitted by an
organisation is consistent and accurate.
11. To demonstrate that the costing system’s outputs reconcile to the main
sources of activity information, the activity reconciliation reports listed in Table
CP5.3 must be available from your costing system.
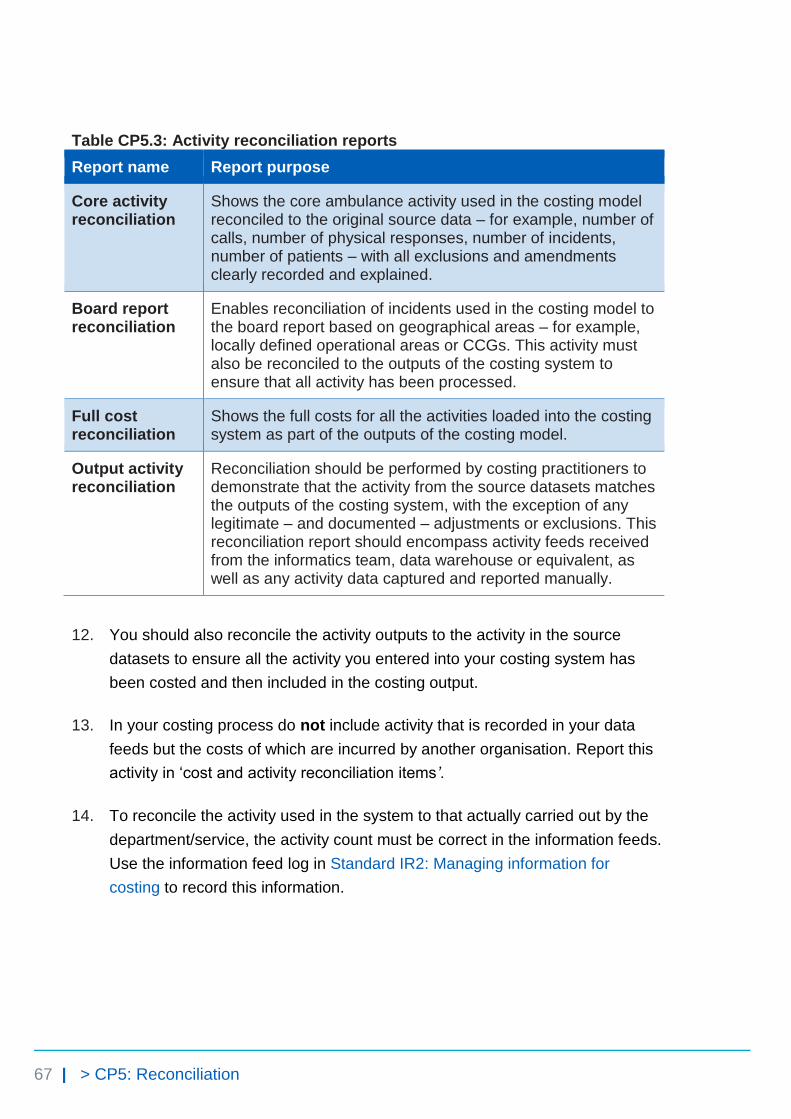
67 | > CP5: Reconciliation
Table CP5.3: Activity reconciliation reports
Report name Report purpose
Core activity reconciliation
Shows the core ambulance activity used in the costing model reconciled to the original source data – for example, number of calls, number of physical responses, number of incidents, number of patients – with all exclusions and amendments clearly recorded and explained.
Board report reconciliation
Enables reconciliation of incidents used in the costing model to the board report based on geographical areas – for example, locally defined operational areas or CCGs. This activity must also be reconciled to the outputs of the costing system to ensure that all activity has been processed.
Full cost reconciliation
Shows the full costs for all the activities loaded into the costing system as part of the outputs of the costing model.
Output activity reconciliation
Reconciliation should be performed by costing practitioners to demonstrate that the activity from the source datasets matches the outputs of the costing system, with the exception of any legitimate – and documented – adjustments or exclusions. This reconciliation report should encompass activity feeds received from the informatics team, data warehouse or equivalent, as well as any activity data captured and reported manually.
12. You should also reconcile the activity outputs to the activity in the source
datasets to ensure all the activity you entered into your costing system has
been costed and then included in the costing output.
13. In your costing process do not include activity that is recorded in your data
feeds but the costs of which are incurred by another organisation. Report this
activity in ‘cost and activity reconciliation items’.
14. To reconcile the activity used in the system to that actually carried out by the
department/service, the activity count must be correct in the information feeds.
Use the information feed log in Standard IR2: Managing information for
costing to record this information.
68 | > CP5: Reconciliation
PLICS collection requirements
15. For collection, the provider’s PLICS quantum must reconcile to its final audited
accounts. See the ambulance PLICS cost collection guidance for more
information.36
36
https://improvement.nhs.uk/resources/approved-costing-guidance-collections/

© NHS Improvement 2018 Publication code: CG 27/18
Contact us:
NHS Improvement
Wellington House
133-155 Waterloo Road
London
SE1 8UG
This publication can be made available in a number of other formats on request.