Amárach Economic Recovery Index April 2016 Special Edition
27
1 Economic Recovery Index Economic Recovery Index An Amárach Research Briefing Special Edition: April 2016
-
Upload
amarach-research -
Category
Marketing
-
view
354 -
download
1
Transcript of Amárach Economic Recovery Index April 2016 Special Edition

1 Economic Recovery Index
Economic Recovery Index An Amárach Research Briefing
Special Edition: April 2016

2 Economic Recovery Index
Are We There Yet?
It’s seven years since we started tracking
the Economic Recovery Index and so it
seems like a good time to look at our
progress so far.
This month we take a more detailed look at
what has changed and not changed in the
mood and intentions of Irish consumers over
that period, revisiting some questions we
posed several years ago and have updated
for the first time since 2009 and 2011.
Our overall ERI measure has continued to
decline from its peak at the start of the year
– and as you’ll see, the recovery, like the
recession, is not evenly distributed.

3 Economic Recovery Index
The Emotional Recovery
We have been reporting our monthly
Economic Recovery Index since April 2009.
We set out over six years ago to assess the
psychological impact of the recession and to
chart our ‘emotional progress’ towards
recovery alongside our ‘economic progress’.
This report summarises our Economic
Recovery Index results from April 2009
to April 2016.
The most recent fieldwork was conducted
during 19th to 25th April 2016 inclusive.
See how bad it was seven years ago: http://www.slideshare.net/amarach/the-economic-recovery-index-july-results-2009

Economic Recovery Index
5 Economic Recovery Index
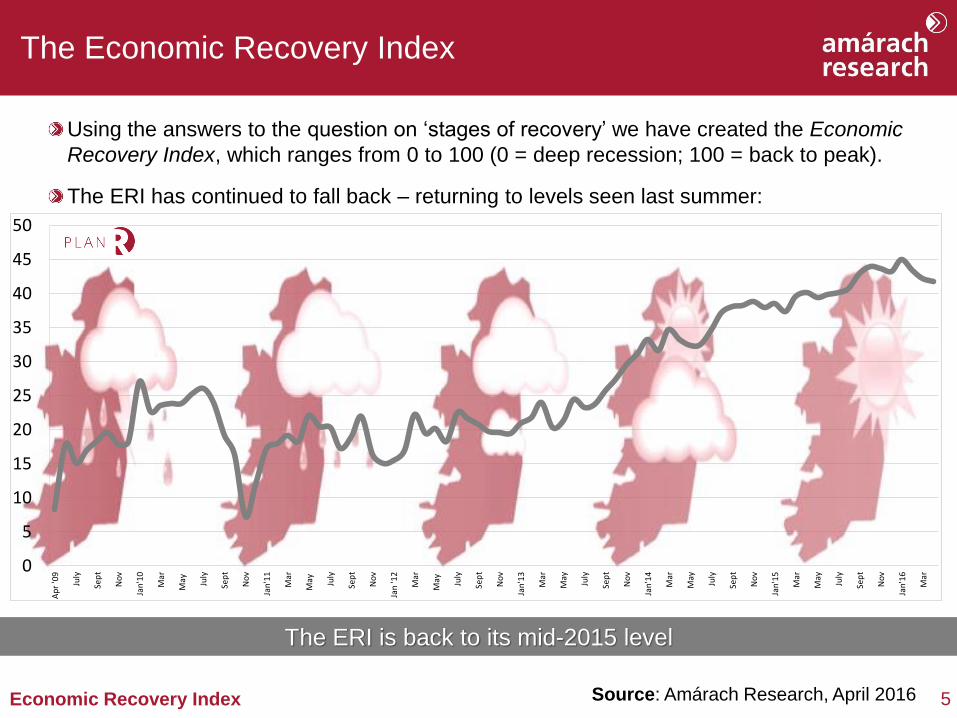
Using the answers to the question on ‘stages of recovery’ we have created the Economic
Recovery Index, which ranges from 0 to 100 (0 = deep recession; 100 = back to peak).
The ERI has continued to fall back – returning to levels seen last summer:
The Economic Recovery Index
Source: Amárach Research, April 2016
0
5
10
15
20
25
30
35
40
45
50
Ap
r '0
9
July
Sep
t
No
v
Jan
'10
Mar
May Ju
ly
Sep
t
No
v
Jan
'11
Mar
May Ju
ly
Sep
t
No
v
Jan
'12
Mar
May Ju
ly
Sep
t
No
v
Jan
'13
Mar
May
July
Sep
t
No
v
Jan
'14
Mar
May
July
Sep
t
No
v
Jan
'15
Mar
May
July
Sep
t
No
v
Jan
'16
Mar
The ERI is back to its mid-2015 level

6 Economic Recovery Index
ERI Summary Table
Which one statement ‘best describes the economic situation in Ireland right now’?
% choosing each statement:
%
The economic
situation in
Ireland is
getting worse
The economic
situation is bad
but has
stabilized
The economic
situation is bad
but showing a
few signs of
improvement
The economic
situation is
getting better
and showing
clear signs of
improvement
The economic
situation is
good and
almost fully
recovered
Economic
Recovery
Index
Apr-09 77 14 8 1 0 8.3
Apr-10 38 34 25 2 1 23.8
Apr-11 51 27 19 2 1 18.2
Apr-12 49 27 21 3 0 19.4
Apr-13 46 29 22 3 0 20.3
Apr-14 23 32 35 9 1 33.2
Apr-15 14 30 37 17 2 40.2
Mar-16 13 30 35 20 2 42.2
Apr-16 16 30 32 20 2 41.8
Nevertheless the ERI remains above the 40 level

Consumer Impact

8 Economic Recovery Index
Recession, Resilience & Recovery
We started calling our Index the ‘Recovery
Index’ back in April 2009 as we wanted to
emphasise the positive and didn’t think the
recession would last so long!
Over these past seven years we have tracked
the highs and lows (and some very lows) in
terms of the mood of the nation and the
impact on consumer spending, borrowing and
saving intentions.
We’ve also seen remarkable resilience on the
part of the Irish people when it comes to
‘getting on’ with their lives, despite macro-
economic uncertainties.
In this section we look at how far we have
come, and how far we still have to go.

9 Economic Recovery Index
Consumer Sentiment Summary Table I
% agree strongly/slightly with selected statements:
%
Ireland will be
through the worst
of the recession
in 12 months
time
I feel I am
financially
comfortable
enough to make
it through the
recession
I am optimistic in
spite of the
current economic
situation
Right now it seems
like the recession is
affecting other
people more than it
is affecting me
Apr-09 34 48 57 59
Apr-10 43 47 52 53
Apr-11 24 39 47 48
Apr-12 31 42 51 50
Apr-13 25 35 40 44
Apr-14 35 40 49 43
Apr-15 46 45 57 44
Mar-16 37 44 52 44
Apr-16 32 42 47 42
Feeling ‘financially comfortable’ remains flat

10 Economic Recovery Index
Consumer Sentiment Summary Table II
% agree strongly/slightly with selected statements:
%
I am more relaxed
about spending
money than I was a
few months ago
I am saving a lot
more than before
because of the
recession
My main financial
priority is to pay off
my debts as
quickly as possible
I would be happy
to borrow money
from a bank if I
need to
Apr-09 15
Apr-10 21 28 59 31
Apr-11 14 27 58 24
Apr-12 20 30 59 28
Apr-13 15 23 57 21
Apr-14 24 24 56 26
Apr-15 30 26 51 28
Mar-16 28 25 55 26
Apr-16 27 23 51 24
Spending sentiment has weakened in recent months

11 Economic Recovery Index
R²=0.90181
0
5
10
15
20
25
30
35
40
0.0 5.0 10.0 15.0 20.0 25.0 30.0 35.0 40.0 45.0 50.0
%Agree:M
oreRelaxedAboutSpendingMoney
EconomicRecoveryIndex
EconomicSentimentDrivesConsumerSpendingSentiment
Consumer Sentiment & ERI: April 2009-April 2016
The ERI and consumer spending sentiment are highly correlated

12 Economic Recovery Index
Recovery Priced In?
Trend for price focus and switching intentions appears downwards in past 3 years
40
45
50
55
60
65
70
75
80
Recessionistas%consumersagree:buylowestprice&readytoswitch
Ialwaysbuythelowestpriceproductsorservices Iamalwaysonthelookoutforopportunitiestoswitchtocheapersuppliers

13 Economic Recovery Index
Financial Resilience: 1
Despite the macro improvement, at a micro level consumers are still worried
35%
57%
66%
36%
56%
47%
I lose sleep worrying abouthow to cope with my
financial commitments
When shopping I budget forevery cent
I am afraid to make plansfor the future given the
uncertainty
Still Pressured % agreeing with each statement: 2009 vs 2016
2009 2016

14 Economic Recovery Index
Financial Resilience: 2
The ‘shock’ of the recession may be over, but the impact lingers in consumer mindset
81%
71% 70% 61% 58%
49%
I am consciously trying tobuy fewer things nowadays
I am striving for a simplerlife
I am not making anysignificant financial
decisions until thingsimprove in the economy
Taking Control % agreeing with each statement: 2009 vs 2016
2009 2016

15 Economic Recovery Index
Financial Resilience: 3
There is evidence of some improved resilience – but most still vulnerable
24%
12%
8%
31%
17%
13%
€50 reduction €100 reduction €150 reduction
Resilient Consumers % able to ‘cope easily’ with varying reductions in
monthly after tax income: 2011 vs 2016
2011 2016

16 Economic Recovery Index
Not So Negative Equity
There has been an reduction in perceived negative equity since 2011
22% 19%
50%
9% 15%
18%
53%
14%
Value of home lessthan mortgage
Value of home sameas mortgage
Value of homegreater than
mortgage
Don't know
Negative vs Positive Equity % of home owners with mortgages in negative or positive
equity: 2011 vs 2016
2011 2016

Mood of the Nation
18 Economic Recovery Index
The Real Mood of the Nation
When we started measuring and reporting the
Economic Recovery Index we wanted it to be
more than just another ‘confidence index’.
We therefore set out to measure the full
spectrum of emotions experienced by Irish
consumers – positive as well as negative ones
– in order to provide a unique insight into the
real ‘mood’ of the nation.
We have seen some interesting trends as a
result, including a widening gap between
positive and negative emotions – though both
are trending downwards over time.
The following charts review the past seven
years and some key trends.

19 Economic Recovery Index
Emotional Economics: 1
An improving economic outlook reduces stress & worry, but no significant impact on
happiness or enjoyment
-0.16 -0.17 -0.21
-0.48 -0.49
-0.67
-0.72
Happiness Sadness Enjoyment Anger Anxiety Worry Stress
ERI Correlation with Emotions April 2009-April 2016

20 Economic Recovery Index
Emotional Economics: 2
0.0
5.0
10.0
15.0
20.0
25.0
30.0
35.0
40.0
45.0
50.0
20
25
30
35
40
45
50
55
Apr-09
Jun-09
Aug-09
Oct-09
Dec-09
Feb-10
Apr-10
Jun-10
Aug-10
Oct-10
Dec-10
Feb-11
Apr-11
Jun-11
Aug-11
Oct-11
Dec-11
Feb-12
Apr-12
Jun-12
Aug-12
Oct-12
Dec-12
Feb-13
Apr-13
Jun-13
Aug-13
Oct-13
Dec-13
Feb-14
Apr-14
Jun-14
Aug-14
Oct-14
Dec-14
Feb-15
Apr-15
Jun-15
Aug-15
Oct-15
Dec-15
Feb-16
EmotionalLowsTrendinERIvs%FeelingStressand%FeelingWorry
%Stress %Worry EconomicRecoveryIndex(RHS)

21 Economic Recovery Index
The Mood of the Nation – I
Did you experience any of these feelings a lot of the day yesterday?
% saying Yes: April 2009 to April 2016
Source: Amárach Research, April 2016
20%
25%
30%
35%
40%
45%
50%
55%
60%
65%
Ap
r '0
9
May
Ju
n
Ju
l
Au
g
Se
pt
Oct
Nov
Dec
Ja
n'1
0
Feb
Mar
Ap
r
May
Ju
ne
Ju
ly
Au
g
Se
pt
Oct
Nov
Dec
Ja
n'1
1
Feb
Mar
Ap
r
May
Ju
ne
Ju
ly
Au
g
Se
pt
Oct
Nov
Dec
Ja
n'1
2
Feb
Mar
Ap
r
May
Ju
ne
Ju
ly
Au
g
Se
pt
Oct
Nov
Dec
Ja
n'1
3
Feb
Mar
Ap
r
May
Ju
ne
Ju
ly
Au
g
Se
pt
Oct
Nov
Dec
Ja
n'1
4
Feb
Mar
Ap
r
May
Ju
ne
Ju
ly
Au
g
Se
pt
Oct
Nov
Dec
Ja
n'1
5
Feb
Mar
Ap
r
May
Ju
ne
Ju
ly
Au
g
Se
pt
Oct
Nov
Dec
Ja
n'1
6
Feb
Mar
Ap
r
Enjoyment Happiness Stress Worry

22 Economic Recovery Index
The Mood of the Nation – II
Did you experience any of these feelings a lot of the day yesterday?
% saying Yes: April 2009 to April 2016
Source: Amárach Research, April 2016
0%
5%
10%
15%
20%
25%
30%
35%
40%
Ap
r '0
9
May
Ju
n
Ju
l
Au
g
Se
pt
Oct
Nov
Dec
Ja
n'1
0
Feb
Mar
Ap
r
May
Ju
ne
Ju
ly
Au
g
Se
pt
Oct
Nov
Dec
Ja
n'1
1
Feb
Mar
Ap
r
May
Ju
ne
Ju
ly
Au
g
Se
pt
Oct
Nov
Dec
Ja
n'1
2
Feb
Mar
Ap
r
May
Ju
ne
Ju
ly
Au
g
Se
pt
Oct
Nov
Dec
Ja
n'1
3
Feb
Mar
Ap
r
May
Ju
ne
Ju
ly
Au
g
Se
pt
Oct
Nov
Dec
Ja
n'1
4
Feb
Mar
Ap
r
May
Ju
ne
Ju
ly
Au
g
Se
pt
Oct
Nov
Dec
Ja
n'1
5
Feb
Mar
Ap
r
May
Ju
ne
Ju
ly
Au
g
Se
pt
Oct
Nov
Dec
Ja
n'1
6
Feb
Mar
Ap
r
Anxiety Sadness Pain Anger

23 Economic Recovery Index
The Mood of the Nation – III
Did you experience any of these feelings a lot of the day yesterday?
% saying Yes: April 2016
Source: Amárach Research, April 2016
TOTAL Male Female 15-24 25-34 35-44 45-54 55+ Dublin ABC1
F50+
C2DE
F50-
Enjoyment 50% 45% 54% 46% 38% 48% 51% 64% 47% 54% 47%
Happiness 49% 46% 52% 45% 45% 48% 45% 58% 45% 51% 48%
Stress 35% 29% 41% 53% 36% 35% 33% 24% 36% 32% 38%
Worry 33% 28% 37% 47% 34% 30% 39% 21% 36% 30% 35%
Anxiety 28% 25% 32% 47% 29% 25% 29% 18% 31% 29% 28%
Boredom 22% 20% 24% 44% 22% 20% 20% 10% 20% 24% 20%
Physical Pain 25% 20% 29% 26% 21% 22% 30% 25% 24% 20% 28%
Sadness 22% 17% 26% 30% 24% 16% 26% 17% 23% 20% 23%
Anger 17% 16% 18% 25% 23% 14% 18% 9% 16% 16% 18%
Loneliness 16% 12% 20% 28% 19% 11% 18% 8% 16% 16% 16%
Fear 10% 9% 11% 16% 11% 9% 10% 6% 9% 9% 10%
Amárach Outlook

25 Economic Recovery Index
2016 Beginning
The first third of 2016 has seen a turning
point in our Economic Recovery Index.
We’ll keep tracking its progress into 2016 –
and we’ll keep you posted about Ireland’s
consumer needs.
We hope you find this edition of the
Economic Recovery Index helpful and
please do get in contact if you want to
discuss how it can be applied to your brand
planning requirements in 2016 and beyond.
For more on the ERI (including 7 years worth of data) see: http://www.amarach.com/resources/economic-recovery-index.htm

Trends Report
Check out our new PlanR
service: free to all regular
customers of Amárach.
Otherwise simply register,
select a subscription package
that suits your needs and start
creating your own research
dashboard from over 100
different trend series,
statistics and forecasts.
Go get PlanR here:
http://getplanr.com/

Trends Report
t. 01 410 5200
w. www.amarach.com
b. www.amarach.com/blog
tw. twitter.com/AmarachResearch
s. slideshare.net/amarach/