Alternative Energy Sources in Ghana The Case of Solar ...
68
Alternative Energy Sources in Ghana – The Case of Solar Photovoltaic By Nana Adjei A Major Paper submitted to the Faculty of Environmental Studies in partial fulfillment of the requirements for the Degree of Master in Environmental Studies, York University, Toronto, Ontario, Canada July 31, 2018.
Transcript of Alternative Energy Sources in Ghana The Case of Solar ...

Alternative Energy Sources in Ghana – The Case of Solar Photovoltaic
By
Nana Adjei
A Major Paper submitted to the Faculty of Environmental Studies in partial fulfillment of the
requirements for the Degree of Master in Environmental Studies, York University, Toronto,
Ontario, Canada
July 31, 2018.
DECLARATION
I hereby declare that this project is the result of my own work undertaken under the supervision
of the undersigned and all works have been referenced.
Nana Adjei …………………………………. ………………………. (Candidate) Signature Date Professor Jose Etcheverry ………………………………… ……………………….. (Supervisor) Signature Date Professor Ellie Perkins ………………………………. ………………………… (Advisor) Signature Date

i
ACKNOWLEDGEMENT
In many developing countries, like Ghana, the “3Rs” of Sustainability - Reduce, Recycle and Reuse
are hard to implement due mainly to financial constraints and competing national development
priorities. The current environment in Ghana as it pertains to achieving its sustainability goals
particularly in the energy sector have shaped my research interest and was a major driver in my
pursuit of the master’s in environmental studies (MES). The past two years have been filled with
valuable experiences. I met my beautiful wife Dr. Sandra Adjei and I started my consulting
company. I am grateful to the professors in the Faculty, especially Professor Jose Etcheverry and
Peter Love, as well as my classmates and other student mentors (PhD candidate James Boafo from
Queensland University, Australia). I am also grateful to my parents for their prayers and emotional
support. I want to thank God almighty for the strength and wisdom he granted me to achieve such
a great accomplishment. I will be the first in my family to receive my master’s degree. A big thank
you to Mr. Stephen Ryder from Q9 for his contributions to my company NigelEnergy Consulting.
Above all, I dedicate my Masters to Patience Ashie, without her my Masters wouldn’t have become
a reality.

ii
ABSTRACT
The Renewable Energy (RE) landscape in Ghana has received considerable attention over the last
few years. Much of this attention is the result of the on-going energy crisis, chiefly, the rising cost
of supplying power to meet domestic and commercial demand in the country. Lost government
revenues from businesses as many reduce operations, and overall public dissatisfaction with the
governments’ management of the energy sector has given further impetus to discussions about
renewable energy. Though Ghana remains heavily dependent on fossil fuels, the country, given
proper investment, and research and development could harness energy from renewable sources
such as solar, wind, biomass and hydroelectricity. These renewable energy sources would help
Ghana diversify its energy sector and improve its energy security. This major research paper adopts
a case study methodology to critically explore renewable energy projects in the West African sub-
region namely, Ghana. The paper focuses on a pilot project that seeks to electrify five local police
outpost in the Greater Accra Region using photovoltaic cells, and uses that analysis to understand
better how to expand the renewable energy sector in Ghana.

iii
FOREWORD
In the last few years, there has been significant changes in the energy sector. Of note, is the
growing relevance of renewable energy technologies as a substitute for fossil fuel. Developments
include the introduction of smart grids and grid-tied systems and policies such as feed-in-tariffs
that allows entities and individuals generating their own electricity to sell to utility companies or
energy retailers. In light of the above, further research and development into more practical and
affordable technologies for harnessing energy from renewable sources is needed. Designing
national energy strategies that are focussed on exploiting Ghana’s renewable energy potential is
therefore the best option for delivering sustained and reliable energy supplies that are essential
for economic development as well as to meet the energy needs of the growing populace.
This research paper has thus made a case for the deployment of small-scale solar PV technologies
to improve electrification rates in Ghana, particularly in rural communities; to provide a more
reliable source of electricity to supplement and/or replace reliance on the national grid; and finally,
to improve the energy security in the country. This research paper, which emerged from a pilot
project, is intimately linked to the goals of my MES plan of study. During my MES, I wanted to
develop the skills necessary to develop renewable energy policies that promote the expansion of
greener and renewable energy technologies in Ghana. Having experienced Ghana’s constant
power outages, locally referred to as ‘dumsor’, I worked with RETScreen Expert, a clean energy
management software to develop small-scale renewable energy solutions to help minimise
reliance on the main grid yet, yet feed surplus energy back to the grid.
The paper explores that status of the energy sector in Ghana, identifies key policy barriers, and
puts forward policy recommendations to overcome some of the stated barriers. Further project
phases and also new projects will fill in the knowledge and informational gaps, as well as make
more concrete suggestions based on verifiable data for the reform of Ghana’s current energy
sector that sees a greater contribution from the renewable energy sector in the overall energy mix.

iv
TABLE OF CONTENTS
ACKNOWLEDGEMENT .................................................................................................................. i
ABSTRACT ...................................................................................................................................... ii
FOREWARD ................................................................................................................................... iii
TABLE OF CONTENTS ................................................................................................................. iv
LIST OF FIGURES ......................................................................................................................... vi
LIST OF TABLES ........................................................................................................................... vi
LIST OF ABBREVIATIONS ......................................................................................................... vii
Chapter 1……………………………………………………………………………………………1
Introduction ....................................................................................................................................... 1
Research Question: ....................................................................................................................... 5
Research Objectives: .................................................................................................................... 6
Scope of the Study ........................................................................................................................ 6
Limitations of the Study ............................................................................................................... 6
Chapter 2 – Literature Review .......................................................................................................... 8
Energy Landscape in Ghana ....................................................................................................... 8
Challenges Facing the Energy Sector in Ghana ...................................................................... 13 Intermittent & Severe Droughts ............................................................................................................................ 14 High Cost of Crude Oil .......................................................................................................................................... 15 Lack of diversity in the electricity generation mix ................................................................................................ 16 High levels of losses plaguing the Distribution Systems & Free-riders ................................................................ 17 Debt to the Electricity Company of Ghana (ECG) ................................................................................................ 18 Tariffs and Subsidies ............................................................................................................................................. 18
Overview of the Renewable Energy Landscape in Ghana ...................................................... 19 Hydro-power ......................................................................................................................................................... 23 Biomass ................................................................................................................................................................. 25 Wind Power ........................................................................................................................................................... 26 Solar Energy .......................................................................................................................................................... 27
Barriers to Renewable Energy Sources .................................................................................... 29
Chapter 3 - Methodology ................................................................................................................. 32
Case Study Methodology ........................................................................................................... 32
Research Methods ...................................................................................................................... 33 RETScreen International Expert ............................................................................................................................ 33 Analysis of Secondary Data .................................................................................................................................. 35
Chapter 4 – Case Study – Ghana .................................................................................................... 36
Pilot Project Design .................................................................................................................... 37 Load Calculation ................................................................................................................................................... 41
Financial Feasibility Assessment ............................................................................................... 42 Project Cost ........................................................................................................................................................... 42

v
Simple Payback Period .......................................................................................................................................... 44
Chapter 5 – Findings & Conclusions ............................................................................................. 49
Discussion .................................................................................................................................... 49
Recommendations ....................................................................................................................... 51
Conclusion ................................................................................................................................... 52
References…………………………………………………………………………………………52

vi
LIST OF FIGURES
FIGURE 1. ESTIMATED RENEWABLE ENERGY SHARE OF TOTAL FINAL ENERGY CONSUMPTION, 2015 .................................................... 2 FIGURE 2: ESTIMATED RENEWABLE ENERGY SHARE OF GLOBAL ELECTRICITY PRODUCTION, END-2016 ................................................. 3 FIGURE 3: DISTRIBUTION OF IDENTIFIED RENEWABLE ENERGY POTENTIAL IN AFRICA ........................................................................... 4 FIGURE 4: MAP OF GHANA ..................................................................................................................................................... 8 FIGURE 5: STRUCTURE OF GHANA’S ELECTRICITY SECTOR. ........................................................................................................... 11 FIGURE 6: STAKEHOLDERS IN GHANA’S ENERGY SECTOR. ............................................................................................................ 12 FIGURE 7: ELECTRICITY CONSUMPTION PATTERNS – 2006-2016 ................................................................................................ 13 FIGURE 8: AVERAGE ANNUAL BRENT CRUDE OIL PRICE FROM 2008 TO 2018 (IN U.S. DOLLARS PER BARREL) ........................................ 16 FIGURE 9: HISTORIC ELECTRICITY GENERATION MIX FROM 2006 TO 2016 ...................................................................................... 17 FIGURE 10: MAP SHOWING THE LOCATION OF THE AKOSOMBO DAM ............................................................................................ 23 FIGURE 11: RAINFALL TRENDS IN THE LOWER VOLTA BASIN FROM 1970 TO 2010 .......................................................................... 24 FIGURE 12: ENERGY MATRIX IN GHANA IN 2007 ...................................................................................................................... 25 FIGURE 13: POTENTIAL HYDRO AND WIND POWER SITES IN GHANA ............................................................................................... 26 FIGURE 14: GHANA’S AVERAGE ANNUAL TOTAL DAILY SUM OF GHI IN WH/M2/DAY (3YEAR AVERAGE) .............................................. 28 FIGURE 15: DAILY SOLAR RADIATION AND CLIMATIC DATA FOR GHANA CAPTURED ON 2018-03-04 .................................................. 34 FIGURE 16: LOCATION OF THE FIVE POLICE STATIONS IN THE PILOT PROJECT .................................................................................. 37 FIGURE 17: ILLUSTRATION OF A SOLAR PV AND POWER PACK GRID-TIED SYSTEM ............................................................................ 38 FIGURE 18: FINANCIAL ANALYSIS OF THE FIVE PILOT PROJECT ...................................................................................................... 45 FIGURE 19: SHOWS THE CASH FLOWS OF THE PROJECT .............................................................................................................. 46 FIGURE 20: ANTICIPATED GHG EMISSIONS REDUCTION ............................................................................................................. 47 FIGURE 21: THE SENSITIVITY ANALYSIS OF THE PROJECT ............................................................................................................. 48
LIST OF TABLES
TABLE 1: ELECTRIFICATION RATES IN GHANA .............................................................................................................................. 9 TABLE 2: GENERAL ELECTRICITY CHARACTERISTICS (2015 EST.) ................................................................................................... 10 TABLE 3: INSTALLED GENERATION FACILITIES IN GHANA AS OF 2016 ............................................................................................. 10 TABLE 4: THE DEVELOPMENT OF RENEWABLE STRATEGIES AND POLICIES IN GHANA .......................................................................... 21 TABLE 5: FEED-IN-TARIFF RATES IN GHANA. ............................................................................................................................ 22 TABLE 6: PROVISIONAL LICENSES ISSUED FOR RENEWABLE ENERGY ELECTRICITY AS OF MARCH, 2016................................................. 29 TABLE 7: BARRIERS TO RENEWABLE ENERGY DEPLOYMENT IN GHANA ........................................................................................... 30 TABLE 8: INVENTORY ANALYSIS – APPLIANCES USED ON SITE AT THE POLICE STATIONS ..................................................................... 42 TABLE 9: PV COST FOR EACH POLICE STATION .......................................................................................................................... 43 TABLE 10: ENERGY PRICE SOLD AND INFLATION PRICE ............................................................................................................... 44

vii
LIST OF ABBREVIATIONS
ECG – Electricity Company of Ghana
ECOWAS – Economic Cooperation of West African States
FIT – Feed-in-Tariffs
FSRU - Floating Regasification and Storage Unit
GDP – Gross Domestic Products
GHG – Greenhouse Gas
GoG – Government of Ghana
GMA – Ghana Meteorological Agency
GRIDCo - Ghana Grid Company
GWh – Gigawatt hour
IPP – Independent Power Producers
IRENA – International Renewable Energy Agency
IRR – Internal Rate of Return
K/Wh/m2/day - Kilowatt hour per meter square per day
kWp – Kilowatt peak
MW - Megawatt
NED – Northern Electricity Department
NPV – Net Present Value
PV – Photovoltaic
RE – Renewable Energy
RESPRO - Renewable Energy Services Project
SHEP - Self-Help Electrification Project
SLT - Special Load Tariff
SWERA – Solar and Wind Resource Assessment
UNCED - United Nation’s conference on Environmental and Development (UNCED)
USD – US Dollars
WAGL - West African Gas Limited
VRA - Volta River Authority

pg. 1
Chapter 1
Introduction
Achieving sustainability in energy supply on a global scale is one of the key challenges facing the
twenty-first century. Since the industrial revolution, economies worldwide have consistently
depended on fossil fuels (i.e., coal, oil and natural gas) as the driver of economic growth. Over-
reliance on fossil fuels is still reflected in the global energy market, despite adverse environmental
effects, dwindling supply, geopolitical tugs-of-war, political destabilization and civil unrest in major
oil producing countries and threats to national security as global leaders expand their reach into
sovereign states. To alleviate the global environmental impacts, such as climate change,
groundwater contamination and biodiversity loss, to name a few, and combat fears of inevitable
peak oil, more resource efficient, low carbon and environmentally sustainable, economic policies
are expected to be implemented by even the most reticent countries.
The green economy model is a potential remedy to some of the key market and institutional
failures that characterize conventional development models based on fossil fuel consumption. It is
hailed as a more effective pathway for advancing economic, social, and environmentally sound
development policies, especially in developing countries where energy consumption is increasing
(Lucien, Mark, & Martyn, n.d.; REN21, 2017). These interventions cut across all sectors of the
economy, with the energy sector receiving considerable attention and investment as we transition
towards renewable energy sources. Rickerson (2012, p. 3) proposes that investment in energy
efficient technologies and renewable energy technology could potentially result in 20 per cent
increase in employment by 2050, while delivering robust economic growth and reduced
greenhouse gas (GHG) emissions (p.1). Renewable Energy (RE) is can be as a positive shift to
environmentally sustainable energy consumption and economic growth.
pg. 2
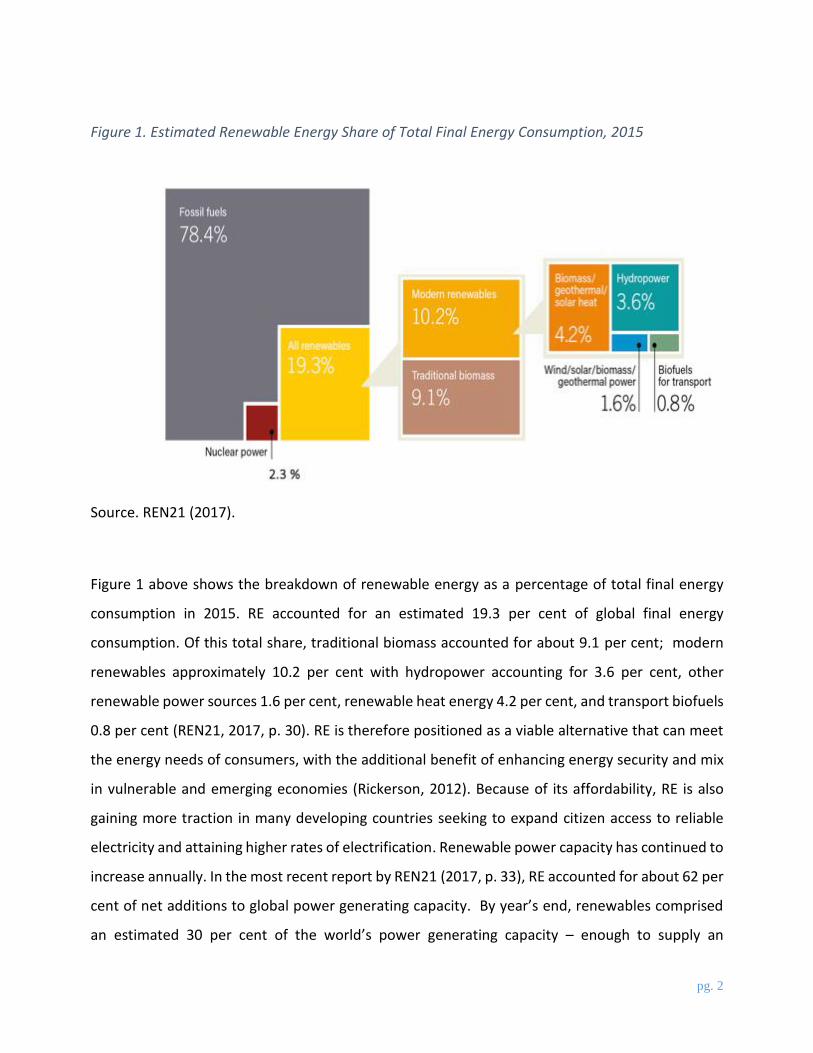
Figure 1. Estimated Renewable Energy Share of Total Final Energy Consumption, 2015
Source. REN21 (2017).
Figure 1 above shows the breakdown of renewable energy as a percentage of total final energy
consumption in 2015. RE accounted for an estimated 19.3 per cent of global final energy
consumption. Of this total share, traditional biomass accounted for about 9.1 per cent; modern
renewables approximately 10.2 per cent with hydropower accounting for 3.6 per cent, other
renewable power sources 1.6 per cent, renewable heat energy 4.2 per cent, and transport biofuels
0.8 per cent (REN21, 2017, p. 30). RE is therefore positioned as a viable alternative that can meet
the energy needs of consumers, with the additional benefit of enhancing energy security and mix
in vulnerable and emerging economies (Rickerson, 2012). Because of its affordability, RE is also
gaining more traction in many developing countries seeking to expand citizen access to reliable
electricity and attaining higher rates of electrification. Renewable power capacity has continued to
increase annually. In the most recent report by REN21 (2017, p. 33), RE accounted for about 62 per
cent of net additions to global power generating capacity. By year’s end, renewables comprised
an estimated 30 per cent of the world’s power generating capacity – enough to supply an
pg. 3
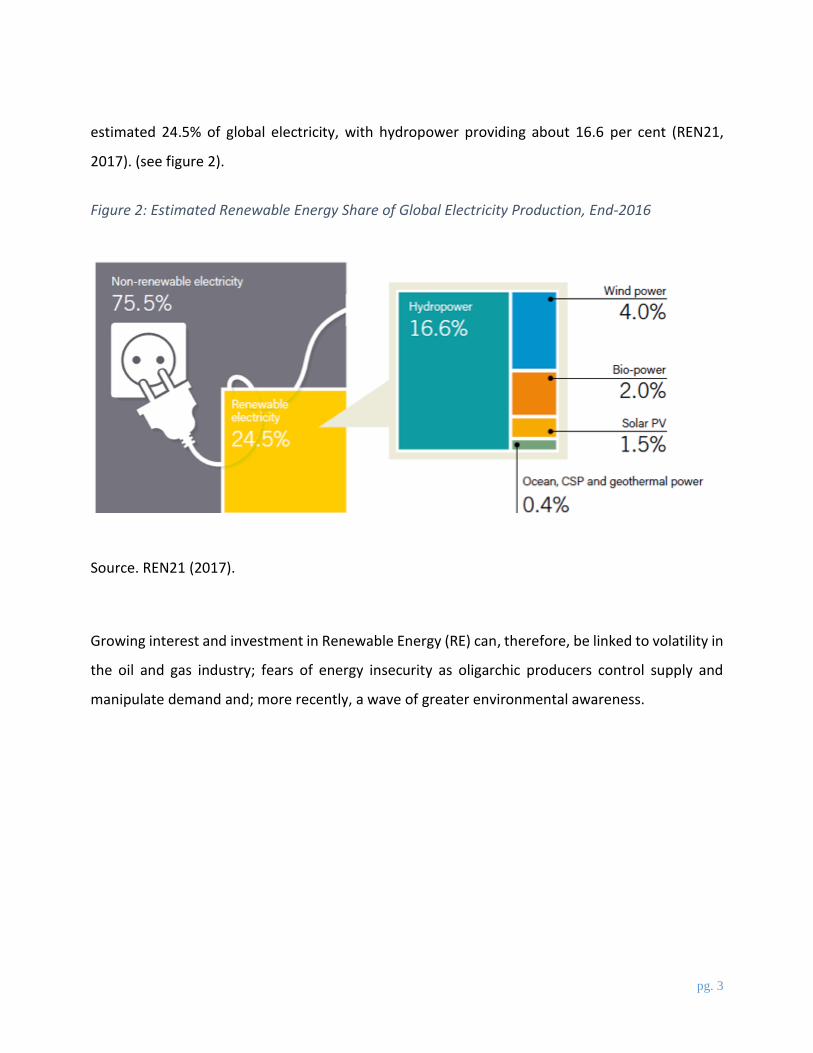
estimated 24.5% of global electricity, with hydropower providing about 16.6 per cent (REN21,
2017). (see figure 2).
Figure 2: Estimated Renewable Energy Share of Global Electricity Production, End-2016
Source. REN21 (2017).
Growing interest and investment in Renewable Energy (RE) can, therefore, be linked to volatility in
the oil and gas industry; fears of energy insecurity as oligarchic producers control supply and
manipulate demand and; more recently, a wave of greater environmental awareness.
pg. 4
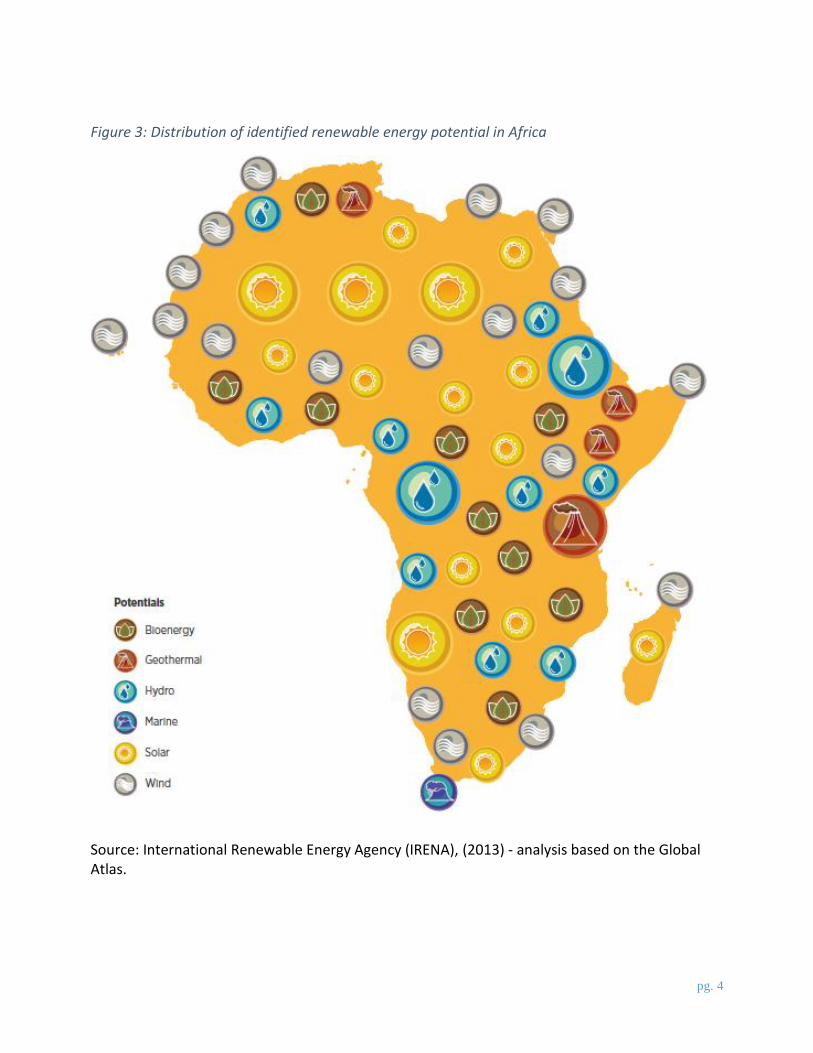
Figure 3: Distribution of identified renewable energy potential in Africa
Source: International Renewable Energy Agency (IRENA), (2013) - analysis based on the Global Atlas.
pg. 5
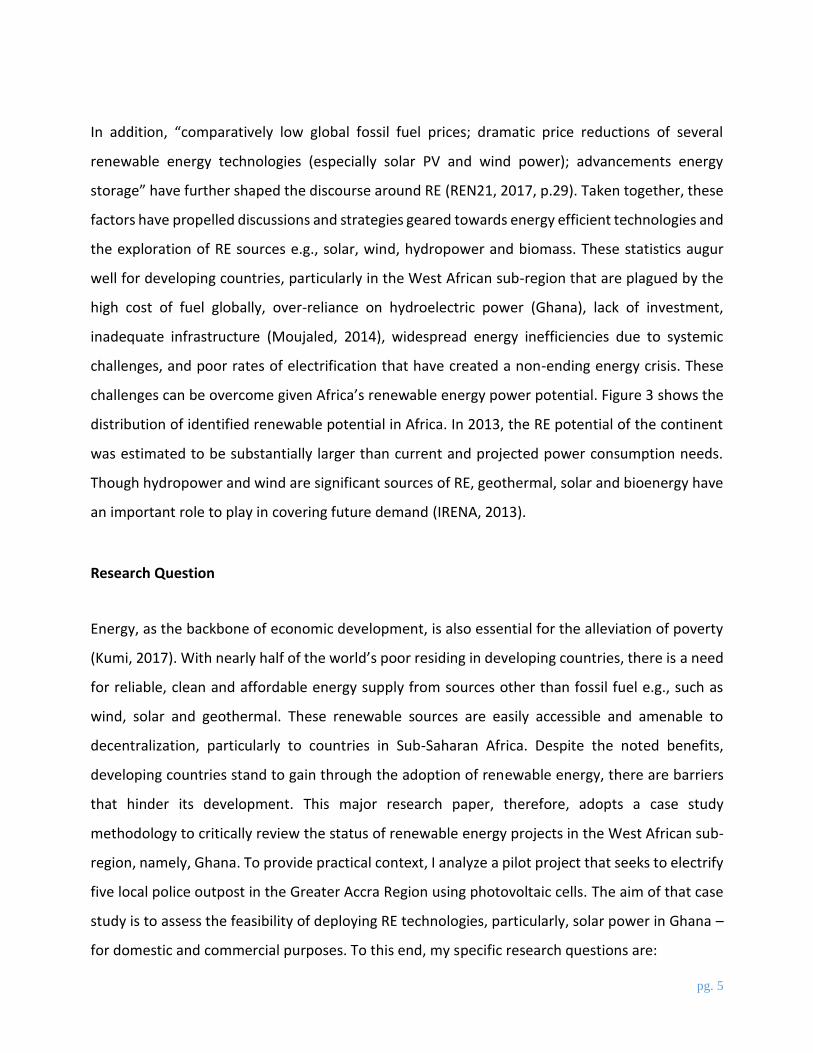
In addition, “comparatively low global fossil fuel prices; dramatic price reductions of several
renewable energy technologies (especially solar PV and wind power); advancements energy
storage” have further shaped the discourse around RE (REN21, 2017, p.29). Taken together, these
factors have propelled discussions and strategies geared towards energy efficient technologies and
the exploration of RE sources e.g., solar, wind, hydropower and biomass. These statistics augur
well for developing countries, particularly in the West African sub-region that are plagued by the
high cost of fuel globally, over-reliance on hydroelectric power (Ghana), lack of investment,
inadequate infrastructure (Moujaled, 2014), widespread energy inefficiencies due to systemic
challenges, and poor rates of electrification that have created a non-ending energy crisis. These
challenges can be overcome given Africa’s renewable energy power potential. Figure 3 shows the
distribution of identified renewable potential in Africa. In 2013, the RE potential of the continent
was estimated to be substantially larger than current and projected power consumption needs.
Though hydropower and wind are significant sources of RE, geothermal, solar and bioenergy have
an important role to play in covering future demand (IRENA, 2013).
Research Question
Energy, as the backbone of economic development, is also essential for the alleviation of poverty
(Kumi, 2017). With nearly half of the world’s poor residing in developing countries, there is a need
for reliable, clean and affordable energy supply from sources other than fossil fuel e.g., such as
wind, solar and geothermal. These renewable sources are easily accessible and amenable to
decentralization, particularly to countries in Sub-Saharan Africa. Despite the noted benefits,
developing countries stand to gain through the adoption of renewable energy, there are barriers
that hinder its development. This major research paper, therefore, adopts a case study
methodology to critically review the status of renewable energy projects in the West African sub-
region, namely, Ghana. To provide practical context, I analyze a pilot project that seeks to electrify
five local police outpost in the Greater Accra Region using photovoltaic cells. The aim of that case
study is to assess the feasibility of deploying RE technologies, particularly, solar power in Ghana –
for domestic and commercial purposes. To this end, my specific research questions are:
pg. 6
i) What are the principal challenges that developing countries, in particular, Ghana face
in attempting to transition to renewable energy?
ii) What is the role of the government in RE deployment?
iii) What lessons can Ghana learn from RE projects in the West African sub-region?
Research Objectives:
The main objectives of this major research paper are:
i) To identify and explain the barriers to the development and adoption of renewable
energy in Sub-Saharan Africa – West African sub-region, particularly, Ghana;
ii) To assess the viability of RE development in Ghana;
iii) To assess the experience of the rooftop solar photovoltaic pilot project; and
iv) To propose recommendations for improving RE deployment in Ghana.
Scope of the Study
This major research paper has five (5) chapters. Following the introductory chapter, chapter two
details the energy landscape in Ghana and draws attention to the challenges facing the energy
sector in Ghana. That background is provided as, context for the adoption of more progressive RE
policies and a full transition towards RE. The second chapter provides a more detailed discussion
of the importance of RE development. Chapter three explains the methodology that guides the
research. The fourth chapter focuses on an analysis of a pilot solar project in Ghana. The fifth
chapter concludes the research paper and includes a summary of key findings, recommendations
and areas for future research.
Limitations of the Study
While every effort has been made to maintain methodological rigour, I note that the pilot project
is still on-going and as such a comprehensive accounting of all the benefits (short, medium and

pg. 7
long-term), cannot be fully known at this time. Furthermore, lack of electricity consumption data
(due to the absence of electricity meters) for the five Police Stations prior to the commencement
of the study have made it impossible to undertake a comparison of usage rates, electricity cost and
savings before and after the project.

pg. 8
Chapter 2 – Literature Review
Energy Landscape in Ghana
This chapter focuses on the key features of the energy sector in Ghana. It makes specific reference
to electricity production and distribution, as this is one of the more pressings problems plaguing
the country. Ghana, a former British colony, is located in West Africa. Its size is approximately,
238,533 sq. km and it shares borders with Burkina Faso, Cote d'Ivoire, and Togo. In 2017, the
population was estimated to be about 27 million (Central Intelligence Agency (CIA), n.d.).
Figure 4: Map of Ghana
Source: Google Maps.

pg. 9
Ghana has an open market-based economy with relatively few barriers to international trade and
investment. In comparison with other countries in the region, Ghana is well-endowed with natural
resources e.g., gold, timber, industrial diamonds, bauxite, manganese, fish, rubber, hydropower,
petroleum, silver, salt, limestone (Chizoba, 2017). Major industries include: mining, lumber, light
manufacturing, aluminium smelting, food processing, cement production, small commercial
shipbuilding and petroleum (Central Intelligence Agency, n.d.). Ghana’s emerging oil industry has
boosted economic growth; however, the fall in oil prices in 2015 reduced by about half of Ghana’s
oil revenue. Production at Jubilee (Ghana's first commercial offshore oilfield), began in mid-
December 2010 (Central Intelligence Agency, n.d.). Production from two more fields, TEN and
Sankofa, started in 2016 and 2017 respectively. The country’s first gas processing plant at Atuabo
is also producing natural gas from the Jubilee field, providing power to several of Ghana’s thermal
power plants (Central Intelligence Agency (CIA), n.d.).
Table 1: Electrification Rates in Ghana
ELECTRICITY ACCESS ELECTRIFICATION
RATE
Total Population 72%
Urban Areas 92%
Rural Areas 50%
Total Population without electricity 7,300,000
Source: (Central Intelligence Agency (CIA), n.d.).
Tables 1 and 2 summarise the energy landscape in Ghana. As of 2015, 72 per cent of Ghana’s
population had some access to electricity. Higher rates were recorded in urban areas at 92 per
cent compared to rural areas at 50 per cent.

pg. 10
Table 2: General Electricity Characteristics (2015 est.)
GENERAL ELECTRICITY CHARACTERISTICS 2015
(ESTIMATES)
Electricity Production 11.09 billion kWh
Electricity Consumption 8.377 billion kWh
Electricity Exports 552 million kWh
Electricity Imports 223 million kWh
Electricity installed generating capacity 2,839 MW
Source: (Central Intelligence Agency, n.d.).
Ghana continues to experience challenges with its electricity supply despite the fact that
electricity production surpasses electricity consumption and the country exports more electricity
than it imports. Total installed capacity is mainly from the hydropower facilities at Akosombo,
Bui, and Kpong and fossil fuels which power thermal plants at Takoradi, Sunon, Tema and Kpone.
Ghana’s potential for renewable energy is great including: biomass, solar, wind and hydropower.
Despite these abundant and environmentally sound energy options, little has been done to
spearhead the development and adoption of renewable energy technologies (Please see table 3).
Table 3: Installed generation facilities in Ghana as of 2016
ENERGY SOURCE/PLANT INSTALLED
CAPACITY MW DEPENDABLE
CAPACITY MW % OF INSTALLED
CAPACITY
Hydro (water) 1580 1508 41.6
Thermal (natural gas, oil, diesel) 2192 1995 57.8
Renewables (biomass, solar, wind, hydro
22.6 22.1 0.6
Total Capacity 3795 3525 100
Source: Adapted from Kumi (2017).
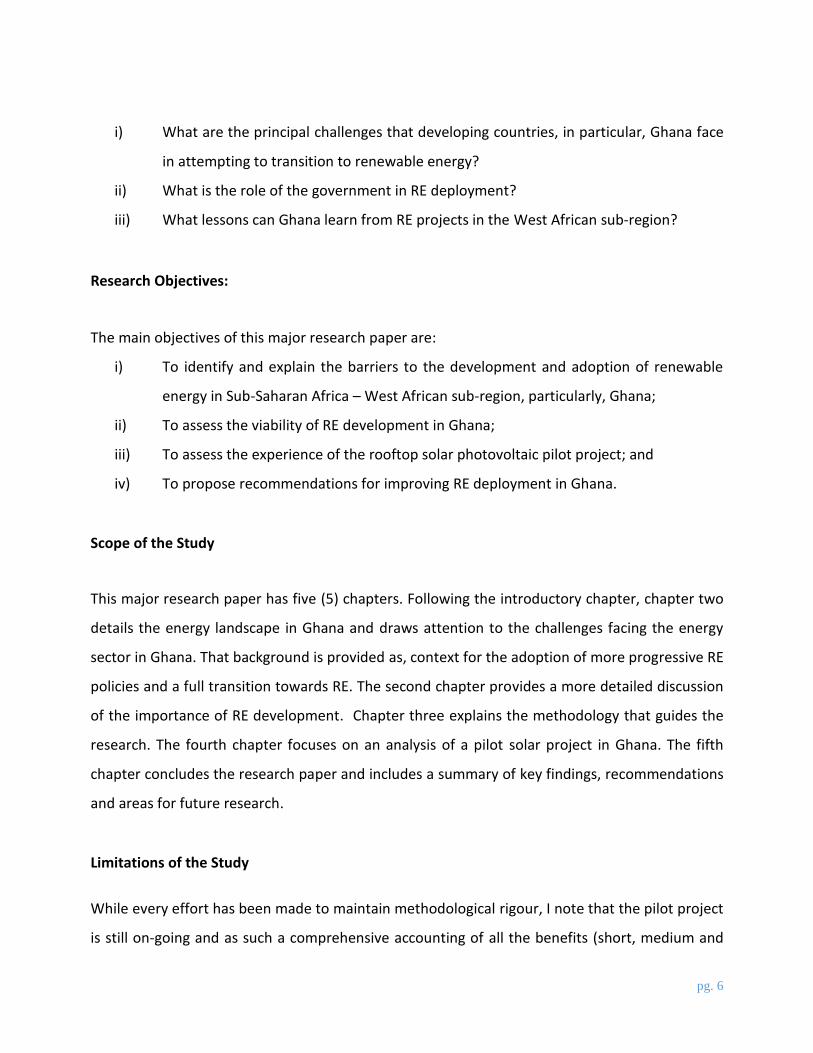
According to Gyamfi et al., (2015, p. 6), 88 per cent of Ghana’s electricity generation capacity and
assets (excluding renewables) are owned by the state-owned Volta River Authority (VRA), Ghana
pg. 11
Grid Company (GRIDCo), with the remaining 12 per cent owned by Independent Power Producers
(IPP). Ghana Grid Company (GRIDCo) operates the national grid and manages the power system
as System Operator. The Electricity Company of Ghana (ECG) is responsible for electricity
distribution in the south and the Northern Electricity Department (NED) is responsible for
distribution in northern Ghana. Enclave Power Company, a small power company, has a contract
agreement with the Electricity Company of Ghana to supply electricity to the Tema Free Zone
Enclave (Gyamfi et al., 2015). The Free Zone provides focal points for the production of goods and
services for foreign markets (Energy Commission of Ghana, 2017; Gyamfi et al., 2015; Kumi, 2017;
Ministry of Energy, 2010). Please see Figure 5 below which summarizes the structure of Ghana’s
Electricity Sector.
Figure 5: Structure of Ghana’s Electricity Sector.
Source: Gyamfi et al., (2015).
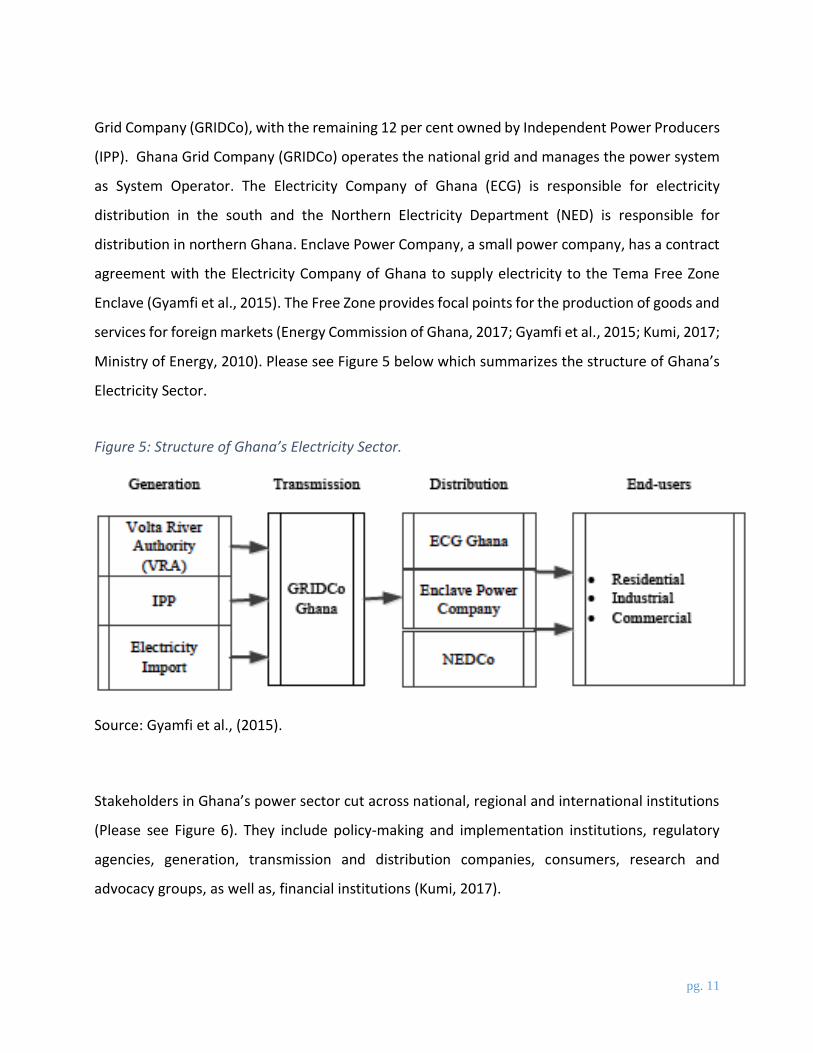
Stakeholders in Ghana’s power sector cut across national, regional and international institutions
(Please see Figure 6). They include policy-making and implementation institutions, regulatory
agencies, generation, transmission and distribution companies, consumers, research and
advocacy groups, as well as, financial institutions (Kumi, 2017).
pg. 12
Figure 6: Stakeholders in Ghana’s Energy Sector.
Source: Kumi (2017).
Ghana’s demand for energy continues to increase in direct relation to expanding economic
activity and population growth which feeds household demand (Mensah, Marbuah, & Amoah,
2016). The country’s energy supply mix, biomass, hydropower and thermal feeds into its energy
– demand economic sectors namely residential, commercial, service sector, agricultural and
fisheries, transport and industries (Kofi-Opata, 2013; Mensah et al., 2016). Electricity consumers
in Ghana are classified into industrial, residential, non-residential and street lighting by the Energy
Commission of Ghana (Kumi, 2017). Industrial, sometimes referred to as Special Load Tariff (SLT)
consumers are those who use electricity for industrial purposes (Kumi, 2017). Figure 7 shows that
the industrial, residential and non-residential sector are the three top consumers of electricity;
whereas export and street lighting account for the least. Losses in transmission and distribution
(including commercial losses) were higher than the consumption in the non-residential sector. On

pg. 13
average, transmission and distribution losses accounted for 21.9 per cent of total electricity
consumption annually (Kumi, 2017, p. 9).
Figure 7: Electricity Consumption Patterns – 2006-2016
Source: Kumi 2017 (data extracted from Energy Commission of Ghana 2016-2017).
Challenges Facing the Energy Sector in Ghana
Ghana’s commitment to universal access to electricity by 2020 is documented in its National
Electrification Scheme of 1989 (Gyamfi et al., 2015). The main objective of the scheme is to
expand electricity supply to all parts of the country by 2020. The National Electrification Scheme
also supports research and development in renewable energies, mainly solar, wind, biomass, and
hydro in an effort to diversify the country’s energy mix and reduce reliance on high-cost fossils
fuels (International Energy Agency, 2012). Despite this roadmap towards 100 per cent
pg. 14
electrification, Ghana is facing an ongoing energy crisis which commenced in the late 1970s.
Various institutional reports and academic research papers have pointed the finger at the
country’s dependence on its poorly functioning and inefficient hydro-dams, high cost of oil to
power thermal plants (which were introduced as a stopgap measure and as a backup for the hydro
plants), unavailability of cheaper energy sources e.g., natural gas, coupled with a lack of
consistent investment in the energy sector (Gyamfi et al., 2015; Kemausuor, Obeng, Brew-
Hammond, & Duker, 2011; Kumi, 2017; Mensah et al., 2016). In a bid to quickly curb the
deleterious effects of the crisis, the Ministry of Energy and the Energy Commission developed
various policy and regulatory instruments to guide the operation of the electricity sector. As of
2018, the lack of affordable electricity still remains a major economic challenge for Ghana. Some
of the major challenges facing the energy sector in Ghana including intermittent and severe
drought conditions, high cost of crude oil, lack of diversity in the electricity generation mix, high
levels of losses plaguing the distribution systems, debt to the ECG and a poor tariff structure
impacting on the financial stability of the utility companies (which are described in more detail
below).
Intermittent & Severe Droughts
Research has shown that climate change effects, especially alterations in evaporation, river
discharge, and temporal precipitation patterns, have the potential to negatively impact
hydroelectric production (Arndt, Asante, & Thurlow, 2015; Blackshear et al., 2011; Gyamfi et al.,
2015; Schaeffer et al., 2012). Since 1998, Ghana has experienced severe droughts that have
resulted in low water inflow into its hydro-dams (Ministry of Energy, 2010). The hydro potential,
already seasonal in nature, is therefore further limited by changing climatic conditions. This
situation has led to a load-shedding program to manage the demand for the entire country. This
has impacted the electricity supply to the industrial and commercial sectors, resulting in reduced
production and in some instances, the closing down of vulnerable small to medium size
businesses, exacerbating further, already high unemployment rates. Domestic consumers are

pg. 15
also negatively affected by constant power outages. Areas with water shortages could look into
sea water desalination as a substitute source (Oyoh, 2016, p.5).
The intermittent supply of electricity has had the additional effect of increasing reliance on diesel
operated generators to provide power and some level of energy security, considering the state’s
failed attempts. A recent report has accused European oil companies and commodity traders of
exporting dirty diesel to African countries. A recent report by Public Eye Investigation reveals that
much of the diesel imported from Europe contains high levels of sulphur, which poses high risks
to individuals and the country as a whole (Marc Guéniat, Harjono, Andreas Missbach, & Viredaz,
2016). The report states that diesel with sulphur concentrations that exceed 10 parts per million
are regularly sold in Ghana and other countries in West Africa (Guéniat, Harjono, Missbach, &
Viredaz, 2016; Stewart, 2017). The use of ‘dirty diesel’ has directly contributed to air pollution
and an increase in cardiovascular and respiratory illnesses generally (Guéniat, Harjono, Missbach,
& Viredaz, 2016; Stewart, 2017).
High Cost of Crude Oil
The volatile costs of fuel globally and nationally are also affecting Ghana’s energy sector. Crude
oil importation accounted for 80 per cent of the trade deficit in 2001 (Armah, 2003). Volatility in
the price of crude oil worsens Ghana’s energy security as it directly affects the ability of the power
companies to supply electricity to all economic sectors and for domestic usage at an affordable
price (Ministry of Energy, 2010). Figure 8 below illustrates the volatile changes in world oil prices.
pg. 16
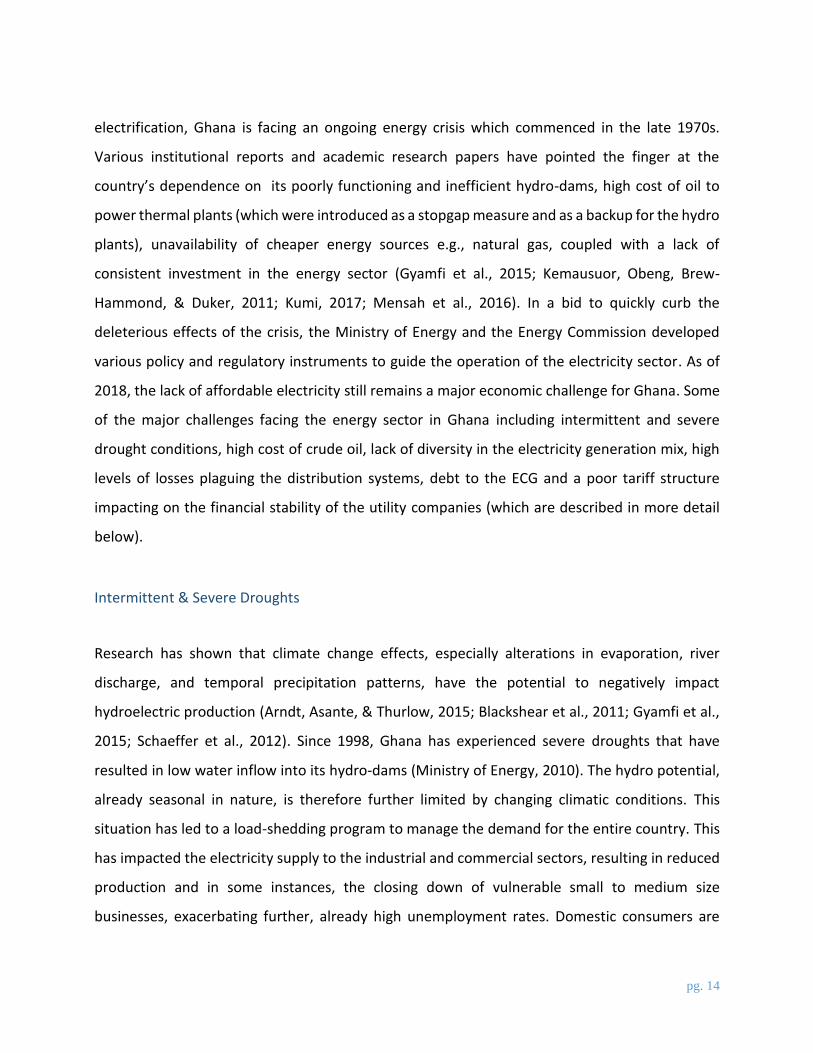
Figure 8: Average annual Brent crude oil price from 2008 to 2018 (in U.S. dollars per barrel)
Source: Statista (2018).
In 2017, the average price of Brent crude oil was at 54.25 U.S. dollars per barrel. Brent is the
world's leading price benchmark for Atlantic basin crude oils. The price of crude oil influences
costs across all stages of the production process and consequently alters the price of producing
electricity especially in countries like Ghana which lacks proper infrastructure and efficient
distribution system.
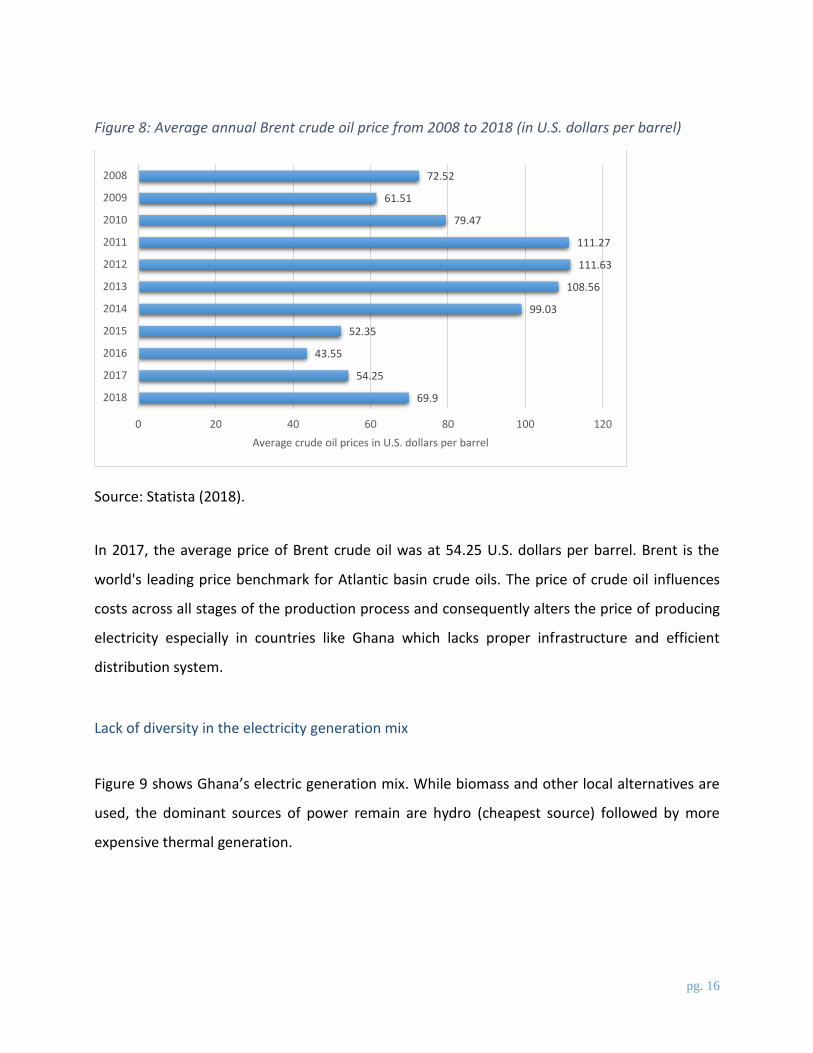
Lack of diversity in the electricity generation mix
Figure 9 shows Ghana’s electric generation mix. While biomass and other local alternatives are
used, the dominant sources of power remain are hydro (cheapest source) followed by more
expensive thermal generation.
69.9
54.25
43.55
52.35
99.03
108.56
111.63
111.27
79.47
61.51
72.52
0 20 40 60 80 100 120
2018
2017
2016
2015
2014
2013
2012
2011
2010
2009
2008
Average crude oil prices in U.S. dollars per barrel
pg. 17
Figure 9: Historic electricity generation mix from 2006 to 2016
Source: Kumi (2017) adapted from Energy Commission of Ghana.
As of 2015, thermal generation is poised to surpass hydropower. Missing in this mix are renewable
sources, which can play a substantive role in diversifying the country’s electricity generation mix.
High levels of losses plaguing the Distribution Systems & Free-riders
Ghana’s power sector is also besieged with a lot of free-riders and illegal connections. This makes
it difficult for the sector to recoup revenues that would cover its costs and support reinvestment.
Energy losses amounted to about 26 per cent of the total primary supply in 2000 and increased
to about 30 per cent in 2004 (Energy Commission of Ghana, 2016). Energy losses are also tied to
the use of obsolete household and industrial equipment and lack of technical capacity to
effectively convert and distribute power along ageing and outmoded infrastructure. For example,
ECG’s power losses are mainly attributed to obsolete cables (Energy Commission of Ghana, 2016).
pg. 18
Debt to the Electricity Company of Ghana (ECG)
In May 2016, officials of the Electricity Company of Ghana stated that the Government of Ghana
(GoG) had been unable to repay around USD 240 million it owed the ECG. Additionally, VRA, the
main generator and supplier of electricity in Ghana, is reportedly in financial difficulties with
banks and supply chain corporations. The GoG’s grim financial position has slowed private sector
investment and infrastructure development. This problem was exacerbated in 2016 by the Golar
Tundra floating regasification and storage unit (FSRU) project (Paisner LLP, 2017; Shillito, 2016).
The FSRU project was expected to commence operations by mid-2016 and supply 250 million
cubic feet (mcf)/day of regasified LNG to the 230MW Kpone thermal power plant owned by VRA
( Paisner LLP, 2017; Shillito, 2016). However, West African Gas Ltd, sponsored by the GoG, was
unable to pay its fees which delayed the project.
Tariffs and Subsidies
A report by the African Development Bank group states that the average end user electricity tariff
across Africa in 2010 was US $0.14 per kWh though it was produced at an average cost of US
$0.18 per kWh (African Development Bank Group, 2013; Kumi, 2017). The case of Ghana is no
different from the rest of the continent. Electricity in Ghana is heavily subsidized. Ghanaian public
utility companies have struggled to recoup costs due to these low tariffs (Ministry of Energy &
World Bank, 2004). This makes it difficult for the electric utility companies to recover the cost of
operation – production and distribution. This phenomenon coupled with debts owed to the
utilities in subsidies and unpaid bills by the government and other agencies affects their ability to
provide reliable electricity to consumers. In 2015, for example, tariffs were set at an average of
USD 0.05 per kWh of electricity generated. These rates are around USD 0.09 below Sub-Saharan
Africa’s average of USD 0.14. Subsidies and low tariffs have left the transmission and distribution
authorities crippled due to the inability to maintain or expand the required infrastructure (Paisner
LLP, 2017). Since 2004, the Government of Ghana (GoG) has spent over USD 900 million on fuel
subsidies to the Volta River Authority (VRA) alone (Paisner LLP, 2017).
pg. 19
Despite Ghana’s great renewable energy potential (such as solar, wind and geothermal), the
country lacks the financial capital needed to spearhead and tap into these resources which would
reduce overload on the national grid and the country’s growing reliance on fossil fuels. In addition
to the lack of public investment in the renewable energy sector, the government has not been
able to incentivize the private sector to participate in renewable energy power and hardware
production (ECOWAS, 2015).
Overview of the Renewable Energy Landscape in Ghana
Globally, there has been growing concern on sustainability, pioneered by the United Nations
Commission on Environment and Development in 1987. The commission defined sustainability as
“meeting the needs of the present without compromising the ability of future generations to
meet their own needs” (United Nations, 1987). Sustainability has since become a framework,
measurement and evaluative and assessment criteria for development projects globally e.g.,
universal access to affordable, reliable, sustainable and modern energy (UN Dept of Economic
and Social Affairs, 2017). In line with goal 7 “affordable and clean energy”, the deployment of
renewable energy technologies has expanded rapidly in recent years, first in developed countries
and now, more rapidly in developing economies.
Across the globe, renewable energy capacity has increased from 1,037 GW in 2006 to about 1985
GW in 2015 (World Energy Resource, 2016). New investment in green and/or clean energy has
expanded from $41 billion in 2004 to $272 billion in 2014 (Jeong, 2017). Much of this expansion
has been supported by government policy directives, subsidies, research and development
funding, or public-private mechanisms. Governments have promoted the use of renewable
energy to address various energy and environmental issues they face such as climate change
mitigation, energy security, and air pollution as well as in response to enhance their energy
security. Because renewable energy sources and technologies have traditionally been expensive

pg. 20
or cost prohibitive compared to conventional fossil fuels, government support was and remains
essential to its promotion and broad-based operationalization (Jeong, 2017).
pg. 21
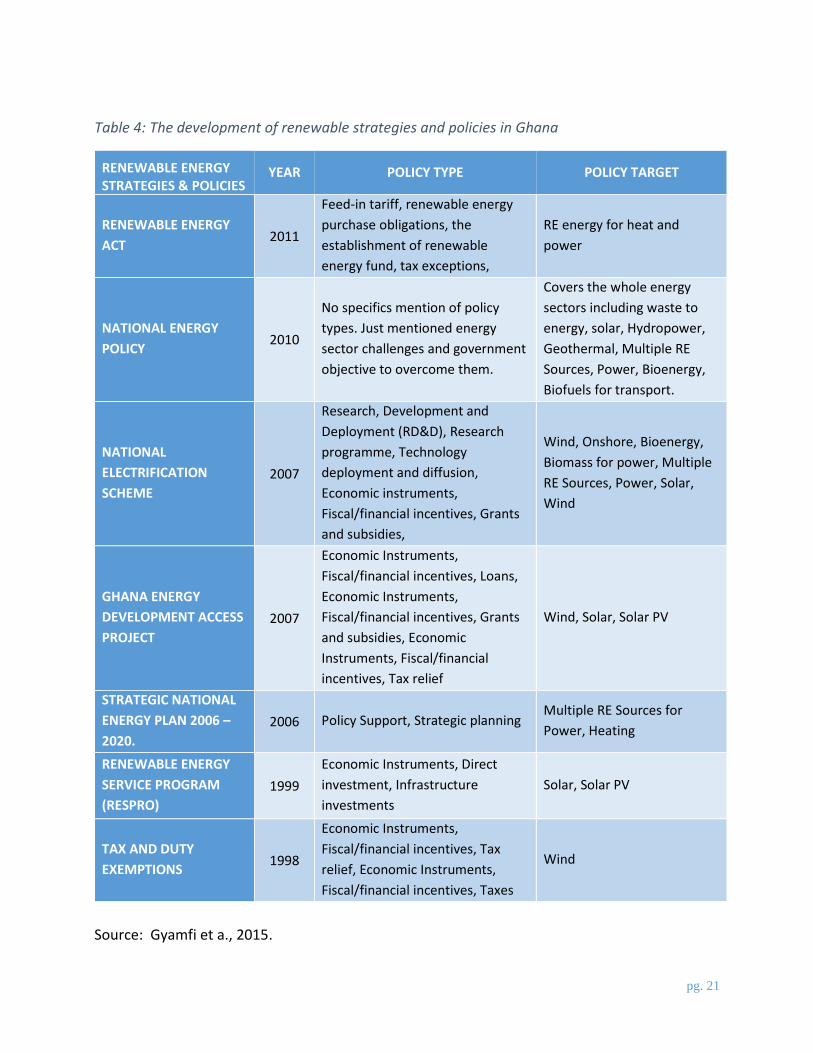
Table 4: The development of renewable strategies and policies in Ghana
RENEWABLE ENERGY STRATEGIES & POLICIES
YEAR POLICY TYPE POLICY TARGET
RENEWABLE ENERGY
ACT 2011
Feed-in tariff, renewable energy
purchase obligations, the
establishment of renewable
energy fund, tax exceptions,
RE energy for heat and
power
NATIONAL ENERGY
POLICY 2010
No specifics mention of policy
types. Just mentioned energy
sector challenges and government
objective to overcome them.
Covers the whole energy
sectors including waste to
energy, solar, Hydropower,
Geothermal, Multiple RE
Sources, Power, Bioenergy,
Biofuels for transport.
NATIONAL
ELECTRIFICATION
SCHEME
2007
Research, Development and
Deployment (RD&D), Research
programme, Technology
deployment and diffusion,
Economic instruments,
Fiscal/financial incentives, Grants
and subsidies,
Wind, Onshore, Bioenergy,
Biomass for power, Multiple
RE Sources, Power, Solar,
Wind
GHANA ENERGY
DEVELOPMENT ACCESS
PROJECT
2007
Economic Instruments,
Fiscal/financial incentives, Loans,
Economic Instruments,
Fiscal/financial incentives, Grants
and subsidies, Economic
Instruments, Fiscal/financial
incentives, Tax relief
Wind, Solar, Solar PV
STRATEGIC NATIONAL
ENERGY PLAN 2006 –
2020.
2006 Policy Support, Strategic planning Multiple RE Sources for
Power, Heating
RENEWABLE ENERGY
SERVICE PROGRAM
(RESPRO)
1999
Economic Instruments, Direct
investment, Infrastructure
investments
Solar, Solar PV
TAX AND DUTY
EXEMPTIONS 1998
Economic Instruments,
Fiscal/financial incentives, Tax
relief, Economic Instruments,
Fiscal/financial incentives, Taxes
Wind
Source: Gyamfi et a., 2015.
pg. 22
Ghana, like many other West African countries, has instituted a number of policies designed to
promote investment in renewable energy as an alternative and as a complement to conventional
energy sources. Table 4 list the major renewable strategies and policies active in Ghana to date.
The most recent policy, the Renewable Energy Act (832) was passed on December 31, 2011 with
a mandate to increase investment in renewable energy such that power from renewable sources
would account for 10 per cent of Ghana’s energy mix by 2020. Attendant regulations to the Act
make allowances for the introduction of a feed-in-tariff system as well as net metering and
creation of a Renewable Energy Fund to aid renewable energy projects.
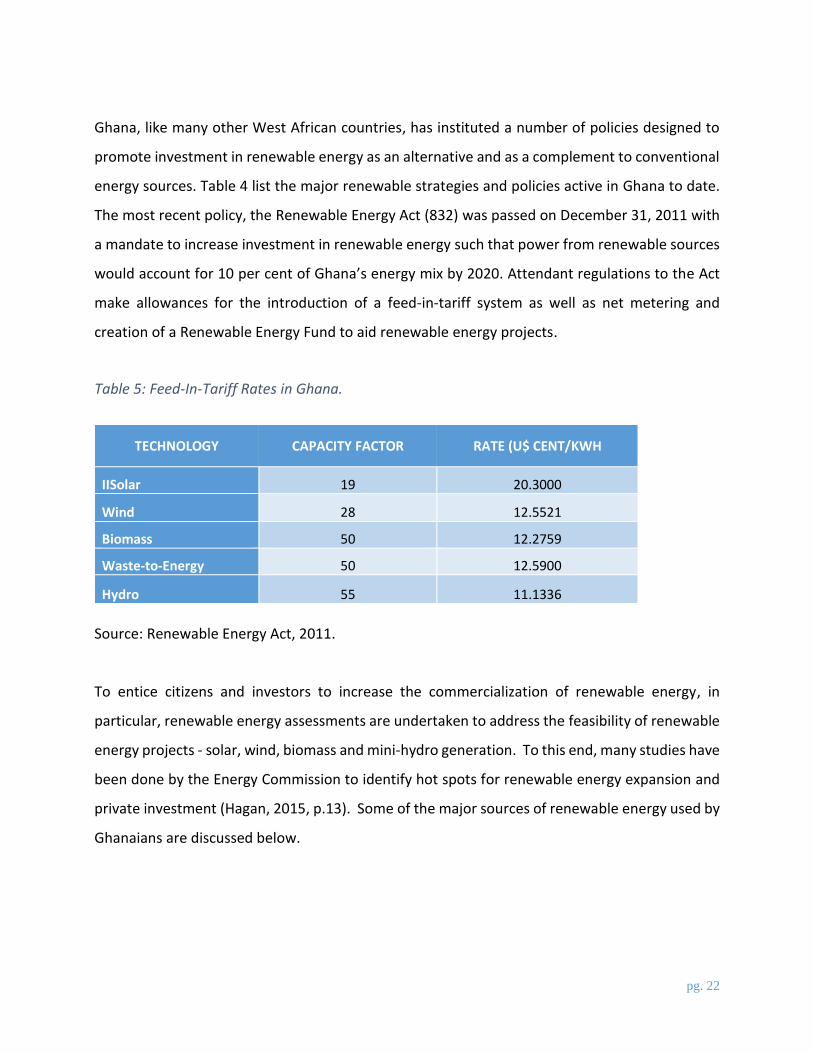
Table 5: Feed-In-Tariff Rates in Ghana.
TECHNOLOGY CAPACITY FACTOR RATE (U$ CENT/KWH
IISolar 19 20.3000
Wind 28 12.5521
Biomass 50 12.2759
Waste-to-Energy 50 12.5900
Hydro 55 11.1336
Source: Renewable Energy Act, 2011.
To entice citizens and investors to increase the commercialization of renewable energy, in
particular, renewable energy assessments are undertaken to address the feasibility of renewable
energy projects - solar, wind, biomass and mini-hydro generation. To this end, many studies have
been done by the Energy Commission to identify hot spots for renewable energy expansion and
private investment (Hagan, 2015, p.13). Some of the major sources of renewable energy used by
Ghanaians are discussed below.
pg. 23
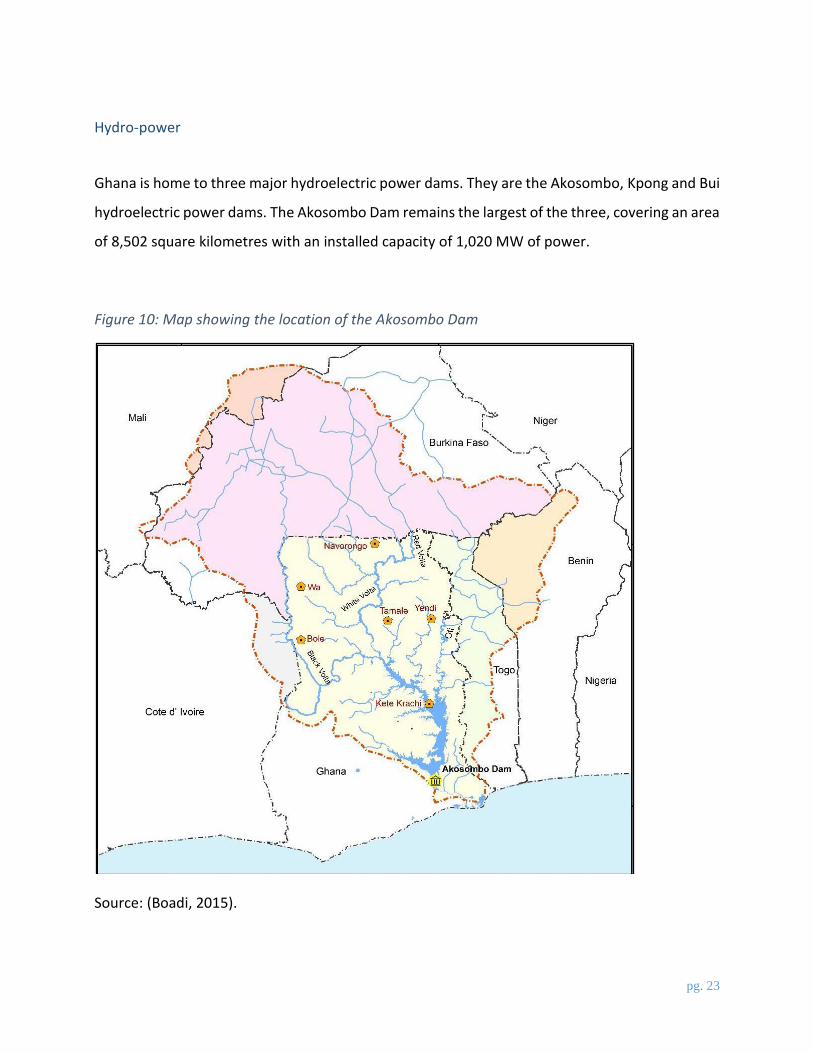
Hydro-power
Ghana is home to three major hydroelectric power dams. They are the Akosombo, Kpong and Bui
hydroelectric power dams. The Akosombo Dam remains the largest of the three, covering an area
of 8,502 square kilometres with an installed capacity of 1,020 MW of power.
Figure 10: Map showing the location of the Akosombo Dam
Source: (Boadi, 2015).

pg. 24
Ghana’s second largest dam, Bui, was constructed to increase power supply and meet the growing
consumer and industrial demand. It generates 400 MW of hydroelectric power and is expected
to increase the installed electricity generation capacity in Ghana by 22 per cent from 1,920 MW
in 2008 to 2,360 MW. The Kpong hydro-electric dam is the third largest with an installed capacity
of about 160MW (Government of Ghana, 2018). The Akosombo and Kpong dams which are
managed by the VRA and provide electricity to much of the country, as well as for export to Togo,
Benin, and nearby countries. Like all hydropower plants, these avoid greenhouse gas emissions
that would have occurred if thermal power plants had been built instead (Government of Ghana,
2018). The viability of hydroelectric energy production in Ghana is, however, threatened by
changing climatic conditions especially variability in rainfall and lake water levels (Boadi & Owusu,
2017). See figure 11 below.
Figure 11: Rainfall trends in the Lower Volta Basin from 1970 to 2010
Source: (Boadi, 2015).
pg. 25
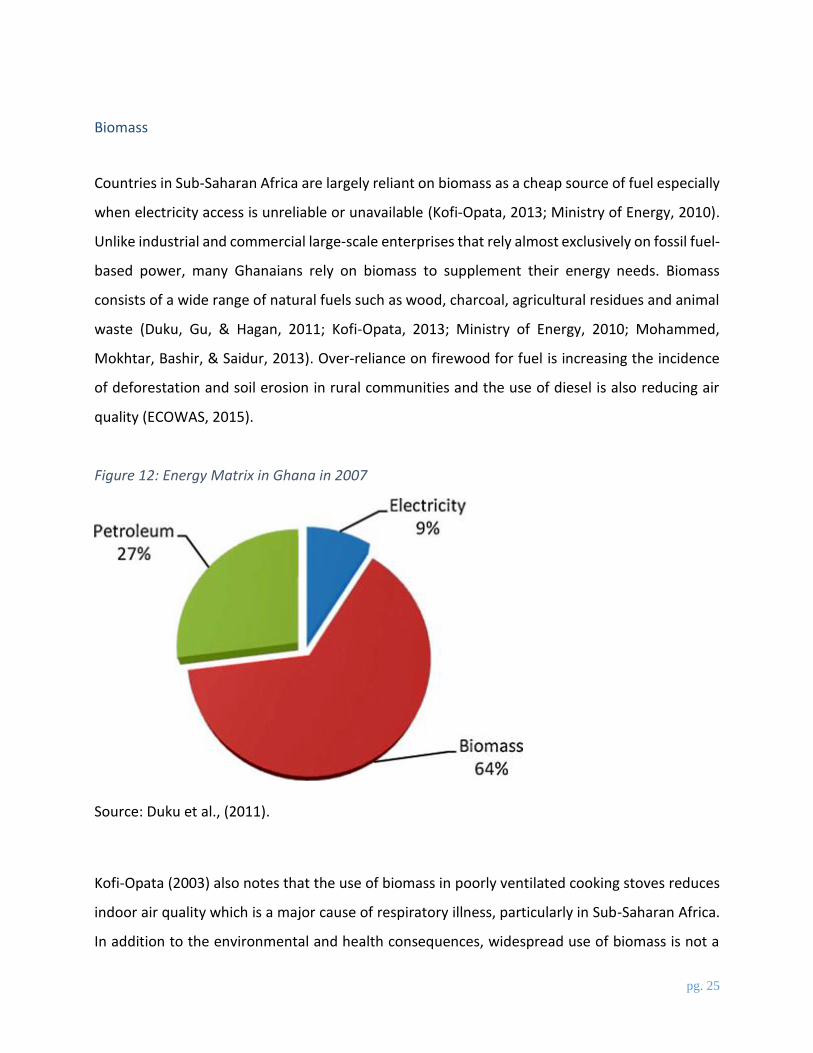
Biomass
Countries in Sub-Saharan Africa are largely reliant on biomass as a cheap source of fuel especially
when electricity access is unreliable or unavailable (Kofi-Opata, 2013; Ministry of Energy, 2010).
Unlike industrial and commercial large-scale enterprises that rely almost exclusively on fossil fuel-
based power, many Ghanaians rely on biomass to supplement their energy needs. Biomass
consists of a wide range of natural fuels such as wood, charcoal, agricultural residues and animal
waste (Duku, Gu, & Hagan, 2011; Kofi-Opata, 2013; Ministry of Energy, 2010; Mohammed,
Mokhtar, Bashir, & Saidur, 2013). Over-reliance on firewood for fuel is increasing the incidence
of deforestation and soil erosion in rural communities and the use of diesel is also reducing air
quality (ECOWAS, 2015).
Figure 12: Energy Matrix in Ghana in 2007
Source: Duku et al., (2011).
Kofi-Opata (2003) also notes that the use of biomass in poorly ventilated cooking stoves reduces
indoor air quality which is a major cause of respiratory illness, particularly in Sub-Saharan Africa.
In addition to the environmental and health consequences, widespread use of biomass is not a
pg. 26
sustainable alternative to conventional sources, as it is increasingly expensive and out of reach of
the poorest. Figure 12 shows the energy balance in Ghana as of 2007. Then, biomass accounted
for 64 per cent of energy supply and that rose to 72 per cent by 2010 (Kofi-Opata, 2013).
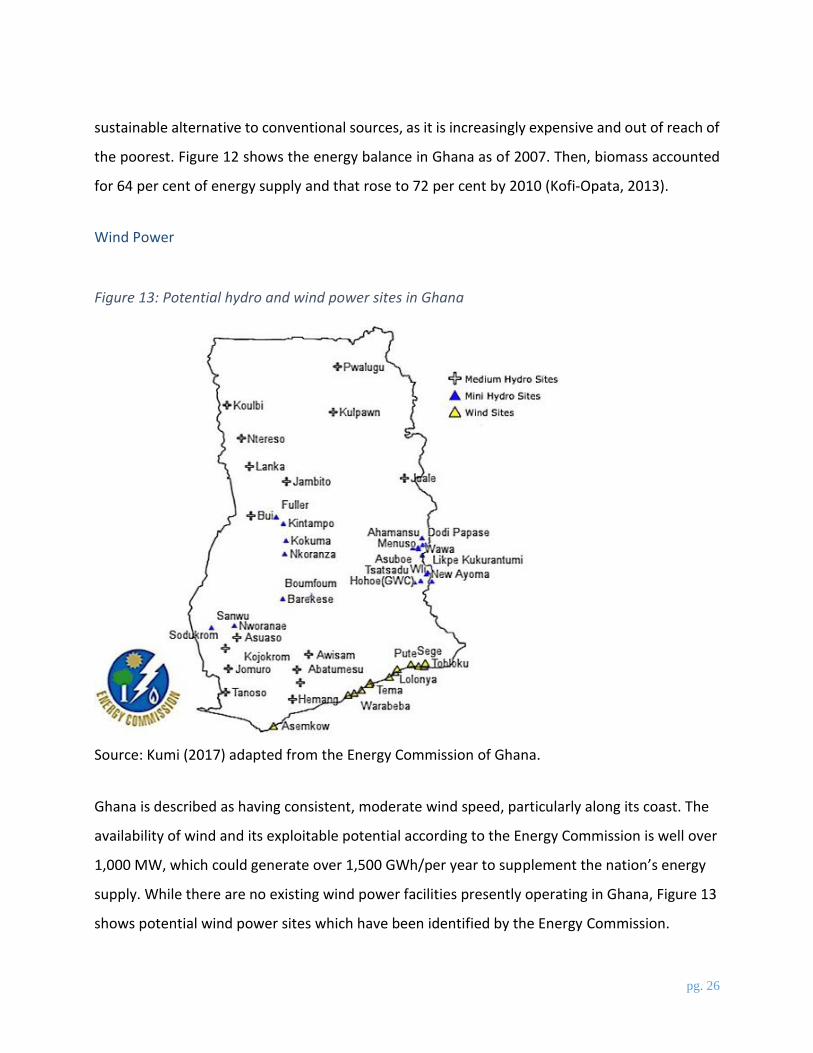
Wind Power
Figure 13: Potential hydro and wind power sites in Ghana
Source: Kumi (2017) adapted from the Energy Commission of Ghana.
Ghana is described as having consistent, moderate wind speed, particularly along its coast. The
availability of wind and its exploitable potential according to the Energy Commission is well over
1,000 MW, which could generate over 1,500 GWh/per year to supplement the nation’s energy
supply. While there are no existing wind power facilities presently operating in Ghana, Figure 13
shows potential wind power sites which have been identified by the Energy Commission.

pg. 27
The VRA, as part of its energy diversification program, intends to implement up to 150 MW
energy projects of 74 MW capacity each along the cost of Keta in the Volta Region and Ada in
the Greater Accra Region (Kumi, 2017).
Solar Energy
Geographically located close to the equator, Ghana is in a position to exploit its vast solar energy
potential. Throughout the year, the entire country receives substantial solar radiation between
1800 to 3000 hours. This makes it ideally suited for the development of solar energy projects
which has a very high potential for grid-connected and off-grid applications (Kofi-Opata, 2013).
Annual solar irradiation in Ghana ranges between 4.4 and 5.6 kWh/m2 -day (or 16-20 MJ/m2 -
day) (Gboney, 2009). See Figure 14. Currently, the installed solar electricity generating capacity is
just above 1 megawatts (MW) (Energy Foundation, n.d.). In 2013, Ghana added a 2 MW solar
photovoltaic plant in contrast, within the sub-regional level, Cape Verde in 2011 had a solar PV
capacity of 7.5 MW while Mali and Liberia had 0.75 MW and 0.89 MW respectively (ECOWAS
Observatory for Renewable Energy and Energy Efficiency, n.d.). According to the Energy
Commission of Ghana, there are 22 sites that could contribute tremendously to the energy sector.

pg. 28
Figure 14: Ghana’s Average Annual total daily sum of GHI in WH/m2/day (3year average)
Source: (Gyamfi et al., 2015; Schillings, Meyer, & Trieb, 2004).
Although the combined MW capacity is significant, only two construction permits have been
issued (for details see table 6). The process of obtaining these licenses is burdensome and
complicated for investors which are responsible for the slow development of Ghana’s great
solar potential.
pg. 29
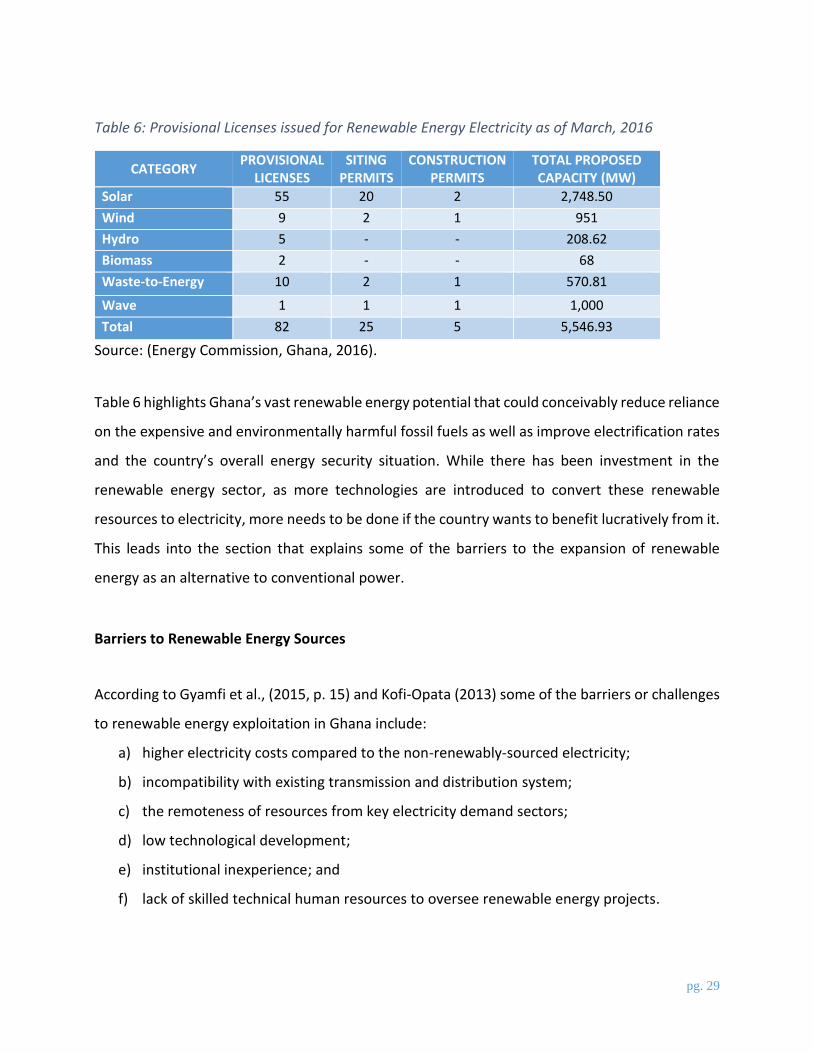
Table 6: Provisional Licenses issued for Renewable Energy Electricity as of March, 2016
CATEGORY PROVISIONAL
LICENSES SITING
PERMITS CONSTRUCTION
PERMITS TOTAL PROPOSED CAPACITY (MW)
Solar 55 20 2 2,748.50
Wind 9 2 1 951
Hydro 5 - - 208.62
Biomass 2 - - 68
Waste-to-Energy 10 2 1 570.81
Wave 1 1 1 1,000
Total 82 25 5 5,546.93
Source: (Energy Commission, Ghana, 2016).
Table 6 highlights Ghana’s vast renewable energy potential that could conceivably reduce reliance
on the expensive and environmentally harmful fossil fuels as well as improve electrification rates
and the country’s overall energy security situation. While there has been investment in the
renewable energy sector, as more technologies are introduced to convert these renewable
resources to electricity, more needs to be done if the country wants to benefit lucratively from it.
This leads into the section that explains some of the barriers to the expansion of renewable
energy as an alternative to conventional power.
Barriers to Renewable Energy Sources
According to Gyamfi et al., (2015, p. 15) and Kofi-Opata (2013) some of the barriers or challenges
to renewable energy exploitation in Ghana include:
a) higher electricity costs compared to the non-renewably-sourced electricity;
b) incompatibility with existing transmission and distribution system;
c) the remoteness of resources from key electricity demand sectors;
d) low technological development;
e) institutional inexperience; and
f) lack of skilled technical human resources to oversee renewable energy projects.
pg. 30
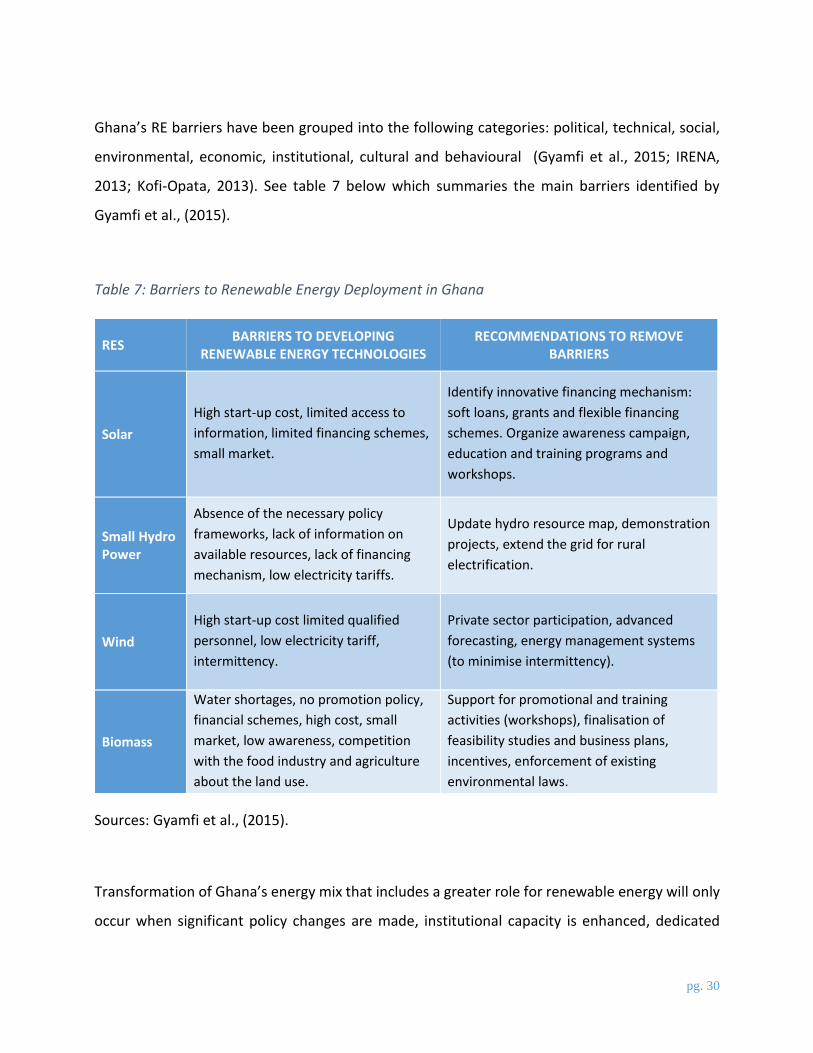
Ghana’s RE barriers have been grouped into the following categories: political, technical, social,
environmental, economic, institutional, cultural and behavioural (Gyamfi et al., 2015; IRENA,
2013; Kofi-Opata, 2013). See table 7 below which summaries the main barriers identified by
Gyamfi et al., (2015).
Table 7: Barriers to Renewable Energy Deployment in Ghana
RES BARRIERS TO DEVELOPING
RENEWABLE ENERGY TECHNOLOGIES RECOMMENDATIONS TO REMOVE
BARRIERS
Solar
High start-up cost, limited access to
information, limited financing schemes,
small market.
Identify innovative financing mechanism:
soft loans, grants and flexible financing
schemes. Organize awareness campaign,
education and training programs and
workshops.
Small Hydro Power
Absence of the necessary policy
frameworks, lack of information on
available resources, lack of financing
mechanism, low electricity tariffs.
Update hydro resource map, demonstration
projects, extend the grid for rural
electrification.
Wind
High start-up cost limited qualified
personnel, low electricity tariff,
intermittency.
Private sector participation, advanced
forecasting, energy management systems
(to minimise intermittency).
Biomass
Water shortages, no promotion policy,
financial schemes, high cost, small
market, low awareness, competition
with the food industry and agriculture
about the land use.
Support for promotional and training
activities (workshops), finalisation of
feasibility studies and business plans,
incentives, enforcement of existing
environmental laws.
Sources: Gyamfi et al., (2015).
Transformation of Ghana’s energy mix that includes a greater role for renewable energy will only
occur when significant policy changes are made, institutional capacity is enhanced, dedicated

pg. 31
financial inflows into research and development grow, incentivization for private sector
investment develops, public education improvements and behavioural changes and a general
revamp in the renewable energy business model. Cost reductions in renewable energy
technologies, for example photovoltaic, as well as technology improvements when combined
with the excellent renewable resources in Africa, augur a welcome and promising economic
outlook for Ghana and the sub-region (IRENA, 2016).

pg. 32
Chapter 3 - Methodology
Case Study Methodology
Case study research is described as a “versatile form of qualitative inquiry most suitable for a
comprehensive, holistic, and in-depth investigation of a complex issue (phenomena, event,
situation, organization, program individual or group) in context, where the boundary between the
context and issue is unclear and contains many variables” Harrison et al., (2017, p. 12) citing
Creswell, 2014; Flyvbjerg, 2011; Merriam, 2009; Simons, 2009; Stake, 2006; and Yin, 2014. The
authors contend that the main focus or reason for employing a case study methodology is a desire
to understand complex phenomenon. Harrison et al., (2017) notes that Creswell’s (2007) definition
of case study methodology is the one that captures the full depth and breadth of case study
concepts and descriptions:
“Case study research is a qualitative approach in which the investigator explores a
bounded system (a case) or multiple bounded systems (cases) over time through detailed,
in-depth data collection involving multiple sources of information (e.g., observations,
interviews, audiovisual material, and documents and reports) and reports a case
description and case-based themes”.
Case studies can be exploratory, explanatory, and descriptive(Harrison et al., 2017; Yin, 2009). It is
a useful research method to gain an understanding of issues in real-life settings. It is also a valuable
framework for answering “how and why or less frequently what research questions” (Harrison et
al., 2017, p. 12). As a result, this research paper selected a practical case study of renewable
technology implementation in Ghana.

pg. 33
Research Methods
RETScreen Expert
RETScreen is a Clean Energy Management Software system for energy efficiency, renewable
energy and cogeneration project feasibility analysis as well as ongoing energy performance analysis
(Natural Resources Canada, 2018). RETScreen helps to identify the technical and financial viability
of an energy project. It also highlights solutions to polluting energy sources like fossil fuel and helps
to highlight its ramifications on the environment in terms of pollution, operating costs and
greenhouse gas emissions. RETScreen Expert allows its users to measure and verify actual
performance of a building/project and identify energy savings. The software was developed by
Natural Resources Canada through CanmetENERGY. It relies on 6,700 ground stations location and
NASA satellite data covering the entire land mass of the planet where ground measuring stations
are not located (Natural Resources Canada, 2018). The software includes climate data and
meteorological data (either from ground stations or NASA’s satellites). Figure 15 shows
screenshots of the RETScreen software, highlighting daily solar radiation and climatic data for
Ghana. RETScreen also has the capability of estimating the greenhouse gas savings potential of
renewable energy projects as well as simulating key financial indicators (for example net present
value and simple payback period) over the entire life of the project. For the purposes of this
project, RETScreen serves as a database for the measurement of solar energy and radiation.

pg. 34
Figure 15: Daily Solar Radiation and Climatic data for Ghana captured on 2018-03-04
Source: RETScreen.

pg. 35
Analysis of Secondary Data
Secondary data was an essential means of data collection and analysis. Re-analysis of existing data
is considered an established a methodology when conducting research. Data was sourced from
governmental institutions e.g., the Ghana Meteorological Agency (GMA), Ministry of Energy, and
the Energy Commission, through their annual reports and other commissioned studies. Other
sources of relevant data were sourced from international agencies (e.g. International Energy
Agency, IRENA and REN21). Academic and other literature was also reviewed to provide a more
comprehensive discussion of the energy sector in Ghana.

pg. 36
Chapter 4 – Case Study – Ghana
Across Ghana, Police Stations and divisional units are often impacted by the intermittent supply of
electricity. There are currently 1078 Police Stations and 383 divisional sectors in Ghana. Because
of the energy crisis facing the country, these law enforcement institutions must either operate
without the necessary power supply or source more expensive avenues like diesel gensets to meet
their energy needs. There have been noted instances where Police Stations have been without
power for more than 18 hours. Problems are exacerbated during power line maintenance and
periods of load shedding. The situation is worse in Police Stations located in villages outside the
major city centres such as Accra and Kumasi. The cumulative effects of the energy crisis on Ghana’s
Police Services include: a reduction in service quality, a demoralized police force, and more
importantly, compromised national security. In response to the ongoing energy crisis and the
current trend towards more renewable sources, a solar PV energy system pilot project was
commissioned by the Ghana Police Division. This major research paper focuses on a pilot study for
five Ghana Police Stations in the Greater Accra Metropolitan Area. The five Police Stations were
selected by the Inspector General of Ghana Police Services. Among the chosen areas were East
Legon Police Station, Nima Police Station, Kotoku Police Station, Nungua Police Station and Okpoi
Police Station. Figure 16 shows the location of the five police stations in this pilot project. The
project ultimately sought to demonstrate the cost-competitiveness of solar PV technologies and
its potential to reduce or replace the station’s dependence on electricity from the national grid.
The project aims at improving police services to the various communities. RETScreen International
Expert was used to analyze the feasibility of the solar project for the five police stations.

pg. 37
Figure 16: Location of the Five Police Stations in the Pilot Project
Source: Google Maps.
Pilot Project Design
The rooftop solar PV system was designed as a hybrid, such that it relies on the national electricity
grid especially during extended periods of reduced sunlight (solar irradiation intensity). Initially,
the project was designed to install 2.03kWp solar PV system in each station but this was later
changed, and each station installed a 5.3kWp rooftop solar PV grid–tied system with power packs
instead. The project is expected to provide uninterrupted power for equipment use such as
computers, printing devices and network devices and provide the facility with lighting and other
services. See Figure 17 for a schematic representation of the solar PV, grid power and battery
power pack system, followed by photos of the completed works for some of the police stations.

pg. 38
Figure 17: Illustration of a Solar PV and Power Pack grid-tied system
Source: Silicon Solar.

pg. 39
Pic 1: Solar PV Installation at East Legon Station
.
Pic 2: Solar PV Installation at Nima Police Station
pg. 40
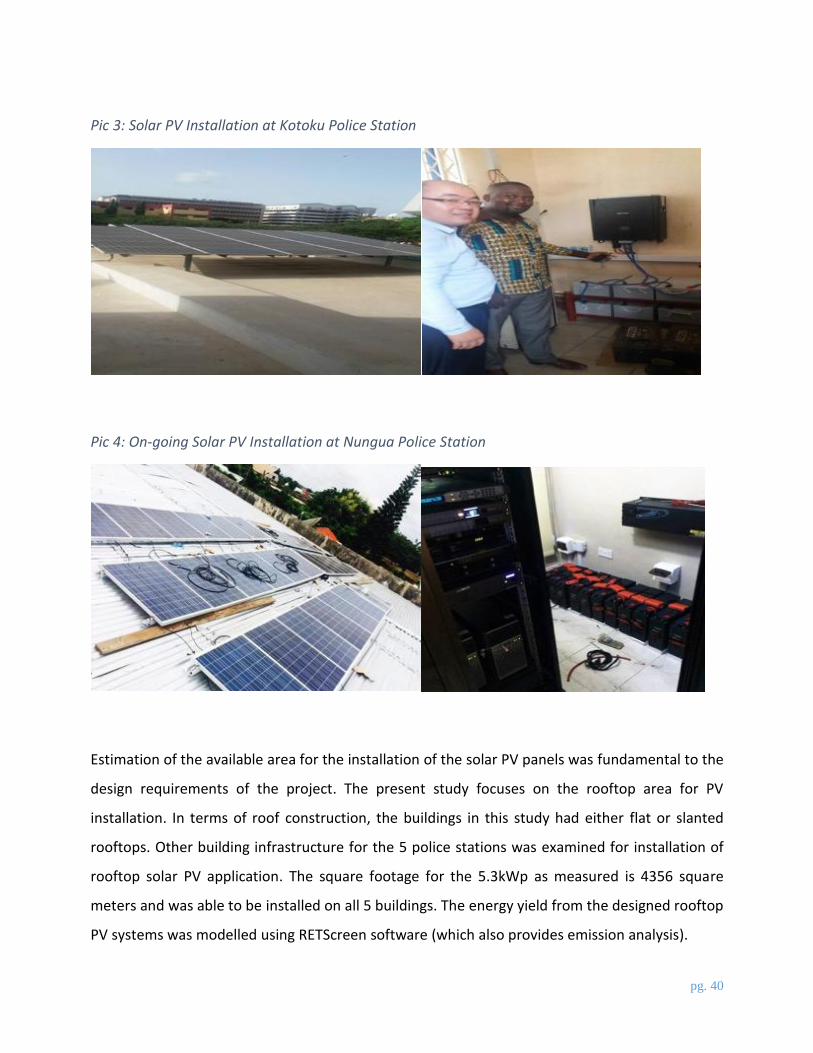
Pic 3: Solar PV Installation at Kotoku Police Station
Pic 4: On-going Solar PV Installation at Nungua Police Station
Estimation of the available area for the installation of the solar PV panels was fundamental to the
design requirements of the project. The present study focuses on the rooftop area for PV
installation. In terms of roof construction, the buildings in this study had either flat or slanted
rooftops. Other building infrastructure for the 5 police stations was examined for installation of
rooftop solar PV application. The square footage for the 5.3kWp as measured is 4356 square
meters and was able to be installed on all 5 buildings. The energy yield from the designed rooftop
PV systems was modelled using RETScreen software (which also provides emission analysis).

pg. 41
Load Calculation
The energy sources for the pilot project are: solar PV, grid power and battery backup/storage.
When sunlight hits the modules of the solar PV, the modules convert energy from the sun into
electricity to power the five Police Stations. Whether the electricity is being drawn from the grid
or the solar PV system, the power performance is anticipated to be the same. The direct current
produced by the solar PV system is wired into an inverter. This inverter converts the DC power into
alternating current or AC. This alternating current is the standard used worldwide. The electrical
current then flows from the inverter into the service panels that feed electricity into the police
stations. A tracking meter monitors how much energy is used, whether the energy needs are met
and how well the system is performing. During the day, excess electricity is stored in the battery
and fed to the grid. The solar PV supports load for installed capacity and the balance load operates
on the battery. In the event of a power outage the battery runs as the backup. The power pack
capacity is 5.3 kWp. The backup power is 8 ~ 24 hours. It should be noted that the installed capacity
was determined based on the total wattage required and for what duration. Based on our
inventory analysis it was determined that a 5.3kWp solar rooftop system would be adequate in
meeting the energy consumption needs of the various police stations. See table 8.

pg. 42
Table 8: Inventory Analysis – Appliances used on site at the Police Stations
DESCRIPTION NO. OF
APPLIANCES POWER RATING
TOTAL POWER
NO. OF HRS ENERGY
CONSUMED WATT-HRS
Desktop Computer and Accessories
2 200 400 12 4800
LED Lights 10 15 150 12 600
Multi-Functional Printer 2 200 200 12 2400
TV Set 1 100 100 12 1200
Fans 2 70 140 12 1680
Digital Cameras 2 40 80 12 960
TPS 510 Android Desktop Device
2 50 100 12 1200
Biometric Scanner 2 50 100 12 1200
Digital Sender 2 50 100 12 1200
Refrigerator 1 100 100 12 1200
Other Equipment 1 1 400 12 4800
Total Power Rating
1470
Source: Neopower Engineering, 2017.
Financial Feasibility Assessment
Project Cost
Table 9 shows the costs of the entire project for each of the Police Stations.

pg. 43
Table 9: PV Cost for Each Police Station
ITEM COST DESCRIPTION
Assumed Start Date - April 2017
Equipment Enclosures/
Housings
5.3kWp for each Police Station
This includes the purchase of
German-produced products
such as inverters, cables, PVs,
Panels, racking units.
Specific Investment $2500 USD/kWp The cost of kilowatt peak
Warranty Free 5 years Warranty
Equity 100%
Duration of Solar PV - 25 years
Energy Price Sold $0.32 Equivalent to 1.41 Ghana Cedes
Installation Cost $2250.00 per Police Station This includes civil works,
wiring/electricals, panel
washing, mounting structures,
vegetation management,
racking/tracker, cable
installation, PV modelling,
environmental monitoring,
energy audits, site visits
Project Cost per Project Site $ 15,500.00 The cost of the equipment
enclosures/ housing and
installation cost gives you the
total cost of the project for one
site.
Source: Neopower Engineering, 2017. 10,000kWh is consumed monthly. From the PURC 2017 1st quarter tariffs, the first 300 kWh costs
29,037Gh pesewas, between 301 and 600 kWh the cost is 30,897Gh pesewas and remaining
9400kWh costs 1,527,594Gh pesewas. In Total, 10,000 kWh costs 1,58 pesewas. Each kWh,
therefore, translates to 1.58 Ghana cedes which is equivalent to 0.34 USD (as of current, 2018,
currency exchange rates). See Table 10.

pg. 44
Table 10: Energy Price Sold and Inflation Price
Energy price sold
0.32USD this equals 1.41 Ghana Cedes
•300kWh = 29,037Gh pesewas
•301-600kWh = 30,897Gh pesewas
•600kWh =1,587,528Gh pesewas
Electricity Price Inflation
5.0 % (inflation average of the last 10
years)
Source: Neopower Engineering, 2017.
Simple Payback Period
Simple payback period is the time in which the initial cost of a project is expected to be recovered
from the cash inflows generated by the project. The payback period of a given investment or
project is an important determinant of whether to undertake the project since longer payback
periods are typically not desirable.
Payback Period = Initial Investment
Cash Inflow Per period
When cash inflows are uneven, we need to calculate the cumulative net cash flow for each period
and then use the following formula to calculate the payback period:
Payback Period = A + B
C
A = Last period with a negative cumulative cash flow;
B = Absolute value of cumulative cash flow at the end of the period A; and
C = Actual Cash Flow during the period after A

pg. 45
Figure 18: Financial Analysis of the Five Pilot Project
Source: Reproduced from RETScreen.
The feasibility analysis carried out for the pilot project focused in determine the financial viability
of the project based on widely-used metrics. RETScreen allowed us to simulate certain financial
indicators such as the Net Present Value (NPV) and Simple Payback Period over the life of the
project. Based on the financial analysis, the project is deemed to be profitable (attractive) and has
a simple payback period of 7.5 years. The Internal Rate of Return (IRR) on Equity is 14.6 per cent.
The project lifetime is 25 years. In most projects, a lesser payback period, a higher IRR and a
positive NPV value are desired, however, using a shorter payback would pose a strong
misrepresentation of what is happening with the project. See Figure 18 and 19. The cash flows (see
figure 18) show a $15,000 in debt on the first zero year of the project (pre-tax). In year one of the
project, there are positive cash inflows which increase through to year 25. On the cumulative side,
the simple payback period falls on the 7th year of the project. See figure 19.
pg. 46
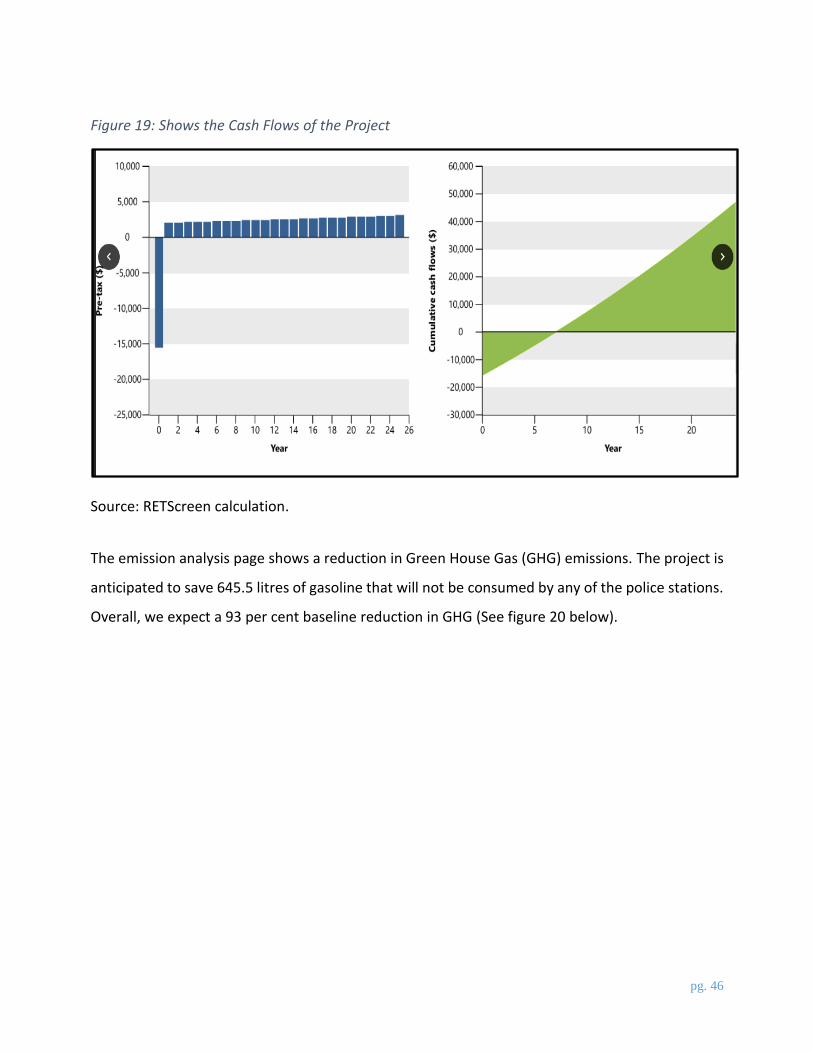
Figure 19: Shows the Cash Flows of the Project
Source: RETScreen calculation.
The emission analysis page shows a reduction in Green House Gas (GHG) emissions. The project is
anticipated to save 645.5 litres of gasoline that will not be consumed by any of the police stations.
Overall, we expect a 93 per cent baseline reduction in GHG (See figure 20 below).
pg. 47
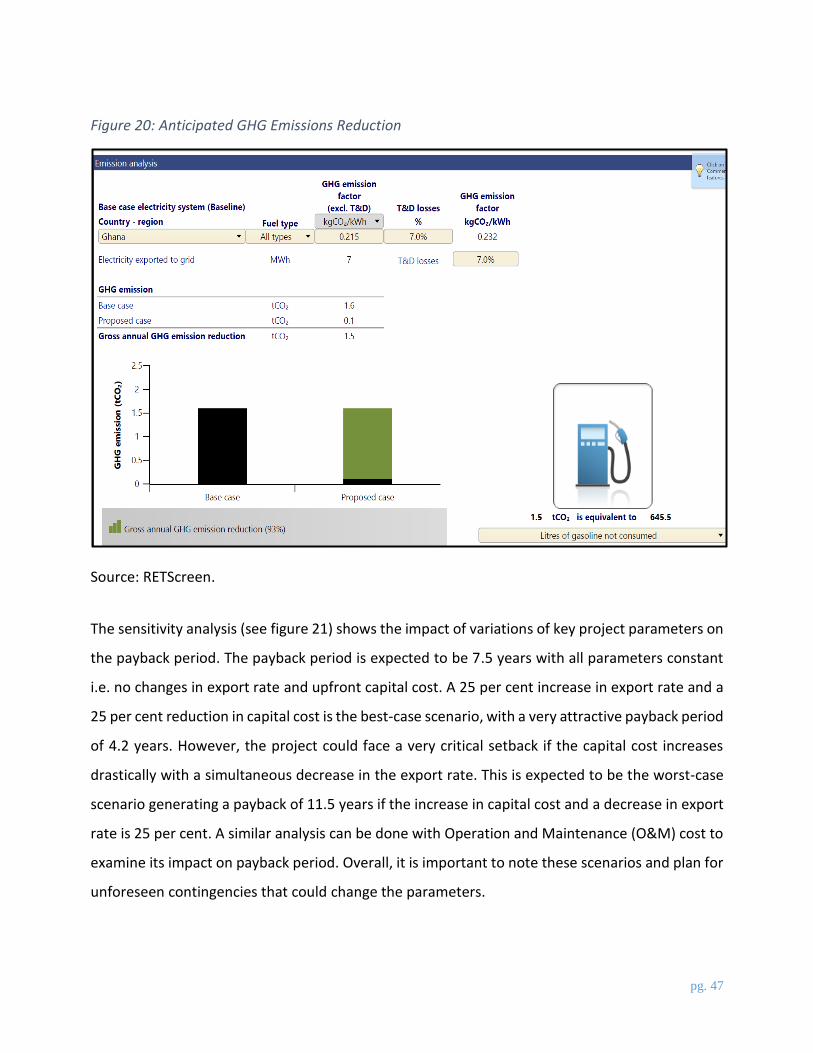
Figure 20: Anticipated GHG Emissions Reduction
Source: RETScreen.
The sensitivity analysis (see figure 21) shows the impact of variations of key project parameters on
the payback period. The payback period is expected to be 7.5 years with all parameters constant
i.e. no changes in export rate and upfront capital cost. A 25 per cent increase in export rate and a
25 per cent reduction in capital cost is the best-case scenario, with a very attractive payback period
of 4.2 years. However, the project could face a very critical setback if the capital cost increases
drastically with a simultaneous decrease in the export rate. This is expected to be the worst-case
scenario generating a payback of 11.5 years if the increase in capital cost and a decrease in export
rate is 25 per cent. A similar analysis can be done with Operation and Maintenance (O&M) cost to
examine its impact on payback period. Overall, it is important to note these scenarios and plan for
unforeseen contingencies that could change the parameters.

pg. 48
Figure 21: The Sensitivity Analysis of the Project
Source: RETScreen.

pg. 49
Chapter 5 – Findings & Conclusions
Discussion
The key findings of the case study include:
The load estimate provided by Neopower Consulting, shows that over a year, the load will
be a bit over 8 MWh.
The PV output will be just under 7 MWh per year.
The battery is very small— only capable of providing for a small load over a short period. It
will not be able to store much PV power, hence in the case of power outages it will produce
power to some extent and blackouts will rollover.
The Ghana Police Stations will need to replace the battery every 5 years which might cost
the Police Stations in the long-run.
Solar energy intermittency as production of power depends on the sun.
Implementation of policies to drive the growth of RE in Ghana.
Above all, this is a viable project.
Ghana’s faces many obstacles in electrifying its remote and dispersed rural communities where
economic activities cannot justify huge investments in grid extension. In addition, the country has
not been able to provide reliable electricity services to its customers in the major urban centres
and adjacent communities. In these circumstances, the success of the pilot project indicates great
opportunities for similar projects in remote rural communities where grid extension and
connectivity is not financially feasible due to substantial up-front costs. It is also beneficial to public
and private enterprises and domestic consumers who are eager to of reduce their overall energy
costs whilst ensuring greater reliability of service.
Statistics show that over 22 countries in the world are meeting more than 1 per cent of their
electric power requirements from solar PV. Italy, Greece and Germany are among the world
leaders in solar PV. Solar PV accounts for 7.8 per cent, 6.5 per cent and 6.4 per cent of their annual

pg. 50
power generation respectively (Asif, 2016, p. 1; Sahu, 2015). As the big three solar PV global
leaders, their success could be a roadmap for implementation of these systems in Sub-Saharan
West Africa. Asif (2016) notes that small-scale and building-integrated applications such as the one
analyzed in the case study account for the greatest share of global solar PV capacity. Germany’s
solar PV installed capacity for example, is largely based on small-scale systems. This reality bodes
well for countries like Ghana that has the resources but do not have dedicated funding sources for
larger-scale renewable energy projects. Since introducing the feed-in tariff (FIT) concept in the
early 1990s, Germany has managed to establish a large base of small-scale PV power producers,
geared towards meeting the energy needs of the residential sector (Asif, 2016; Barker, 2011; Curry,
2013; Sahu, 2015). Germany’s successful utilization of FIT policies has been replicated elsewhere
in the world with varying degrees of success. Ghana like many other countries following Germany’s
example has adopted its own FIT programme, however, it has been plagued with many issues
notably, the duration of contracts (Kenning, 2016). Despite the above, the latest statistics available
shows that Ghana had 23.22 MW of grid connected solar PV installed capacity as of the end of the
first half of 2016 (Bellini, 2017). This installed capacity is mainly due to the existence of the 2MW
grid-connected solar PV farm constructed at Navorongo by the VRA and the 20MW PV plant
completed by the independent power producer BXC Ghana Ltd. Additional capacity is anticipated
when the Nzema 155MW Solar Power Station is completed. These developments are promising
yet still require stronger government policies and a more aggressive mandate to expand solar PV
systems and other forms of renewable energy technologies across the country, especially in
remote communities. Such steps would help Ghana meet its energy requirements, diversify its
energy base away from fossil fuels, improve the energy and environmental footprint of public and
institution, restore public faith in the energy sector, and most importantly, improve energy security
for the future.
The lessons learned from the case study are therefore both positive and negative and should be
built into future solar PV projects. On the positive side, the project proved that solar PV technology
clearly works and can provide a lower cost electrification solution to grid connection. On the other
hand, the issues of ownership, maintenance, cost-recovery, and financing need to be clearly
pg. 51
defined as these can hinder longer-term development of the technology, as was the case with the
Renewable Energy Services Project (RESPRO) operated in Ghana from 1999 to 2003 (Dadzie, 2015).
Recommendations
The role of renewable energy in meeting energy needs in countries with lower electrification rates
is becoming ever more important. Availability of resources, environmentally friendly technologies
and declining start-up and maintenance cost have all contributed to the rapid growth of RE across
the globe. Solar photovoltaics (PV) are one of the most prominent renewable technologies in use
today (Asif, 2016).This is made possible because of favourable institutional environments where
renewable energy policies set the stage for its expansion. Policies include having renewable energy
targets, providing tax incentives, using regulatory tools such as feed-in-tariffs, net-metering, and
other associated instruments. If Ghana intends to reap the benefits of renewable energy
technologies, diversify its energy mix and reduce its dependence on expensive and imported fuel,
it must heed the following:
1) Set and work towards meeting realistic renewables targets in combination with feed-in
tariffs and other policy measures;
2) Create an enabling environment that favours capital flows in the form of sustained
investment in renewable technologies;
3) Take advantage of declining clean energy equipment costs, technological transfer and best
practices by the forerunners in renewable energy adoption;
4) Amend existing national policy frameworks and regulations that favour investment in
traditional fossil fuel-based power supplies;
5) Strengthen existing environmental and energy policies that favour the deployment of
renewable energy technologies by removing bureaucratic red tape and unnecessary
obstacles to local entrepreneurial participation;
6) Support cost-effective distributed energy systems;
7) Invest in the requisite infrastructure that allows for grid connectivity and electricity
transmission from renewable energy sources;
pg. 52
8) Boost energy access by holding tenders in which off-grid developers and distributors
compete for the right to provide electricity(Bloomberg New Energy Finance, 2017); and
9) Embark of campaign to educate the public about renewable energy options, the financial
costs and benefits that can be accrued and its overall impact of the local environment. Such
public awareness campaigns have the added benefit of changing energy consumptions
habits.
10) Consider desalination of sea water into fresh water with renewable energy to pump water
into the hydro dam reservoir to address the issue of load shedding.
Conclusion
RE technologies offers a clean, renewable source, and are essential components of sustainable
energy future. RE technologies such as solar are renewable from the sun, a strategy to address
Ghanaian climate change, environmentally friendly and the sole panacea to address the power
outages situation the country is facing. During the design and evaluation of solar for the Ghana
Police Service, information on solar irradiation and its components at a given location is needed.
In addition, reliable solar radiation and accurate databases are of huge importance to the
development of the case study. Data provided by the RETScreen was more reliable since it has a
significant ground – data component, which makes its output quite close to the reference ground
– measured data from GMA.
From the case study, replication of the pilot project at other police stations, polyclinics and
community health centres, as well as, public schools could improve service delivery in each sector.
Additionally, it would provide these institutions some degree of security in electricity supply that
is not based on the government’s ability to pay debts to the various utility companies. The case
study would also create room for the government to embark on off–grid electrification for those
rural communities that lack access to electrical grid extension. Due to the changing weather
pattern, proper energy storage must be used to prolong the amount of power to be consumed.

pg. 53
However, the efficiency of the power supplied by the renewable energy sources can be maximized
when paired with an energy storage system.
Another advantage of solar energy is that, the solar panels will provide shades for buildings as well
as reducing the cost of energy in Ghana. This could be achieved by incentivising the private sector
to participate in the energy industries. This will go a long way to boost the energy performance of
the country, address the country’s GHG emissions since most Ghanaians will switch from the
gensets powered by dirty diesel, and make electricity affordable for the masses.

pg. 54
References
Acheampong, T., & Ankrah, F. (2014). Pricing and deregulation of the energy sector in Ghana:
challenges and prospects. Retrieved from http://www.imanighana.com/wordpress/wp-
content/uploads/2014/01/Ghana_Energy_Report_2014-Imani-Report.pdf.
African Development Bank Group. (2013, February 18). The High Cost of Electricity Generation
in Africa. Retrieved July 15, 2018, from https://www.afdb.org/en/blogs/afdb-championing-
inclusive-growth-across-africa/post/the-high-cost-of-electricity-generation-in-africa-11496/
Armah, B. (2003). Economic Analysis of Ghana’ Energy Sector. Accra: Ghana Energy
Commission.
Arndt, C., Asante, F., & Thurlow, J. (2015). Implications of climate change for Ghana’s economy.
Sustainability, 7(6), 7214–7231.
Asif, M. (2016). Urban Scale Application of Solar PV to Improve Sustainability in the Building
and the Energy Sectors of KSA. Sustainability, 8(11), 1–11.
https://doi.org/10.3390/su8111127
Barker, G. (2011, March 21). UK can learn from Germany’s feed-in tariff lessons. The Guardian.
Retrieved from https://www.theguardian.com/environment/2011/mar/21/germany-feed-in-
tariff
Bellini, E. (2017, December 18). Ghana to launch rooftop solar program in 2018. Retrieved July
15, 2018, from https://www.pv-magazine.com/2017/12/18/ghana-to-launch-rooftop-solar-
program-in-2018/
Blackshear, B., Crocker, T., Drucker, E., Filoon, J., Knelman, J., & Skiles, M. (2011).
Hydropower vulnerability and climate change. In A Framework for Modeling the Future of
Global Hydroelectric Resources, Middlebury College Environmental Studies Senior
Seminar, Fall.
Boadi, S. A. (2015). The Influence of Climate Variability and Change on the Attainment of Energy
Security in Ghana: A Study of the Akosombo Hydroelectric Power Project (Thesis).
University of Ghana, Ghana.
Boadi, S. A., & Owusu, K. (2017). Impact of climate change and variability on hydropower in
Ghana. African Geographical Review, 0(0), 1–15.
https://doi.org/10.1080/19376812.2017.1284598
pg. 55
Bryan Cave Leighton Paisner LLP. (2017, January 25). Power to Africa volume 2: Ghana (part 2) |
Power Sector Expert Insights. Retrieved July 15, 2018, from
http://www.blplaw.com/expert-legal-insights/articles/power-to-africa-volume-2-ghana-
part-2
Central Intelligence Agency (CIA). (n.d.). The World Factbook — Ghana [Government].
Retrieved June 16, 2018, from https://www.cia.gov/library/publications/the-world-
factbook/geos/gh.html
Chizoba, I. (2017, March 22). Ghana Natural Resources: List of Natural Resources Found in
Ghana. Retrieved July 15, 2018, from https://www.nigerianinfopedia.com/ghana-natural-
resources-found-in-ghana/
Curry, A. (2013, April 1). Germany’s solar-power success: Too much of a good thing? Retrieved
July 15, 2018, from https://grist.org/business-technology/germanys-solar-power-success-
too-much-of-a-good-thing/
Dadzie, F. Y. (2015). Lessons Learned In Implementing Off-Grid Electrification Projects in
Africa- Ghana’s Example. 2015 Africa Energy Yearbook, 97–100.
Duku, M. H., Gu, S., & Hagan, E. B. (2011). A Comprehensive Review of Biomass Resources and
Biofuels potential in Ghana. Renewable and Sustainable Energy Reviews, 15(1), 404–415.
ECOWAS. (2015). ECOWAS Renewable Energy Polcy. Cape Verde: Centre for Renewable
Energy and Energy Efficiency (ECREEE). Retrieved from
http://www.ecreee.org/sites/default/files/documents/ecowas_renewable_energy_policy.pdf
ECOWAS Observatory for Renewable Energy and Energy Efficiency. (n.d.). Energy Efficiency
for Households in Ghana. Retrieved July 2, 2018, from
http://www.ecowrex.org/news/energy-efficiency-households-ghana
Energy Commission, Ghana. (2016). 2016 Energy (Supply and Demand) Outlook for Ghana -
Final (p. 72). Accra, Ghana: Energy Commission of Ghana.
Energy Commission of Ghana. (2016). National Energy Statistics - 2007 -2016 (Energy Statistics).
Accra, Ghana: Energy Commission of Ghana. Retrieved from
http://energycom.gov.gh/files/National%20 Energy%20Statistics_2016.pdf
pg. 56
Energy Commission of Ghana. (2017). National Energy Statistics (2016-2017) (National Energy
Statistics). Ghana: Energy Commission of Ghana. Retrieved from
http://energycom.gov.gh/files/ENERGY_STATISTICS_2017.pdf
Energy Foundation. (n.d.). Energy Efficiency for Households/SMES. Retrieved July 2, 2018, from
https://www.efghana.org/project/energy-efficiency-for-householdssmes/
Gboney, W. (2009). Policy and Regulatory Framework for Renewable Energy and Energy
Efficiency Development in Ghana. Climate Policy, 9(5), 508–516.
https://doi.org/10.3763/cpol.2009.0636
Government of Ghana. (2018). Bui and the Tale of Three Hydro Dams. Retrieved July 15, 2018,
from http://www.ghana.gov.gh/index.php/media-center/features/805-bui-and-the-tale-of-
three-hydro-dams
Guéniat, M., Harjono, M., Missbach, A., & Viredaz, G. V. (2016). Dirty Diesel. How Swiss
Traders Flood Africa with Toxic Fuels. Lausanne: Public Eye.
Guéniat, Marc, Harjono, M., Andreas Missbach, & Viredaz, G.-V. (2016). Dirty Diesel: How
Swiss Traders Flood Africa with Toxic Fuels. Retrieved from https://goo.gl/wXhLCq
Gyamfi, S., Modjinou, M., & Djordjevic, S. (2015). Improving electricity supply security in
Ghana—The potential of renewable energy. Renewable and Sustainable Energy Reviews,
43, 1035–1045.
Hagan, B. E. (2015). The Renewable Energy Policy Review, Identification of Gaps and Solutions
in Ghana, United Nation Development Programme (UNDP), New York City, Ny USA.
Harrison, H., Birks, M., Franklin, R., & Mills, J. (2017). Case Study Research: Foundations and
Methodological Orientations. Forum Qualitative Sozialforschung / Forum: Qualitative
Social Research, 18(1), 1–17.
International Energy Agency. (2012, July). National Electrification Scheme - Ghana. Retrieved
June 23, 2018, from http://www.iea.org/policiesandmeasures/pams/ghana/name-24778-
en.php
IRENA. (2013). Africa’s Renewable Future: The Path to Sustainable Growth (32). United Arab
Emirates: International Renewable Energy Agency. Retrieved from
http://www.irena.org/DocumentDownloads/Publications/Africa_renewable_future.pdf

pg. 57
IRENA. (2016). Solar PV in Africa: Costs and Markets (p. 84). United Arab Emirates:
International Renewable Energy Agency.
Jeong, M. (2017). National Renewable Energy Policy in a Global World (PhD). University of
Maryland, College Park, Maryland. Retrieved from
http://search.proquest.com/openview/4bb01caeb48ffd7639f4424e743310cc/1?pq-
origsite=gscholar&cbl=18750&diss=y
Kemausuor, F., Obeng, G. Y., Brew-Hammond, A., & Duker, A. (2011). A review of trends,
policies and plans for increasing energy access in Ghana. Renewable and Sustainable
Energy Reviews, 15(9), 5143–5154.
Kenning, T. (2016, April 20). Ghana to update feed-in tariffs to last 20 years. Retrieved July 15,
2018, from https://www.pv-tech.org/news/ghana-to-update-feed-in-tariffs-to-last-20-years
Kofi-Opata, E. (2013). Alternative energy and the developmental state in Ghana (Masters).
University of Toledo, Ohio. Retrieved from
http://rave.ohiolink.edu/etdc/view?acc_num=toledo1368117768
Kumi, E. N. (2017). The Electricity Situation in Ghana: Challenges and Opportunities (Policy
Paper No. CGD Policy Paper 109). Washington, D.C.: Center for Global Development.
Retrieved from https://www.cgdev.org/ publication/electricity-situation-ghana-challenges-
and-opportunities
Lucien, G., Mark, M., & Martyn, P. (n.d.). The global green economy: a review of concepts,
definitions, measurement methodologies and their interactions. Geo: Geography and
Environment, 4(1), e00036. https://doi.org/10.1002/geo2.36
Mensah, J. T., Marbuah, G., & Amoah, A. (2016). Energy demand in Ghana: A disaggregated
analysis. Renewable and Sustainable Energy Reviews, 53, 924–935.
Ministry of Energy. (2010). Energy Sector Strategic and Development Plan. Ghana: Ministry of
Energy.
Ministry of Energy, & World Bank. (2004). Ghana Poverty and Social Impact Analysis Electricity
Tariffs: Phase I. Ghana: Government of Ghana and World Bank. Retrieved from
http://webcache.googleusercontent.com/search?q=cache:r4I7XHIxhb8J:siteresources.world
bank.org/INTPSIA/Resources/490023-

pg. 58
1120841262639/psia_ghana_electricity.pdf+&cd=2&hl=en&ct=clnk&gl=ca&client=firefo
x-b-ab
Mohammed, Y. S., Mokhtar, A. S., Bashir, N., & Saidur, R. (2013). An overview of agricultural
biomass for decentralized rural energy in Ghana. Renewable and Sustainable Energy
Reviews, 20, 15–25.
Moujaled, J. K. (2014). A comparative assessment of solar resource databases, simulations and
ground observations for Kumasi (BSc). Kwame Nkrumah University of Science and
Technology, Kumasi, Ghana. Retrieved from
http://dspace.knust.edu.gh/handle/123456789/6508
Natural Resources Canada. (2018, January 25). RETScreen [Government]. Retrieved July 2, 2018,
from http://www.nrcan.gc.ca/energy/software-tools/7465
Neopower Engineering Consulting, http://www.neopower.com.gh/
Oyoh Tolumo Desmond (2016):Desalination in water treatment
Retrieved from
https://www.theseus.fi/bitstream/handle/10024/124763/desalination.pdf?sequence=1
HAMK (P.5)
REN21. (2017). Renewables 2017 Global Status Report (Renewables Global Status Report No.
ISBN 978-3-9818107-6-9). Paris: REN21 Secretariat.
Rickerson, W. (2012). Feed-in tariffs as a policy instrument for promoting renewable energies
and green economies in developing countries. New York: United Nations Environmental
Programme.
Sahu, B. K. (2015). A study on global solar PV energy developments and policies with special
focus on the top ten solar PV power producing countries. Renewable and Sustainable
Energy Reviews, 43, 621–634.
Schaeffer, R., Szklo, A. S., de Lucena, A. F. P., Borba, B. S. M. C., Nogueira, L. P. P., Fleming, F.
P., … Boulahya, M. S. (2012). Energy sector vulnerability to climate change: a review.
Energy, 38(1), 1–12.
Schillings, C., Meyer, R., & Trieb, F. (2004). Solar and Wind Energy Resource Assessment
(SWERA): Final Report (Solar and Wind Energy Resource Assessment (SWERA)) (p. 56).
Germany: UNEP/GEF.
pg. 59
Shillito, J. (2016, October 17). Ghana domestic gas production casts more doubt on FSRU [ICIS].
Retrieved June 26, 2018, from https://www.icis.com/
Silicon Solar: http://www.siliconsolar.com/grid-tie-solar-systems-with-battery-backup.html
Statista. (2018). Brent crude oil price annually 1976-2018 | Statistic. Retrieved June 26, 2018,
from https://www.statista.com/statistics/262860/uk-brent-crude-oil-price-changes-since-
1976/
Stewart, R. (2017, April 28). Africa rejects Europe’s “dirty diesel.” Retrieved June 26, 2018, from
ttp://p.dw.com/p/2c4l8
UN Dept of Economic and Social Affairs. (2017). Sustainable Development Goal 7: Ensure
access to affordable, reliable, sustainable and modern energy for all (Progress towards the
Sustainable Development Goals No. E/2107/66). Retrieved from
https://sustainabledevelopment.un.org/sdg7
United Nations. (1987). Report of the World Commission on Environment and Development: Our
Common Future (No. A/42/427). United Nations Environmental Programme. Retrieved
from http://www.un-documents.net/wced-ocf.htm
World Energy Resources, 2016. https://www.worldenergy.org/publications/2016/world-energy-
resources-2016/. Retrieved on the 26th of July,2018 at 12:55pm
Yin, R. K. (2009). Case study research: Design and methods (applied social research methods)
(2nd ed.). Thousand Oaks, Calif: International Educational and Professional Publisher.