Alpha edge - December 2015
22
www.citadelle.in Questions Insight Analysis Action “End of fear?” India Strategy | December 2015
-
Upload
socialcitadelle -
Category
Economy & Finance
-
view
97 -
download
1
Transcript of Alpha edge - December 2015

www.citadelle.in
Questions
Insight
Analysis
Action
“End of fear?”
India Strategy | December 2015


December 2015 3
End of fear? India Strategy | December, 2015
Foreword
Dear Investor,
The month of November turned out to be a slightly negative month with Nifty moving down 1.62%. What dominated the month was Bihar elections which surprised everyone with Grand Alliance winning by a huge margin and Q2 earnings disappointing again which has now made the investors more cautious. FII’s continued to be net sellers withdrawing around $1 billion from Indian equities for the month expecting US Fed rate hike anytime soon and slower than anticipated recovery in India whereas DII’s continued to be net buyers. With all eyes on the US fed meet on 15-16th December where the general expectation now is that the Fed will start the process of normalization of interest rates, even though we still feel it could get postponed. The topic of Fed rate hike has been discussed so much in the last one year that almost everyone is expecting it and most of it has already been priced in the markets with FII’s already withdrawing almost $3 billion dollars from India. This time Fed has given enough signals that the rate hike cycle is going to be a slow and gradual one as they are cautious of the fact that global scenario is weak and it does not want the US recovery to be affected by higher interest rates. As discussed in our August issue where we did the analysis of the effect of the interest rate hike has on the equity markets and found that markets have actually risen in under a year after the hike. Probably with the event behind us soon, will it be the end of fear and with it a promise of fresh thinking? On the domestic front, RBI maintained status quo on the repo rate, 2nd quarter earnings disappointing again with PAT slipping 2% plagued by poor rural demand, low volume growth, weak global environment, low capacity utilization, slower pace of major economic reforms etc.. At the month end we also had the GDP numbers for the second quarter coming in at 7.4% yoy with services sector slowing a bit and private consumption moderating reflecting the weak rural demand. The green shoots however are that investments have picked up supported by government spending which is a precursor to revive the demand in the economy. Manufacturing growth was robust with a 9% growth which augurs well for the recovery. The 7th pay commission would eventually lead to a higher demand through higher salaries and consumption. We believe that these green shoots need to be nurtured well, and the economy going forward needs more pro activeness from the government with respect to big bang reforms which would finally lead to a faster earnings recovery going forward. Given the key macroeconomic indicators suggesting that India is on a gradual path to recovery and we believe the same would reflect in the earnings, albeit it will take a quarter or 2 for the same. Until then the markets would be range bound as the investors cautiously wait for the earnings to recover and likely hike in the interest rates by Fed. We believe in such times of early stages of recovery it is prudent to slowly and steadily add to equity investments from a medium to long term horizon. Warm Regards,
A V Srikanth

December 2015 4
Alpha Edge | “End of Fear?”
Asset Class performance
Asset Class returns for November 2015
Source: Bloomberg
After a couple of turbulent months, Equity markets were down by 1.62% in the month of November. Gold has been the worst performer with returns of 5.05%.
FII Flows for CY 2015
Source: ACEMF
Equity as well as Debt markets have seen outflows in November. Equities saw a significant net outflow of Rs 7,074 Crs whereas Debt market has seen net inflow of Rs 3,753 Crs. The outflows have been due to expectation of rate hike by US Federal Reserve.
Sector Returns for November 2015
Source: Bloomberg
Consumer Durables, Auto and Oil & Gas have been
outperformers for November 2015. Healthcare, IT and
Teck have been the laggards during the same period.
-1.62%
0.03%
0.57%
-5.05%-6.00%
-5.00%
-4.00%
-3.00%
-2.00%
-1.00%
0.00%
1.00%
Equity 10 yrTreasuries
Cash Gold
Asset Class Returns For November 2015
47 3771
-53
83133
-3
128 113 97
21
-6
4
9
12
5
46
42
35
-51
160
51
-100
-50
0
50
100
150
200
250
300
20
05
20
06
20
07
20
08
20
09
20
10
20
11
20
12
20
13
20
14
CYT
D
FII F
low
s (i
n `
00
0 C
rs)
Equity Debt
-9.8
-2.8
-2.8
-2.6
-2.4
-2.0
-1.9
-0.8
0.1
0.7
0.8
1.5
2.8
2.9
4.4
5.0
-18.0 -6.0 6.0
S&P BSE Health Care
S&P BSE TECk Index
S&P BSE IT
S&P BSE METAL Index
S&P BSE Capital Goods
S&P BSE Realty Index
S&P BSE SENSEX
S&P BSE Power Index
S&P BSE Mid-Cap
S&P BSE BANKEX
S&P BSE FMCG
S&P BSE PSU
S&P BSE Small-Cap
S&P BSE OIL & GAS Index
S&P BSE AUTO Index
S&P BSE Consumer Durables
Sector Returns for November 2015 (%)

December 2015 5
Alpha Edge | “End of Fear?”
US Interest rates – Gearing up for a December rate
hike?
Nearly seven years ago the Fed put its benchmark interest
rates close to zero as a way to bolster the economy. The
move was announced in the gloom of the longest
recession since World War II, as jobs were being squeezed
out of the economy.
If Fed’s statements in the last month are anything to go
by then we could be in for a start of the rate hike cycle in
December. The Fed has been sending out signals that as
long as jobs growth data and inflation trends don’t take
turn for the worse the officials will raise the interest rates
in December meet. The central bank by now has warned
about the rising interest rates many times and the idea
has been the most talked about in the recent times, hence
we do feel that most of it could be priced in. We have seen
recently that any announcement from Fed in recent times
has not led to any significant reaction in the markets. In
fact, many are looking at hike in the interest rates as a
positive sign as it shows the confidence in the economic
recovery by Fed that they need not anymore hold the
rates near zero to push the economy further.
Latest US inflation numbers have come in strong with
Core inflation rising 0.2% MoM and 1.9% YoY (Core
inflation does not include volatile items like food prices,
energy prices etc.). The other factors like strengthening of
the US dollar and the weakening global situation could
play a spoil sport. However, an important thing to take
away from Fed’s statements is that even if we do see a
rate hike, the impending sequence of the hikes will be
much slower than the previous monetary cycles as Fed
needs to make sure the hike does not affect the economic
recovery and inflation trajectory and that the same
remains around 2% in the longer term.
Source: Bureau of Labor Statistics
Now let’s understand what could be the impact of the
hike on a country like India. We believe that since the
topic of Fed hiking the rates has been doing rounds since
a while, most of the fear has already been priced in to the
markets unlike the last time in 2013 when Fed announced
that they would taper the QE program actually surprised
the Indian markets and led to a good amount of volatility
in currency, bond & equity markets. In fact this time
around investors are waiting for the hike as that would
mean doing away with the uncertainty. An increase in US
interest rates would normally lead to a knee jerk reaction
resulting from a withdrawal of funds from emerging
economies. While in the current scenario most of it (more
than $3 billion) has already been withdrawn by the FII’s
from the Indian markets there could be some of the ‘Hot
money’ that still resides in the India market which could
cause a bit of volatility. A contrarian point of view is that
a Fed hike can only mean a show of confidence in the US
economic recovery which would eventually benefit India
too as it would boost exports related sectors (Both from
stronger demand and stronger USD).
Let’s examine the possibilities a little more.
0.00%
0.50%
1.00%
1.50%
2.00%
2.50%
Oct
-10
Mar
-11
Au
g-1
1
Jan
-12
Jun
-12
No
v-1
2
Ap
r-1
3
Sep
-13
Feb
-14
Jul-
14
Dec
-14
May
-15
Oct
-15
US core Inflation

December 2015 6
Alpha Edge | “End of Fear?”
Baltic Dry Index – Drops to an all-time low
The Baltic Dry Index is a daily average of prices to ship raw
materials. It represents the cost paid by an end customer
to have a shipping company transport raw materials
across seas. This index can be used as an overall economic
indicator as it shows where end prices are heading for
items that use the raw materials that are shipped in dry
bulk. When there's more demand for cross-ocean
shipping of goods, rates go up. Therefore, when the price
rises, productivity globally is thought to be increasing. The
same goes for when rates drop, which usually signals too
many carriers without enough goods to ship.
Export/import shipping declines, generally seen as a
signal that the global economy could once again be
slowing.
Baltic dry index touches all-time low
Source: Bloomberg
Shipping costs have fallen to a record low. The Baltic dry
index too has fallen to its lowest level on record, a drop
of 55 per cent from a year ago amid signs of Chinese
demand slowdown especially for steel, iron ore and coal.
Lower shipping costs is signaling a decreasing global
activity, excess supply (Indicating record ordering of new
vessels in the last decade when rates were reaching
record highs) and the general demand environment
across the globe which has obviously been muted in the
recent past. Slower growth is a part of China’s rebalancing
process however it may be anything but smooth for China
and the world markets as evidenced from the recent
global turmoil.
A Baltic dry index may be a symptom of low demand. But
basic economics also tell us that low prices also stimulate
demand, so we could see a pick-up in world trade soon.
Crude Oil – Prices move lower
Oil prices have fallen further in the month of November.
Just 18 months ago the prices were hovering around $100
per barrel and now it’s almost around $43, which is a
downfall of around 57%. We do believe that the lower
crude oil prices are here to stay for some time before they
rebound. There are few factors that have affected the
prices in the last 1 year and we believe that they will
continue to do so in the near term.
Following a boom in the US shale gas production last year
and OPEC’s decision to not cut the oil production has
resulted in overall global oil production far outpacing the
current demand. Recent data has been revealing a rise in
the US crude oil inventory levels to record highs. This
would mean the supply glut would continue for some
time. The ongoing worries over the weakening of the
global economy and lower demand is further adding to
the concerns that supply will outpace demand for longer
than anticipated and the same will put pressure on the
price. Although we could see some support to crude oil
prices due to the current geo political tensions.
Lower prices means lower global activity, for India as an
oil importing nation is good news and has already helped
India reduce the import bill, lower the deficit and
subsidies.
US Crude Oil Inventory
Source: eia.gov
0
2000
4000
6000
8000
10000
12000
14000
4-J
an-8
5
4-J
an-8
8
4-J
an-9
1
4-J
an-9
4
4-J
an-9
7
4-J
an-0
0
4-J
an-0
3
4-J
an-0
6
4-J
an-0
9
4-J
an-1
2
4-J
an-1
5
Baltic dry Index
200000
250000
300000
350000
400000
450000
500000
550000
2-F
eb
-01
2-F
eb
-02
2-F
eb
-03
2-F
eb
-04
2-F
eb
-05
2-F
eb
-06
2-F
eb
-07
2-F
eb
-08
2-F
eb
-09
2-F
eb
-10
2-F
eb
-11
2-F
eb
-12
2-F
eb
-13
2-F
eb
-14
2-F
eb
-15
Weekly U.S. Ending Crude oil Stocks excluding SPR

December 2015 7
Alpha Edge | “End of Fear?”
Indian Economy
IIP weakens in the month of September
Industrial production weekend to a 3.6% growth in
September as compared to 6.3% in August, due to a
slowdown in manufacturing growth to 2.6% from 6.6%
the month earlier. Mining slowed to 3%, while electricity
jumped to 11.4% (vs. 5.6%). At 8.4%, the growth in
durables was resilient.
Basic and intermediate goods also held to healthy 4%
and 2.1% growth respectively. The only sector to
contract this month was nondurables (-4.6%). YTD IIP
and manufacturing growth were, respectively, 3.9% and
4.1%.
Due to the favourable base, we are likely to see good IIP
figures in the next few months but manufacturing
deceleration could be a worry going forward.
Indian Industrial Production
Source: rbi.gov
India GDP Growth
The Indian economy expanded 7.4 percent year-on-year
in the September 2015 quarter. Figures came better
than market expectations of a 7.3 percent increase,
boosted by financial, real estate and insurance activities
and manufacturing which advanced by 9.7% (8.9% yoy
growth in previous quarter).
Key macroeconomic indicators suggest that India’s
economy is on a path of gradual recovery. We believe
that improved power generation, stronger mining
output, increased government infrastructure spending
(in areas such as roads and highways), greater fiscal
delegation to states, efforts to revive power distribution
companies and changes in energy pricing policies are all
supportive of a gradual recovery in economic activity.
We see the cumulative effects of various policy
initiatives as having a boosting effect in the next 6-18
months.
Industrial output is improving, albeit from a low base.
With regard to the services sector, domestic trade
activity is showing signs of an uptick, although still
uneven in nature. Urban demand continues to outpace
rural demand. The construction sector is still weak.
Private investment remains subdued, and is likely to be
some time before it improves, while stronger
government spending is partly supporting the otherwise
weak capex cycle.
In sum, while trends in various high frequency indicators
remain inconclusive and headline GDP growth data has
fluctuated, we think that the trend of gradual
improvement in overall economic activity remains on
track.
Admittedly, ‘grey’ areas in the GDP series, as per the
new methodology, persist, with a seeming upside bias in
growth estimations versus the ‘old’ series. Accordingly,
the ‘new’ growth data needs to be interpreted carefully,
especially when comparing with GDP growth in previous
years.
Just in case you missed, for the first time in many years
the real GDP is higher than the nominal one. It is also a
fact that nominal GDP greatly correlates with corporate
earnings. No wonder the needle isn’t moving no matter
the ‘high GDP’ we hear about. Something is amiss.
-1.2-1.3
0.11.1
-2.0
-0.5
3.7
5.64.3
0.90.5
2.6
-2.7
5.2
3.62.8
4.8
2.53.02.5
4.24.1
6.3
3.6
IIP

December 2015 8
Alpha Edge | “End of Fear?”
Debt
CPI accelerates, WPI hardens
Consumer prices in India grew 5 percent year-on year in
October of 2015, compared to 4.41 percent in
September, boosted by higher than expected rise in cost
of food.
Year-on-year, cost of food and beverages rose 5.34
percent (4.29 percent in September), provisional
estimates showed. The food alone index surged 5.25
percent compared to 3.88 percent in the previous month
as the major catalyst to this was Cost of pulses which
jumped at a faster 42.2 percent (29.76 percent in
September).
Indian wholesale prices declined by 3.81 percent year-
on-year in October of 2015, slowing from a 4.54 percent
drop in September, as cost of petrol and manufactured
declined at a slower pace while prices of food rose
higher than in the previous month.
Year-on-year, petrol prices dropped by 13.16 percent,
following a 14.78 percent fall in the previous month and
cost of diesel decreased by 26.21 percent, following a
28.06 percent decline in September.
A year ago, the CPI was 5.59 percent. The central bank
targets Jan 2016 CPI at 6 percent and expects it to reach
5.8 percent; inflation below this would provide RBI room
for further cut rates.
CPI and WPI
Source: rbi.gov
RBI maintains status quo
RBI in its fifth Bi-Monthly policy decided to keep the Repo
rates unchanged at 6.75%. The cash reserve ratio (CRR),
or the portion of a bank’s deposits that has to be
maintained in cash with RBI too, stands unchanged at 4%.
The statutory liquidity ratio (SLR), which is the amount
that banks hold in government bonds, also remained
steady at 21.5%. It was widely expected that the governor
would leave the rates unchanged, given the fact that
consumer inflation has been rising (Even though it is still
within RBI’s comfort zone) and the high probability of a
December rate hike by US fed. The governor did mention
that the Fed action could create a volatile knee jerk
reaction, however with less impact going forward. The RBI
mentioned that they will keep an eye on the
implementation of Pay commission and its impact on
wages as it will have direct bearing on aggregate demand.
He also mentioned that as and when the room opens
there will be more rate cuts. The governor mentioned the
need for further transmission of rate cuts by banks. The
inflation expectations by Mar 2017 remains unchanged at
5%.
View
We feel that the RBI in the last meet had front loaded its
policy action by. Hence it will now carefully asses the
domestic and external situation before taking any further
action, be it the impending US rate hike which would
result in a volatile rupee and further reduce the gap
between US & Indian interest rates or the issues relating
to 2nd consecutive weak monsoon that could result in a
higher than anticipated consumer inflation. With a target
of 5% inflation by Mar 2017 and a real interest rate target
of 1.5%-2% there is still room for 25 bps rate cut. However
as before the RBI has been undershooting the inflation
target which could mean room for further 25 bps – 50 bps
rate cut in FY 17. As mentioned before the September rate
cut was front loaded and hence we feel there would be a
long pause before the next policy action is taken.
-10
-5
0
5
10
CPI and WPI
CPI WPI

December 2015 9
Alpha Edge | “End of Fear?”
Source: Bloomberg
With inflation being within the comfort zone of RBI and
an expectation of 25-50 bps of further rate cut we could
see a front ended fall in the 10 year yields. We are bullish
on duration from a medium term perspective and
recommend exposure to duration through dynamic bond
funds. Readers may recollect our neutral stance on
duration earlier in the year. Its only now that we are
positive on duration and probably only for the medium
term
4
5
6
7
8
9
10
Repo Rate Gsec yield

December 2015 10
Alpha Edge | “End of Fear?”
Equity
Nifty ended in the negative territory with a return of -
1.62% as compared to 1.47% last month. CNX midcap
index ended flat with 0.08% for the month as compared
to 1.96% last month. Whereas CNX small cap
outperformed with a 3.43% return for the month as
compared to 2.47% last month.
FII & DII flows
FII’s sold more than $1 billion in Indian equities in the
month of November, mostly on concerns over weak
earnings and a likely hike in the US interest rates anytime
soon. On the contrary DII’s continued their buying spree
with 8,500 cr. Of equity bought in November.
Flows in Rs cr November
2015 October
2015
Domestic Institutional
Investors (DIIs)
Mutual Fund 6,547 2,935
Insurance 1,953 (4,453)
Total 8,500 (1,518)
Foreign Institutional Investors (FIIs)
(7,073) 6,649
Equity outlook
We have seen another quarter of muted earnings
numbers. Q2FY16 Sensex PAT de-grew by 2% and revenue
declined by 6%. The lack of topline growth is stemming
from low inflation and fall in commodity prices and a
weak demand environment. However, low inflation and
commodity prices has helped companies in improving
their margins and hence the bottomline.
There are various reasons for weak earnings number for
the quarter, like weak global environment affecting
exports, low volume growth, two successive years of
draught leading to a weak rural demand, stress in the
banking system, low capacity utilization and slower pace
of major economic reforms.
Last year the stock market rallied on the basis of
expectations and hope of major economic reforms that
would be done by the newly elected central government
to push the growth further, which would lead to
improvement in business environment and would
eventually lead to higher earnings. However, we always
believed that these are structural changes and will take its
own sweet time to bear the benefits. We have seen Nifty
going from 7000 levels to 9000 levels in less than a year
(Hope rally) and then coming down back to 7500 in recent
times (Realisation). With the valuations inching above 24x
PE and the earnings growth barely supporting the market
to sustain at such valuations. We believed then, that the
markets were more vulnerable to volatility and will even
underperform Liquid Funds in the next 6 to 9 months.
All this is a result of continued disappointment in
earnings resulting in to earnings downgrades that has
dented the hopes of the investors time and again. This has
also meant that investors and analysts now need to
realign their expectation and make it more rational as the
recovery is going to be a slow and a gradual one. Since last
year we have seen almost an average 30% downgrade in
the earnings estimate.
Having said that there are still many green shoots in the
economy which makes the outlook from a medium to long
term quite positive like improved fiscal discipline, lower
inflation and an improved CAD. The government has
conducted many small ticket reforms. The government’s
push on the financial inclusion front, creation of a social
security network, roll-out of direct benefit transfer and
overhauling the financial sector structure, have been seen
as critical steps in the overall reform progress which tend
to bear the fruits over time. A lighter election calendar for
the government would mean focus back on big ticket
reforms like the GST & Land bill which would help improve
the business sentiments and ease of doing business which
would also bring back private investment. Salary hikes as
a resultant of the seventh pay commission, increase in
savings as a result of lower oil prices & softer lending
rates, all could result in higher overall spending. Some of
it has already resulted in to the improved 2 & 4 wheeler
sales growth of 13% & 21% yoy respectively in October
hinting at demand revival in the economy.
December 2015 11
Alpha Edge | “End of Fear?”
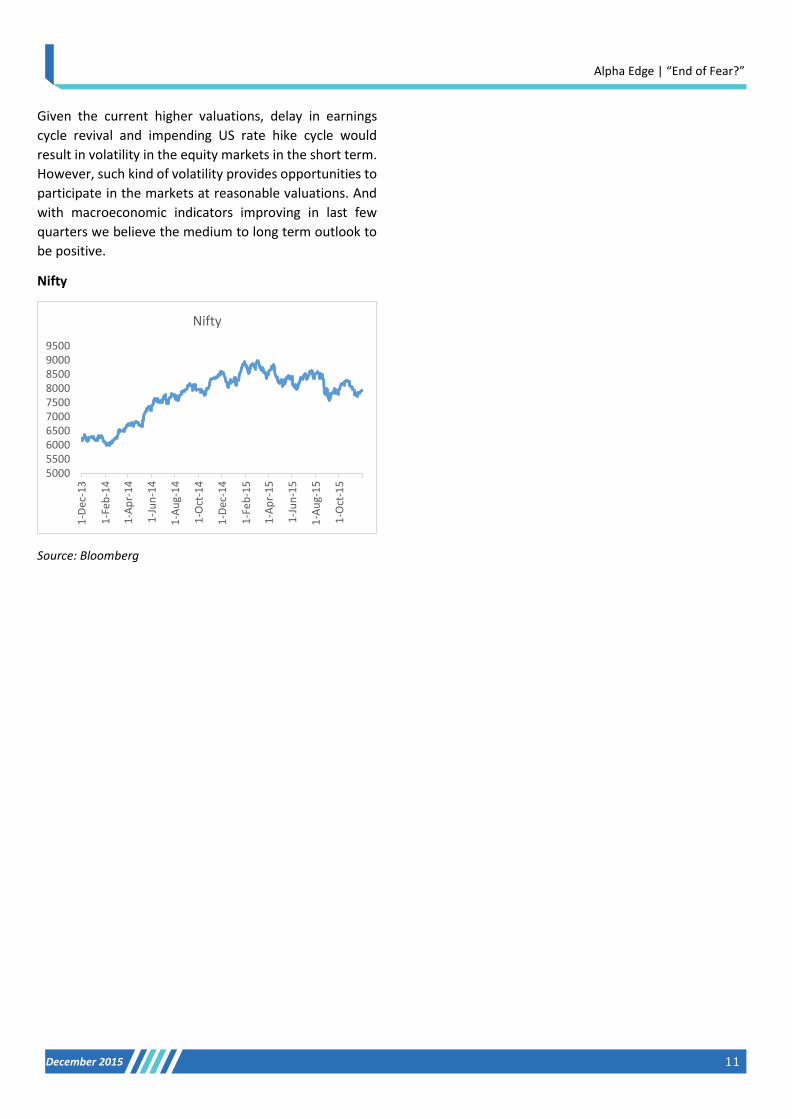
Given the current higher valuations, delay in earnings
cycle revival and impending US rate hike cycle would
result in volatility in the equity markets in the short term.
However, such kind of volatility provides opportunities to
participate in the markets at reasonable valuations. And
with macroeconomic indicators improving in last few
quarters we believe the medium to long term outlook to
be positive.
Nifty
Source: Bloomberg
5000550060006500700075008000850090009500
1-D
ec-1
3
1-F
eb
-14
1-A
pr-
14
1-J
un
-14
1-A
ug-
14
1-O
ct-1
4
1-D
ec-1
4
1-F
eb
-15
1-A
pr-
15
1-J
un
-15
1-A
ug-
15
1-O
ct-1
5
Nifty

December 2015 12
Alpha Edge | “End of Fear?”
Model Portfolio: Conservative
Conservative Market Cap wise (%)
Asset Class Sub-Asset Class Mutual Fund Schemes
Strategic
Tactical
Large cap Mid &
Small cap
Others
Equity - - PMS - - Large Cap - - ICICI Pru Focused BlueChip Eq Fund - - 90.0 2.4 7.6
UTI Opportunities Fund - - 78.2 17.6 4.2
Mirae Asset India Opportunities Fund - - 74.9 22.0 3.1
Mid & Small Cap - - MOSt Focused Midcap 30 Fund - - 7.1 88.0 4.9
HDFC Mid-Cap Opportunities Fund - - 29.9 64.6 5.6
BNP Paribas Mid Cap Fund - - 28.1 65.4 6.5
Multi Cap - - MOSt Focused Multicap 35 Fund - - 80.9 14.1 5.0
ICICI Pru Value Discovery Fund - - 58.3 34.2 7.5
Franklin India High Growth Cos Fund - - 57.5 25.9 16.6
Thematic / Sectoral Funds - - Equity Hybrid Funds - - Average
Maturity Years
Mod
Duration Years
YTM
(%)
Debt 90.0% 92.5% Short Term 30.0% 30.0% Axis Short Term Fund 10.0% 10.0% 2.7 2.0 8.0
Franklin India ST Income Plan 10.0% 10.0% 2.5 2.3 10.5
HDFC STP 10.0% 10.0% 2.2 1.8 9.8
Dynamic Bond Funds 30.0% 32.5% IDFC Dynamic Bond Fund-Reg 10.0% 10.8% 15.9 8.7 7.8
SBI Dynamic Bond 10.0% 10.8% 17.5 8.5 7.8
UTI Dynamic Bond Fund-Reg 10.0% 10.8% 14.8 7.2 8.1
Income Funds 30.0% 30.0% DWS Premier Bond Fund 10.0% 10.0% 1.8 1.5 8.0
HDFC Income Fund 10.0% 10.0% 16.4 8.1 8.0
UTI Bond Fund 10.0% 10.0% 16.3 7.9 8.2
Gilt - - Debt Hybrid Funds - -
Cash 5.0% 5.0% Liquid Funds - - Ultra Short Term 5.0% 5.0%
Gold 5.0% 2.5% Gold 5.0% 2.5% Total 100.0% 100.0%
0.0%
90.0%
5.0%5.0%
Strategic Portfolio
Equity Debt Cash Gold
0.0%
92.5%
5.0%2.5%
Tactical Portfolio
Equity Debt Cash Gold
95.00
100.00
105.00
110.00
Dec
-14
Jan
-15
Feb
-15
Mar
-15
Ap
r-1
5
May
-15
Jun
-15
Jul-
15
Au
g-1
5Se
p-1
5
Oct
-15
No
v-1
5
Conservative UCI Index

December 2015 13
Alpha Edge | “End of Fear?”
Model Portfolio: Moderately Conservative
Mod Conservative Market Cap wise (%)
Asset Class Sub-Asset Class Mutual Fund Schemes
Strategic
Tactical
Large cap Mid &
Small cap
Others
Equity 25.0% 25.0% PMS - - Large Cap 25.0% 25.0% ICICI Pru Focused BlueChip Eq Fund 10.0% 10.0% 90.0 2.4 7.6
UTI Opportunities Fund 10.0% 10.0% 78.2 17.6 4.2
Mirae Asset India Opportunities Fund 5.0% 5.0% 74.9 22.0 3.1
Mid & Small Cap - - MOSt Focused Midcap 30 Fund - - 7.1 88.0 4.9
HDFC Mid-Cap Opportunities Fund - - 29.9 64.6 5.6
BNP Paribas Mid Cap Fund - - 28.1 65.4 6.5
Multi Cap - - MOSt Focused Multicap 35 Fund - - 80.9 14.1 5.0
ICICI Pru Value Discovery Fund - - 58.3 34.2 7.5
Franklin India High Growth Cos Fund - - 57.5 25.9 16.6
Thematic / Sectoral Funds - - Equity Hybrid Funds - - Average
Maturity Years
Mod
Duration Years
YTM
(%)
Debt 65.0% 67.5% Short Term 30.0% 30.0% Axis Short Term Fund 10.0% 10.0% 2.7 2.0 8.0
Franklin India ST Income Plan 10.0% 10.0% 2.5 2.3 10.5
HDFC STP 10.0% 10.0% 2.2 1.8 9.8
Dynamic Bond Funds 30.0% 32.5% IDFC Dynamic Bond Fund-Reg 10.0% 10.8% 15.9 8.7 7.8
SBI Dynamic Bond 10.0% 10.8% 17.5 8.5 7.8
UTI Dynamic Bond Fund-Reg 10.0% 10.8% 14.8 7.2 8.1
Income Funds 5.0% 5.0% DWS Premier Bond Fund - - 1.8 1.5 8.0
HDFC Income Fund - - 16.4 8.1 8.0
UTI Bond Fund 5.0% 5.0% 16.3 7.9 8.2
Gilt - - Debt Hybrid Funds - -
Cash 5.0% 5.0% Liquid Funds - - Ultra Short Term 5.0% 5.0%
Gold 5.0% 2.5% Gold 5.0% 2.5% Total 100.0% 100.0%
25.0%
65.0%
5.0%5.0%
Strategic Portfolio
Equity Debt Cash Gold
25.0%
67.5%
5.0% 2.5%
Tactical Portfolio
Equity Debt Cash Gold
96.0098.00
100.00102.00104.00106.00108.00
Dec
-14
Jan
-15
Feb
-15
Mar
-15
Ap
r-1
5
May
-15
Jun
-15
Jul-
15
Au
g-1
5Se
p-1
5
Oct
-15
No
v-1
5
Mod Conservative UCI Index

December 2015 14
Alpha Edge | “End of Fear?”
Model Portfolio: Balanced
Balanced Market Cap wise (%)
Asset Class Sub-Asset Class Mutual Fund Schemes
Strategic
Tactical
Large cap Mid & Small cap
Others
Equity 45.0% 45.0% PMS - - Large Cap 30.0% 30.0% ICICI Pru Focused BlueChip Eq Fund 10.0% 10.0% 90.0 2.4 7.6
UTI Opportunities Fund 10.0% 10.0% 78.2 17.6 4.2
Mirae Asset India Opportunities Fund 10.0% 10.0% 74.9 22.0 3.1
Mid & Small Cap 15.0% 10.0% MOSt Focused Midcap 30 Fund 7.5% 5.0% 7.1 88.0 4.9
HDFC Mid-Cap Opportunities Fund - - 29.9 64.6 5.6
BNP Paribas Mid Cap Fund 7.5% 5.0% 28.1 65.4 6.5
Multi Cap - - MOSt Focused Multicap 35 Fund - - 80.9 14.1 5.0
ICICI Pru Value Discovery Fund - - 58.3 34.2 7.5
Franklin India High Growth Cos Fund - - 57.5 25.9 16.6
Thematic / Sectoral Funds - - Equity Hybrid Funds - 5.0% Edelweiss Absolute Return Fund 5.0%
%
Average Maturity Years
Mod Duration Years
YTM (%)
Debt 45.0% 50.0% Short Term 30.0% 30.0% Axis Short Term Fund 10.0% 10.0% 2.7 2.0 8.0
Franklin India ST Income Plan 10.0% 10.0% 2.5 2.3 10.5
HDFC STP 10.0% 10.0% 2.2 1.8 9.8
Dynamic Bond Funds 15.0% 20.0% IDFC Dynamic Bond Fund-Reg 7.5% 10.0% 15.9 8.7 7.8
SBI Dynamic Bond - - 17.5 8.5 7.8
UTI Dynamic Bond Fund-Reg 7.5% 10.0% 14.8 7.2 8.1
Income Funds - - DWS Premier Bond Fund - - 1.8 1.5 8.0
HDFC Income Fund - - 16.4 8.1 8.0
UTI Bond Fund - - 16.3 7.9 8.2
Gilt - - Debt Hybrid Funds - - DSPBR Dynamic Asset Allocation Fund - - - - -
Cash - - Liquid Funds - - Ultra Short Term - -
Gold 10.0% 5.0% Gold 100.0% 100.0%
45.0%
45.0%
0.0%
10.0%
Strategic Portfolio
Equity Debt Cash Gold
45.0%50.0%
0.0%
5.0%
Tactical Portfolio
Equity Debt Cash Gold
94.00
96.00
98.00
100.00
102.00
104.00
106.00
Dec
-14
Jan
-15
Feb
-15
Mar
-15
Ap
r-1
5
May
-15
Jun
-15
Jul-
15
Au
g-1
5Se
p-1
5
Oct
-15
No
v-1
5
Balanced UCI Index

December 2015 15
Alpha Edge | “End of Fear?”
Model Portfolio: Moderately Aggressive
Mod Aggressive Market Cap wise (%)
Asset Class Sub-Asset Class Mutual Fund Schemes
Strategic
Tactical
Large cap Mid & Small cap
Others
Equity 70.0% 70.0% PMS - - Large Cap 30.0% 30.0% ICICI Pru Focused BlueChip Eq Fund 10.0% 10.0% 90.0 2.4 7.6
UTI Opportunities Fund 10.0% 10.0% 78.2 17.6 4.2
Mirae Asset India Opportunities Fund 10.0% 10.0% 74.9 22.0 3.1
Mid & Small Cap 30.0% 18.0% MOSt Focused Midcap 30 Fund 10.0% 6.0% 7.1 88.0 4.9
HDFC Mid-Cap Opportunities Fund 10.0% 6.0% 29.9 64.6 5.6
BNP Paribas Mid Cap Fund 10.0% 6.0% 28.1 65.4 6.5
Multi Cap 10.0% 10.0% MOSt Focused Multicap 35 Fund 10.0% 10.0% 80.9 14.1 5.0
ICICI Pru Value Discovery Fund - - 58.3 34.2 7.5
Franklin India High Growth Cos Fund - - 57.5 25.9 16.6
Thematic / Sectoral Funds - - Equity Hybrid Funds - 12.0% Edelweiss Absolute Return Fund 12.0% Average
Maturity Years
Mod
Duration Years
YTM
(%) Debt 20.0% 25.0%
Short Term 20.0% 20.0% Axis Short Term Fund 10.0% 10.0% 2.7 2.0 8.0
Franklin India ST Income Plan 10.0% 10.0% 2.5 2.3 10.5
HDFC STP - - 2.2 1.8 9.8
Dynamic Bond Funds - 5.0% IDFC Dynamic Bond Fund-Reg - 5.0% 15.9 8.7 7.8
SBI Dynamic Bond - - 17.5 8.5 7.8
UTI Dynamic Bond Fund-Reg - - 14.8 7.2 8.1
Income Funds - - DWS Premier Bond Fund - - 1.8 1.5 8.0
HDFC Income Fund - - 16.4 8.1 8.0
UTI Bond Fund - - 16.3 7.9 8.2
Gilt - - Debt Hybrid Funds - - DSPBR Dynamic Asset Allocation Fund - - - - -
Cash - -
Liquid Funds - - Ultra Short Term - -
Gold 10.0% 5.0%
Gold 10.0% 5.0% Total 100.0% 100.0%
70.0%
20.0%
0.0%10.0%
Strategic Portfolio
Equity Debt Cash Gold
70.0%
25.0%
0.0%5.0%
Tactical Portfolio
Equity Debt Cash Gold
85.090.095.0
100.0105.0110.0
Dec
-14
Jan
-15
Feb
-15
Mar
-15
Ap
r-1
5
May
-15
Jun
-15
Jul-
15
Au
g-1
5Se
p-1
5
Oct
-15
No
v-1
5
Mod Aggressive UCI Index

December 2015 16
Alpha Edge | “End of Fear?”
Model Portfolio: Aggressive
Aggressive Market Cap wise (%)
Asset Class Sub-Asset Class Mutual Fund Schemes
Strategic
Tactical
Large cap Mid & Small cap
Others
Equity 90.0% 90.0% PMS - - Large Cap 30.0% 30.0% ICICI Pru Focused BlueChip Eq Fund 10.0% 10.0% 90.0 2.4 7.6
UTI Opportunities Fund 10.0% 10.0% 78.2 17.6 4.2
Mirae Asset India Opportunities Fund 10.0% 10.0% 74.9 22.0 3.1
Mid & Small Cap 30.0% 20.0% MOSt Focused Midcap 30 Fund 10.0% 6.6% 7.1 88.0 4.9
HDFC Mid-Cap Opportunities Fund 10.0% 6.6% 29.9 64.6 5.6
BNP Paribas Mid Cap Fund 10.0% 6.6% 28.1 65.4 6.5
Multi Cap 30.0% 30.0% MOSt Focused Multicap 35 Fund 10.0% 10.0% 80.9 14.1 5.0
ICICI Pru Value Discovery Fund 10.0% 10.0% 58.3 34.2 7.5
Franklin India High Growth Cos Fund 10.0% 10.0% 57.5 25.9 16.6
Thematic / Sectoral Funds - - Equity Hybrid Funds - 10.0% Edelweiss Absolute Return Fund 10.0% Average
Maturity Years
Mod
Duration Years
YTM
(%)
Debt - 5.0% Short Term - - Axis Short Term Fund - - 2.7 2.0 8.0
Franklin India ST Income Plan - - 2.5 2.3 10.5
HDFC STP - - 2.2 1.8 9.8
Dynamic Bond Funds - 5.0% IDFC Dynamic Bond Fund-Reg - 5.0% 15.9 8.7 7.8
SBI Dynamic Bond - - 17.5 8.5 7.8
UTI Dynamic Bond Fund-Reg - - 14.8 7.2 8.1
Income Funds - - DWS Premier Bond Fund - - 1.8 1.5 8.0
HDFC Income Fund - - 16.4 8.1 8.0
UTI Bond Fund - - 16.3 7.9 8.2
Gilt - - Debt Hybrid Funds - - DSPBR Dynamic Asset Allocation Fund - - - - -
Cash - - Liquid Funds - - Ultra Short Term - -
Gold 10.0% 5.0% Gold 10.0% 5.0% Total 100.0% 100.0%
90.0%
0.0%0.0%10.0%
Strategic Portfolio
Equity Debt Cash Gold
90.0%
5.0%
0.0% 5.0%Tactical Portfolio
Equity Debt Cash Gold
90.0
95.0
100.0
105.0
110.0
Dec
-14
Jan
-15
Feb
-15
Mar
-15
Ap
r-1
5
May
-15
Jun
-15
Jul-
15
Au
g-1
5
Sep
-15
Oct
-15
No
v-1
5
Aggressive Nifty

December 2015 17
Alpha Edge | “End of Fear?”
Citadelle Growth Opportunities Portfolio Company Name
% Allocation
Recommended Price
Market price
% Incr/Decr
Rationale Result Update
Axis Bank Ltd. 5% 502.05
495.55 -1%
Axis Bank is geared up to ride the next growth cycle with strong capitalization (12.6% Tier I), healthy ROA (1.7%) and expanding liability franchise (2,505 branches). Leveraging on the strong distribution network AXSB increased the share of retail deposits and CASA increased to 79% as compared 59% in FY11. It has delivered stable numbers with improving margins though economy was at a recovery mode. We remain confident of bank’s ability of strengthening its retail franchise further.
Axis Bank’s 2QFY16 operational performance was healthy, its core operating profit grew 19.7% yoy, driven by healthy advances growth (23.1% yoy) and better productivity. Retail loans, at 26.6% yoy, continued to drive advances growth, with slower contribution from SME loans (9.2% yoy). Fee income grew 14% yoy. Productivity improved sharply, with core cost-income falling 271bps yoy to 41.7%.
Bharat Forge Ltd.
5% 942.30 907.20 -4%
It is global leader in forging business having transcontinental presence across India, Germany and Sweden, serving several sectors including automotive, power, oil and gas, etc. CV business will benefit from pre-buying in US before emission norm changes and strong cyclical recovery in India. This coupled with scale-up in PVs would drive strong growth in Auto segment.
BFL’s Net Sales were down 1.9% YoY (-1% QoQ) to INR11.1b (v/s est. INR12.7b). Domestic revenue grew 11% YoY (+3.6% QoQ) whereas export revenue declined 8.5% YoY (-4.4% QoQ). Gross margin improved ~350bp YoY (-120bp QoQ) to ~63.5%. Adj. PAT at INR1.75b was down 1% YoY (-10% QoQ). 3QFY16 expected to be better than 2QFY16.
Britannia Industries Ltd.
5% 2548.90 3082.90 21%
Britannia is the market leader in the biscuits
category. Biscuits contribute over 85% of
Company’s consolidated revenue. Over the
years, the company has forayed into other
bakery items and dairy products (constituting
~15% of consolidated revenues). The company
enjoys strong brand equity and has been
consistently ranked amongst the top food brand
in India.
Britannia reported ~13% yoy growth in its 1QFY16 revenue with strong operational performance, aided by robust gross margin expansion (a function of mix improvement as well as benign raw material prices).
Dewan Housing Fin Corpn Ltd.
5% 395.15 220.05 11%
Dewan Housing is a good play on Tier 2 and Tier 3 cities housing demand growth. Strong visibility on business growth and margins, superior asset quality, healthy provision cover and healthy return ratios augurs well for Dewan Housing.
DHFL’s 2QFY16 PAT grew 18% YoY to INR1.8b. Healthy AUM growth of +27% YoY (4.7% QoQ), margin improvement of 11bp YoY to 2.9% and stable asset quality were the key highlights of the quarter.
Eicher Motors Ltd.
5% 15103.50 17791.2 18%
Eicher Motors is a leader in Cruise bikes in India and No.2 player in Medium Commercial Vehicles. The management has increased its production target to 280,000 units in CY2014 (from 250,000 units) and is expected that demand can reach 500,000 units in 3-4 years. Eicher Motors will invest Rs. 6 bn over the next two years in the Royal Enfield business to expand capacity in the Oragdum plant.
Eicher Motors (EIM) reported in-line results in Q3CY15 with net profit of Rs2.55 bn (up 54.8% YoY) as compared to our estimate of Rs2.56 bn. Consol. EBITDA margin expanded 236bps YoY to 15.8%, driven by all expense items. Marginally below operating performance at VECV was more than compensated by strong performance in Royal Enfield (RE) business which reported its highest ever EBITDA margin of 27.7% on the back of 56% YoY growth volume.
Company Name
% Allocation
Recommended Price
Market price
% Incr/Decr
Rationale Result Update
Company Name
% Allocation
Recommended Price
Market price
% Incr/Decr
Rationale Result Update

December 2015 18
Alpha Edge | “End of Fear?”
Company Name
% Allocation
Recommended Price
Market price
% Incr/Decr
Rationale Result Update
Gujarat Pipavav
Port Ltd. 5% 206.50 185.00 -10%
GPPV is favorably positioned on the West coast which enables access to the global trade route/rich northern hinterland. Strong parentage and robust evacuation further provides comfort. GPPV is expanding its container handling facility from 0.8m TEUs to 1.35m TEUs, which would be key driver of volume growth. In addition, higher throughput of liquid volume (2m tons capacity) would aid volume growth.
Gujarat Pipavav Port’s (GPPL) Imperative for GPPV (and peers) to fill new capacities in a weak market can impact pricing EBITDA margin is the key (though possibly transient) upside risk GPPL reported 2QFY16 revenue of INR1.5b, down 12% YoY and lower than estimate of INR1.8b—driven by lower core port revenue and operating income. Port revenues were impacted by volume slump in container and bulk cargo due to force majeure, slowdown and shift of shipping lines. EBIDTA for the quarter stood at INR764m, down 20% YoY
HDFC Bank Ltd. 5% 952.00 1068.90 12%
HDFC Bank is best-placed in the current environment, with a CASA ratio of ~45%, growth outlook of at least 1.3x of industry and least asset quality risk.
HDFC Bank 1 2QFY16 PAT grew 20% YoY (in line) to INR28.7b. Strong retail loan growth (10% QoQ, 29% YoY), healthy fee income growth of 22% YoY, robust SA growth of 19% YoY and continued branch expansion (+125 QoQ, +625 YoY to 4,227) were the key highlights of the quarter.
Ashok Leyland Ltd.
5% 71.45 92.20 29%
Ashok Leyland is the flagship company of Hinduja Group. It is the 2nd largest MHCV with ~26% market share and the largest Bus manufacturer in India. To expand its product offerings, AL has entered into 50:50 JV with Nissan for LCVs and John Deere for construction equipment.
Net sales grew 54% YoY (-29% QoQ) to INR49.4b (v/s est. INR51.6b), led by volume growth of 47% YoY (32.4% QoQ) and realization growth of ~4.3% YoY (-3% QoQ) to INR1,323k unit on account of mix change (lower defense sales). EBTIDA margin of 12% (up 470bp YoY and 190bp QoQ; est. of 12.4%). Margin was lower than our estimate due to negative operating leverage (despite RM cost savings).
IndusInd Bank Ltd.
5% 802.55 942.25 17%
IndusInd Bank Ltd is one of the new generation private sector banks in India. Asset quality performance remains healthy, despite a challenging environment and significant slowdown in the CV segment. The management expects that the worst for CV financing is behind and gradual improvement is likely to be seen in coming quarters We believe that IndusInd Bank has the potential to grow faster than the industry and strengthen its market share as it expands its network.
Indusind Bank’s 2QFY16 PAT was up 30% YoY and a 3% miss on our estimates, led by higher than- expected provisions (62bp credit costs v/s 52bp in 1Q); core PPoP (up 33% YoY) was 3% ahead of estimates, driven by strong core revenue growth (28% YoY).

December 2015 19
Alpha Edge | “End of Fear?”
Company Name % Allocation
Recommended Price
Market price
% Incr/Decr
Rationale Result Update
Kotak Mahindra Bank Ltd. 5% 631.58 648.85 3%
Kotak Mah. Bank is one of the fastest growing bank. Merger with ING Vysya Bank will be BV accretive for Kotak Mah. Bank at standalone and consolidated level. Merger places Kotak Bank in a sweet spot for the next growth cycle with strong presence across geographies, expertise in key product lines and continued healthy capitalization.
Kotak Mahindra Bank’s PAT (for one off integration cost) grew by ~5% QoQ to INR10.9b led by strong loan growth (+8% QoQ), improved margins (+12bp QoQ) and strong control over costs. Integration with ING Vyasa Bank Limited is well on track with the traction seen in SB deposits growth, favorable response to new product launches in ING Vysya branches and no fresh negative surprise on asset quality.
Larsen & Toubro Ltd. 5% 1496.5 1466.7 -2%
L&T is well placed to capitalize on long-term infrastructure demand. L&T's order inflow prospects is expected to double from last year's level, to US$75bn. L&T’s preparedness to exploit the evolving India defence opportunity. The stock's underperformance vs. the BSE Sensex.
2QFY16 performance—a mixed bag: Consolidated results were in line at the operating level but missed estimates at the PAT level. Even while meeting expectations at the operating level, margin expansion in the services business (IT&TS, Developmental projects, Finance) offset the decline in the E&C segment (7.4%,-170bp). Standalone performance was below estimates, with EBIDTA down 25% YoY to INR10b (43% below estimates).
Lupin Ltd. 5% 1427.55 2033.35 42%
Lupin is amongst the larger pharma companies that is actively targeting the regulated generics markets. Strategy of focusing on niche, low-competition products for the US market likely to benefit in the long run. US generics is expected to grow 20-22% due to a rich generic pipeline.
Lupin 2Q PAT at INR4.1b (-35% YoY) was 28% below our estimates on EBITDA (excluding other operating income) miss of 36%. Lower US sales, higher R&D cost and M&A-related expenses led to a substantial dip in EBITDA margin (17% in 2QFY16). Affected by decline in the US, overall revenue grew only 2% YoY to INR31.7b (5% miss). However, the company has guided for successful rebound in 2HFY16—led by significant launches in the US, price hike in Fortamet and addition of Gavis sales.
Maruti Suzuki India Ltd. 5% 3328.3 4689.3 41%
Maruti is the best auto OEM play on macro-economic recovery in India. Following flat volumes for the past four years, we expect car sales to bounce back, led by high pent-up demand, economic recovery, and deceleration in car ownership costs. Maruti’s strong product pipeline, coupled with lower competitive intensity, should help it consolidate its leadership.
MSIL’s 2QFY16 EBITDA margin was ~16.3% (second consecutive quarter of highest EBITDA margin since 1QFY08, despite increase in discounts), driven by favorable mix and commodity prices. We see upside risk to our margin estimates and scope of further re-rating, driven by a) improved competitive positioning compared with the previous cycle, (b) lower capital intensity, (c) improvement in RoIC to ~57% by FY17 (v/s average of ~30% in the last 10 years) and (d) increase in dividend payout.

December 2015 20
Alpha Edge | “End of Fear?”
Company Name
% Allocation
Recommended Price
Market price
% Incr/Decr
Rationale Result Update
Thermax Ltd. 5% 1067.65
852.00 -20%
Thermax is benefiting from few structural trends: (1) energy shortages and inconsistent availability of power, driving demand for energy efficiency products, (2) hunt for alternative energy, given demanding regulations and improving viability, (3) increased environmental concerns and stringent regulatory intervention, (4) currency depreciation leading to increased possibilities of exports etc. Thermax is likely to report acceleration in revenue growth, driven by improvement in GFCF particularly in base industries) and interplay of several structural trends.
Thermax reported lower-than-expected operating performance for 2QFY16. Revenue declined 11% YoY to INR10.6bn, EBITDA margin declined 90bp YoY to 9.4% and net profit declined 25% YoY to INR648m. Consolidated revenue declined 5% YoY to INR12.9b and net profit declined 11% YoY to INR670m.
PVR Ltd. 5% 703.10 815.45 16%
India’s largest and fastest growing multiplex chain with 23-25% bollywood market share and 33-35% Hollywood market share. Movie screening is an under-penetrated business in India and we believe PVR will be the biggest beneficiary of revival in discretionary spends.
PVR reported overall revenue of INR4.7b as against INR4b in 2QFY15, marking an 18.6% YoY growth. EBITDA grew 54% YoY, with margin expanding 440bp YoY—from 14.7% in 2QFY15 to 19.1% in 2QFY16. Other income stood at INR95m (largely non-recurring in nature) as against INR6m in 2QFY15, driving PAT higher. Consequently, PAT grew from INR92m in 2QFY15 to INR411m in 1QFY16.
Shree Cement Ltd.
5% 9412.10 11777.3 25%
Shree Cement is one of the most cost efficient cement producers in India. Shree Cement is the largest single-location integrated cement plant in North India, with an installed capacity of 13m ton.
Shree Cement’s Sep-Quarter revenue stood at INR17.2b (+7% YoY) comprising in line cement revenue of INR15.2b (+8% YoY) and higher power revenue of INR2b. Cement volume grew by 8% YoY to 4.19mt (est 4.25mt), while realizations uptick was at +4.9% QoQ. Merchant power volume was 539m units (+10.5% YoY, -6% QoQ, est 487m units), while realizations were marginally better at INR3.66/unit (flat QoQ).
Tech Mahindra Ltd.
5% 647.89 558.05 -14%
Satyam's acquisition will help Tech Mahindra to diversify its client base and industry focus. Large deals like those of KPN and a gradual revival in the telecom vertical will help volume growth. Deals have kept growth coming (outside the BT account) despite challenged IT budgets in the telecom vertical.
Tech Mahindra demonstrated some reprieve after two quarters of slackened organic revenue growth and EBITDA margin, which expanded 170bp QoQ to 16.6%. Both the numbers were in line with consensus estimates. While telecom will benefit from seasonality in 2H, deal signings within the segment and (consequently) visibility of above-industry overall revenue growth remain muted for now
Ultratech
Cement Ltd.
5% 2671.25 2679.80 0%
Ultratech is the largest cement company with pan-India presence. It has potential to increase its output without incurring major capex by increasing utilization and blending, along with locational advantage, gives it the flexibility to either export or sell in the domestic market. Significant potential to increase output by increasing blending. Allied businesses of white cement and RMC lend stability to overall performance.
UltraTech’s 2QFY16 grey cement volume grew 4.3% YoY (-11% QoQ) to 10.8mt, while realizations grew ~2.4% QoQ/flat YoY. Operations mostly outgrew industry demand by 2-5pp in each region, with east posting the healthiest momentum. Revenue grew 4.5% YoY (-7% QoQ) to INR56.2b., comprising (a) cement
revenue at INR46.7b (+4.5% YoY), (b) RMC revenue of INR5b (+5% YoY), and (c) white cement revenue at INR5b (+14% YoY, volume growth of 6.6% YoY)

December 2015 21
Alpha Edge | “End of Fear?”
Company Name
% Allocation
Recommended Price
Market price
% Incr/Decr
Rationale Result Update
TVS Motor Company Ltd.
5% 268.30 230.20 -14%
TVS is well positioned to benefit from the scooterization wave with its complete scooter portfolio. With international presence in more than 50 countries in Asia, Africa and Latin America it plans to launch multiple products across segments to reinforce and fill gaps in portfolio in next 2 years.
TVS Motor’s Net sales grew 7.4% YoY (+10% QoQ) to INR28.8b (in line with est.), driven by realizations—up ~7% YoY and 3.3% QoQ to ~INR42,431; volumes were flat YoY (+6.4% QoQ). EBITDA at ~INR2.2b (v/s est. ~INR1.8b) grew 30% YoY/QoQ. EBITDA margin at 7.4%, up 130bp YoY (+120bp QoQ, v/s est. 6.5%), was driven by lower commodity cost. Adj. PAT grew ~23% YoY (+29% QoQ) to ~INR1.2b.
VA Tech Wabag Ltd.
5% 737.40 667.85 -9%
VA Tech Wabag (VATW) is one of the leading players in water treatment industry, is attempting to expand into new geographies, including South East Asia, Sub-Sahara Africa, LatAm, Central Asia, etc. In FY14, the company received initial orders in Nepal, Tanzania, etc which also opens up interesting growth possibilities to ramp-up the business. Order intake in overseas subsidiaries has increased from INR6-7b in FY12-13 to INR16.4b in FY14
Va tech Wabag reported revenues of Rs 3.2bn ( up 39% YoY), EBIDTA of Rs 375m (150 bps margin improvement) and PAT of Rs 239m (up 105%). Tght control
90%
10%
Citadelle Growth Opportunities Portfolio Current Asset Allocation
Equity Cash
109.24
95.81
9095
100105110115120
Dec
-14
Jan
-15
Feb
-15
Mar
-15
Ap
r-1
5
May
-15
Jun
-15
Jul-
15
Au
g-1
5
Sep
-15
Oct
-15
No
v-1
5
Citadelle Growth Opportunities Portfolio Performance
Citadelle Growth Opportunities Portfolio NAVNifty Index

Alpha Edge | “End of Fear” .
Thank you for your time!
Safe harbor statement!
This document has been prepared by Citadelle Asset Advisors Private Limited (CAAPL). CAAPL, its holding company and associate companies offer full range of, integrated investment banking, portfolio management and brokerage services, through own and or partnerships.
Our research analysts and sales persons provide important input into our investment advisory activities. This document does not constitute an offer or solicitation for the purchase or sale of any financial instrument or as an official confirmation of any transaction. The information contained herein is from publicly available data or other sources believed to be reliable, but we do not represent that it is accurate or complete and it should not be relied on as such. CAAPL or any of its affiliates/ group companies shall not be in any way responsible for any loss or damage that may arise to any person from any inadvertent error in the information contained in this report. This document is provided for assistance only and is not intended to be and must not alone be taken as the basis for an investment decision.
The user assumes the entire risk of any use made of this information. Each recipient of this document should make such investigation as it deems necessary to arrive at an independent evaluation of an investment in the securities of companies referred to in this document (including the merits and risks involved), and should consult his own advisors to determine the merits and risks of such investment. The investment discussed or views expressed may not be suitable for all investors. We and our affiliates, group companies, officers, directors, and employees may: (a) from time to time, have long or short positions in, and buy or sell the securities thereof, of company (is) mentioned herein or (b) be engaged in any other transaction involving such securities and earn brokerage or other compensation or act as advisor or lender/borrower to such company (ies) or have other potential conflict of interest with respect to any recommendation and related information and opinions. This information is strictly confidential and is being furnished to you solely for your information.
This information should not be reproduced or redistributed or passed on directly or indirectly in any form to any other person or published, copied, in whole or in part, for any purpose. This report is not directed or intended for distribution to, or use by, any person or entity who is a citizen or resident of or located in any locality, state, country or other jurisdiction, where such distribution, publication, availability or use would be contrary to law, regulation or which would subject CAAPL and affiliates/ group companies to any registration or licensing requirements within such jurisdiction.
The distribution of this document in certain jurisdictions may be restricted by law, and persons in whose possession this document comes, should inform themselves about and observe, any such restrictions. The information given in this document is as of the date of this report and there can be no assurance that future results or events will be consistent with this information. This information is subject to change without any prior notice. CAAPL reserves the right to make modifications and alterations to this statement as may be required from time to time. However, CAAPL is under no obligation to update or keep the information current. Nevertheless, CAAPL is committed to providing independent and transparent recommendation to its client and would be happy to provide any information in response to specific client queries. Neither CAAPL nor any of its affiliates, group companies, directors, employees, agents or representatives shall be liable for any damages whether direct, indirect, special or consequential including lost revenue or lost profits that may arise from or in connection with the use of the information. Past performance is not necessarily a guide to future performance.
The disclosures of interest statements incorporated in this document are provided solely to enhance the transparency and should not be treated as endorsement of the views expressed in the report. CAAPL generally prohibits its analysts, persons reporting to analysts and their family members from maintaining a financial interest in the securities or derivatives of any companies that the analysts cover.
The analyst for this report certifies that all of the views expressed in this report accurately reflect his or her personal views about the subject company or companies and its or their securities, and no part of his or her compensation was, is or will be, directly or indirectly related to specific recommendations or views expressed in this report. Any dispute arising out of the document shall be subject to the exclusive jurisdiction of the Courts in Mumbai, India
December 2015 22