ALGN Q4 and Full Year Financial Slides 012918 645pm
38
© 2019 ALIGN TECHNOLOGY, INC 1 Financial Results Q4 and Year End 2018 Align Technology, Inc.
Transcript of ALGN Q4 and Full Year Financial Slides 012918 645pm
ALIGN TECHNOLOGY, INC 1© 2019 ALIGN TECHNOLOGY, INC 1
Financial ResultsQ4 and Year End 2018Align Technology, Inc.
ALIGN TECHNOLOGY, INC 2
Conference Call Contacts
• Speakers:- Joe Hogan, President and CEO
- John Morici, CFO
- Shirley Stacy, VP, Corporate Communications & Investor Relations
• Replay and Webcast Archive:- Telephone replay will be available through 5:30pm ET
February 12, 2019
- Domestic callers: 877-660-6853
- International callers: 201-612-7415
- Conference # 13685779
- Audio web cast archive will be available at http://investor.aligntech.com for 12 months
Align Technology, Inc. – Q4 and year end 2018 financial results
• Website: http://investor.aligntech.com/• Email: [email protected]• Tel: (408) 470-1000 • Corporate and Investor Communications:
- Shirley Stacy, [email protected]
- Madelyn Homick, [email protected]

ALIGN TECHNOLOGY, INC 3
Safe harbor and forward looking statement
• This presentation, including the tables below, contains forward-looking statements, including statements regarding certain business metrics for the first quarter and year ending 2019, including, but not limited to, anticipated net revenues, gross margin, operating expenses, operating profit, diluted earnings per share, tax rate, case shipments, scanner sales and our expectation that our earnings power in the second half of the year to be stronger than the first half. Forward-looking statements contained in these slides relating to expectations about future events or results are based upon information available to Align as of the date hereof. Readers are cautioned that these forward-looking statements are only predictions and are subject to risks, uncertainties and assumptions that are difficult to predict. As a result, actual results may differ materially and adversely from those expressed in any forward-looking statement. Factors that might cause such a difference include, but are not limited to, difficulties predicting customer and consumer purchasing behavior, Align's ability to protect its intellectual property rights, continued compliance with regulatory requirements, competition from existing and new competitors, the willingness and ability of our customers to maintain and/or increase product utilization in sufficient numbers, the possibility that the development and release of new products does not proceed in accordance with the anticipated timeline, the possibility that the market for the sale of these new products may not develop as expected, or that the expected benefits of new or existing business relationships will not be achieved as anticipated, risks relating to international sales, which are increasingly a larger portion of our total revenues, the risks relating to Align's ability to sustain or increase profitability or revenue growth in future periods while controlling expenses, growth related risks, including excess or constrained capacity at our manufacturing and treat operations facilities and pressure on our internal systems and personnel, the security of customer and/or patient data is compromised for any reason, continued customer demand for our existing and new products, changes in consumer spending habits as a result of, among other things, prevailing economic conditions, levels of employment, salaries and wages and consumer confidence, the timing of case submissions from our doctors within a quarter as well as increased manufacturing costs per case, acceptance of our products by consumers and dental professionals, changes to our interpretation of the U.S. Tax Cuts and Jobs Act which may change as we receive additional clarification and implementation guidance, possibly materially, foreign operational, political and other risks relating to Align's international manufacturing operations, litigation risks, uncertainties involved in any contract dispute resolution and the possibility of Align choosing to settle the litigation for business or other reasons. Align's ability to develop and successfully introduce new products and product enhancements and the loss of key personnel. These and other risks are detailed from time to time in Align's periodic reports filed with the Securities and Exchange Commission, including, but not limited to, its Annual Report on Form 10-K for the year ended December 31, 2017, which was filed with the Securities and Exchange Commission (SEC) on February 28, 2018. Align undertakes no obligation to revise or update publicly any forward-looking statements for any reason.

ALIGN TECHNOLOGY, INC 4
• Our fourth quarter was a strong finish to a great year. Q4 revenues were better than expected reflecting higher Invisalign ASPs and volume growth of 31% year over year, as well as another record quarter for our iTero scanners with revenue up 55% year over year. Q4 sequential growth was driven by a strong quarter for EMEA with record growth from teens, as well as continued traction with Invisalign Lite and iGo. Q4 operating margin of 22.6% reflects higher doctor training and manufacturing costs, as well as higher legal fees than anticipated, partially offset by a sequential improvement in Invisalign ASPs. For the quarter, we trained a record 5,270 new doctors in Q4, which includes about 3,000 international doctors – of which half were in EMEA and half in APAC.
• For the year, we achieved record revenues of nearly $2 billion and had over 1.2 million people start treatment with Invisalign clear aligners the first time - resulting in our 6th millionth Invisalign patient, a teenager from China. These results reflect record revenues and volumes for both Invisalign and iTero, across customer channels and country markets, and continued strength from teens which grew 40%. The total number of teenagers treated with Invisalign this year was over 333 thousand representing 27% of our volume. Finally, in 2018, we trained a record number of new Invisalign doctors - nearly 20 thousand worldwide, and for the first time - more than half of them were international doctors.
• Now, let’s turn to the specifics around our fourth quarter results, starting with the Americas region.
Q4 and year end 2018 financial highlights
Q4’18 QoQ YoY 2018 YoY
Total Net Revenues $534.0M 5.7% 26.7% $2.0B 33.5%
- Clear Aligner* $445.6M 4.3% 22.4% $1.7B 29.2%
- Scanner & Services $88.4M 13.0% 54.8% $275.0M 67.5%
Invisalign Case Shipments 333.8K 4.5% 30.9% 1.2M 31.9%
EPS, diluted $1.20 $(0.04) $1.07 $4.92 $2.09
Invisalign Shipment figures do not include SmileDirectClub aligners *Clear aligner revenue includes revenues from Invisalign clear aligners and SmileDirectClub aligners

ALIGN TECHNOLOGY, INC 5
2018 Invisalign shipments and strong growth trend
4.6% 4.0%
18.2% 18.6% 17.5% 16.2%13.2%
22.0% 21.5%
31.4% 31.9%
-0.4% -0.6%
15.2%
19.7%
16.0%13.4%
7.9%
17.7% 17.6%
25.1% 24.2%
35.1%
25.3%
29.3%
15.1%
22.7% 25.0%
28.5%32.5%
29.7%
43.8% 45.0%
-10.0%
0.0%
10.0%
20.0%
30.0%
40.0%
50.0%
0
200,000
400,000
600,000
800,000
1,000,000
1,200,000
1,400,000
2008 2009 2010 2011 2012 2013 2014 2015 2016 2017 2018
Worldwide Shipments WW Growth Americas Growth International Growth
Invisalign shipments do not include SmileDirectClub aligners.Effective Q1'18, Americas region includes North America and LATAM. We have recasted historical data to reflect the change.

ALIGN TECHNOLOGY, INC 6
Global strategic priorities
2018 results reflect continued progress and execution of our strategic priorities
````
InternationalExpansion
OrthodontistUtilization
GP DentistTreat & Refer
Patient Demand& Conversion01 02 03 04

ALIGN TECHNOLOGY, INC 7
Q4 2018 financial highlightsAmericas• For Americas Orthodontists, Q4 Invisalign case volume was slightly lower
than our Q4 outlook primarily due to longer cycle times in Latin America and was down 2.9% sequentially and up 24.7% year-over-year.
• For Americas GP Dentists, Invisalign case volume was up 3.2% sequentially and up 17.3% year-over-year. For International doctors, Invisalign case volume was up 12.2% sequentially and up 45.3% year-over-year.
• On a sequential basis, Q4 results reflect growth from Americas GPs offset by Americas Orthos – particularly high-volume doctors. Year over year growth for Q4 reflects continued adoption of Invisalign treatment from both Orthodontist and GP channels which were up 24.7% and 17.3%, respectively. We also saw good growth from our major DSO partners -across both GPs and Orthos - up nearly 50% year over year.
• For the full year, Invisalign volume for the Americas region was up 24.2% compared to 2017. Americas Orthos were up 27.2% and Americas GP Dentists up 19.8% - the second highest annual growth rate for Orthos and the highest annual growth rate for GPs in 6 years.
• For Q4, we trained a record 2,290 new Invisalign doctors in the Americas region, of which 1,725 were North American doctors and 565 were Latin America doctors. In total, we trained 7,885 new Invisalign doctors in the Americas in 2018, an increase of 19%.
155.6190.6 189.4
Q4'17 Q3'18 Q4'18
(0.6)% Q/Q
+21.7% Y/Y
Invisalign shipments do not include SmileDirectClub aligners.Effective Q1'18, Americas region includes North America and LATAM. We have recasted historical data to reflect the change.
(K)
*number of cases shipped/number of doctors to whom cases were shipped
Americas Invisalign Metrics
NA Ortho
NA GP
North Americas Utilization*
Americas Shipments
14.014.0 17.417.4 16.516.5
3.33.3 3.53.5 3.63.6
Q4’17 Q3’18 Q4’18
46.646.6 56.756.7
8.28.2 9.19.1
2017 2018
+24.2% Y/Y
586.2728.1
2017 2018

ALIGN TECHNOLOGY, INC 8
Q4 2018 financial highlightsInternational
99.4128.7 144.4
Q4'17 Q3'18 Q4'18
International Invisalign Utilization* & Shipments
+12.2% Q/Q
+45.3% Y/Y
Invisalign shipments do not include SmileDirectClub aligners.Effective Q1'18, International region includes EMEA and APAC. We have recasted historical data to reflect the change.
*number of cases shipped/number of doctors to whom cases were shipped
(K)
5.45.4 5.55.5 5.75.7
Q4’17 Q3’18 Q4’18
13.213.2 13.913.9
2017 2018
+45.0% Y/Y
344.8500.0
2017 2018
• For our International business, Q4 was great quarter with Invisalign case volume up 12.2% sequentially driven by strong growth in the EMEA region offset somewhat by seasonality in Asia Pacific. On a year-over-year basis, strong Invisalign volume growth of 45.3% reflects increased utilization and continued expansion of our customer base in both EMEA and the Asia Pacific region. In Q4, we trained nearly 3,000 new Invisalign doctors internationally, with roughly 50% in EMEA and 50% in APAC.
• In EMEA, Q4 was a strong quarter up 42.7% year-over-year, driven record Invisalign volumes in all country markets as well as strong growth in the teen segment which was up 75.1% from the prior year, reflecting continued success of our Teen 360 program. For the full year, EMEA was up 38.6% led by Iberia, France and the UK – as well as our key expansion markets, led by Central & Eastern Europe. During 2018, we went direct in Turkey, Israel, and Russia, adding to our expansion country markets.
• For APAC, Q4 was down sequentially as expected due to a seasonally slower period in the region and up 49.3% year-over-year with record Invisalign volume in almost every country market, led by China, Japan, and Australia/New Zealand. Q4 results reflect continued strong growth from teenage patients, as well as adults with GP dentists up 77.1% year over year.
• During Q4, we trained 1,530 new doctors in APAC, of which half were in China. We held several clinical education events across APAC designed to help increase doctor’s confidence in and adoption of Invisalign treatment –including how critical the iTero scanner is to practice growth.
• For the full year, Invisalign volume from international doctors increased 45.0% led by growth from China and our core EMEA country markets. In total, international volume represented 41% of worldwide Invisalign case shipments.
• Despite our record results, we are still very under penetrated in APAC overall and specifically in China. As the second largest market for Align, China represents enormous growth potential and our ability to expand and drive penetration across the region relies on our ability to be closer to doctors and their patients, communicate in local language, and as much as possible operate like a local company.
• Late in Q4, we began fabricating Invisalign aligners in our new manufacturing facility in Ziyang, China – our first aligner fabrication facility outside of Juarez, Mexico. This is a temporary facility that will be replaced by our own building in 2020. Over the next year we will continue to build our manufacturing capabilities in Ziyang and ramp production to serve the rapidly growing Chinese market. However, it will take a couple of quarters to fully transition aligner production from Juarez to Ziyang and we would expect manufacturing overhead in Ziyang to be underutilized during this period.
International Shipments
ALIGN TECHNOLOGY, INC 9
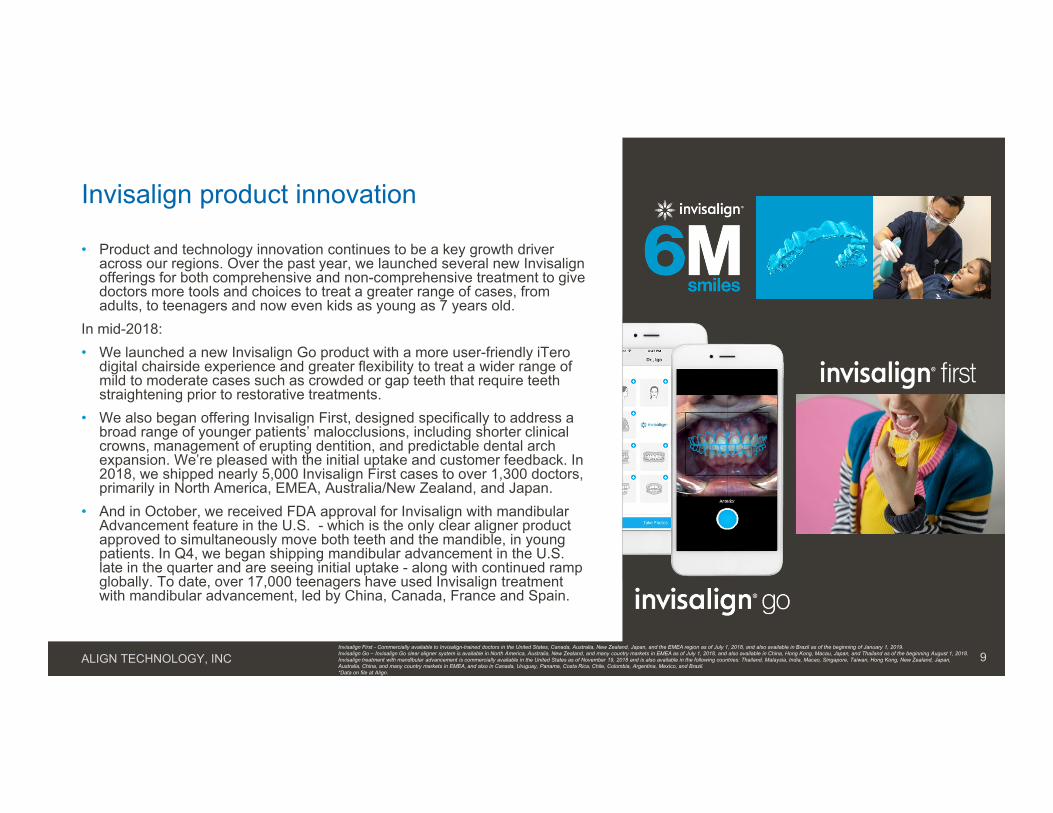
Invisalign product innovation
• Product and technology innovation continues to be a key growth driver across our regions. Over the past year, we launched several new Invisalign offerings for both comprehensive and non-comprehensive treatment to give doctors more tools and choices to treat a greater range of cases, from adults, to teenagers and now even kids as young as 7 years old.
In mid-2018: • We launched a new Invisalign Go product with a more user-friendly iTero
digital chairside experience and greater flexibility to treat a wider range of mild to moderate cases such as crowded or gap teeth that require teeth straightening prior to restorative treatments.
• We also began offering Invisalign First, designed specifically to address a broad range of younger patients’ malocclusions, including shorter clinical crowns, management of erupting dentition, and predictable dental arch expansion. We’re pleased with the initial uptake and customer feedback. In 2018, we shipped nearly 5,000 Invisalign First cases to over 1,300 doctors, primarily in North America, EMEA, Australia/New Zealand, and Japan.
• And in October, we received FDA approval for Invisalign with mandibular Advancement feature in the U.S. - which is the only clear aligner product approved to simultaneously move both teeth and the mandible, in young patients. In Q4, we began shipping mandibular advancement in the U.S. late in the quarter and are seeing initial uptake - along with continued ramp globally. To date, over 17,000 teenagers have used Invisalign treatment with mandibular advancement, led by China, Canada, France and Spain.
Invisalign First - Commercially available to Invisalign-trained doctors in the United States, Canada, Australia, New Zealand, Japan, and the EMEA region as of July 1, 2018, and also available in Brazil as of the beginning of January 1, 2019.Invisalign Go – Invisalign Go clear aligner system is available in North America, Australia, New Zealand, and many country markets in EMEA as of July 1, 2018, and also available in China, Hong Kong, Macau, Japan, and Thailand as of the beginning August 1, 2018.Invisalign treatment with mandibular advancement is commercially available in the United States as of November 19, 2018 and is also available in the following countries: Thailand, Malaysia, India, Macao, Singapore, Taiwan, Hong Kong, New Zealand, Japan,Australia, China, and many country markets in EMEA, and also in Canada, Uruguay, Panama, Costa Rica, Chile, Colombia, Argentina, Mexico, and Brazil.*Data on file at Align.

ALIGN TECHNOLOGY, INC 10
• 6.4M total Invisalign patients to date, with over 1.5M teens.• Overall for the teen market, in Q4 over 87 thousand
teenagers started treatment with Invisalign clear aligners, an increase of 37.3% year-over-year driven by continued strong adoption across all major regions – driven by both the Americas and EMEA regions. For Q4, year-over-year Invisalign teen patient growth for North Americas Orthos increased 23.7% and International doctors were up 63.7%.
• For the full year, total teen cases worldwide grew 40.3% to a total of 333.1 thousand teenagers, or 27.1% of our total volume.
Q4 2018 financial highlightsTeens and adults
44.0 49.0 55.2 69.8 63.5 69.1 78.4 98.5 87.1
146.0 159.0 176.7 166.3191.6 203.2
224.3 220.9246.7
Q4'16 Q1'17 Q2'17 Q3'17 Q4'17 Q1'18 Q2'18 Q3'18 Q4'18
Teens Adults
Invisalign shipments do not include SmileDirectClub aligners.
Worldwide Invisalign Case ShipmentsTeen versus Adult Mix
169.1 237.5 333.1
539.4693.5
895.1
2016 2017 2018Teens Adults

ALIGN TECHNOLOGY, INC 11
Consumer Marketing
• Our consumer marketing efforts are designed to build the category and drive demand for Invisalign treatment through a doctor’s office. We invest over $100 million each year in consumer marketing programs including TV, digital and social media, PR, event marketing and more recently our Patient Concierge and Invisalign Experience program. Our goals are to make the Invisalign brand a household name worldwide and to motivate consumers to seek Invisalign treatment through a doctor’s office.
• In Q4, we continued to see strong digital engagement with consumers and had nearly 4 million unique visitors on Invisalign.com sites for a total of 17 million over the year. Other key metrics show increased activity and engagement with the Invisalign brand and are included in our Q4 quarterly slides.
• The impact of digital technology on our world and specifically on our industry is challenging our customers to evolve just about every aspect of their practice, especially how they engage with consumers and turn them into patients. What worked for doctors in the past from a marketing, conversion and work flow perspective will not work today. Consumers expect more and are demanding different types of digital driven experiences. Many doctors don’t know where or how to start. The work we are doing with our integrated consumer marketing platform, Patient Concierge Service, and the Invisalign Experience program has given us better insights and information that we are sharing with doctors to help them reshape their practices.

ALIGN TECHNOLOGY, INC 12
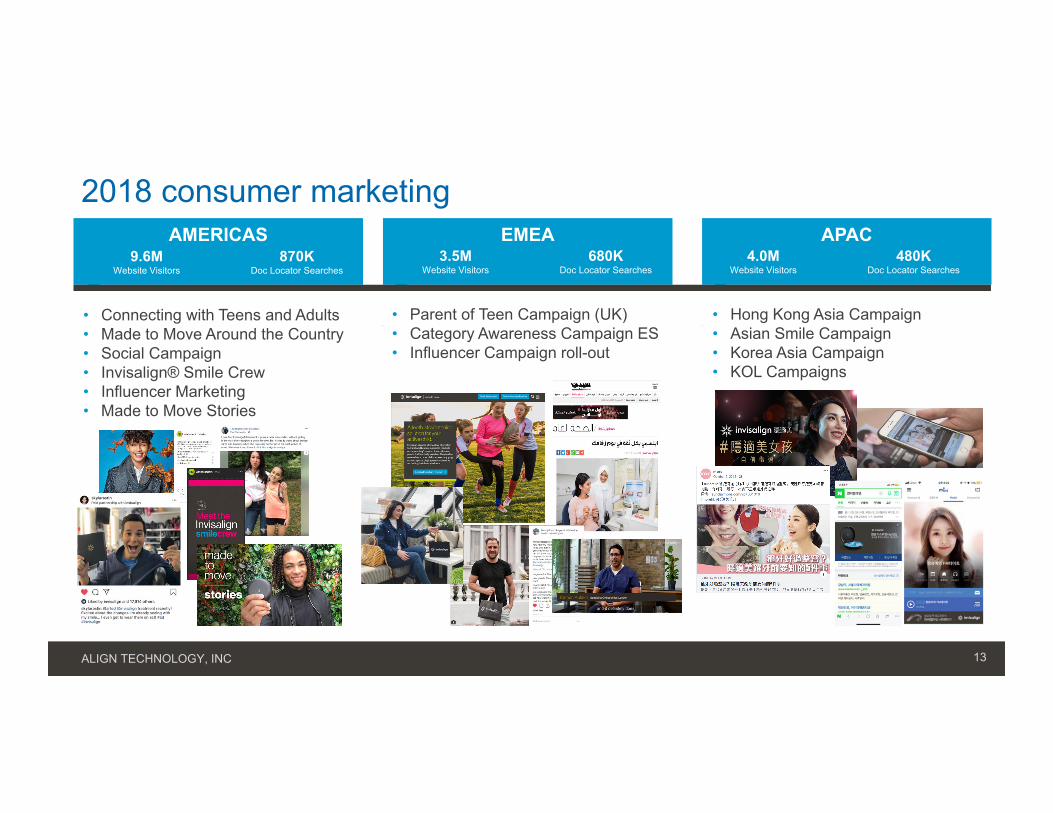
Worldwide consumer highlights
Cumulative to date
website visitors +49.4Msocial media fans +5.0Mdoc locator searches +6.4Msmile assessments +2.5M
ALIGN TECHNOLOGY, INC 13
• Connecting with Teens and Adults• Made to Move Around the Country• Social Campaign• Invisalign® Smile Crew• Influencer Marketing• Made to Move Stories
AMERICAS EMEA
• Parent of Teen Campaign (UK)• Category Awareness Campaign ES• Influencer Campaign roll-out
APAC
• Hong Kong Asia Campaign• Asian Smile Campaign• Korea Asia Campaign• KOL Campaigns
2018 consumer marketing
4.0MWebsite Visitors
480KDoc Locator Searches
9.6MWebsite Visitors
870KDoc Locator Searches
3.5MWebsite Visitors
680KDoc Locator Searches

ALIGN TECHNOLOGY, INC 14
• For example, the Invisalign Experience Program is designed to reach consumers in a retail environment where they shop, play and dine, and educate them on the benefits of Invisalign treatment and the value of getting a better smile, and connect them with an Invisalign doctor.
• One of the ways we do this through an Invisalign Store which is owned and operated by Align. Invisalign Stores bring the brand directly to consumers in a contemporary, interactive digital environment. Consumers can “browse,” ask questions, learn about Invisalign treatment and technology, and the benefits of straightening their teeth. Visitors are offered a complimentary iTero intraoral 3D scan and a visual simulation of what their smile might look like after Invisalign treatment. Interested consumers are connected with a local Invisalign doctor’s office of their choice to discuss potential treatment options.
• By the end of 2018, we finished with 12 locations in the U.S. and these stores are helping us learn more than ever about reducing barriers to treatment for potential patients so that they are excited about getting a better smile with an Invisalign doctor. In addition to providing potential leads to participating Invisalign practices, we are seeing a positive halo effect and increased growth rates for all of the Invisalign practices in the surrounding area – whether they participate in the Store network or not.
• Over the past year more than 55,000 consumers visited an Invisalign Store and nearly 10,000 received a complimentary scan. While we are still early in the development of our Invisalign Stores and the overarching Invisalign Experience program, we are excited about its potential and the positive impact we can have on demand creation for Invisalign practices by engaging directly with consumers.
• The Invisalign Experience program is just getting started and continues to evolve. In October, we announced that we were partnering with a few Invisalign doctors in select U.S. cities to pilot new ways to reach consumers and connect them directly with doctors to start Invisalign treatment. These Invisalign Experience locations are owned and operated by doctors under a special license from Align and are intended to help doctors integrate consumer-friendly design and consultation workflow into their practices, test new Invisalign Experience branding, and explore a consumer-focused approach to consultations and Invisalign treatment starts in a variety of settings, including in-office, retail and mobile. We’ll continue to share our learnings as we get more of these pilots up and running.
Invisalign Experience Program
Invisalign Stores bring the brand directly to consumers in a contemporary, interactive digital environment.

ALIGN TECHNOLOGY, INC 15
• By the end of 2018, we finished with 12 locations in the U.S. and these stores are helping us learn more than ever about reducing barriers to treatment for potential patients so that they are excited about getting a better smile with an Invisalign doctor. In addition to providing potential leads to participating Invisalign practices, we are seeing a positive halo effect and increased growth rates for all of the Invisalign practices in the surrounding area – whether they participate in the Store network or not.
• Over the past year more than 55K consumers visited an Invisalign Store and nearly 10K received a complimentary scan. While we are still early in the development of our Invisalign Stores and the overarching Invisalign Experience program, we are excited about its potential and the positive impact we can have on demand creation for Invisalign practices by engaging directly with consumers.
• The Invisalign Experience program is just getting started and continues to evolve. In October, we announced that we were partnering with a few Invisalign doctors in select U.S. cities to pilot new ways to reach consumers and connect them directly with doctors to start Invisalign treatment. These Invisalign Experience locations are owned and operated by doctors under a special license from Align and are intended to help doctors integrate consumer-friendly design and consultation workflow into their practices, test new Invisalign Experience branding, and explore a consumer-focused approach to consultations and Invisalign treatment starts in a variety of settings, including in-office, retail and mobile. We’ll continue to share our learnings as we get more of these pilots up and running.
Invisalign StoresInteractive brand experience
+55KConsumers visited an Invisalign Store
~10KConsumers received a complimentary scan
12Invisalign Store locations
Over the past year:

ALIGN TECHNOLOGY, INC 16
Smile Concierge Program
• Year to date we’ve scheduled over 85,000 Invisalign consultations in the U.S., which equates to connecting hundreds of consumers to Invisalign doctors every day and providing leads they might not otherwise have had.
• The Smile Concierge service has also expanded outside of the U.S. with teams in Singapore, Brazil, Australia, and the UK.
Smile Concierge Team
Goal is to reach more consumers one-on-one,and ensure that anyone that contacts us directlyhas the best experience with the Invisalign brand– beginning to end.
+85Kconsultations scheduled
+20K Invisalign cases started
to date
+366Kconsumers contacted

ALIGN TECHNOLOGY, INC 17
• For our iTero scanner and services business, Q4 was very strong quarter with better than expected with revenues which were up 13.0% sequentially and 54.8% year over year driven by strength in all regions and customer channels. Record Q4 volumes reflect continued commercialization of the iTero Element 2 and Element Flex scanners, especially for restorative GP dentists in North America, the continued rollout with our major DSO partners, and increased sales internationally including Italy, Japan, and China where we began manufacturing the iTero Element this past year.
• For 2018, we had an outstanding year for iTero scanners with volumes up 77.2% year-over-year. Cumulatively, over 11.5 million orthodontic scans and 3.2 million restorative scans have started with iTero scanners.
• Use of the iTero scanners for Invisalign case submission continues to grow and remains a positive catalyst for Invisalign utilization.
• What’s really exciting to see is that within the Americas, 88.7% of cases submitted by North American Orthos were submitted digitally. And China went from almost zero to 45.9% in only one year. This means that within another year or two, nearly all Invisalign cases will be submitted digitally – primarily through an iTero scanner.
• We are very excited about the continued progress we have made with the iTero business and remain confident that it will continue to help drive our overall growth and help increase adoption of Invisalign treatment.
Q4 2018 financial highlightsScanner and services
$57.1
$78.2$88.4
Q4'17 Q3'18 Q4'18
+13.0% Q/Q
+54.8% Y/Y
Americas 63.1% 65.3% 67.3% 69.5% 71.0% 72.6%
International 35.1% 41.4% 43.4% 47.8% 53.9% 57.5%
Q3’17 Q4’17 Q1’18* Q2’18* Q3’18* Q4’18
*Q1’18, Q2’18 and Q3’18 digital scanner percentages revised.
Invisalign scans include but not limited to additional aligner order scans, progress tracking, and does not reflect total Invisalign case shipments. Figures updated as of December, 2018. Data on file at Align Technology.iTero Element 2 and iTero Element Flex are currently available in Canada, the United States, majority of European countries (including France, Germany, Italy, Spain, and the United Kingdom) and select Asia Pacific Markets such as Australia, Hong Kong, Singapore, and Taiwan. The existing iTero Element scanner will continue to be available in all markets.
(M)
Scanner and Services Revenues
+67.5% Y/Y
$164.2
$275.0
2017 2018

ALIGN TECHNOLOGY, INC 18
•Q4 2018 Financial Review

ALIGN TECHNOLOGY, INC 19
$364.2$385.5
$433.3$427.1
$445.6
$57.1 $51.4$57.0 $78.2 $88.4
Q4'17 Q1'18 Q2'18 Q3'18 Q4'18
$M
Clear Aligner* Scanner & Services
$505.3
Revenues trendQ4’18 highlights
$421.3
+5.7% Q/Q
+26.7% Y/Y
*Clear aligner revenue includes revenues from Invisalign clear aligners and SmileDirectClub aligners.Q/Q and Y/Y percentages are based on actual values. Rounding may affect totals.
$436.9
• Total revenue for the fourth quarter was $534.0 million, up 5.7% from the prior quarter and up 26.7% from the corresponding quarter a year-ago. For the full year, revenue of about $2.0 billion was up 33.5% year over year, reflecting a record 1.2 million Invisalign shipments and 31.9% year over year growth, with strength across all regions and customer channels, as well as record iTero scanners volume which was up 77.2%
• For Clear aligners, Q4 revenue of $445.6 million was up 4.3% sequentially on higher than expected Invisalign ASPs and strong Invisalign volume from EMEA. Year-over-year clear aligner revenue growth of 22.4% reflected strong Invisalign shipment growth across all customer channels and geographies.
• Q4 Invisalign ASPs were up sequentially by approximately $5, to $1,235 reflecting price increases and lower discounts, partially offset by higher growth on non-comprehensive cases and includes $10 of unfavorable foreign exchange. On a year over year basis, Q4 Invisalign ASPs were down approximately $70 reflecting promotional discounts, higher growth on non-comprehensive cases, and includes $25 of unfavorable foreign exchange, partially offset by price increases.
• Our Scanner and Services revenue for the fourth quarter was $88.4 million, up 13.0% sequentially due to volume increases in the Americas and EMEA. Year-over-year revenue was up 54.8%, primarily due to higher scanner units across regions.
$490.3$534.0

ALIGN TECHNOLOGY, INC 20
Invisalign shipments trendQ4’18 highlights
+30.9% Y/Y
Invisalign shipments do not include SmileDirectClub aligners.Q/Q and Y/Y percentages are based on actual values. Rounding may affect totals.Effective Q1'18, Americas region includes North America and LATAM. International region includes EMEA and APAC. We have recasted historical data to reflect the change.
155.6 166.6 181.4 190.6 189.4
99.4 105.6121.3 128.7 144.4
Q4'17 Q1'18 Q2'18 Q3'18 Q4'18
(K)
Americas International
255.0
319.3
272.2
• Total Q4 Invisalign shipments of 333.8 thousand cases were up 4.5% sequentially and up 30.9% year-over-year.
• For Americas Orthodontists, Q4 Invisalign case volume was down 2.9% sequentially and up 24.7% year-over-year. For Americas GP Dentists, Invisalign case volume was up 3.2% sequentially and up 17.3% year-over-year. For International doctors, Invisalign case volume was up 12.2% sequentially and up 45.3% year-over-year.
302.7
+4.5% Q/Q
333.8

ALIGN TECHNOLOGY, INC 21
Gross margin trendQ4’18 highlights
75.5%74.9% 74.6%
73.6%
71.7%
Q4'17 Q1'18 Q2'18 Q3'18 Q4'18
(1.9)% pts
(3.8)% pts
*Clear aligner revenue includes revenues from Invisalign clear aligners and SmileDirectClub aligners.Q/Q and Y/Y percentages are based on actual values. Rounding may affect totals.
• Gross profit was $383.1M or 71.7% gross margin, (1.9) points Q/Q and (3.8) points Y/Y.
• Includes stock-based compensation of $0.9M.
• Moving on to gross margin. Fourth quarter overall gross margin was 71.7%, down 1.9 points sequentially and down 3.8 points year-over-year.
• Clear aligner gross margin for the fourth quarter was 74.1%, down 1.2 points sequentially primarily due to higher number of aligners per case, higher freight cost reflecting faster international growth, higher training costs due to more doctors trained in the quarter and manufacturing spend driven by operational expansion in China which was partially offset by slightly higher Invisalign ASPs. Clear aligner gross margin was down 3.5 points year-over-year primarily due to higher number of aligners per case, lower ASPs, higher training costs and freight charges and regional expansion of our manufacturing related activities in China and EMEA.
• Scanner gross margin for the fourth quarter was 59.9%, down 4.0 points sequentially and down 2.1 points year-over-year primarily due to manufacturing & freight costs and lower ASP.

ALIGN TECHNOLOGY, INC 22
Operating expense trendQ4’18 highlights
$208.3$229.2
$242.9 $246.6$262.6
Q4'17 Q1'18 Q2'18 Q3'18 Q4'18
$M +6.5% Q/Q
+26.1% Y/Y
• Q4 operating expenses were $262.6 million, up sequentially 6.5% and up 26.1% year-over-year. The sequential increase in operating expenses primarily reflects our continued investment in sales and R&D activities, along with higher legal/consulting expenses partially offset by seasonally lower advertising spending.
• Year-over-year, the increase in operating expenses reflects higher spending commensurate with growth.Includes stock-based compensation of $17.9M.
ALIGN TECHNOLOGY, INC 23
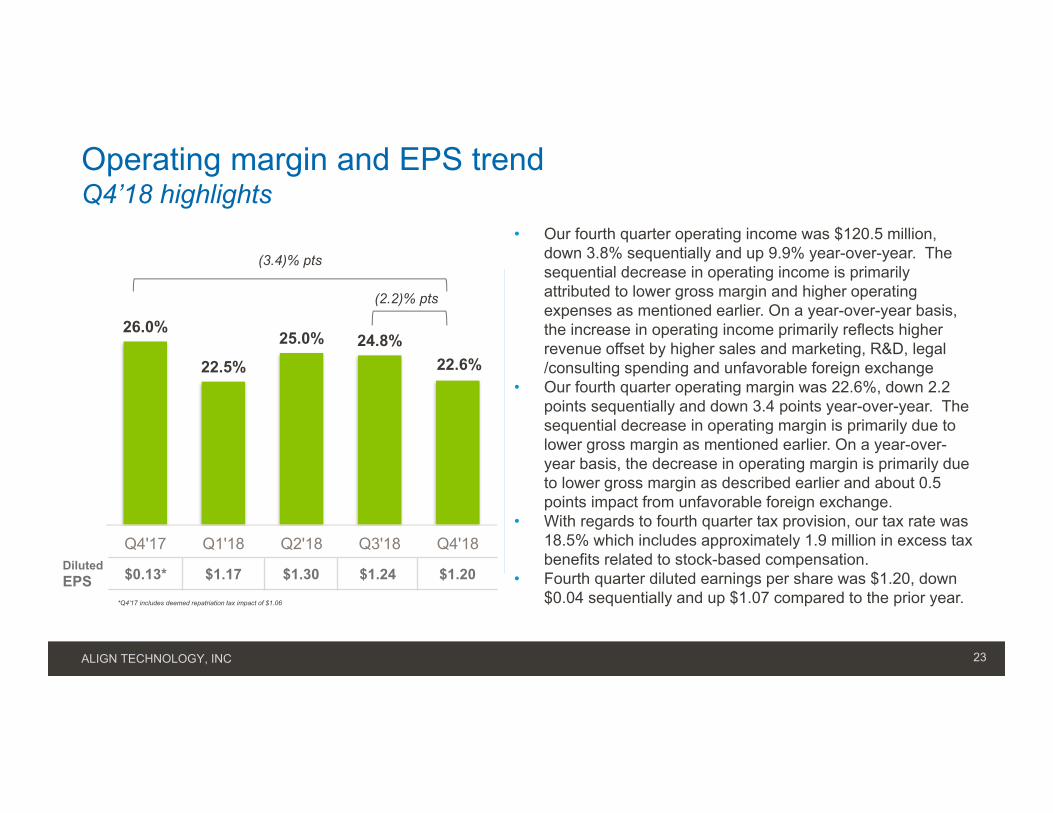
Operating margin and EPS trendQ4’18 highlights
26.0%
22.5%
25.0% 24.8%22.6%
Q4'17 Q1'18 Q2'18 Q3'18 Q4'18DilutedEPS $0.13* $1.17 $1.30 $1.24 $1.20
(2.2)% pts
(3.4)% pts
• Our fourth quarter operating income was $120.5 million, down 3.8% sequentially and up 9.9% year-over-year. The sequential decrease in operating income is primarily attributed to lower gross margin and higher operating expenses as mentioned earlier. On a year-over-year basis, the increase in operating income primarily reflects higher revenue offset by higher sales and marketing, R&D, legal /consulting spending and unfavorable foreign exchange
• Our fourth quarter operating margin was 22.6%, down 2.2 points sequentially and down 3.4 points year-over-year. The sequential decrease in operating margin is primarily due to lower gross margin as mentioned earlier. On a year-over-year basis, the decrease in operating margin is primarily due to lower gross margin as described earlier and about 0.5 points impact from unfavorable foreign exchange.
• With regards to fourth quarter tax provision, our tax rate was 18.5% which includes approximately 1.9 million in excess tax benefits related to stock-based compensation.
• Fourth quarter diluted earnings per share was $1.20, down $0.04 sequentially and up $1.07 compared to the prior year. *Q4’17 includes deemed repatriation tax impact of $1.06

ALIGN TECHNOLOGY, INC 24
Balance sheet highlights
*Free cash flow is defined as cash flow from operations less purchase of property, plant and equipment and is a non-GAAP measure. Rounding may affect totals.
During Q1, we adopted the ASC 606, "Revenues from Contracts with Customers" using the full retrospective method. While the impact to the Q4 2017 P&L was immaterial, the Condensed Consolidated Balance Sheet as of December 31, 2017 has been recasted to comply with the ASC 606 requirements.
($ in millions except for DSO)Q4’17 Q3’18 Q4’18
Accounts Receivables, net $324.2 $420.3 $439.0
DSO 69 days 75 days 74 days
Cash, Cash Equivalents & Short-Term and Long-Term Marketable Securities
$761.5 $613.2 $744.5
Cash Flow from Operations $162.3 $96.3 $241.3
Capital Expenditures $(69.5) $(53.7) $(54.3)
Free Cash Flow* $92.8 $42.6 $187.0
• As of the fourth quarter, cash, cash equivalents, and marketable securities, including both short- and long-term investments, were $744.5 million, an increase of approximately $131.3 million from the prior quarter which is primarily due to higher cash flow from operations. Of our $744.5 million of cash, cash equivalents and marketable securities, $432.5 million was held in the US and $312.0 million was held by our International entities.
• Q4 accounts receivable balance was $439.0 million, up approximately 4.5% sequentially. Our overall days sales outstanding (DSO) was 74 days, down 1 day sequentially and up 5 days as of Q4 last year.
• Cash flow from operations for the fourth quarter was $241.3 million, up $79.0 million compared to the prior year. Free cash flow for the fourth quarter, defined as cash flow from operations less capital expenditures, amounted to $187.0 million.
• Capital expenditures for the fourth quarter were $54.3 million, primarily related to our continued investment in increasing aligner capacity and facilities.
• During Q4’18, we repurchased $50.0 million of our stock against our stock buy-back authorizations and have $500.0 million still available for repurchase under the May 2018 Repurchase Program.

ALIGN TECHNOLOGY, INC 25
$364.2 $385.5$433.3 $427.1
$445.6$57.1 $51.4$57.0 $78.2 $88.4
Q4'17 Q1'18 Q2'18 Q3'18 Q4'18
WW Net Revenues ($M)
Clear Aligner Scanner & Services
$490.3
Trended Financials
255.0 272.2 302.7 319.3 333.8
Q4'17 Q1'18 Q2'18 Q3'18 Q4'18
Invisalign Shipments (#K)
75.5% 74.9% 74.6%73.6%
71.7%
Q4'17 Q1'18 Q2'18 Q3'18 Q4'18
Gross Margin %
26.0%22.5%
25.0% 24.8%22.6%
Q4'17 Q1'18 Q2'18 Q3'18 Q4'18
Operating Margin %
*Clear aligner revenue includes revenues from Invisalign clear aligners and SmileDirectClub alignersInvisalign shipments do not include SmileDirectClub alignersQ/Q and Y/Y percentages are based on actual values. Rounding may affect totals.
$421.3 $436.9$505.3 $534.0

ALIGN TECHNOLOGY, INC 26
•2018 Financial Overview
ALIGN TECHNOLOGY, INC 27
2018 Financial Highlights
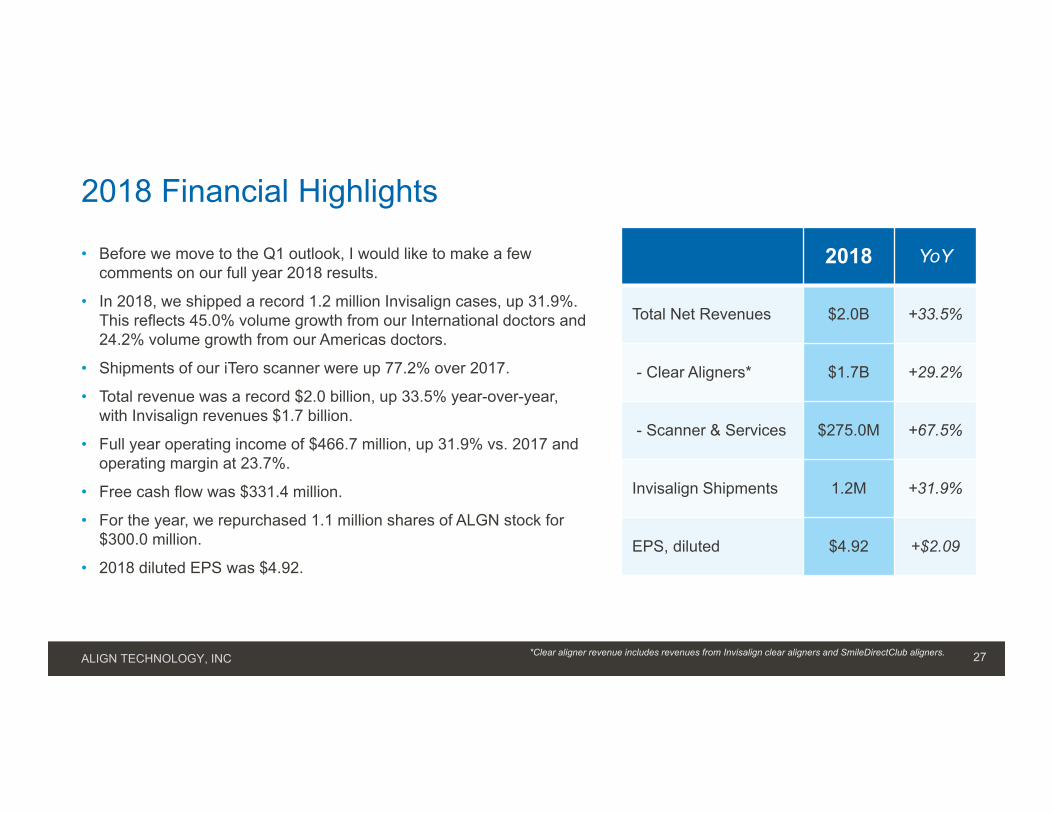
• Before we move to the Q1 outlook, I would like to make a few comments on our full year 2018 results.
• In 2018, we shipped a record 1.2 million Invisalign cases, up 31.9%. This reflects 45.0% volume growth from our International doctors and 24.2% volume growth from our Americas doctors.
• Shipments of our iTero scanner were up 77.2% over 2017.
• Total revenue was a record $2.0 billion, up 33.5% year-over-year, with Invisalign revenues $1.7 billion.
• Full year operating income of $466.7 million, up 31.9% vs. 2017 and operating margin at 23.7%.
• Free cash flow was $331.4 million.
• For the year, we repurchased 1.1 million shares of ALGN stock for $300.0 million.
• 2018 diluted EPS was $4.92.
2018 YoY
Total Net Revenues $2.0B +33.5%
- Clear Aligners* $1.7B +29.2%
- Scanner & Services $275.0M +67.5%
Invisalign Shipments 1.2M +31.9%
EPS, diluted $4.92 +$2.09
*Clear aligner revenue includes revenues from Invisalign clear aligners and SmileDirectClub aligners.

ALIGN TECHNOLOGY, INC 28
2018 Trended Financials
$712.5 $800.2 $958.3$1,309.2
$1,691.5$49.1 $45.3
$121.5
$164.2
$275.0
2014 2015 2016 2017 2018
WW Net Revenue ($M)
Scanner & Services Clear Aligner
$1,079.9$761.7 $845.5
$1,473.4
478.0583.2
708.5931.0
1,228.1
2014 2015 2016 2017 2018
Invisalign Case Shipments (#K)
75.9% 75.7% 75.5% 75.8%
73.6%
2014 2015 2016 2017 2018
Gross Margin %
25.4%
22.3%23.1%
24.0% 23.7%
2014 2015 2016 2017 2018
Operating Margin %
*Non-GAAP• Align implemented its new Additional Aligners policy on July 18, 2015. 2015 reported net revenues and pre tax income was lower by ~$14M and diluted EPS was lower by ~$0.13 per share, due to this change. • 2015 Operating Margin included 1.6 points of impact from Additional Aligners and foreign exchange rates on a constant currency basis. Operating results also included ~$12M of costs related to ERP implementation, and a one-time refund of
$6.8M for MDET refund.• Invisalign shipments exclude SmileDirectClub aligners
* *
Q/Q and Y/Y percentages are based on actual values. Rounding may affect totals.
$1,966.5

ALIGN TECHNOLOGY, INC 29
Balance sheet highlights
*Free cash flow is defined as cash flow from operations less purchase of property, plant and equipment and is a non-GAAP measure. Rounding may affect totals.
During Q1’18, we adopted the ASC 606, "Revenues from Contracts with Customers" using the full retrospective method. While the impact to the 2017 P&L was immaterial, the Condensed Consolidated Balance Sheet as of December 31, 2017 has been recasted to comply with the ASC 606 requirements.
($ in millions except for DSO)2017 2018
Accounts Receivables, net $324.2 $439.0
DSO 69 days 74 days
Cash, Cash Equivalents & Short-Term and Long-Term Marketable Securities $761.5 $744.5
Cash Flow from Operations $438.5 $554.7
Capital Expenditures $(195.7) $(223.3)
Free Cash Flow* $242.8 $331.4

ALIGN TECHNOLOGY, INC 30
Q1 2019 outlook Q1 2019
Invisalign Case Shipments 340.0K – 345.0K
Net Revenues $525.0M - $535.0M
Gross Margin 70.3% - 71.0%
Operating Expenses $290M – $294M
Operating Margin 15.1% - 16.1%
Effective Tax Rate ~16% (1)
EPS, diluted $0.78 - $0.84 (1,2)
Stock-Based Compensation $19.0M
Diluted Shares Outstanding 80.9M (2)
Capital Expenditures $60M - $65M
Depreciation & Amortization $19M-$20M
Invisalign shipments do not include SmileDirectClub aligners.
(1) Includes excess tax benefits related to share-based compensation expense pursuant to ASU 2016-09(2) Excludes any stock repurchases during the quarter
• With that, let’s turn to our Q1 outlook and the factors that inform our view. Starting with the demand outlook.
• For International, we expect Q1 to be up sequentially as the EMEA market maintains momentum from Q4 and APAC is seasonally flat sequentially as some markets observe the Lunar New Year holiday.
• For Americas, we expect Q1 to also increase sequentially with strong growth from North America Orthos and a slight increase in North America GPs. We expect LATAM to be down sequentially given this is their summer holiday season.
• We expect our iTero business to be down slightly from a record Q4 - consistent with seasonal trends in capital equipment market.
• And, we continue to expect minimal volume from Smile Direct Club (SDC).
• We expect approximately $3 to $4 million equity loss related to our share of SmileDirectClub’s net losses.

ALIGN TECHNOLOGY, INC 31
Q1'19 GuidanceLow - High
GAAP EPS $0.78 - $0.84
Tax windfall (higher in Q1’18) ~ $0.18
Legal Litigation ~ $0.04
China Manufacturing ~ $0.05
Sales Investment ~ $0.05
Q1’19 EPS Guidance Impact – Y/Y

ALIGN TECHNOLOGY, INC 32
2019 financial outlook commentaryNow let me turn to our view for the full year 2019, notwithstanding the impact of foreign exchange rates.
• We anticipate total revenue growth rate for the Company, Invisalign and iTero to be in the middle range of our long-term operating model target of 20%-30%.
• We anticipate Invisalign ASPs to be flat from Q4 2018, reflecting continued growth from international regions, increased share of the teen segment, and uptake of non-comprehensive products.
• We anticipate Invisalign volume to be in the middle of the range of our long-term growth model target of 20%-30%.
• We anticipate gross margin and operating margin to improve over the course of the year.
• We anticipate gross margin to approach our long-term model target of 73%-78% by Q4.
• We will continue to fuel growth globally and expect to invest in international and operational expansion, as well as sales and marketing initiatives - including nearly 100 new sales reps in the Americas hired at the end of Q4 and additional GP sales reps in EMEA beginning in Q1. These investments also include continued litigation expenses to protect our intellectual property and extend our competitive advantage.
• Given our continued growth and expansion internationally, during the year we intend to reorganize our corporate structure and intercompany relationships to more closely align with the international nature of our business activities. The proposed corporate structure may also allow us to obtain financial and operational efficiencies after they are implemented. As a result, we will incur expenses in the near term and expect to realize the related benefits in subsequent years.
• We expect our Operating Margin for the second half to be in the long-term model of 25%-30%. For the full year we anticipate operating margin to be below our long-term target as it includes approximately 1.5% to 2% pts. impact from increased legal fees and the planned corporate structure reorganization.
• We expect the equity loss for our investment in SmileDirectClub to be $3M to $4M per quarter.
• We expect our tax rate for 2019 to be approximately 24%, which includes ~$8 million of “excess” tax benefits. 2019 tax rate is higher than 2018 primarily due to a release of unrecognized tax benefits that will not repeat.
• We expect our earnings power in the second half of the year to be stronger than the first half - with second half operating profits to account for somewhere in the range of 55% to 60% of our full year results.
• We expect capital expenditures for 2019 to be in a range of $250 to $260 million.

ALIGN TECHNOLOGY, INC 33
Summary• Overall, 2018 was a great year for Align and I am very pleased with the strong performance for Invisalign and iTero - across all key regions, customer channels, and
products. This year, not only did we celebrate our 21st year in business, but we also achieved several major milestones including our 6 Millionth Invisalign patient and $2 billion in revenue for the first time. It took nearly 20 years to reach our first our billion dollars in sales and only 2 years to reach our second billion.
• We also delivered on our strategic growth drivers with new product and technology innovation, expansion of our manufacturing and treatment planning operations, and raising awareness of Invisalign treatment with consumers and engaging with them in more innovative ways than ever before.
• As I step back and look ahead to 2019 and beyond, I want to reinforce the importance of the investments we’re making to drive growth globally. The underlying opportunity for doctors and their patients is expanding based on digital technology that Align has spent over 21 years developing. And while we have a huge amount of accumulated expertise and knowledge in digital technology and orthodontics, we have to ensure that we have the capabilities to further expand and regionalize our operations, extend our competitive lead, and protect our business from companies willing to take shortcuts with respect to intellectual property. It is incumbent upon us to drive the transition to a fully digital workflow and continue to deliver new products and services that not only benefit Invisalign doctors, but their patients and consumers alike.
• Following our Ortho Summit in November, I met with hundreds of Invisalign doctors and their staff, I had the opportunity to travel to our regional kick off meetings and connect with Align team members at every level of our organization to hear their detailed plans for the upcoming year. While I spent more of my time at the Americas kick off, because of my interim role as the Americas leader, I can say unequivocally that across the company the excitement and level of engagement surrounding our business and market opportunity was palpable.
• Overall, the demand profile globally is solid and nothing we see in the environment suggest otherwise. We’re running the plays we know and are confident we can bring greater efficiencies, economies of scale and know that adding sales, training and getting closer to customer in local markets creates sustainable competitive advantage.
• Finally, as most of you know one of the key orthodontic journals in North America is the Journal of Clinical Orthodontics and I often flip through it and ask why there aren’t more aligner cases profiled. This week I was caught off guard when I opened the December issue and found it was dedicated entirely to clear aligner therapy. Bob Keim is the editor of the JCO and has been to many of our Invisalign Summits. In meetings with him and reading his editorials I knew he supported Invisalign treatment and clear aligners in general, but it was never clear to what extent he believed in clear aligner technology as we’ve seen with this most recent issue of the JCO—especially the editor’s column “The End of Braces.” If you haven’t had a chance to read the recent JCO, you should. Bob could not take a stronger position for a clear aligners. He acknowledges that he might take some flak for being so bold, but I believe his strong endorsement is a major breakthrough for Align and digital orthodontics.
• With that, I want to thank you again for joining our call. I look forward to updating you on our progress as the year unfolds. We’ll see many of you at the Chicago Midwinter Meeting next month, as well as industry and financial conferences throughout the year.

ALIGN TECHNOLOGY, INC 34
•Appendix

ALIGN TECHNOLOGY, INC 35
3 to 5 year financial model targets
Q4’17 Actual
Q3’18 Actual
Q4’18 Actual
3 – 5 Year Model
Annual Revenue Growth % 43.7% 31.2% 26.7% 20% - 30%
Gross Margin 75.5% 73.6% 71.7% 73% - 78%
Operating Expense % 49.4% 48.8% 49.2% 45% - 50%
Operating Margin 26.0% 24.8% 22.6% 25% - 30%
Free Cash Flow* 22.0% 8.4% 35.0% 20% - 25%*Free cash flow is defined as cash flow from operations less purchase of property, plant and equipment and is a non-GAAP measure

ALIGN TECHNOLOGY, INC 36
Invisalign average selling price (ASP)Worldwide and international
ASP: Invisalign case revenue / Invisalign case shipments
Effective Q1'18, Americas region includes North America and LATAM. International region includes EMEA and APAC. We have recasted historical International ASP data to reflect the change.
Q4'16 Q1'17 Q2'17 Q3'17 Q4'17 Q1'18 Q2'18 Q3'18 Q4'18Worldwide $1,230 $1,270 $1,285 $1,310 $1,305 $1,310 $1,315 $1,230 $1,235International $1,330 $1,345 $1,340 $1,395 $1,400 $1,435 $1,425 $1,340 $1,295
$1,100
$1,200
$1,300
$1,400
$1,500
$1,600

ALIGN TECHNOLOGY, INC 37
Invisalign average selling price (ASP)Product groups
Comprehensive Products: Invisalign Full, Invisalign Teen, Invisalign Assist
Non-Comprehensive Products: Invisalign Express 10, Invisalign Express 5, Invisalign Lite, Invisalign i7, Invisalign Go
ASP: Invisalign case revenue / Invisalign case shipments
Q4'16 Q1'17 Q2'17 Q3'17 Q4'17 Q1'18 Q2'18 Q3'18 Q4'18Comprehensive Products $1,335 $1,370 $1,395 $1,405 $1,385 $1,390 $1,410 $1,310 $1,320Non-comprehensive Products $810 $870 $900 $950 $990 $985 $965 $940 $960
$700
$900
$1,100
$1,300
$1,500
*Q2’18 ASP adjusted to include LATAM shipments not previously reflected
*

ALIGN TECHNOLOGY, INC 38