Chapter 6: Quadratic Functions Vogler Algebra II Vogler Algebra II.
Algebra II: Gatekeeper Course 1
Title Page
Algebra II: Gatekeeper Course An Examination of CST Proficiency Levels
in California and The Bay Area
by
Laurie Hailer-O'Keefe
Submitted in Partial Fulfillment of the Requirements for the Degree
Master of Science in Education
School of Education
Dominican University of California
San Rafael, CA
December 2012
Algebra II: Gatekeeper Course 2
Acknowledgments
I would like to express my gratitude and appreciation to Madalienne Peters for her guidance with
this research paper. Her enthusiasm, interest and suggestions have been essential to the success
of this project.
I would also like to express my gratitude to my ever-supportive husband, Doug, who
encouraged me to get in gear and get this paper done. My daughters, Megan and Ashley, deserve
plenty of praise for all their extra help with chores around the house so mom can spend the day
typing.
My family has always provided a source of strength and encouragement to me. I
appreciate the values that were instilled in me as a child by my parents and again as a young
adult grappling with the dual pressures and joys of career and family. I am forever indebted to
my parents, Jim and Sue Waters and Ann and Harry Simon, my brother, Jim Waters, husband,
Douglas Hailer-O’Keefe and my children, Megan and Ashley Hailer, for putting up with me and
keeping me grounded through these first forth-five years of my wonderful life.
Algebra II: Gatekeeper Course 3
Table of Contents
Title Page................................................................................................................................................................ 1 Acknowledgments............................................................................................................................................... 2 Abstract................................................................................................................................................................... 4 Chapter 1 Introduction...................................................................................................................................... 5 Statement of the Problem .......................................................................................................................................................6 Purpose Statement.....................................................................................................................................................................7 Theoretical Rationale ...............................................................................................................................................................7 Assumptions ..................................................................................................................................................................................8 Background and Need ..............................................................................................................................................................9
Chapter 2 Review of the Literature .............................................................................................................11 Chapter 3 Method ..............................................................................................................................................15 Chapter 4 Findings ............................................................................................................................................17 Data Table .................................................................................................................................................................................. 22 Percent English Learner and Percent Free or Reduced Price Meals ................................................................. 24 Graduation and Dropout Rates........................................................................................................................................ 25 Alameda County ....................................................................................................................................................................... 26 Contra Costa County............................................................................................................................................................... 28 Marin County............................................................................................................................................................................. 30 Napa County .............................................................................................................................................................................. 32 San Francisco County............................................................................................................................................................. 34 San Mateo County.................................................................................................................................................................... 36 Santa Clara County ................................................................................................................................................................. 38 Solano County ........................................................................................................................................................................... 40 Sonoma County......................................................................................................................................................................... 42 Other Counties .......................................................................................................................................................................... 44
Chapter 5 Discussion........................................................................................................................................46 References ...........................................................................................................................................................51
Algebra II: Gatekeeper Course 4
Abstract
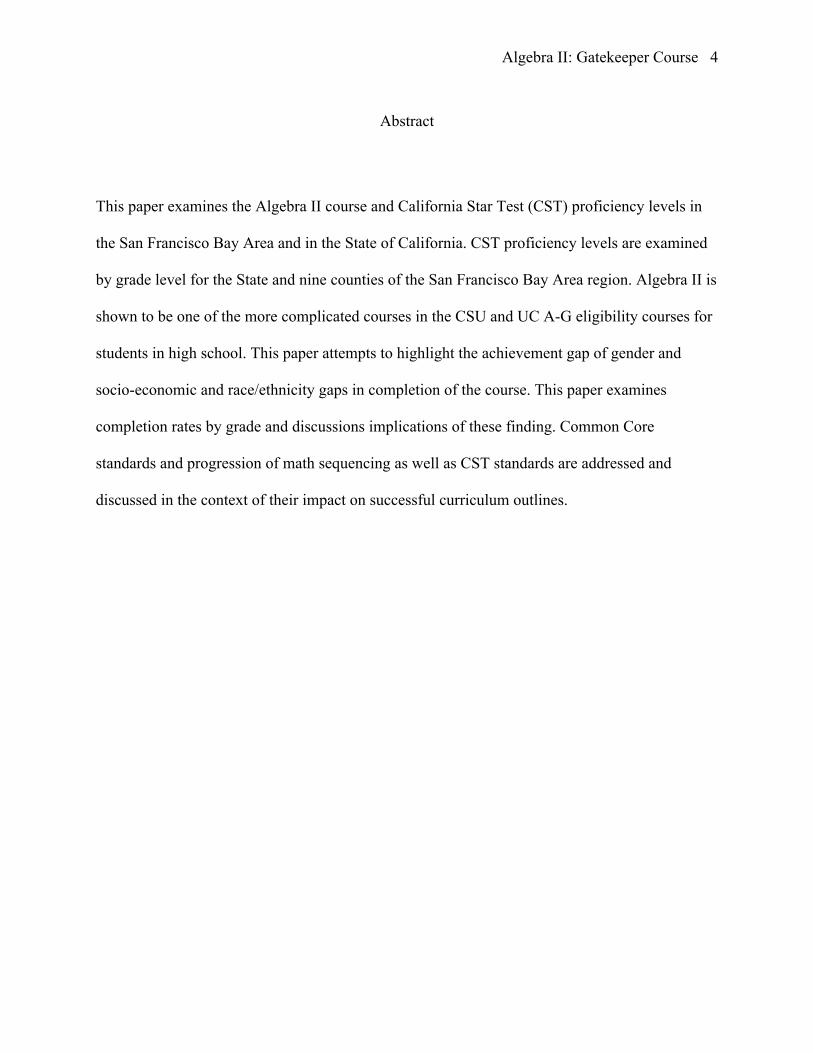
This paper examines the Algebra II course and California Star Test (CST) proficiency levels in
the San Francisco Bay Area and in the State of California. CST proficiency levels are examined
by grade level for the State and nine counties of the San Francisco Bay Area region. Algebra II is
shown to be one of the more complicated courses in the CSU and UC A-G eligibility courses for
students in high school. This paper attempts to highlight the achievement gap of gender and
socio-economic and race/ethnicity gaps in completion of the course. This paper examines
completion rates by grade and discussions implications of these finding. Common Core
standards and progression of math sequencing as well as CST standards are addressed and
discussed in the context of their impact on successful curriculum outlines.
Algebra II: Gatekeeper Course 5
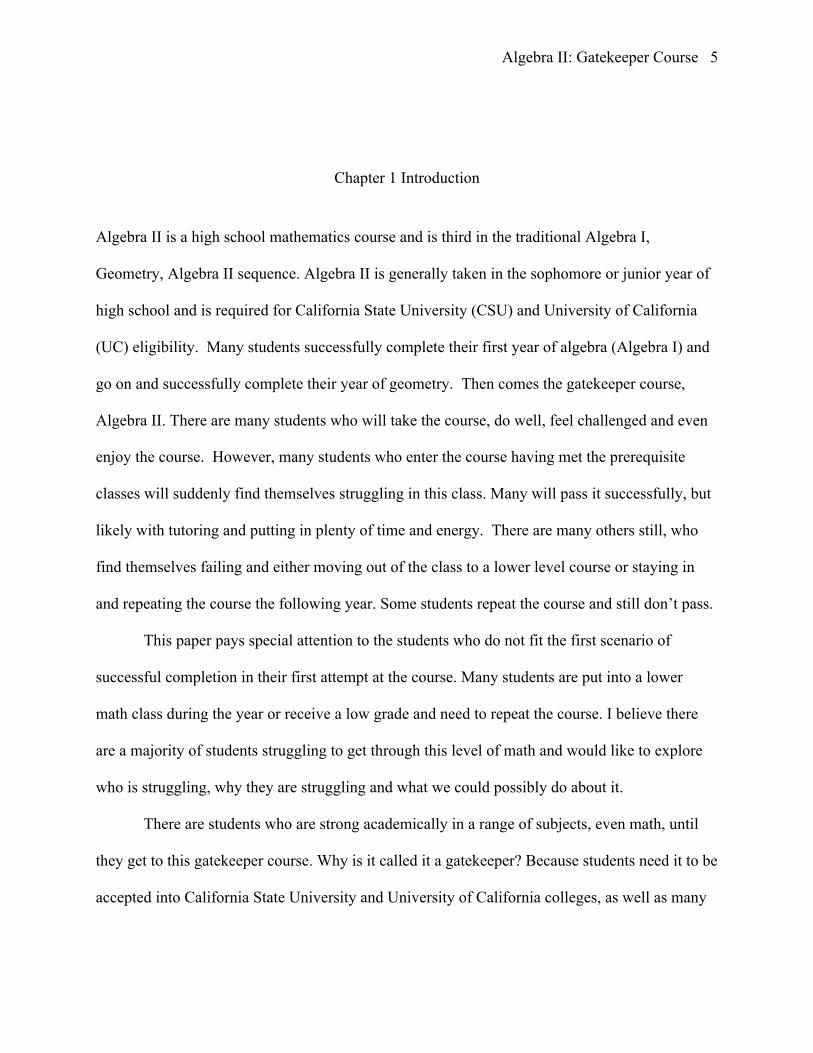
Chapter 1 Introduction
Algebra II is a high school mathematics course and is third in the traditional Algebra I,
Geometry, Algebra II sequence. Algebra II is generally taken in the sophomore or junior year of
high school and is required for California State University (CSU) and University of California
(UC) eligibility. Many students successfully complete their first year of algebra (Algebra I) and
go on and successfully complete their year of geometry. Then comes the gatekeeper course,
Algebra II. There are many students who will take the course, do well, feel challenged and even
enjoy the course. However, many students who enter the course having met the prerequisite
classes will suddenly find themselves struggling in this class. Many will pass it successfully, but
likely with tutoring and putting in plenty of time and energy. There are many others still, who
find themselves failing and either moving out of the class to a lower level course or staying in
and repeating the course the following year. Some students repeat the course and still don’t pass.
This paper pays special attention to the students who do not fit the first scenario of
successful completion in their first attempt at the course. Many students are put into a lower
math class during the year or receive a low grade and need to repeat the course. I believe there
are a majority of students struggling to get through this level of math and would like to explore
who is struggling, why they are struggling and what we could possibly do about it.
There are students who are strong academically in a range of subjects, even math, until
they get to this gatekeeper course. Why is it called it a gatekeeper? Because students need it to be
accepted into California State University and University of California colleges, as well as many
Algebra II: Gatekeeper Course 6 private and out-of-state colleges. Without successful completion of Algebra II by junior year,
college eligibility is threatened.
This paper examines CST data for California and nine Bay Area Counties to find
differences in outcomes for students based on socio-economic status, gender, ethnicity and other
variables. This chapter outlines the problem. Chapter Two reviews current literature and Chapter
Three outlines the method used to create the findings in Chapter Four. Chapter Four of this paper
presents data that shows the outcome results and Chapter Five discusses possible routes for
future study and practice for districts, schools and teachers.
Statement of the Problem
Algebra II is a gatekeeper course for college bound students (Clotfeller, Ladd, Vigdor &
National Bureau of Economic Research, 2012). There are many students meeting the college
eligibility requirements for CSU and UC in all areas except mathematics. The problem is that the
students successfully complete the prerequisites for Algebra II, sometimes with grades of A or B,
but cannot successfully complete Algebra II. Schools and districts often create or have
intervention systems in place to help struggling students. Sometimes the intervention is for
students to move to a lower level math class and repeat the Algebra I material they had already
successfully completed. Some remain in Algebra II but receive a low grade which requires them
to repeat the course. This can severely impact their college acceptance prospects depending on
their current grade level. This is a very critical course for juniors (grade 11) and seniors (grade
12) who are applying to colleges without successfully completing the course and with the low
grade on their transcripts, which brings down their GPA, another critical component for college
acceptance.
Algebra II: Gatekeeper Course 7 Purpose Statement
The purpose of this research is to highlight the problem of Algebra II as a gatekeeper course and
examine ways to maintain the integrity of the curriculum while offering suggestions to
restructure the course to potentially meet the needs of all students and narrow the existing
achievement gaps.
Research Questions
1. Who is struggling in Algebra II?
2. What disparities exist in terms of demographic characteristics of students?
3. What do we do for those students who are struggling to pass and therefore limited in
terms of college acceptance?
Theoretical Rationale
The basis for my thesis stems from the findings of two researchers, Stigler and Hiebert (2009),
who wrote a book after reviewing results and videos of teachers teaching math around the world
as part of The International Mathematics and Science Study (TIMSS). In their book, The
Teaching Gap, Stigler and Hiebert (2009) find that the US method of teaching mathematics lies
in a procedural and skills based approach for solving certain types of problems. In Japan, where
TIMSS scores were much higher than in the US, educators focused more on problem solving and
group. This really formed a connection for me about why some of our students may be struggling
in higher-level mathematics in high school. Without a firm conceptual understanding of the
mathematics, it is very difficult to keep learning more and more rules, steps, methods and tricks
in order to solve for the well-known variable, ‘x,’ unless you have a strong natural aptitude.
As a current teacher of Algebra II, I hear frequent concerns from parents and students
about their ability to pass the class. Some students have had to repeat all or part of Algebra I and
Algebra II: Gatekeeper Course 8 are now in their junior or senior year of high school and feeling a tremendous amount of anxiety
about taking Algebra II. Others have taken intermediate algebra or have taken Algebra II
unsuccessfully.
Assumptions
When students successfully complete prerequisite courses, they should be able to successfully
complete the next course. There will be some students who really do need to take a difficult
course twice, but most should complete the course with a C grade or higher. Completion rates
should not vary by ethnicity or SES status if all students in the classroom have met the
prerequisites.
Another assumption is that the curriculum of Algebra II does not need to review a great
deal of Algebra I curriculum and it needs even less to cover a great deal of Pre-calculus
curriculum, the next course in the mathematics sequence for students on the path to Calculus.
This is especially true for students who are juniors or seniors who may choose to go the route of
statistics in their next math courses and in their college majors. More majors are requiring
statistics as part of the coursework so a Calculus driven curriculum may no longer serve students
in the way it has in the past.
Because of this, a small amount of review at the start of the year and small amount of
preview into advanced topics near the end of the year should be enough time to devote to topics
not specifically part of the Algebra II curriculum. As new topics are introduced, many textbooks
and teachers begin each chapter with previous material from Algebra I in the first section or as
introductory material. Many also use the first chapter for review of previous work and the last
chapter(s) as a preview to the next course.
Algebra II: Gatekeeper Course 9 Background and Need
Before star test scores (CST), AP courses and the No Child Left Behind act (NCLB), students
generally started high school and were placed in their first algebra class as freshmen. They
proceed up through the curriculum to geometry in sophomore year, Algebra II in junior year and
landed at pre-calculus in their senior year if they successfully completed every course. They may
have skipped pre-calculus if they did not want to take a fourth year math class. This was the
standard path and it is what the new common core standards seem to be headed back towards. In
the interim, we had students who were strong math students and were ready for Algebra I in
eighth grade, who could start geometry in their freshman year and move through to AP Calculus
in their senior year.
Today, more students take Algebra in eighth grade and are ready for advanced curriculum
in their junior year and an AP math course in their senior year. More juniors in Algebra II would
benefit from a curriculum that incorporates elements of a statistics path. Students have more
choice about which courses they will take after Algebra II. Sophomores can choose to take Pre-
Calculus, Statistics or AP Statistics in their junior year. Juniors can choose these same courses in
their senior year. Seniors, moving on to college, may never need to take Pre-Calculus or Calculus
courses. But, many, even science and math majors, will likely be required to take Statistics in
college. So, it seems the current path to Calculus may be becoming outdated for many students.
These may be the same students who struggle in Algebra II as juniors and seniors.
We currently find ourselves adopting new standards that define a slightly more moderate
curriculum, that expands the focus of application and technology based problem solving. Critical
thinking and reasoning skills will be emphasized in the next set of standards. It is expected that
standardized tests will no longer be 100% multiple choice. There will be free-response questions
Algebra II: Gatekeeper Course 10 that are graded with a rubric. This is shift for mathematics in the Unites States, which has
focuses on skill and drill, procedures and rules, without much emphasis on meaning, problem
solving and sense making. The standards are still quite comprehensive and should well prepare
students for their SAT tests and Algebra II and beyond.
The rest of this paper examines current literature on the topic of student outcomes in
mathematics education, current data for California and the Nine-County San Francisco Bay Area,
and suggests direction for further study and practices regarding Algebra II.
Algebra II: Gatekeeper Course 11
Chapter 2 Review of the Literature
In The Teaching Gap (Stigler & Hiebert, 2009) differences in teaching methods used in the
United States, Germany and Japan are described and compared to outcomes in the Third
International Mathematics and Science Study (TIMSS). The TIMSS compares science and math
achievement using a video component and includes forty-one nations (Stigler & Hiebert, 2009).
The authors of The Teaching Gap collaborated on the video study and later analyzed the results.
They point out, after analyzing the techniques used by teachers in different countries, and
therefore different cultural approaches to teaching, that although “the American teachers we
observed were highly competent at implementing American teaching methods, the methods
themselves were severely limited” (p.xviii). The teaching gap the authors refer to is not the gap
in competence of teachers, but the gap in methods of teaching that occurs internationally. The
focus of the analysis is on teaching methods in Germany, Japan and the United states, in eighth
grade mathematics classrooms. The book examines reform efforts in the United States and
“proposes a new plan for improving classroom teaching in the United States” (Stigler & Hiebert,
2009, p.xix).
One of the components of reform that may be missing in United States education reform
efforts is what the Japanese teachers call lesson study. “In lesson study, groups of teachers meet
regularly over long periods of time (ranging from several months to a year) to work on design,
implementation, testing and improvement of one or several ‘research lessons’” (Stigler &
Hiebert, 2009, p.110). The first step in the lesson study process is to define the problem, which
can be general or specific, i.e. increase engagement levels or improve a specific skill (Stigler &
Algebra II: Gatekeeper Course 12 Hiebert, 2009). The next step, once the learning goal is established – usually by the teacher’s
own choice in something they are challenged by – is to plan the lesson. The lesson is perceived
as a “group product” even when only one teacher may actually teach the lesson (Stigler &
Hiebert, 2009, p.113). “The initial plan that the group produces is often presented at a school-
wide faculty meeting in order to solicit criticism” (Stigler & Hiebert, 2009, p.113). Teachers then
go on to teach the lesson, evaluate the lesson and reflect on its effectiveness, revise the lesson,
teach the revised lesson, evaluate and reflect and finally share the results (Stigler & Hiebert,
2009).
The National Center for Education Statistics has produces a report outlining the need for
students who are planning to be eligible for college to enroll in eighth grade algebra and foreign
language courses. Their findings show that the majority of students who enroll in eighth grade
algebra courses and maintain a high level of mathematics achievement in high school apply to
college at a higher rate over those students who achieve a high level of mathematics but did not
enroll in algebra in eighth grade (72% as compared to 58%). Of those who enrolled in eighth
grade algebra but achieved a low or middle level of mathematics achievement in high school
approximately 55% applied to a four-year college. Those who did not enroll in eighth grade
algebra and did not achieve a high level of mathematics completion in high school applied to
four year colleges at a much lower rate of 24% to 29%This supports the idea that successful
completion of high level mathematics in high school (high in this study is any class beyond
Geometry), is a gatekeeper to four year colleges.
In Los Angeles County Unified School District, researchers found that Algebra II was the
most difficult course to pass for college track student (Rickles & White, 2005, p.6). African
American and Hispanic students as well as English Learners and special education students had
Algebra II: Gatekeeper Course 13 lower success rates for completing the A-G UC/CSU requirements while White and Asian
students were more likely to complete the requirements (p.10). The report followed the
progression of ninth graders enrolled in LAUSD schools in 2001 who would graduate in 2005.
Of those students, 41% left the district before graduating, 7% were retained and 52% were
enrolled in twelfth grade for the 2004-05 school year. Excluding special education students, 40%
left the District, 6% were retained and 53% were enrolled in twelfth grade in 2004-05.
Of the 38,211 non-special education students in the 2001 ninth grade cohort, 29% were
enrolled in all A-G courses by twelfth grade and 15% completed them with a grade of ‘C’ or
better (Rickles & White, 2005). This 15% comprised 18% of the female students and 11% of the
male students. The District is comprised largely of Hispanic students. Of the non-special
education students in the ninth grade cohort, 70% are Hispanic and only 11% of them completed
the A-G requirements with grades of ‘C’ or better. Of the other 30%, 13% of African American
students, 38% of Asian students and 27% of white and all others met the A-G requirements with
a grade of C or better.
In summary, the report found disparities for gender, race and ethnicity and special
education classifications. English Language learners were also less likely to have met the A-G
requirements with a grade of ‘C’ or better: 5% versus 18% for non-English learners. Only 2% of
Special education students meet the A-G requirements with grades of ‘C’ or better (Rickles &
White, 2005).
The Public Policy Institute of California report Higher Education for California: New
Goals for the Master Plan, shows college eligibility rates for high school graduates by race,
gender over time (Johnson, 2010). They show that there is a gap between females and males
graduating with CSU/UC eligibility courses met in 2007: 15.3% of females versus 11.2 % of
Algebra II: Gatekeeper Course 14 males are UC eligible, while 37.6 % of females are CSU eligible and only 27.3% of males are.
The same gap exists for race/ethnicity in 2007 where Asian students are much more likely to be
eligible, 29.4% for UC and 50.9% for CSU, whites are 14.6% UC eligible and 37.1% CSU
eligible, while Latino and African American students are very close at about6.5% UC eligible
and approximately 23% eligible for CSU. These gender and race/ethnicity gaps have narrowed
since 1996. Rates for Asians and Whites have been relatively stable since 1996, but have
doubled for African Americans and Latinos for both UC and CSU eligibility.
San Diego Unified School District (2010) Educational Opportunity Audit Report shows
disparities in race/ethnicity A-G eligibility for graduates, as well. Their online report on 9/30/12
shows graduation rates by race/ethnicity for students who meet A-G UC/CSU eligibility courses.
Asians currently graduate with 58% of students meeting the requirements for UC/CSU, Whites
are at 54%, African Americans are at 32% and Latino students are at 30%. These percentages
have all increased over the past few years, but a clear gap exists between Whites/Asian and
African American/Latino students.
Algebra II: Gatekeeper Course 15
Chapter 3 Method
The statistical component of this paper was completed by use of publically available data. No
surveys were done to get input from teachers about their decision making processes, constraints
by schools regarding scheduling or from students about their personal experiences. This research
is solely about Algebra II proficiency rates and takes a closer look at those rates by County,
ethnicity and socio-economic status. State level and county level data is used.
Data sources include California Department of Education (CDE, 2012) data sources. The
primary data source used for the creation of the charts and graphs in Chapter 4 are Standardized
Testing and Reporting (STAR) scores using reports run on Data Quest available at the CDE
website. These data are readily available on the Testing and Accountability Tab of the CDE
website and queries are made through a link to Data Quest (California Department of Education,
2010).
There are several other large publically available databases available for education
research. The TIMSS study has created an International Data Explorer tool that allows a
researcher to generate data reports on many aspects of student performance. The TIMSS study
examined classrooms, students and teachers around the globe in fourth and eighth grade
mathematics and science courses. The study surveyed schools, students, math teachers and
science teachers. The eighth grade student survey was comprised of approximately twenty
questions with sub-questions. The survey asked students about their activities at home, outside of
school and their classes. They were asked about their math competency and attitudes and about
instructional practices and use of classroom time. Teachers were asked about their teacher
preparation programs, education, the school climate, and teaching practices. Because these data
refer to eighth grade coursework, little of the data will be used in this report. The TIMSS
Algebra II: Gatekeeper Course 16 contribution comes mainly from the video analysis performed by Stigler and Hiebert and is
reviewed in the literature review chapter of this paper. The data source and study are mentioned
because they are suggested as resources for further study in the final section of this paper.
Other publically available data sites were examined. At NAEP, there is a video entitled
the Condition of Education, an annual report generated by NEAP. Data and charts from that
report were examined, but not included in this report.
All CDE data collected has been entered into excel files and summarized to show the
reader the relationship between grade level and successful Algebra II completion rates. County
and state level ethnicity, graduation rates, dropout rates and percent English language learner
and percent of students receiving free and reduced meals at school is examined.
CST proficiency rates are assumed to correlate to successful completion of a course grade
of C or better. This assumption allows for use of CST scores to compare proficiency rates in
Chapter 4 of this paper with the assumption they are a proxy for grades issued by teachers. Grade
data is not as readily available and is beyond the scope of this report. In Chapter 5, districts,
schools and teachers are encouraged to examine grade data to see if it correlates with student’s
proficiency scores.
UC Census data is used to find demographic information for each county and for
California. The California QuickFacts website provides user access to summary information on
socio-economic data, demographics and other information for census areas. Data files were
downloaded into excel to create tables of findings in Chapter 4 of this paper.
Algebra II: Gatekeeper Course 17
Chapter 4 Findings
This section examines data on proficiency rates for the CST Algebra II exam and student
demographics for the State of California and the nine county Bay Area. Proficiency levels for
each County and grade level of students is given, along with ethnicity distributions for eighth
through eleventh grade students.
In all the proficiency distributions, the bulk of eleventh graders taking the CST score
Basic, Below Basic, or Far Below Basic. Presumably some of those students had taken Algebra
II in their sophomore year and are retaking the course, as discussed in the Los Angeles Unified
School District report in Chapter 2, the literature review.
The data in the charts and tables in this section shows that as the grade level increases for
taking the Algebra II CST, the proficiency level drops. We will see this trend continues despite
ethnicity, socioeconomic status (SES) and English language learner status. In this report, the
percent of students who are eligible for free and reduced price lunches is assumed to address SES
levels.
Algebra II: Gatekeeper Course 18
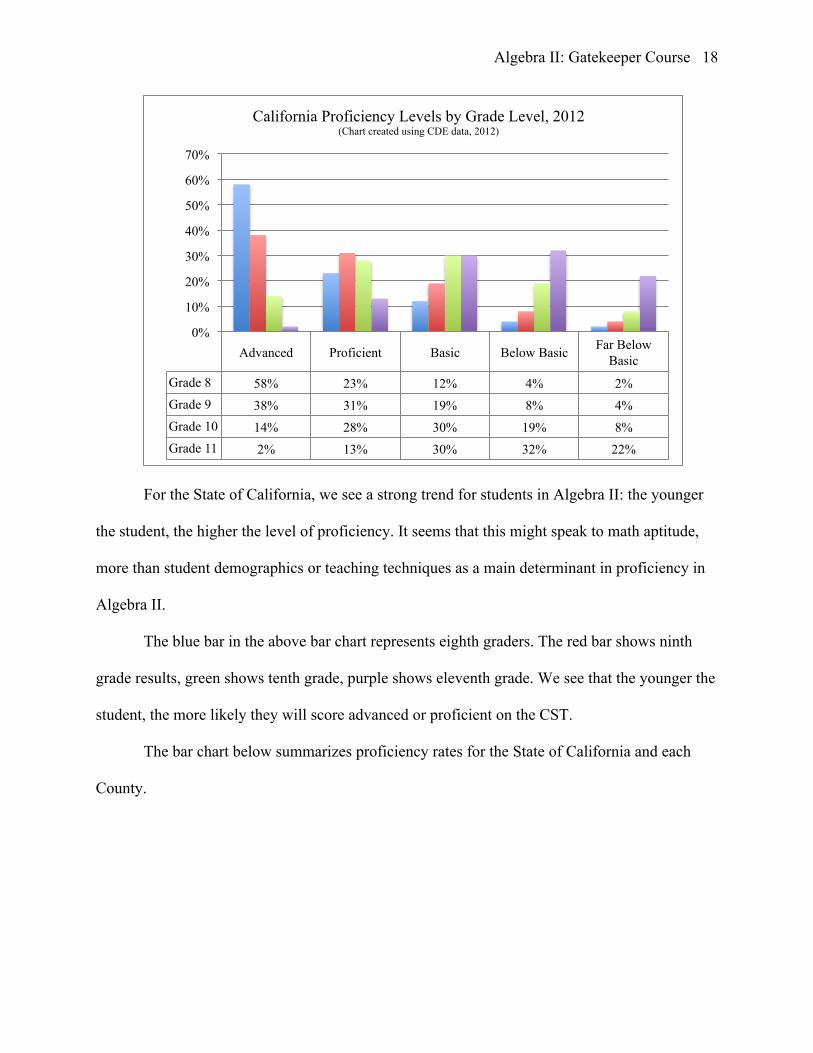
For the State of California, we see a strong trend for students in Algebra II: the younger
the student, the higher the level of proficiency. It seems that this might speak to math aptitude,
more than student demographics or teaching techniques as a main determinant in proficiency in
Algebra II.
The blue bar in the above bar chart represents eighth graders. The red bar shows ninth
grade results, green shows tenth grade, purple shows eleventh grade. We see that the younger the
student, the more likely they will score advanced or proficient on the CST.
The bar chart below summarizes proficiency rates for the State of California and each
County.
Advanced Proficient Basic Below Basic Far Below Basic
Grade 8 58% 23% 12% 4% 2% Grade 9 38% 31% 19% 8% 4% Grade 10 14% 28% 30% 19% 8% Grade 11 2% 13% 30% 32% 22%
0%
10%
20%
30%
40%
50%
60%
70%
California Proficiency Levels by Grade Level, 2012 (Chart created using CDE data, 2012)
Algebra II: Gatekeeper Course 19
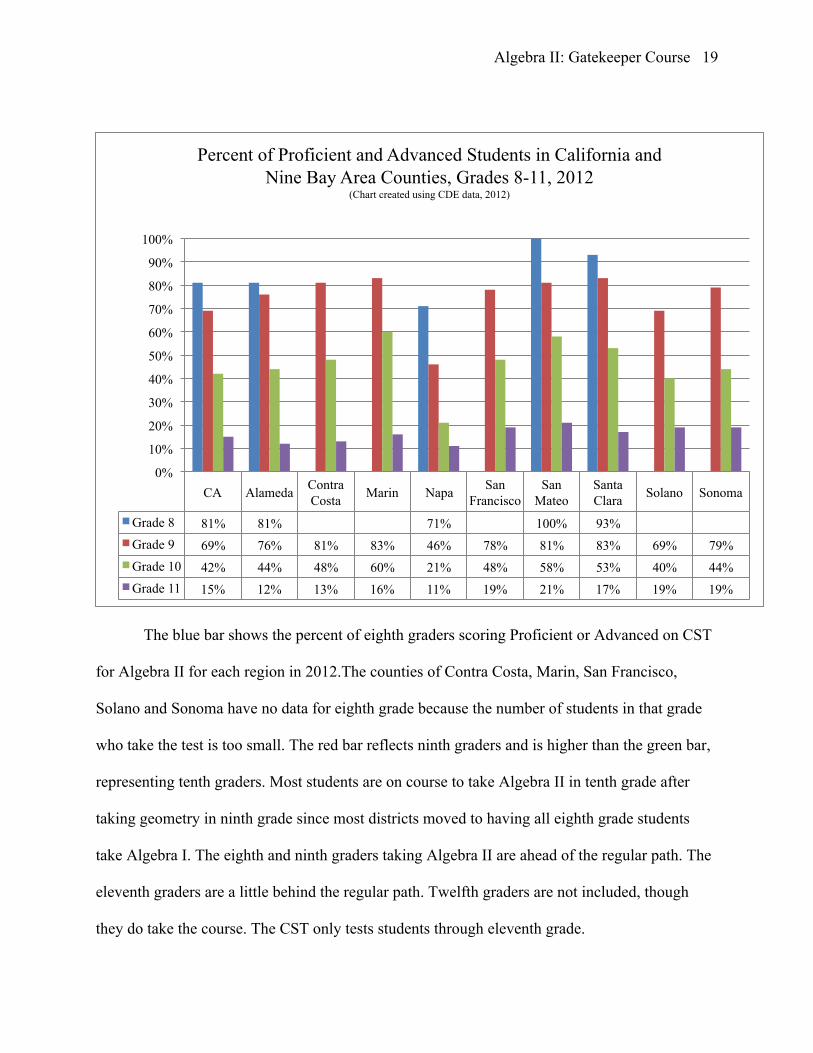
The blue bar shows the percent of eighth graders scoring Proficient or Advanced on CST
for Algebra II for each region in 2012.The counties of Contra Costa, Marin, San Francisco,
Solano and Sonoma have no data for eighth grade because the number of students in that grade
who take the test is too small. The red bar reflects ninth graders and is higher than the green bar,
representing tenth graders. Most students are on course to take Algebra II in tenth grade after
taking geometry in ninth grade since most districts moved to having all eighth grade students
take Algebra I. The eighth and ninth graders taking Algebra II are ahead of the regular path. The
eleventh graders are a little behind the regular path. Twelfth graders are not included, though
they do take the course. The CST only tests students through eleventh grade.
CA Alameda Contra Costa Marin Napa San
Francisco San
Mateo Santa Clara Solano Sonoma
Grade 8 81% 81% 71% 100% 93% Grade 9 69% 76% 81% 83% 46% 78% 81% 83% 69% 79% Grade 10 42% 44% 48% 60% 21% 48% 58% 53% 40% 44% Grade 11 15% 12% 13% 16% 11% 19% 21% 17% 19% 19%
0%
10%
20%
30%
40%
50%
60%
70%
80%
90%
100%
Percent of Proficient and Advanced Students in California and Nine Bay Area Counties, Grades 8-11, 2012
(Chart created using CDE data, 2012)
Algebra II: Gatekeeper Course 20 For each county, we see the same trend of younger students with higher proficiency
levels. Ninth graders are more likely to score high than tenth graders, who are more likely to
score higher than eleventh graders in every county and in the state.
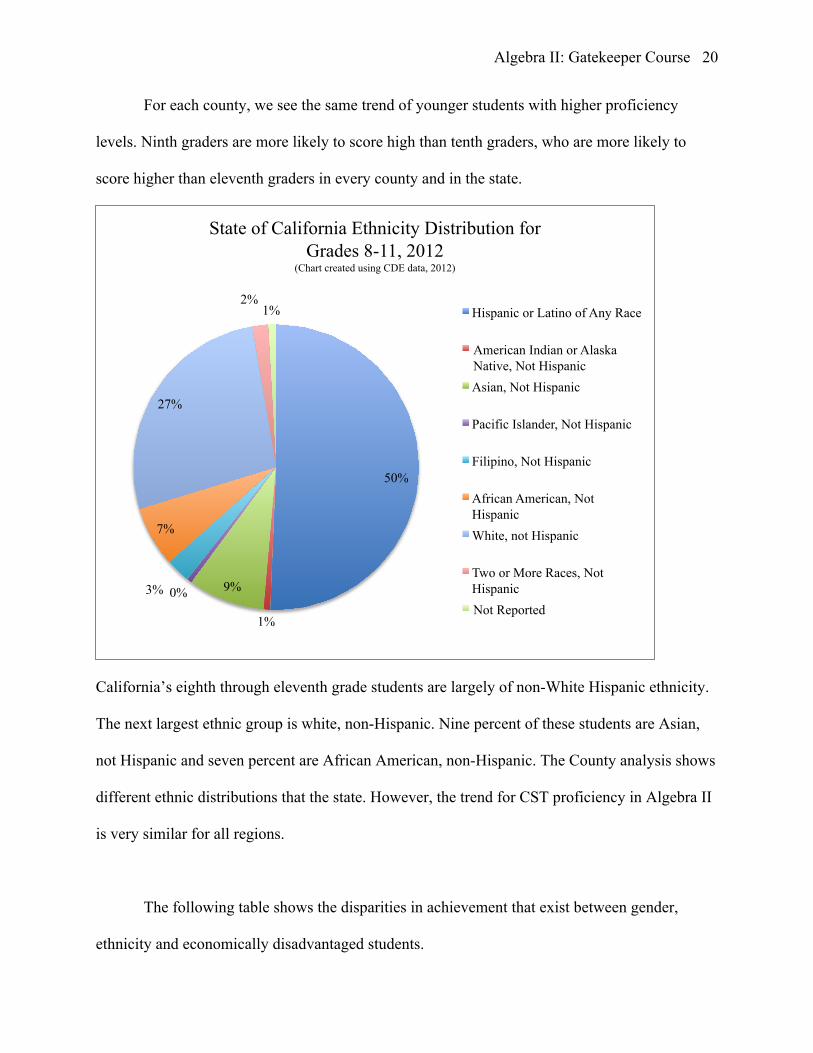
California’s eighth through eleventh grade students are largely of non-White Hispanic ethnicity.
The next largest ethnic group is white, non-Hispanic. Nine percent of these students are Asian,
not Hispanic and seven percent are African American, non-Hispanic. The County analysis shows
different ethnic distributions that the state. However, the trend for CST proficiency in Algebra II
is very similar for all regions.
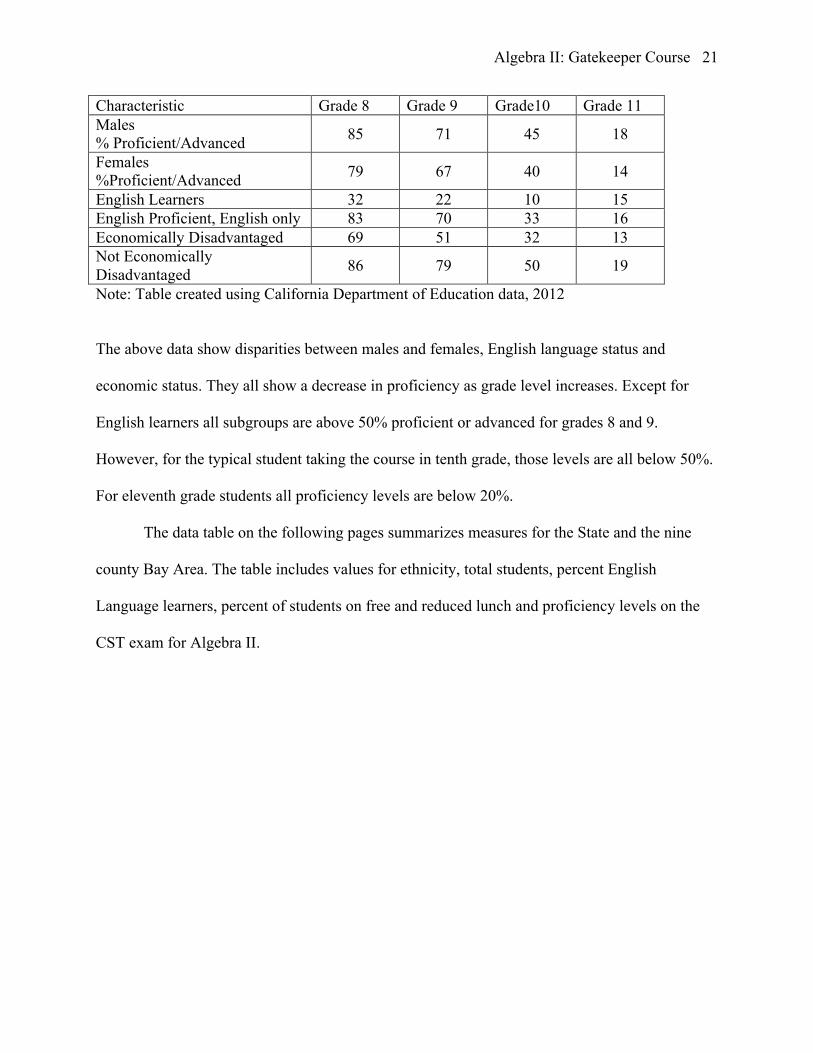
The following table shows the disparities in achievement that exist between gender,
ethnicity and economically disadvantaged students.
50%
1%
9% 0% 3%
7%
27%
2% 1%
State of California Ethnicity Distribution for Grades 8-11, 2012
(Chart created using CDE data, 2012)
Hispanic or Latino of Any Race
American Indian or Alaska Native, Not Hispanic Asian, Not Hispanic
Pacific Islander, Not Hispanic
Filipino, Not Hispanic
African American, Not Hispanic White, not Hispanic
Two or More Races, Not Hispanic Not Reported
Algebra II: Gatekeeper Course 21
Characteristic Grade 8 Grade 9 Grade10 Grade 11 Males % Proficient/Advanced 85 71 45 18
Females %Proficient/Advanced 79 67 40 14
English Learners 32 22 10 15 English Proficient, English only 83 70 33 16 Economically Disadvantaged 69 51 32 13 Not Economically Disadvantaged 86 79 50 19
Note: Table created using California Department of Education data, 2012
The above data show disparities between males and females, English language status and
economic status. They all show a decrease in proficiency as grade level increases. Except for
English learners all subgroups are above 50% proficient or advanced for grades 8 and 9.
However, for the typical student taking the course in tenth grade, those levels are all below 50%.
For eleventh grade students all proficiency levels are below 20%.
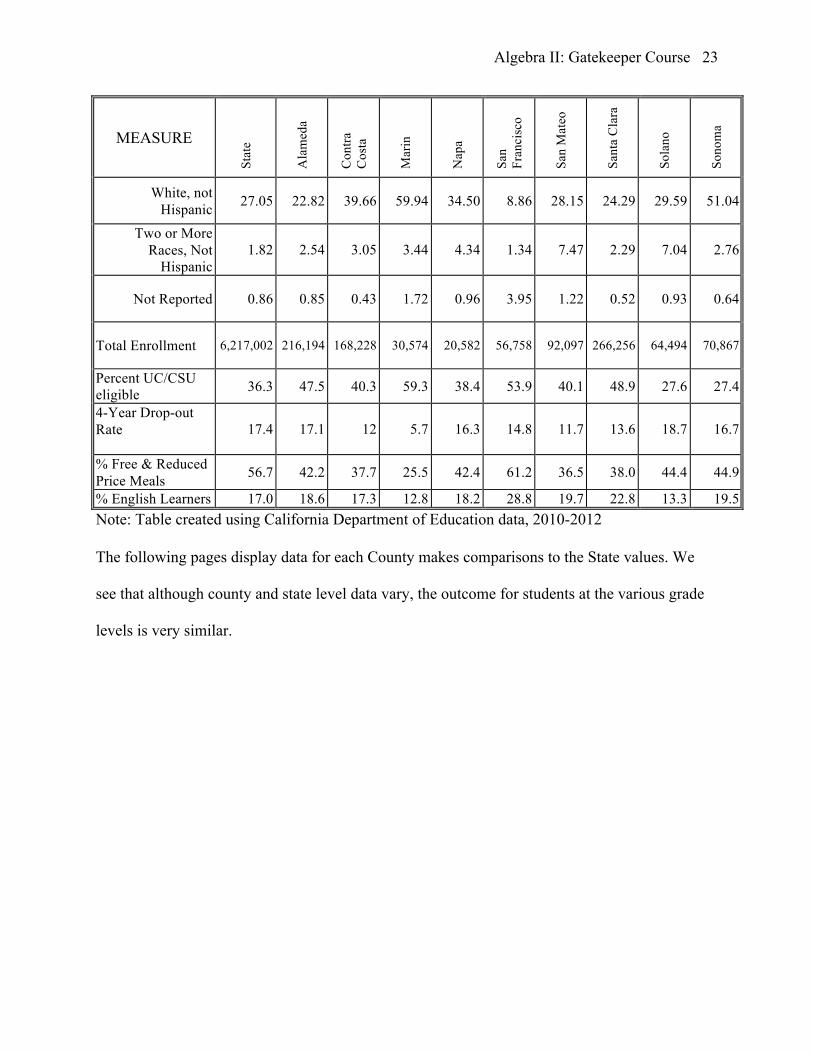
The data table on the following pages summarizes measures for the State and the nine
county Bay Area. The table includes values for ethnicity, total students, percent English
Language learners, percent of students on free and reduced lunch and proficiency levels on the
CST exam for Algebra II.
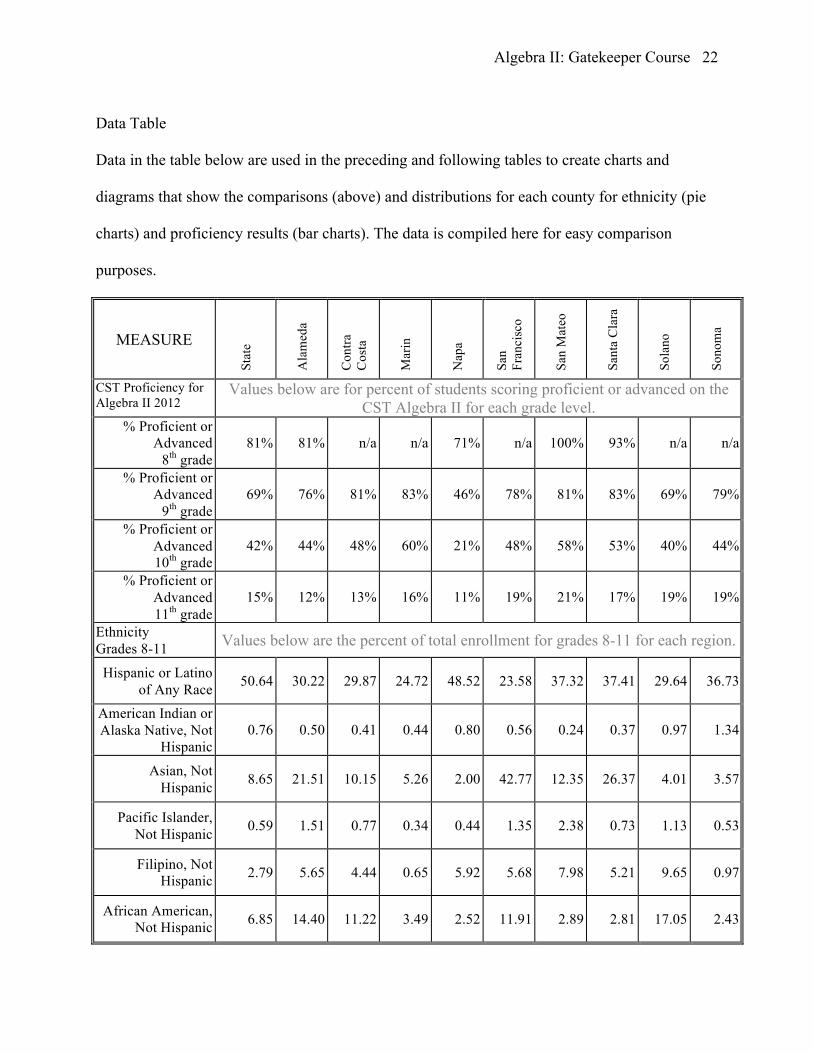
Algebra II: Gatekeeper Course 22 Data Table
Data in the table below are used in the preceding and following tables to create charts and
diagrams that show the comparisons (above) and distributions for each county for ethnicity (pie
charts) and proficiency results (bar charts). The data is compiled here for easy comparison
purposes.
MEASURE
Stat
e
Ala
med
a
Con
tra
Cos
ta
Mar
in
Nap
a
San
Fran
cisc
o
San
Mat
eo
Sant
a C
lara
Sola
no
Sono
ma
CST Proficiency for Algebra II 2012
Values below are for percent of students scoring proficient or advanced on the CST Algebra II for each grade level.
% Proficient or Advanced
8th grade 81% 81% n/a n/a 71% n/a 100% 93% n/a n/a
% Proficient or Advanced
9th grade 69% 76% 81% 83% 46% 78% 81% 83% 69% 79%
% Proficient or Advanced 10th grade
42% 44% 48% 60% 21% 48% 58% 53% 40% 44%
% Proficient or Advanced 11th grade
15% 12% 13% 16% 11% 19% 21% 17% 19% 19%
Ethnicity Grades 8-11 Values below are the percent of total enrollment for grades 8-11 for each region.
Hispanic or Latino of Any Race 50.64 30.22 29.87 24.72 48.52 23.58 37.32 37.41 29.64 36.73
American Indian or Alaska Native, Not
Hispanic 0.76 0.50 0.41 0.44 0.80 0.56 0.24 0.37 0.97 1.34
Asian, Not Hispanic 8.65 21.51 10.15 5.26 2.00 42.77 12.35 26.37 4.01 3.57
Pacific Islander, Not Hispanic 0.59 1.51 0.77 0.34 0.44 1.35 2.38 0.73 1.13 0.53
Filipino, Not Hispanic 2.79 5.65 4.44 0.65 5.92 5.68 7.98 5.21 9.65 0.97
African American, Not Hispanic 6.85 14.40 11.22 3.49 2.52 11.91 2.89 2.81 17.05 2.43
Algebra II: Gatekeeper Course 23
MEASURE
Stat
e
Ala
med
a
Con
tra
Cos
ta
Mar
in
Nap
a
San
Fran
cisc
o
San
Mat
eo
Sant
a C
lara
Sola
no
Sono
ma
White, not Hispanic 27.05 22.82 39.66 59.94 34.50 8.86 28.15 24.29 29.59 51.04
Two or More Races, Not
Hispanic 1.82 2.54 3.05 3.44 4.34 1.34 7.47 2.29 7.04 2.76
Not Reported 0.86 0.85 0.43 1.72 0.96 3.95 1.22 0.52 0.93 0.64
Total Enrollment 6,217,002 216,194 168,228 30,574 20,582 56,758 92,097 266,256 64,494 70,867
Percent UC/CSU eligible 36.3 47.5 40.3 59.3 38.4 53.9 40.1 48.9 27.6 27.4
4-Year Drop-out Rate
17.4 17.1 12 5.7 16.3 14.8 11.7 13.6 18.7 16.7
% Free & Reduced Price Meals 56.7 42.2 37.7 25.5 42.4 61.2 36.5 38.0 44.4 44.9
% English Learners 17.0 18.6 17.3 12.8 18.2 28.8 19.7 22.8 13.3 19.5 Note: Table created using California Department of Education data, 2010-2012 The following pages display data for each County makes comparisons to the State values. We
see that although county and state level data vary, the outcome for students at the various grade
levels is very similar.
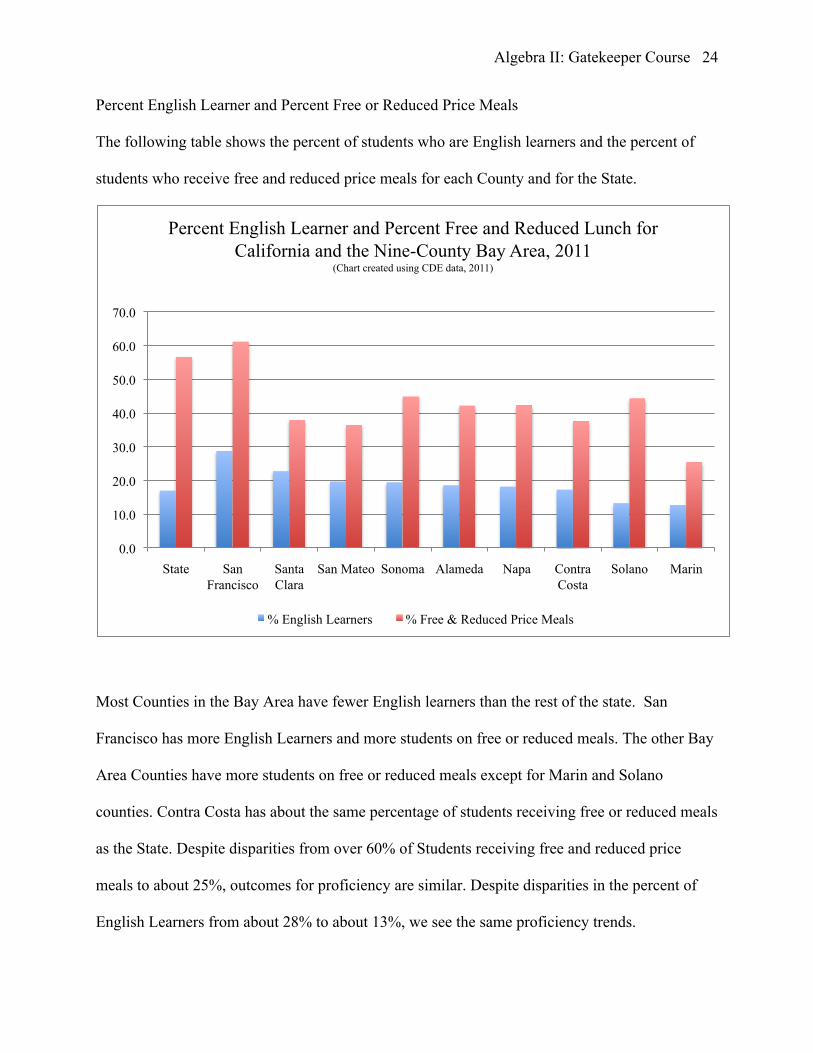
Algebra II: Gatekeeper Course 24 Percent English Learner and Percent Free or Reduced Price Meals
The following table shows the percent of students who are English learners and the percent of
students who receive free and reduced price meals for each County and for the State.
Most Counties in the Bay Area have fewer English learners than the rest of the state. San
Francisco has more English Learners and more students on free or reduced meals. The other Bay
Area Counties have more students on free or reduced meals except for Marin and Solano
counties. Contra Costa has about the same percentage of students receiving free or reduced meals
as the State. Despite disparities from over 60% of Students receiving free and reduced price
meals to about 25%, outcomes for proficiency are similar. Despite disparities in the percent of
English Learners from about 28% to about 13%, we see the same proficiency trends.
0.0
10.0
20.0
30.0
40.0
50.0
60.0
70.0
State San Francisco
Santa Clara
San Mateo Sonoma Alameda Napa Contra Costa
Solano Marin
Percent English Learner and Percent Free and Reduced Lunch for California and the Nine-County Bay Area, 2011
(Chart created using CDE data, 2011)
% English Learners % Free & Reduced Price Meals

Algebra II: Gatekeeper Course 25 Graduation and Drop-out Rates
The State’s drop-out rate is about 18%. Marin has the lowest drop-out rate in the 9-County Bay
area region and Solano has the highest in the region, though only slightly higher than the State
average. Most of the 9 Bay area Counties have lower drop-out rates than the State. Most counties
also graduate more students that are UC/CSU eligible than does the State. The two counties that
have a lower rate of UC/CSU eligible students are Solano and Sonoma.
Again, as with the last set of measures, despite the differences in these rates we see
similar proficiency trends for students.
0.0
10.0
20.0
30.0
40.0
50.0
60.0
70.0
State and County Percent UC/CSU Eligible at Graduation and 4-Year Drop Out Rates, 2010
(Chart created using CDE data, 2010)
Percent of Graduates that are UC/CSU Eligible 4 Yr Drop Rate
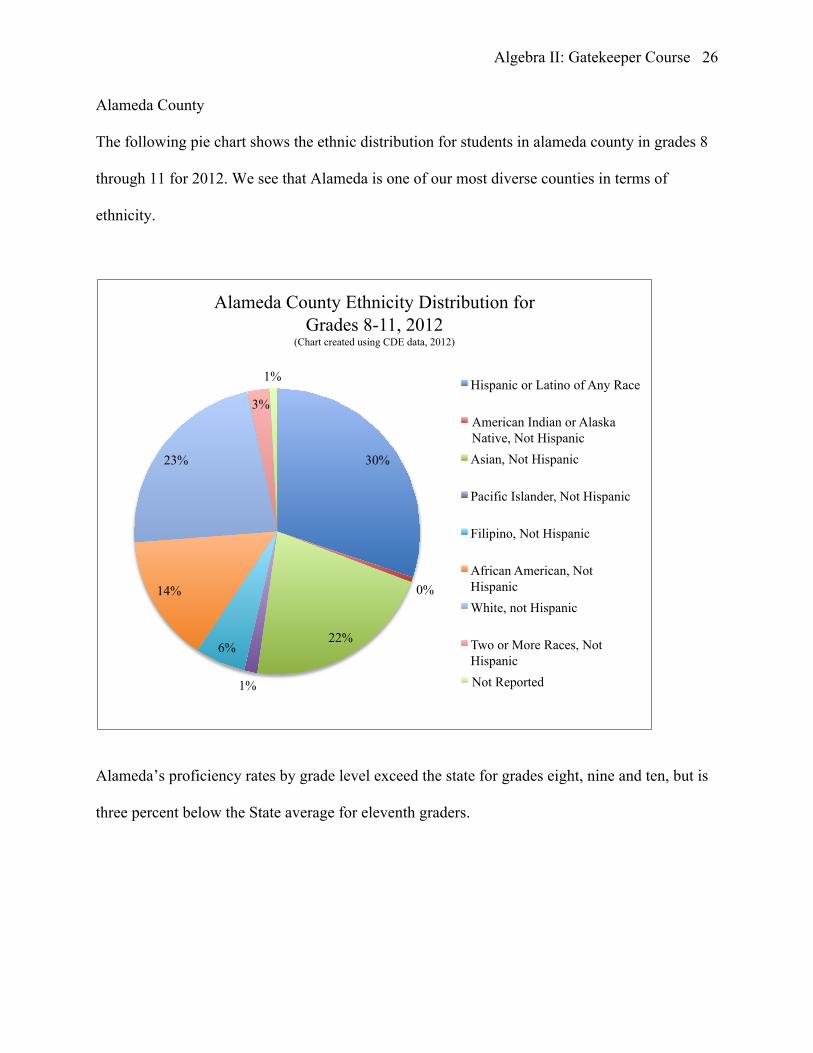
Algebra II: Gatekeeper Course 26 Alameda County
The following pie chart shows the ethnic distribution for students in alameda county in grades 8
through 11 for 2012. We see that Alameda is one of our most diverse counties in terms of
ethnicity.
Alameda’s proficiency rates by grade level exceed the state for grades eight, nine and ten, but is
three percent below the State average for eleventh graders.
30%
0%
22%
1%
6%
14%
23%
3%
1%
Alameda County Ethnicity Distribution for Grades 8-11, 2012
(Chart created using CDE data, 2012)
Hispanic or Latino of Any Race
American Indian or Alaska Native, Not Hispanic Asian, Not Hispanic
Pacific Islander, Not Hispanic
Filipino, Not Hispanic
African American, Not Hispanic White, not Hispanic
Two or More Races, Not Hispanic Not Reported
Algebra II: Gatekeeper Course 27
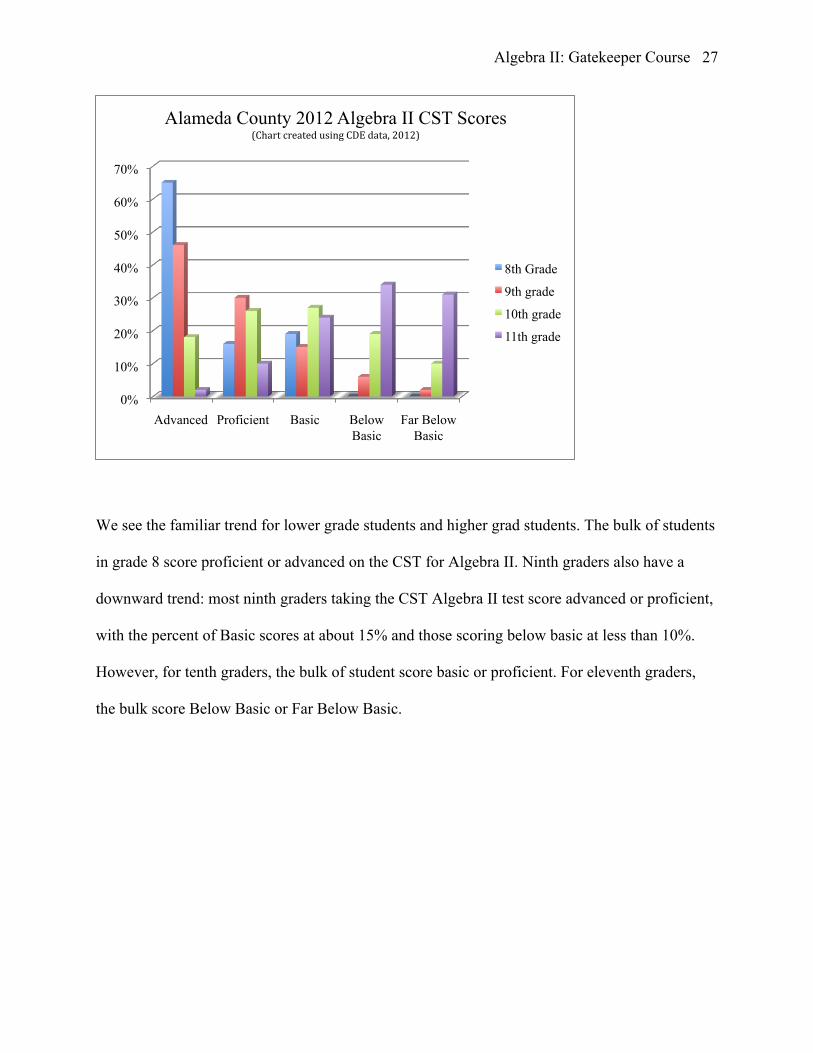
We see the familiar trend for lower grade students and higher grad students. The bulk of students
in grade 8 score proficient or advanced on the CST for Algebra II. Ninth graders also have a
downward trend: most ninth graders taking the CST Algebra II test score advanced or proficient,
with the percent of Basic scores at about 15% and those scoring below basic at less than 10%.
However, for tenth graders, the bulk of student score basic or proficient. For eleventh graders,
the bulk score Below Basic or Far Below Basic.
0%
10%
20%
30%
40%
50%
60%
70%
Advanced Proficient Basic Below Basic
Far Below Basic
Alameda County 2012 Algebra II CST Scores (Chart created using CDE data, 2012)
8th Grade
9th grade
10th grade
11th grade
Algebra II: Gatekeeper Course 28 Contra Costa County
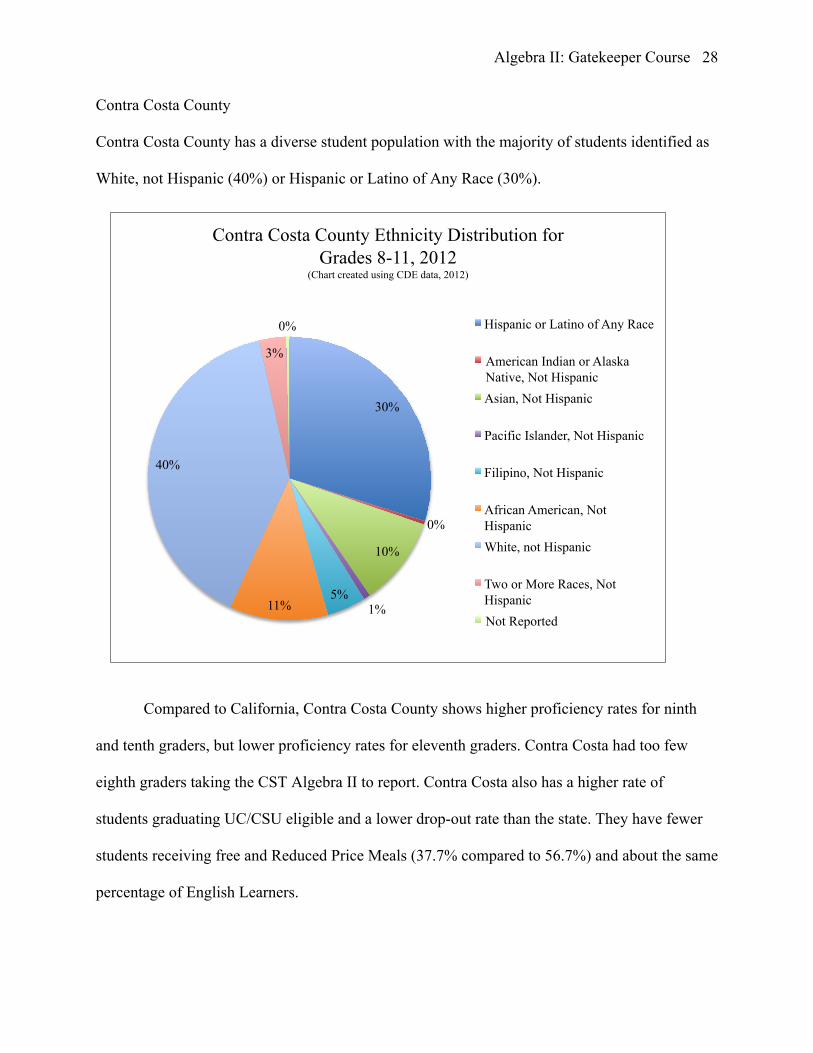
Contra Costa County has a diverse student population with the majority of students identified as
White, not Hispanic (40%) or Hispanic or Latino of Any Race (30%).
Compared to California, Contra Costa County shows higher proficiency rates for ninth
and tenth graders, but lower proficiency rates for eleventh graders. Contra Costa had too few
eighth graders taking the CST Algebra II to report. Contra Costa also has a higher rate of
students graduating UC/CSU eligible and a lower drop-out rate than the state. They have fewer
students receiving free and Reduced Price Meals (37.7% compared to 56.7%) and about the same
percentage of English Learners.
30%
0%
10%
1% 5%
11%
40%
3%
0%
Contra Costa County Ethnicity Distribution for Grades 8-11, 2012
(Chart created using CDE data, 2012)
Hispanic or Latino of Any Race
American Indian or Alaska Native, Not Hispanic Asian, Not Hispanic
Pacific Islander, Not Hispanic
Filipino, Not Hispanic
African American, Not Hispanic White, not Hispanic
Two or More Races, Not Hispanic Not Reported
Algebra II: Gatekeeper Course 29
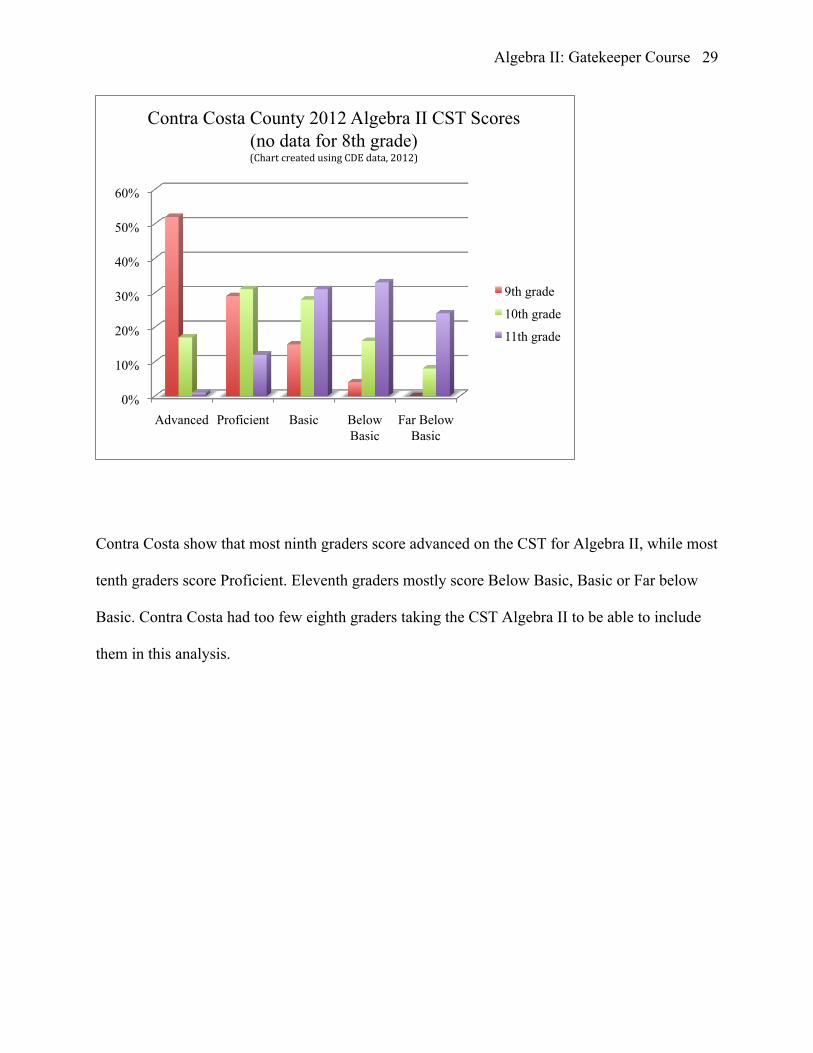
Contra Costa show that most ninth graders score advanced on the CST for Algebra II, while most
tenth graders score Proficient. Eleventh graders mostly score Below Basic, Basic or Far below
Basic. Contra Costa had too few eighth graders taking the CST Algebra II to be able to include
them in this analysis.
0%
10%
20%
30%
40%
50%
60%
Advanced Proficient Basic Below Basic
Far Below Basic
Contra Costa County 2012 Algebra II CST Scores (no data for 8th grade) (Chart created using CDE data, 2012)
9th grade
10th grade
11th grade
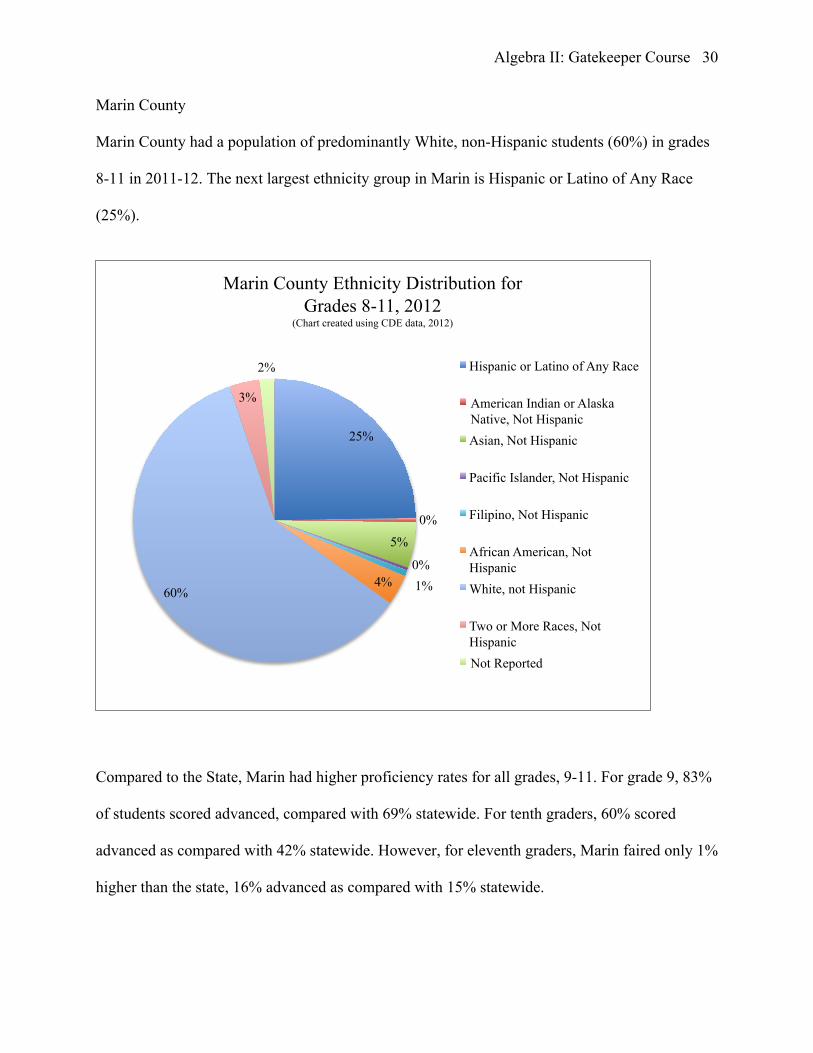
Algebra II: Gatekeeper Course 30 Marin County
Marin County had a population of predominantly White, non-Hispanic students (60%) in grades
8-11 in 2011-12. The next largest ethnicity group in Marin is Hispanic or Latino of Any Race
(25%).
Compared to the State, Marin had higher proficiency rates for all grades, 9-11. For grade 9, 83%
of students scored advanced, compared with 69% statewide. For tenth graders, 60% scored
advanced as compared with 42% statewide. However, for eleventh graders, Marin faired only 1%
higher than the state, 16% advanced as compared with 15% statewide.
25%
0%
5%
0% 1% 4%
60%
3%
2%
Marin County Ethnicity Distribution for Grades 8-11, 2012
(Chart created using CDE data, 2012)
Hispanic or Latino of Any Race
American Indian or Alaska Native, Not Hispanic Asian, Not Hispanic
Pacific Islander, Not Hispanic
Filipino, Not Hispanic
African American, Not Hispanic White, not Hispanic
Two or More Races, Not Hispanic Not Reported
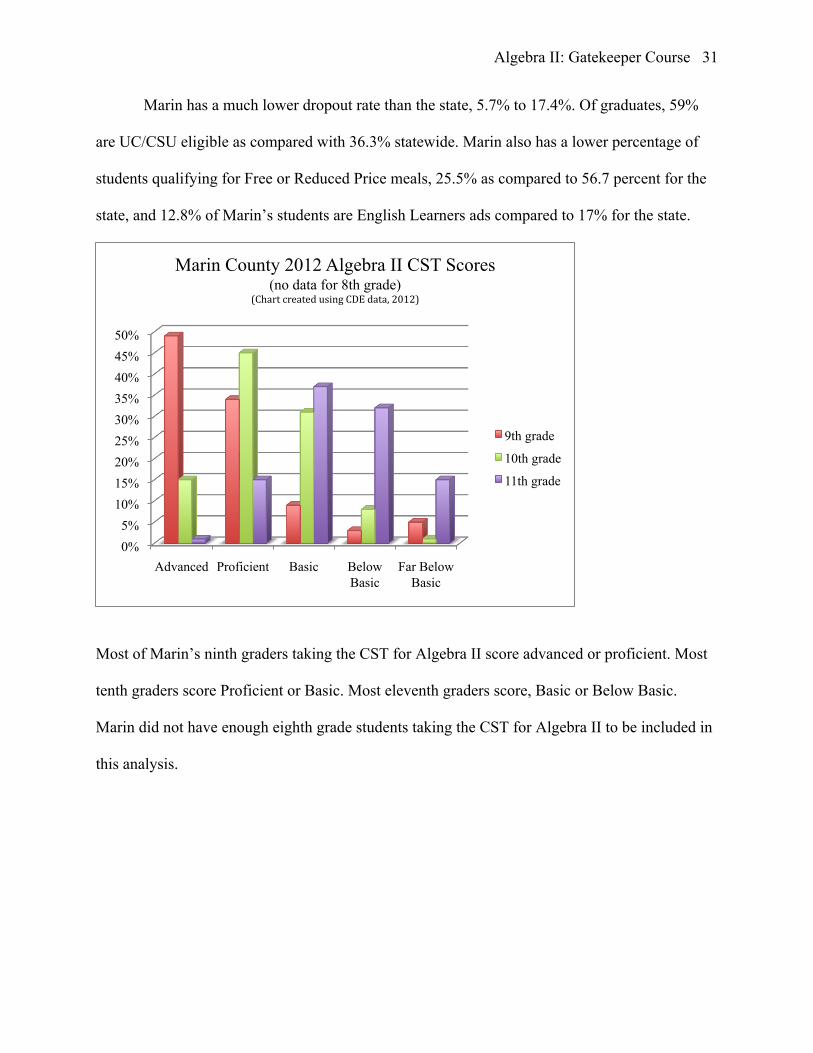
Algebra II: Gatekeeper Course 31 Marin has a much lower dropout rate than the state, 5.7% to 17.4%. Of graduates, 59%
are UC/CSU eligible as compared with 36.3% statewide. Marin also has a lower percentage of
students qualifying for Free or Reduced Price meals, 25.5% as compared to 56.7 percent for the
state, and 12.8% of Marin’s students are English Learners ads compared to 17% for the state.
Most of Marin’s ninth graders taking the CST for Algebra II score advanced or proficient. Most
tenth graders score Proficient or Basic. Most eleventh graders score, Basic or Below Basic.
Marin did not have enough eighth grade students taking the CST for Algebra II to be included in
this analysis.
0% 5%
10% 15% 20% 25% 30% 35% 40% 45% 50%
Advanced Proficient Basic Below Basic
Far Below Basic
Marin County 2012 Algebra II CST Scores (no data for 8th grade)
(Chart created using CDE data, 2012)
9th grade
10th grade
11th grade
Algebra II: Gatekeeper Course 32
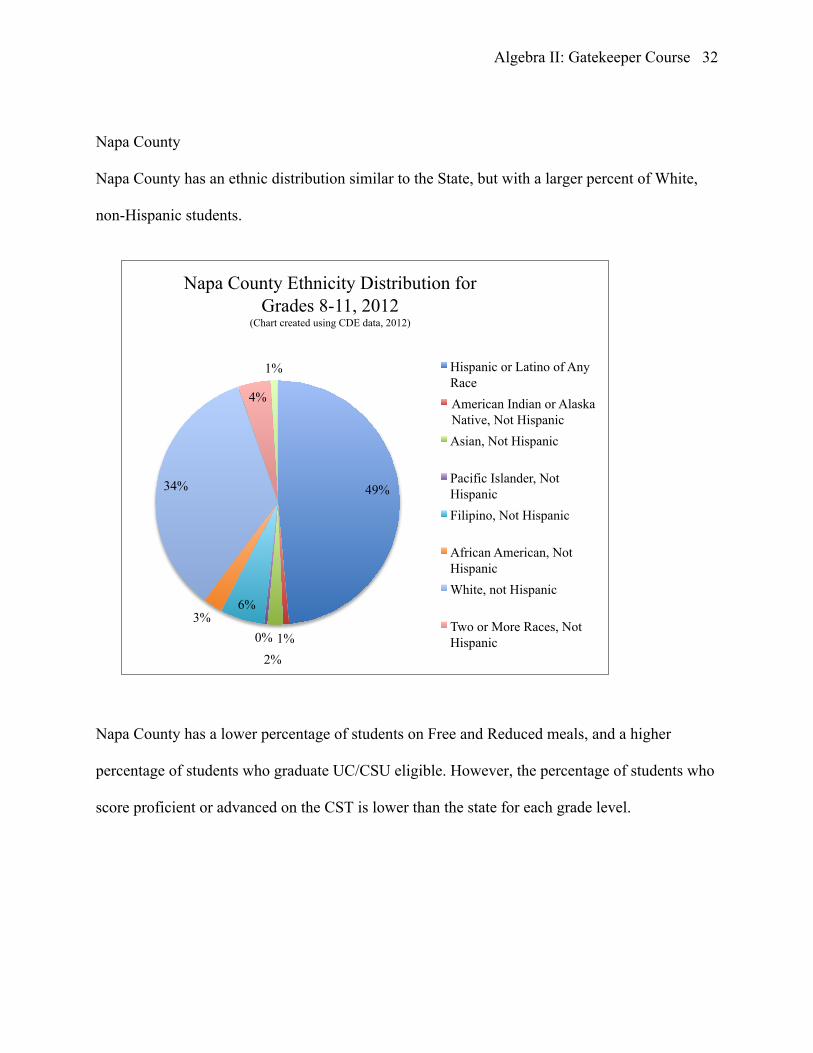
Napa County
Napa County has an ethnic distribution similar to the State, but with a larger percent of White,
non-Hispanic students.
Napa County has a lower percentage of students on Free and Reduced meals, and a higher
percentage of students who graduate UC/CSU eligible. However, the percentage of students who
score proficient or advanced on the CST is lower than the state for each grade level.
49%
1% 2%
0%
6% 3%
34%
4%
1%
Napa County Ethnicity Distribution for Grades 8-11, 2012
(Chart created using CDE data, 2012)
Hispanic or Latino of Any Race American Indian or Alaska Native, Not Hispanic Asian, Not Hispanic
Pacific Islander, Not Hispanic Filipino, Not Hispanic
African American, Not Hispanic White, not Hispanic
Two or More Races, Not Hispanic
Algebra II: Gatekeeper Course 33
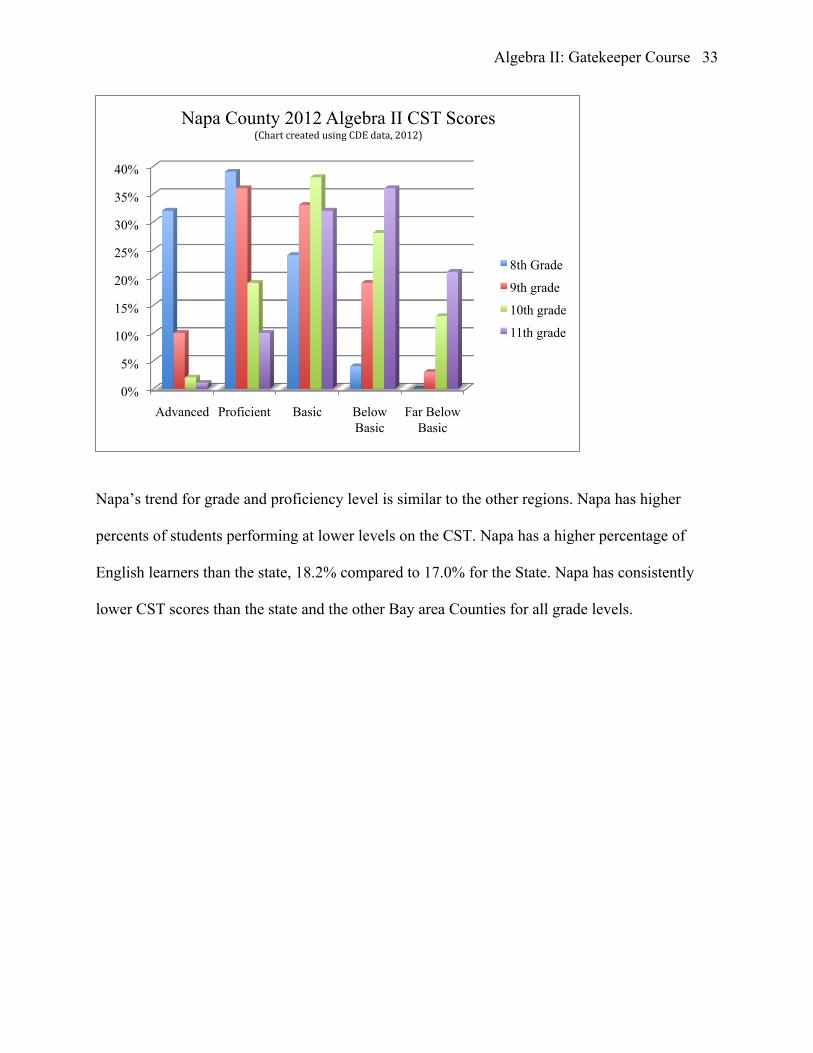
Napa’s trend for grade and proficiency level is similar to the other regions. Napa has higher
percents of students performing at lower levels on the CST. Napa has a higher percentage of
English learners than the state, 18.2% compared to 17.0% for the State. Napa has consistently
lower CST scores than the state and the other Bay area Counties for all grade levels.
0%
5%
10%
15%
20%
25%
30%
35%
40%
Advanced Proficient Basic Below Basic
Far Below Basic
Napa County 2012 Algebra II CST Scores (Chart created using CDE data, 2012)
8th Grade
9th grade
10th grade
11th grade
Algebra II: Gatekeeper Course 34
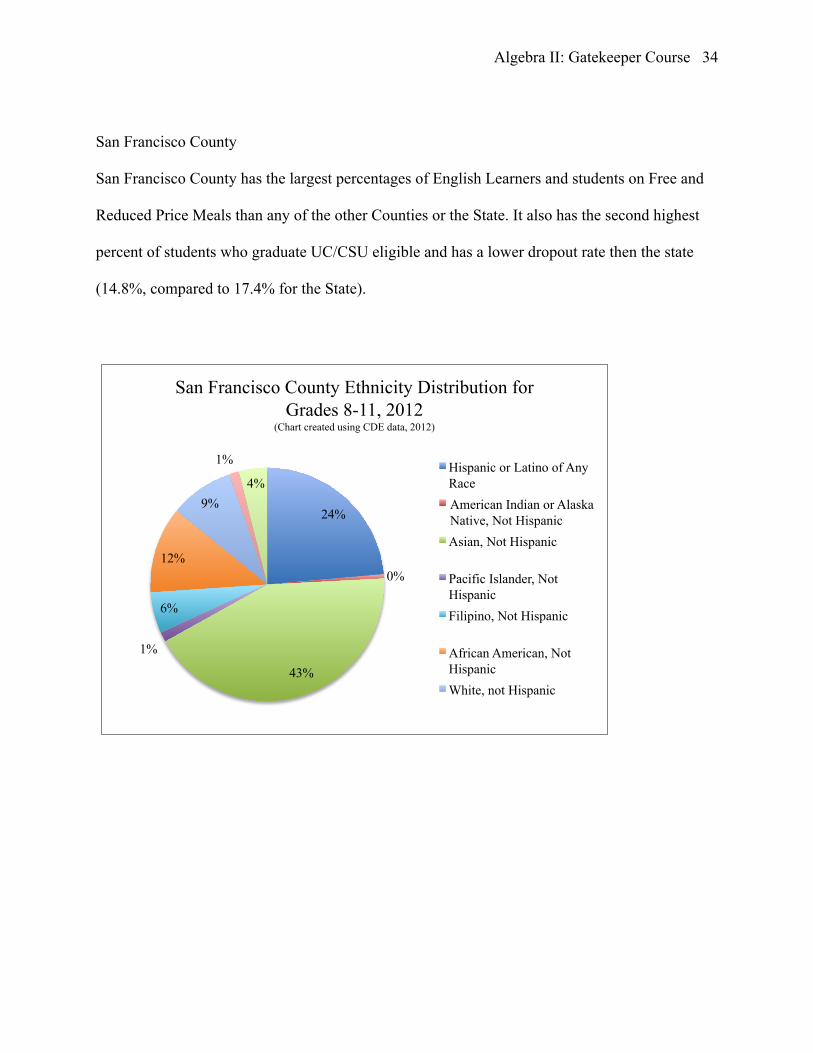
San Francisco County
San Francisco County has the largest percentages of English Learners and students on Free and
Reduced Price Meals than any of the other Counties or the State. It also has the second highest
percent of students who graduate UC/CSU eligible and has a lower dropout rate then the state
(14.8%, compared to 17.4% for the State).
24%
0%
43%
1%
6%
12%
9%
1%
4%
San Francisco County Ethnicity Distribution for Grades 8-11, 2012
(Chart created using CDE data, 2012)
Hispanic or Latino of Any Race American Indian or Alaska Native, Not Hispanic Asian, Not Hispanic
Pacific Islander, Not Hispanic Filipino, Not Hispanic
African American, Not Hispanic White, not Hispanic
Algebra II: Gatekeeper Course 35
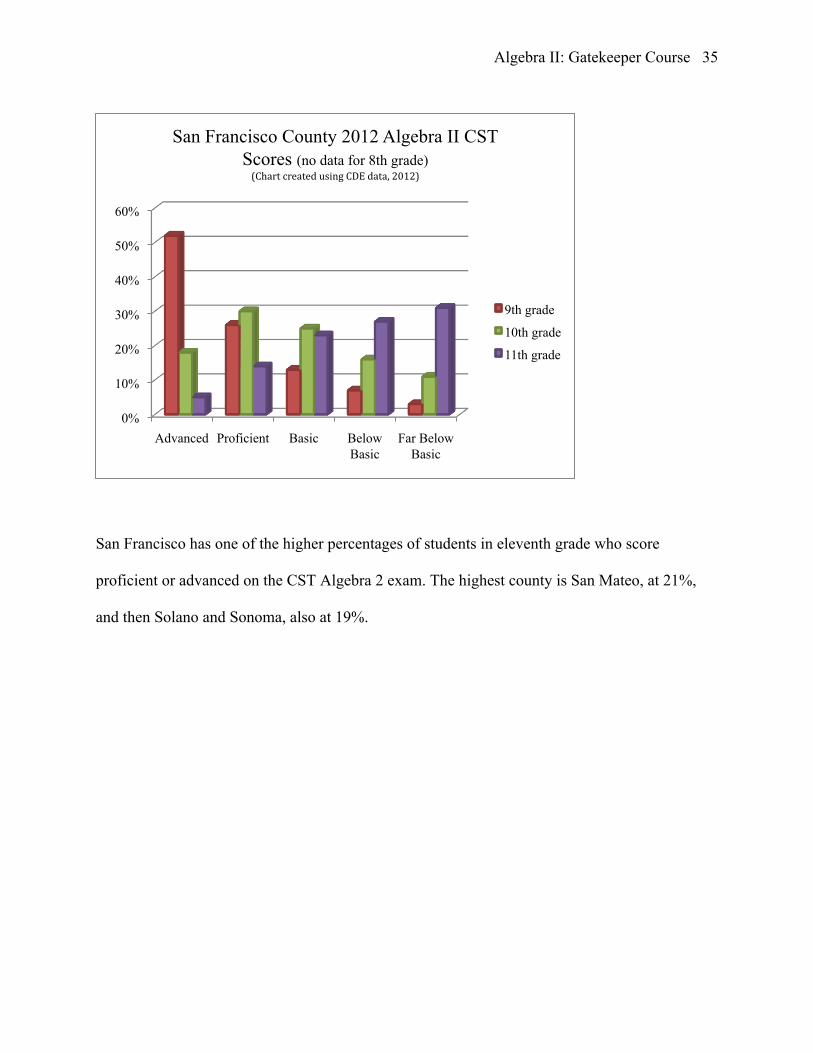
San Francisco has one of the higher percentages of students in eleventh grade who score
proficient or advanced on the CST Algebra 2 exam. The highest county is San Mateo, at 21%,
and then Solano and Sonoma, also at 19%.
0%
10%
20%
30%
40%
50%
60%
Advanced Proficient Basic Below Basic
Far Below Basic
San Francisco County 2012 Algebra II CST Scores (no data for 8th grade) (Chart created using CDE data, 2012)
9th grade
10th grade
11th grade
Algebra II: Gatekeeper Course 36
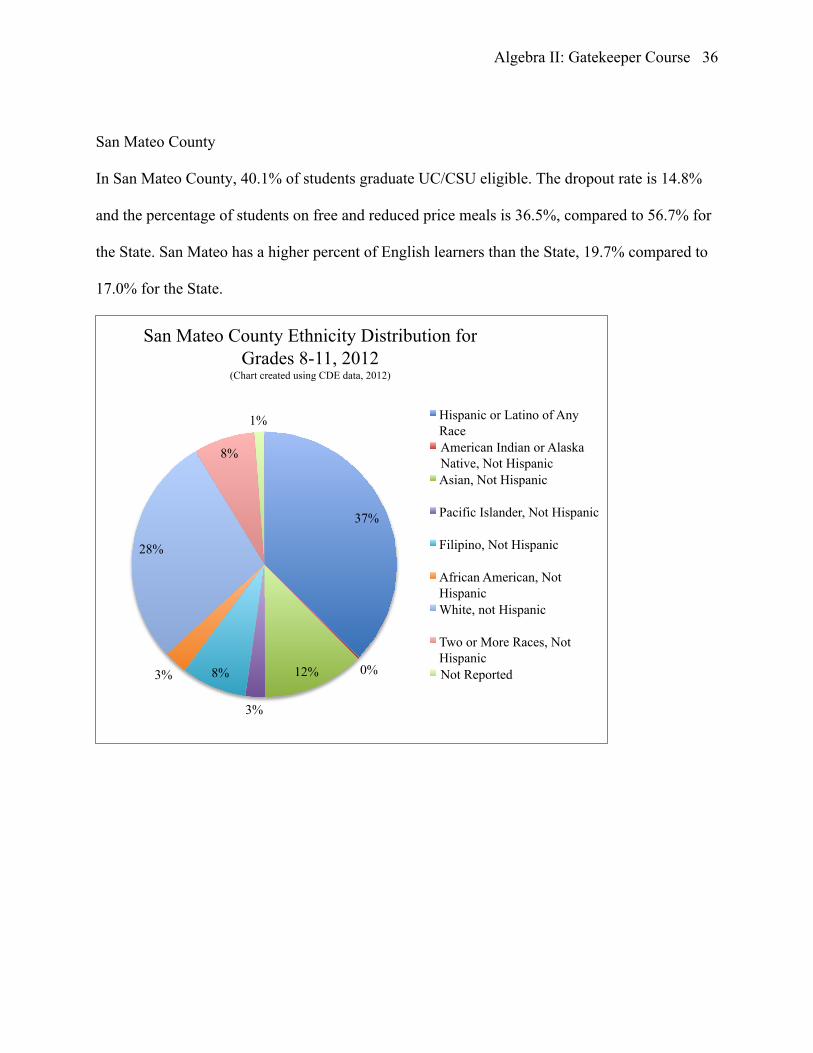
San Mateo County
In San Mateo County, 40.1% of students graduate UC/CSU eligible. The dropout rate is 14.8%
and the percentage of students on free and reduced price meals is 36.5%, compared to 56.7% for
the State. San Mateo has a higher percent of English learners than the State, 19.7% compared to
17.0% for the State.
37%
0% 12%
3%
8% 3%
28%
8%
1%
San Mateo County Ethnicity Distribution for Grades 8-11, 2012
(Chart created using CDE data, 2012)
Hispanic or Latino of Any Race American Indian or Alaska Native, Not Hispanic Asian, Not Hispanic
Pacific Islander, Not Hispanic
Filipino, Not Hispanic
African American, Not Hispanic White, not Hispanic
Two or More Races, Not Hispanic Not Reported
Algebra II: Gatekeeper Course 37
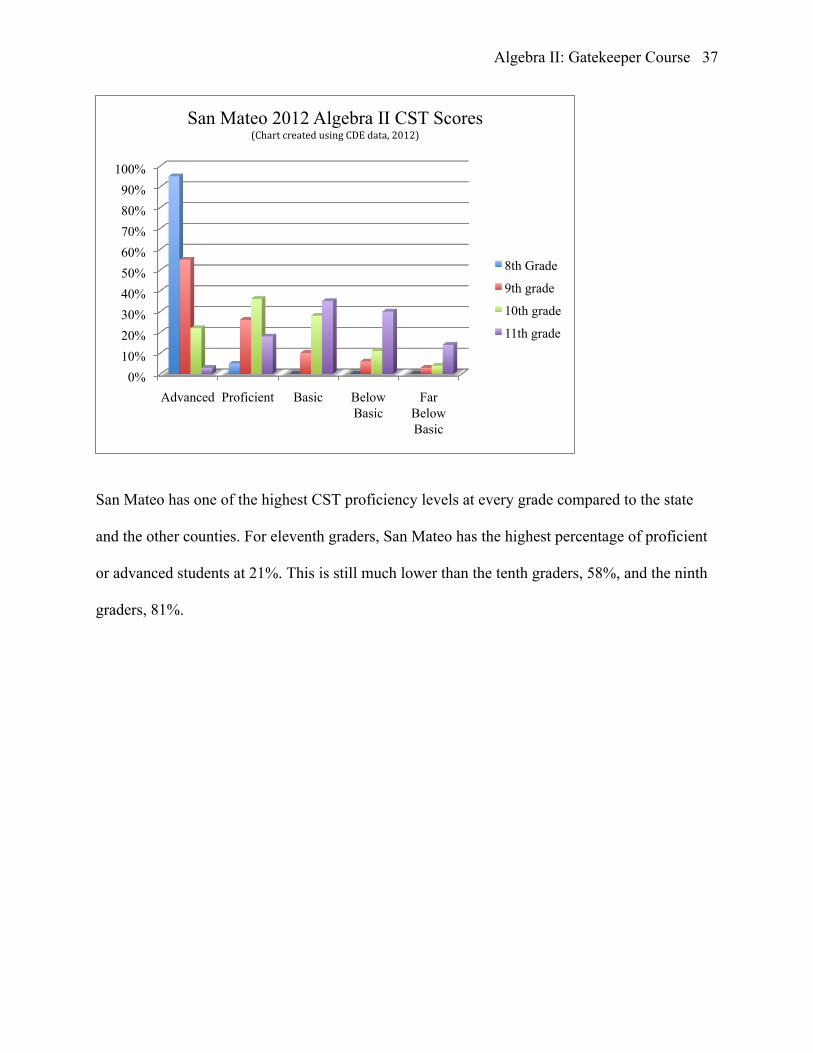
San Mateo has one of the highest CST proficiency levels at every grade compared to the state
and the other counties. For eleventh graders, San Mateo has the highest percentage of proficient
or advanced students at 21%. This is still much lower than the tenth graders, 58%, and the ninth
graders, 81%.
0% 10% 20% 30% 40% 50% 60% 70% 80% 90%
100%
Advanced Proficient Basic Below Basic
Far Below Basic
San Mateo 2012 Algebra II CST Scores (Chart created using CDE data, 2012)
8th Grade
9th grade
10th grade
11th grade
Algebra II: Gatekeeper Course 38
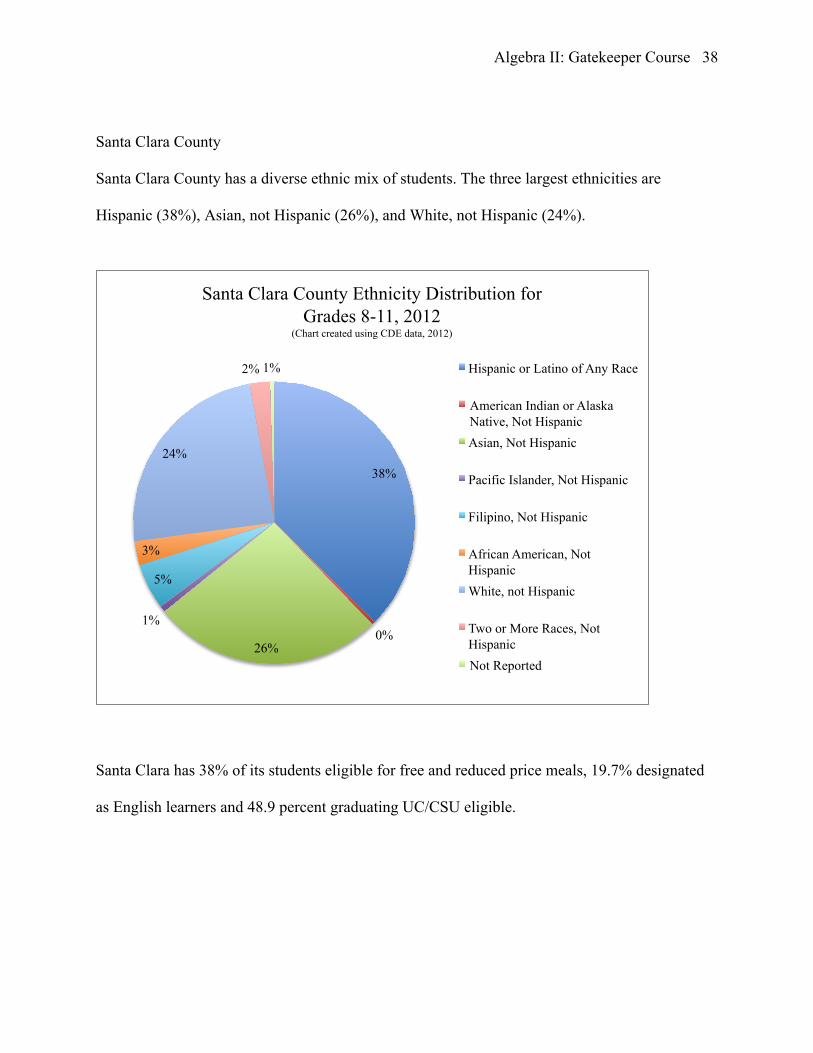
Santa Clara County
Santa Clara County has a diverse ethnic mix of students. The three largest ethnicities are
Hispanic (38%), Asian, not Hispanic (26%), and White, not Hispanic (24%).
Santa Clara has 38% of its students eligible for free and reduced price meals, 19.7% designated
as English learners and 48.9 percent graduating UC/CSU eligible.
38%
0% 26%
1%
5%
3%
24%
2% 1%
Santa Clara County Ethnicity Distribution for Grades 8-11, 2012
(Chart created using CDE data, 2012)
Hispanic or Latino of Any Race
American Indian or Alaska Native, Not Hispanic Asian, Not Hispanic
Pacific Islander, Not Hispanic
Filipino, Not Hispanic
African American, Not Hispanic White, not Hispanic
Two or More Races, Not Hispanic Not Reported
Algebra II: Gatekeeper Course 39
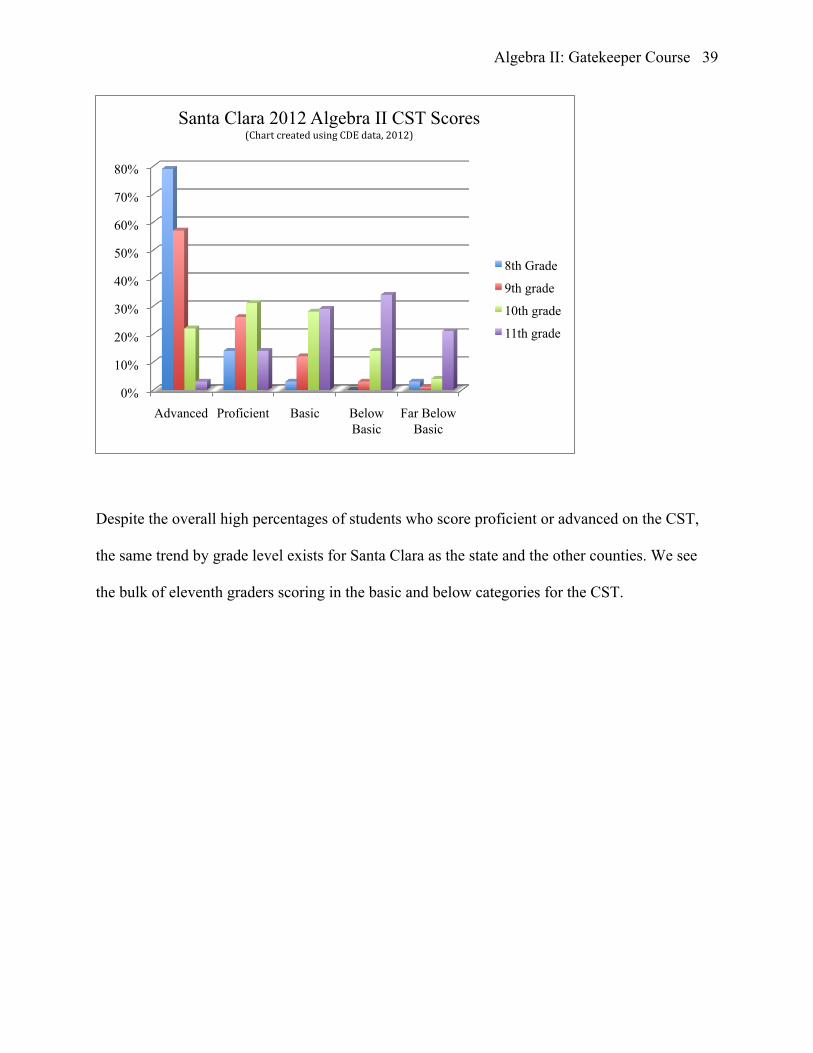
Despite the overall high percentages of students who score proficient or advanced on the CST,
the same trend by grade level exists for Santa Clara as the state and the other counties. We see
the bulk of eleventh graders scoring in the basic and below categories for the CST.
0%
10%
20%
30%
40%
50%
60%
70%
80%
Advanced Proficient Basic Below Basic
Far Below Basic
Santa Clara 2012 Algebra II CST Scores (Chart created using CDE data, 2012)
8th Grade
9th grade
10th grade
11th grade
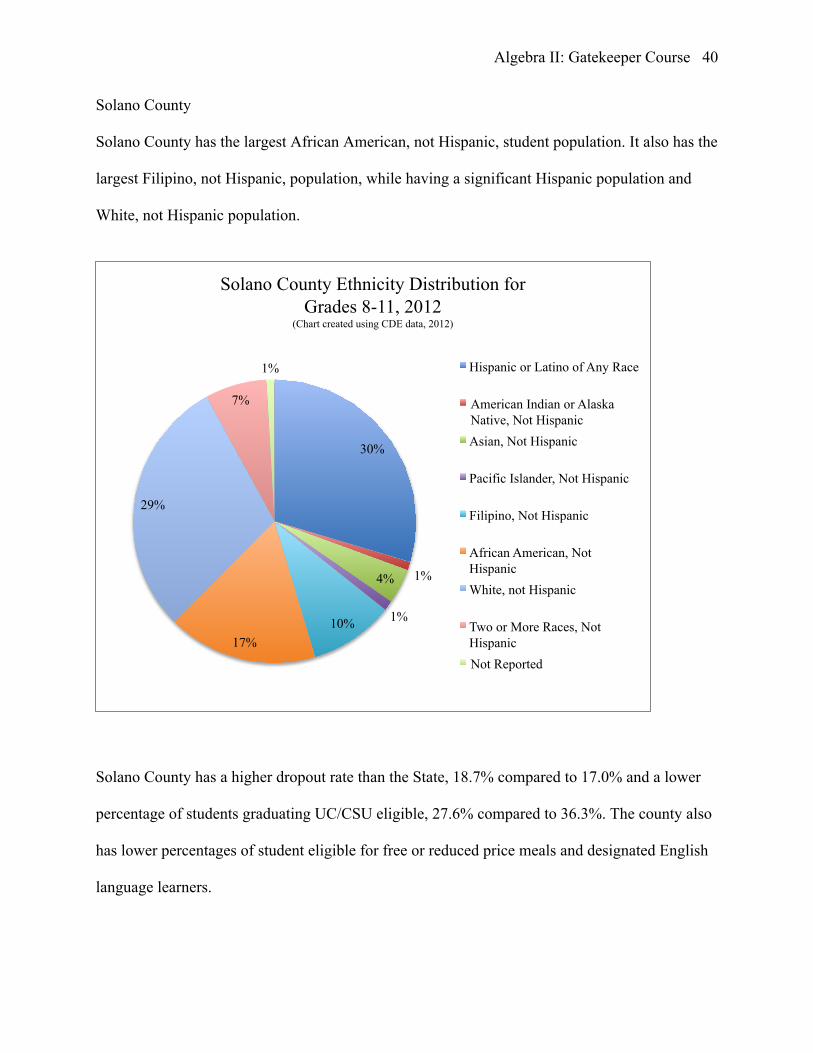
Algebra II: Gatekeeper Course 40 Solano County
Solano County has the largest African American, not Hispanic, student population. It also has the
largest Filipino, not Hispanic, population, while having a significant Hispanic population and
White, not Hispanic population.
Solano County has a higher dropout rate than the State, 18.7% compared to 17.0% and a lower
percentage of students graduating UC/CSU eligible, 27.6% compared to 36.3%. The county also
has lower percentages of student eligible for free or reduced price meals and designated English
language learners.
30%
1% 4%
1% 10% 17%
29%
7%
1%
Solano County Ethnicity Distribution for Grades 8-11, 2012
(Chart created using CDE data, 2012)
Hispanic or Latino of Any Race
American Indian or Alaska Native, Not Hispanic Asian, Not Hispanic
Pacific Islander, Not Hispanic
Filipino, Not Hispanic
African American, Not Hispanic White, not Hispanic
Two or More Races, Not Hispanic Not Reported
Algebra II: Gatekeeper Course 41
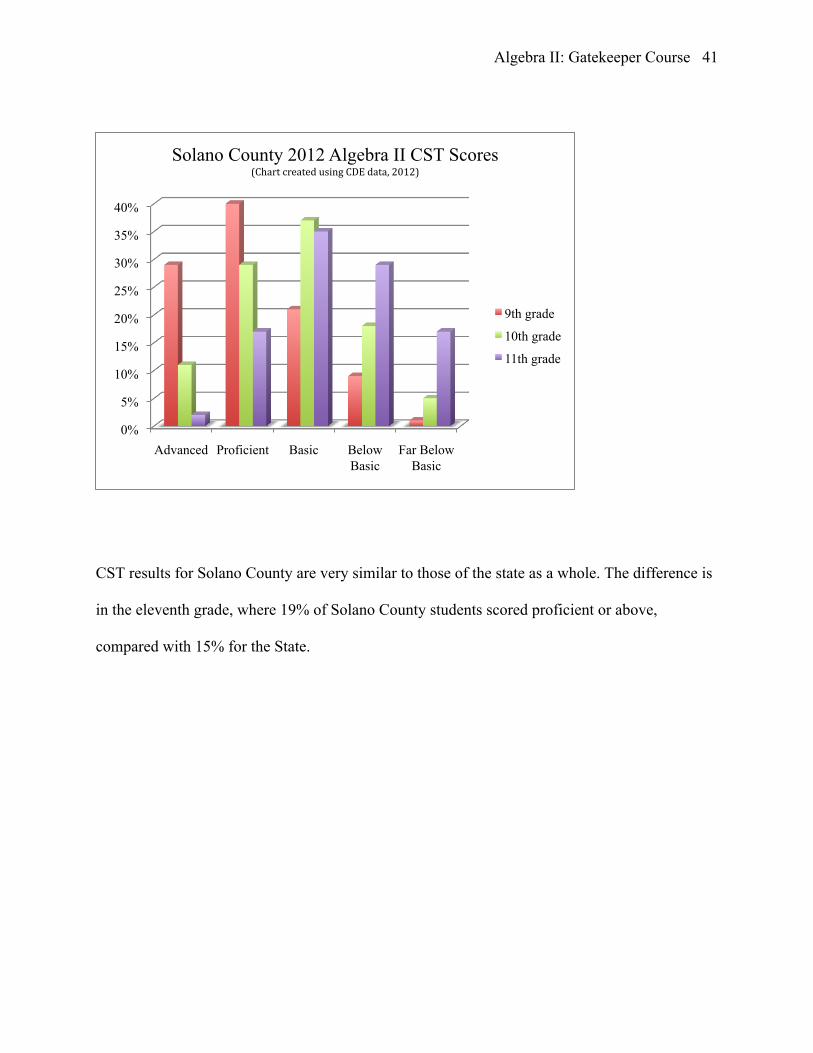
CST results for Solano County are very similar to those of the state as a whole. The difference is
in the eleventh grade, where 19% of Solano County students scored proficient or above,
compared with 15% for the State.
0%
5%
10%
15%
20%
25%
30%
35%
40%
Advanced Proficient Basic Below Basic
Far Below Basic
Solano County 2012 Algebra II CST Scores (Chart created using CDE data, 2012)
9th grade
10th grade
11th grade

Algebra II: Gatekeeper Course 42 Sonoma County
Sonoma County has a largely White, not Hispanic, student population. It also has a large
Hispanic population. These two ethnicities constitute 88% of students.
Sonoma County has a higher percentage of English Learners than the State, 19.5% compared to
17.0%, and a higher percentage lower percentage of students eligible for free and reduced price
lunch than the state, 44.9% compared to 56.7% for the state. Sonoma has a lower dropout rate,
16.75 compared to 17.4% and a lower percentage of students graduating UC/CSU eligible,
27.4% compared to 36.3% for the State.
37%
1% 4%
0% 1% 2%
51%
3%
1%
Sonoma County Ethnicity Distribution for Grades 8-11, 2012
(Chart created using CDE data, 2012)
Hispanic or Latino of Any Race
American Indian or Alaska Native, Not Hispanic Asian, Not Hispanic
Pacific Islander, Not Hispanic
Filipino, Not Hispanic
African American, Not Hispanic White, not Hispanic
Two or More Races, Not Hispanic Not Reported
Algebra II: Gatekeeper Course 43
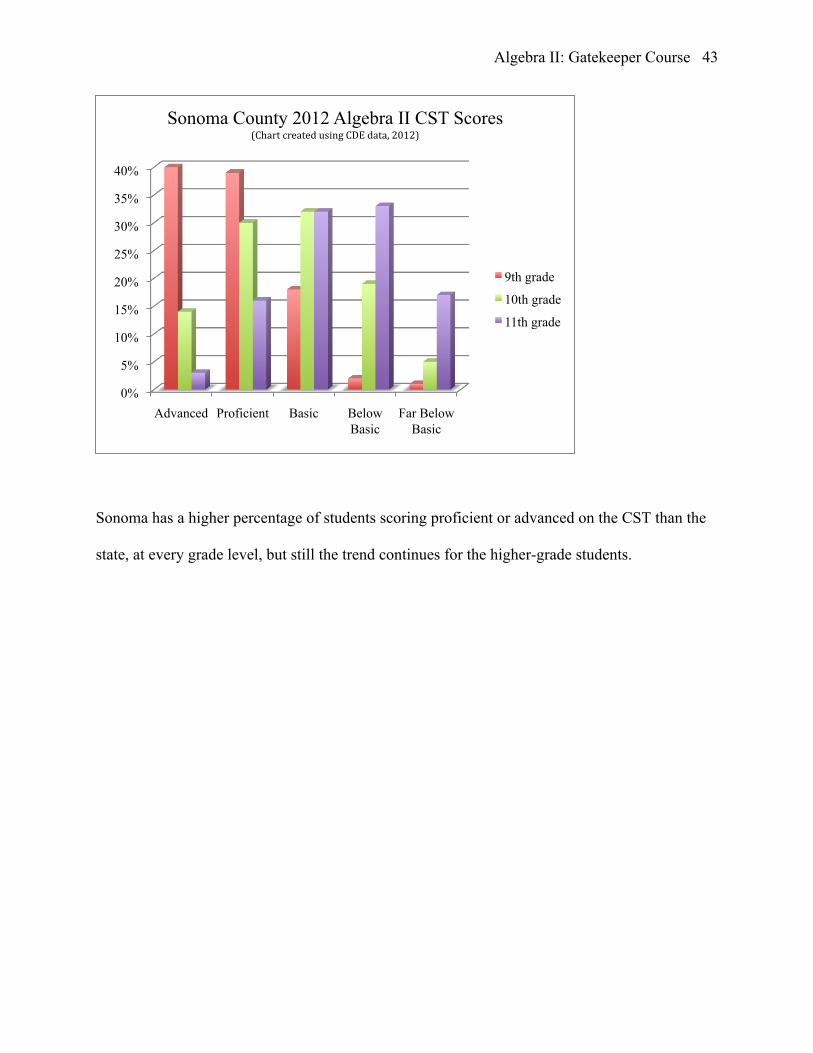
Sonoma has a higher percentage of students scoring proficient or advanced on the CST than the
state, at every grade level, but still the trend continues for the higher-grade students.
0%
5%
10%
15%
20%
25%
30%
35%
40%
Advanced Proficient Basic Below Basic
Far Below Basic
Sonoma County 2012 Algebra II CST Scores (Chart created using CDE data, 2012)
9th grade
10th grade
11th grade
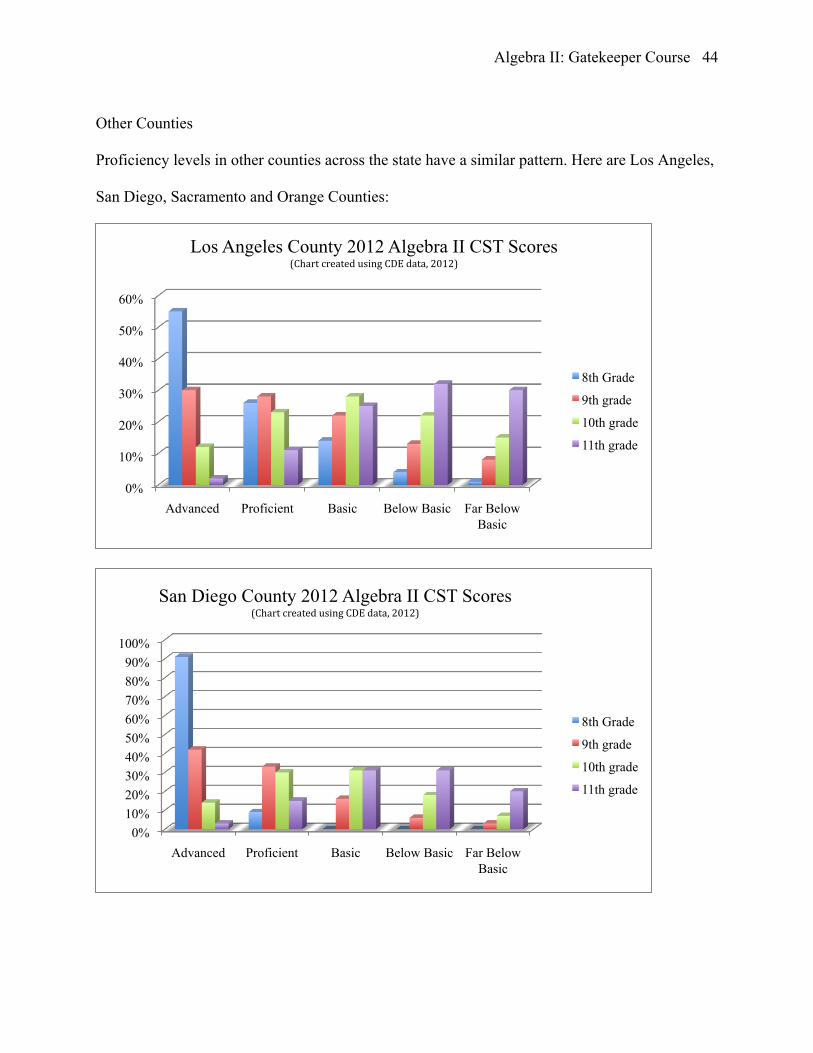
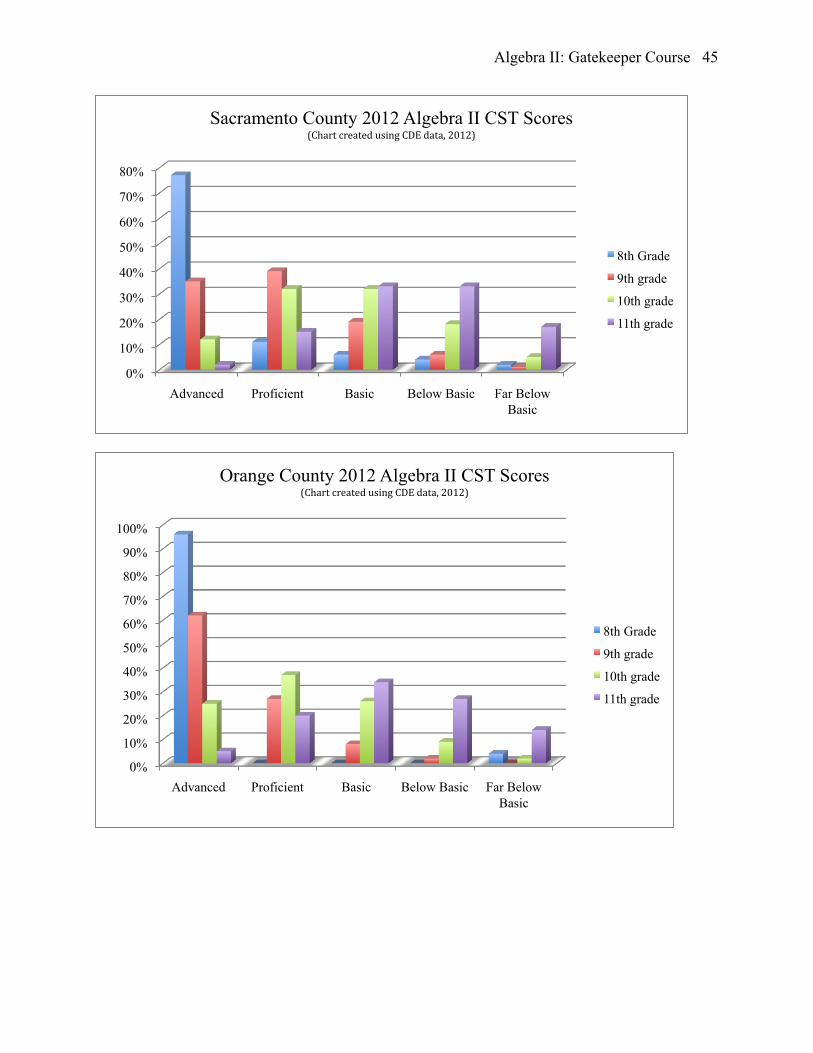
Algebra II: Gatekeeper Course 44 Other Counties
Proficiency levels in other counties across the state have a similar pattern. Here are Los Angeles,
San Diego, Sacramento and Orange Counties:
0%
10%
20%
30%
40%
50%
60%
Advanced Proficient Basic Below Basic Far Below Basic
Los Angeles County 2012 Algebra II CST Scores (Chart created using CDE data, 2012)
8th Grade
9th grade
10th grade
11th grade
0% 10% 20% 30% 40% 50% 60% 70% 80% 90%
100%
Advanced Proficient Basic Below Basic Far Below Basic
San Diego County 2012 Algebra II CST Scores (Chart created using CDE data, 2012)
8th Grade
9th grade
10th grade
11th grade
Algebra II: Gatekeeper Course 45
0%
10%
20%
30%
40%
50%
60%
70%
80%
Advanced Proficient Basic Below Basic Far Below Basic
Sacramento County 2012 Algebra II CST Scores (Chart created using CDE data, 2012)
8th Grade
9th grade
10th grade
11th grade
0%
10%
20%
30%
40%
50%
60%
70%
80%
90%
100%
Advanced Proficient Basic Below Basic Far Below Basic
Orange County 2012 Algebra II CST Scores (Chart created using CDE data, 2012)
8th Grade
9th grade
10th grade
11th grade
Algebra II: Gatekeeper Course 46
Chapter 5 Discussion
The findings for the State and the nine Bay Area Counties suggest that the earlier a student takes
Algebra II, the more successful they are on the CST Algebra II exam. This should not be a call to
get students to take math classes earlier. However, considering the high rates of low proficiency
by older students, particularly eleventh graders, it seems an examination of our approach to the
course is called for. Why is there such a large discrepancy in proficiency rates amongst students
at different grade levels? There is certainly something to different math aptitudes amongst
students, just as there are for all topics and skills. However, these drop-offs by grade level do not
occur in the English Language Arts CSTs. So what is going on with Algebra II?
This trend seems very strong despite differences in the student make-up of each county.
Do eleventh, and presumably twelfth grade students need a different approach to mastering the
Algebra II curriculum? Are there specific traits these students share that suggest a different
approach to curriculum delivery? If so, what would that be? Perhaps narrowing curriculum in
terms of fewer topics or an increase in instructional minutes? Place emphasis on applied
problems and relationships, as described in the Japanese school example from The Teaching
Gap? Increased technological learning tools, such as calculators, excel, online learning?
Teaching techniques that are different? It is assumed that there are already a variety of teaching
techniques being used by a number of teachers. However, the overall results for students show a
strong pattern of mastery for earlier grades and non-mastery for later grades.
It would be interesting to see if these students do better with regular access to calculators.
I think many teachers do not use them much because of an ingrained focus on skill and
procedure development and memorization. The newly adopted Common Core standards seem to
be an attempt to have the math make sense and expand critical thinking skills while increasing
Algebra II: Gatekeeper Course 47 the use of technology. It seems there is an increased emphasis in modeling situations with
mathematical models. Will this emphasis help to create connections for these students?
Instead of emphasizing background skills in the first months of school, should teachers
just start teaching at a high level expecting students to be prepared? One advantage to this
approach would be more time to learn new topics. One disadvantage is that students may have
forgotten their pre-requisite skills. Could a ‘refresher course’ be offered after school or in the two
weeks before school starts? Perhaps a district or school team could develop an online option for
students. The students could be responsible for ‘boning up’ on the pre-requisite skills and
perhaps take an assessment in the first few days of school. Students in need of background
material refreshing could be put into intervention right away. Perhaps the new standards will
help to address this because more algebra and statistics will be emphasized in the traditional
geometry year.
We are sitting on the eve of change in mathematics education. There will surely be
teachers who are slow to embrace and execute the changes. There will be others who dive in,
who will learn by doing and revise their approach from unit to unit and year to year.
Currently, there is a growing community of educators who are trying to adopt a flipped
teaching model where students are exposed to new concepts before coming to class. This
approach may help students have time to digest the information before they meet with the
teacher to do problem solving. Websites such as that created by Salmon Khan are excellent
resources for students to learn new and forgotten concepts. Students can view videos for free,
repeat sections they need to hear again and go to class feeling more prepared.
The proficiency data strongly suggests that older students may require a different
approach than younger students. Despite differences in ethnicity, socioeconomic status, dropout
Algebra II: Gatekeeper Course 48 rates and graduation rates in the nine counties and the state, outcomes were very consistent. Even
the top proficiency group, San Mateo County, reached a proficiency rate of only 21% for their
juniors.
What can school districts do? Examine your grades and proficiency rates on CST exams.
Are they correlated? Look at your older students at each high school in your district. Are there
differences in proficiency rates? Open a discussion with your faculty. Discuss your proficiency
rates and grade levels and grade distributions for each school and grade.
What can schools do? Schools can look at their repeat rates for Algebra II. Look at D and
F grades by grade level. How do you decide whether a student is successful? Can you look at
those success measures by grade level? Can you design programming to allow for different
grades into different sections of Algebra II if you see differenced in success rates by grade level?
What can teachers do? Teachers can be very aware of who their older students are. Be
aware they may not ask questions and may give the impression they do not need help. If they are
not asking questions, be sure to check in with them as you circulate during practice times.
Partner them with a stronger student who is close in age. Recognize your core learning outcomes
desired for students and clearly articulate those. Stay in contact with parents and counselors of
these students if you start to see warning signs. Warning signs are lack of homework completion,
low test scores, a sudden dip in either of the above. Those dips will be hard for these students to
recover from. Give frequent feedback to struggling students. The feedback should be specific to
their stopping points in problem solving. Are they getting stuck when a problem turns to a
fractional computation? Have a study guide ready for that. So many publishers provide these
supplementary materials with the text, that you could probably find something without too much
searching. Recognize that students may not know how to search for these things on their own,
Algebra II: Gatekeeper Course 49 nor might they be able to clearly see what specific skill they need to work on. Recognize these
students may need positive encouragement in the areas where they are successful. Be aware of
all or nothing grading practices on assessments. These students may be more prone to giving up
if they feel like they will be severely penalized by small arithmetic errors.
Notice how long the section for what teachers can do is compared to that for districts and
schools. That is because teachers are on the front line. The problem is right in front of them.
Districts and schools will take longer to respond and act, because they can only deal with the
problem at a few times during the year. Policies will take a long time to change, student
scheduling and programming happens at one main point during the year. Drastic changes to
scheduling can mess with the entire schedule for the school, making changes tough to do.
All of the above suggestions for teachers are well-documented intervention methods that
I have not thought up on my own. Many teachers are already employing some or all of these
measures at one time or another. The situation may call for more substantial changes in content,
pedagogy and definition of a modern mathematics education. I do not suggest throwing out the
bulk of the content, just finding ways to increase accessibility to the curriculum, allowing for
time to explore relationships in algebraic concepts and expand critical thinking skills while
contracting skill and drill, procedure dominated curriculum.
Do schools group all student grade levels in one class? This may have a negative impact
on the older students. They may feel they do not want to ask questions because they are older
and feel they should be ahead of the younger students. I know this to be true for several of my
students in Algebra II. Would grouping freshmen and sophomores in one class and juniors and
seniors in another class allow for better differentiation of curriculum and teaching techniques?
Algebra II: Gatekeeper Course 50 The data clearly show the younger students do better, most likely due to calculation based math
aptitude than to teaching techniques.
In conclusion, there is a cliff that older students fall off of in Algebra II. Students talk
about it, parents talk about it and educators need to talk about it. It is a strange pattern when you
think about how everyone in an Algebra II class has met the pre-requisites, yet your grade level
is correlated with your chance of success. If these students have been held back from taking the
course so they will be successful in the class, why are they not successful?
We need to think about what skills we really expect students to master at this level of
mathematics. What do colleges really need? What are the career and college major choices
students are making when they leave high school? A curriculum focused on expectations of
Calculus success is not serving the student who will not be taking Calculus. If all college majors
required it, it would make sense to keep the course highly rigorous. However, they do not, which
makes you wonder who is monitoring the gate and why.
Algebra II: Gatekeeper Course 51
References
California Department of Education. (2010). Dataquest. Retrieved November 4, 2012, from
http://dg.cde.ca.gov/dataquest
California Department of Education. (2012). 2012 Star test results: Research files. Retrieved
September 1, 2012, from
http://star.cde.ca.gov/star2012/researchFileList.aspx?rf=True&ps=True
Clotfelter, C. T., Ladd, H. F., Vigdor, J. L., and National Bureau of Economic Research. (2012).
The Aftermath of accelerating algebra: Evidence from a district policy initiative.
Cambridge, MA: National Bureau of Economic Research.
Johnson, H. (2010): Higher education in California: New goals for the master plan.
Sacramento, CA: Public Policy Institute of California. Retrieved October 31, 2012, from
http://www.ppoc.org/main/publication.asp?i=916
Rickles, J. H. & White, J.A. (2005), How many high school students satisfy the UC/CSU
eligibility requirements after four years? Planning, Assessment and Research, LAUSD,
Publication No. 280. Retrieved October 31, 2012, from
http://notebook.lausd.net/pls/ptl/docs/page/ca_lausd/fldr_organizations/fldr_plcy_res_dev
/par_division_main/research_unit/publications/policy_reports/ag_cohort_final.pdf
San Diego Unified School District. (2010). Educational opportunity audit report. Retrieved
October 31, 2012, from
http://www.boarddocs.com/ca/sandi/Board.nsf/files/896PB263D7DE/$file/A-
G+audit+Report.pdf
Stigler, J., & Hiebert, J. (2009). The teaching gap: Best ideas from the world’s teachers for
improving education in the classroom. New York: Free Press.